Embed Size (px)
Citation preview

Identifying survival associated morphologicalfeatures of triple negative breast cancer usingmultiple datasetsChao Wang,1,2 Thierry Pécot,3 Debra L Zynger,4 Raghu Machiraju,5
Charles L Shapiro,3,6 Kun Huang1,7
▸ Additional material ispublished online only. To viewplease visit the journal online(http://dx.doi.org/10.1136/amiajnl-2012-001538).1Department of BiomedicalInformatics, The Ohio StateUniversity, Columbus, Ohio, USA2Department of Electrical andComputer Engineering, TheOhio State University,Columbus, Ohio, USA3Comprehensive Cancer Center,The Ohio State University,Columbus, Ohio, USA4Department of Pathology,The Ohio State University,Columbus, Ohio, USA5Department of ComputerScience and Engineering,The Ohio State University,Columbus, Ohio, USA6Division of Medical Oncologyand the Breast Program JamesCancer Hospital, The Ohio StateUniversity, Columbus, Ohio, USA7Biomedical Informatics SharedResource, Comprehensive CancerCenter, The Ohio StateUniversity, Columbus, Ohio, USA
Correspondence toDr Kun Huang,Department of BiomedicalInformatics, The Ohio StateUniversity, Room 218,420 w 12th, Columbus,OH 43210, USA;[email protected]
RM, CLS, and KH are co-seniorauthors with equalcontributions.
Received 2 December 2012Revised 7 March 2013Accepted 18 March 2013Published Online First12 April 2013
To cite: Wang C, Pécot T,Zynger DL, et al. J Am MedInform Assoc 2013;20:680–687.
ABSTRACTBackground and objective Biomarkers for subtypingtriple negative breast cancer (TNBC) are needed giventhe absence of responsive therapy and relatively poorprediction of survival. Morphology of cancer tissues iswidely used in clinical practice for stratifying cancerpatients, while genomic data are highly effective toclassify cancer patients into subgroups. Thus integrationof both morphological and genomic data is a promisingapproach in discovering new biomarkers for canceroutcome prediction. Here we propose a workflow foranalyzing histopathological images and integrate themwith genomic data for discovering biomarkers for TNBC.Materials and methods We developed an imageanalysis workflow for extracting a large collection ofmorphological features and deployed the same onhistological images from The Cancer Genome Atlas(TCGA) TNBC samples during the discovery phase(n=44). Strong correlations between salientmorphological features and gene expression profiles fromthe same patients were identified. We then evaluatedthe same morphological features in predicting survivalusing a local TNBC cohort (n=143). We further testedthe predictive power on patient prognosis of correlatedgene clusters using two other public gene expressiondatasets.Results and conclusion Using TCGA data, weidentified 48 pairs of significantly correlatedmorphological features and gene clusters; fourmorphological features were able to separate the localcohort with significantly different survival outcomes.Gene clusters correlated with these four morphologicalfeatures further proved to be effective in predictingpatient survival using multiple public gene expressiondatasets. These results suggest the efficacy of ourworkflow and demonstrate that integrative analysis holdspromise for discovering biomarkers of complex diseases.
INTRODUCTIONBreast cancer is a highly heterogeneous disease.1 2
During the past half century, several different sub-types of breast cancers have been discovered basedon histological features, specific protein markers,and gene signatures obtained from high throughputand high-content experiments. These subtypespresent diverse clinical outcomes including varyingprognosis and response to treatment.Histological images of tumor tissues play import-
ant roles in breast cancer diagnosis, staging, andprognosis.3 4 Typically, pathologists visually reviewstained slides of breast cancer biopsy samples andassign scores to the detected and prevailing tumors.
During this inspection, cellular composition is oftenassessed semi-quantitatively. This process is costly inboth time and labor and the results may differ acrosspathologists. Recently, computer-assisted quantita-tive analysis of stained histology images has receivedwide attention in the biomedical and bioimageinformatics fields.5–9 For instance, automated quan-tification of the levels of salient proteins has led tothe discovery of new markers of malignant cells incancers.10 In the study by Beck et al,5 stromal mor-phological features were found to be strongly asso-ciated with survival time of breast cancer patientsthan the morphological features obtained from epi-thelial compartments.Besides the clinical use of histological images, sub-
typing and stratification of breast cancer patients hasbeen widely studied using high throughput geneexpression data.11 For instance, van Veer et al identi-fied a 70-gene signature for predicting prognosis ofbreast cancer patients,12 while Perou et al13 identi-fied basal-like and non-basal-like subtypes of breastcancers. In addition, in a recent study using TheCancer Genome Atlas (TCGA) breast cancer(BRCA) data, investigators led by Perou identifiedfour major subtypes of breast cancers by combiningfive different genomic data including gene expres-sion, exome-sequencing, copy number variance,DNA methylation, and microRNA expression.14
While both morphological features and genomicdata are widely used for breast cancer subtyping andstaging, the causal and inferential relationshipbetween genomic data such as gene expression pro-files and morphology in histological images frombreast cancer patients is still not clear. In a recentstudy,6 the heterogeneity of the estrogen receptor(ER) negative breast cancer cells was explained usingcomplementary DNA copy number variance infor-mation and consequently an improved prognosticbiomarker was suggested. This study suggests thatthe prognostic power of these two types of features(histological and genomic) should be combined andis likely to lead to better biomarkers for classifica-tion of the breast cancer and other types of canceras well.15 16 However, there is neither a study whichassociates salient gene expression biomarkers withpertinent morphology of the tissue, nor a morph-ology driven result whose scope is also extended toinclude datasets where gene expression profiles aresolely available. In essence, there is a paucity ofwork that incorporates multiple measurements ofdisease from disparate sources to create biomarkers.In this work, we present a novel workflow for
integrating histopathological images analysis with
Open AccessScan to access more
free content
680 Wang C, et al. J Am Med Inform Assoc 2013;20:680–687. doi:10.1136/amiajnl-2012-001538
Research and applications

gene expression analysis for Triple Negative Breast Cancers(TNBC). Specifically, we develop a workflow for identifying themorphological features that correlate well with survival outcomeof patients. Signature morphological features with strong asso-ciations to survival were then analyzed by correlating with spe-cific gene expression profiles using another large publiclyavailable dataset and subsequently cross-validated with multipledatasets. Our pipeline provides a novel platform of translatingthe morphological features to any gene expression data withouthistopathological images. Our results clearly demonstrate thatspecific morphological features are correlated with specificgenetic features (post-transcription) with enriched biologicalfunctions pertaining to cancer development and/or tumormicroenvironment structure. These results suggest that new inte-grative biomarkers can be developed via such integrativeapproach. An additional aspect of our work is that we are ableto work across datasets that were either collected in the publicrealm or acquired in specific laboratories.
MATERIALS AND METHODSTCGA breast cancer datasetThe TCGA project17 collects high-quality breast tumor samplesand makes available the clinical information, molecular/genomicprofiling data, and histopathology slide images on its dataportal. Fifty-one triple negative breast tumor samples were avail-able by selecting from subjects with reported ER (negative), pro-gesterone receptor (PR) (negative), and Her2/neu (0 and 1+)status (using data available up to August 25, 2012). Forty-fourof these 51 TNBC subjects have accompanying histopathologyimages of adequate quality. No other stratification of theseTNBC cases was available. Owing to the short median overallfollow-up (<2 years) and scarcity of survival events (6 of 51 cur-rently marked as deceased), survival analyses for TCGA breastcancers will not be effective in the next few years.
From the TCGA portal, we downloaded ×40 magnificationwhole slide images in the SVS file (single-file pyramidal tiledTIFF) format. Tissue slides are available as thin slice of snap-frozen optimal cutting temperature embedded block of tissuefor imaging. We used tissue slide images from frozen tissue sec-tions instead of diagnostic slides, since their adjacent tissuesamples were used to provide DNA and RNA material for gen-erating genomic data. Typical size of these images is about100 000×300 000 pixels. It is thus very difficult to process theentire image due to the large size and high computing cost. Inaddition, whole slide images contain redundant information andencompass artifacts such as folding and missing and brokentissue. Thus, four representative image patches for each wholeTNBC slide image were curated by manually selecting heteroge-neous and informative regions containing both tumor andstroma tissues. All patches varied between 3000 and 5000 pixelsin width and height. This process eliminated artifacts and low-quality regions from consideration.
The Ohio State University TNBC tissue microarrayThe Ohio State University (OSU) Pathology Core Facility col-lects breast cancer biopsy specimens which are stored in theOSU Tissue Archive Service. The necessary clinical informationis available from the Information Warehouse at the OSUMedical Center (OSUMC). A total of 365 TNBC patients wereidentified between the years 1995 and 2005. After pathologyreview of tumors with sufficient sample for study, 175 paraffinblocks for TNBCs were selected to generate tissue microarrays(TMAs) used in this study. The TMAs were stained using H&Eand digitized by an Aperio ScanScope under ×20 magnification.
After filtering using measures of satisfactory image quality, TMAimages for 143 patients were finally selected. The overall demo-graphic profiles of the cohort were not altered significantly afterfiltering (shown in table 1).
Public breast cancer expression datasetsThere are several large public breast cancer gene expressiondatasets with adequate information on survival outcomes andsubtyping. Identified biomarkers can be cross-validated usingthese datasets, of which the Perou18 (NCBI GSE2741) andNKI19 collections are among the most frequently used. Toevaluate our discovered metagenes on the ER-negative samples,we tested them on these two breast cancer datasets to see if anyof the gene signatures can predict ER-negative patient survival.
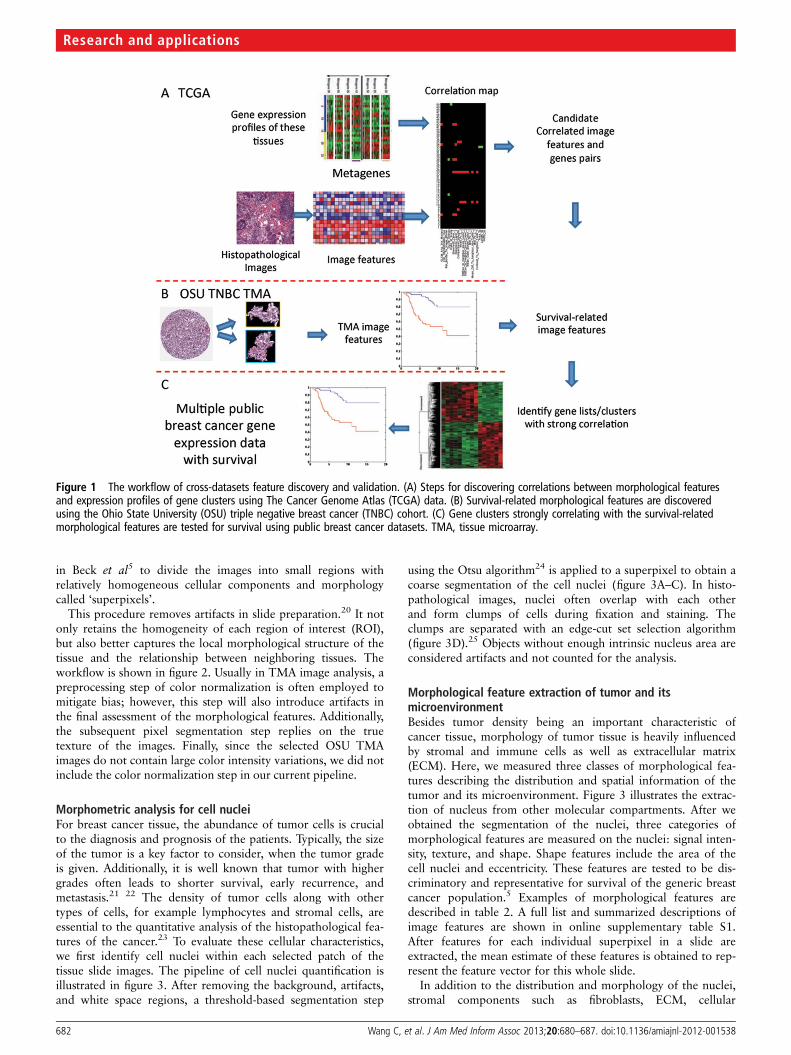
Integrated breast cancer biomarker identification workflowIn this study, we focus on the discovery of TNBC biomarkersby translating gene–morphology relationships across multipledatasets. Figure 1 shows our overall workflow. Algorithmicdetails of each are described in subsequent sections.
Using the TCGA dataset, in which both histopathologicalimages and gene expression profiles are available, we computedcorrelations between morphological features and expressionprofiles of gene clusters (figure 1A). Then, we selected the mor-phological features which can classify patients into higher andlower risk groups using the OSU TNBC cohort (figure 1B).Assuming that the selected morphological features glean similarrelationships of survival in other datasets, gene clusters withstrong correlations to these morphological features can poten-tially serve as biomarkers for survival. We test them using publicbreast cancer gene expression datasets without available hist-ology images (figure 1C).
TCGA and OSU histopathology slide image preprocessingand segmentationDuring preprocessing we ensured that both tumor epithelial andstromal compartments existed on chosen slides. Magnificationfor digitization was enforced to be consistent so that all imageswithin each cohort are of the same resolution. Color imageswere filtered to remove extreme values in the RED channel,which was used to delineate blood cells and spills. A mask wasgenerated to separate the superpixels in each slide.
Characterizing cellular morphological featuresof TNBC samplesEach tissue sample is heterogeneous with existence of multipletissues (eg, tumor and stroma) and cells (eg, tumor epithelialcells, fibroblasts, endothelial cells, macrophages). We first adoptan entropy-based image segmentation algorithm similar to that
Table 1 Demographics summary of the Ohio State Universitytriple negative breast cancer cohort
Demographic characteristic Complete set, 365 Pruned set, 175
Median age (range) 51 (20–84) 51 (20–84)Race (%; White:African American) 91:8 91:9Stage (%; I:II) 35:54 31:54Grade 3 (%) 84 89Basal cancers (%) 47 45Adjuvant chemotherapy (%) 73 84Median follow-up (months) 74 (4–272) 75 (4–272)
Wang C, et al. J Am Med Inform Assoc 2013;20:680–687. doi:10.1136/amiajnl-2012-001538 681
Research and applications
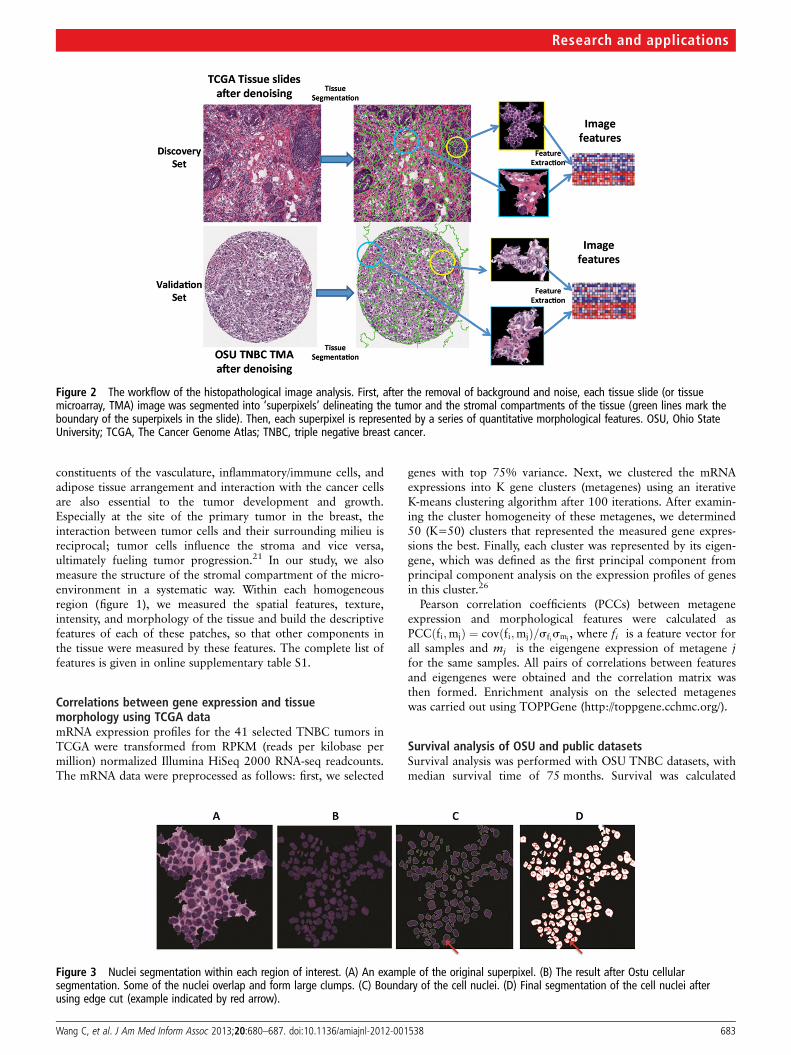
in Beck et al5 to divide the images into small regions withrelatively homogeneous cellular components and morphologycalled ‘superpixels’.
This procedure removes artifacts in slide preparation.20 It notonly retains the homogeneity of each region of interest (ROI),but also better captures the local morphological structure of thetissue and the relationship between neighboring tissues. Theworkflow is shown in figure 2. Usually in TMA image analysis, apreprocessing step of color normalization is often employed tomitigate bias; however, this step will also introduce artifacts inthe final assessment of the morphological features. Additionally,the subsequent pixel segmentation step replies on the truetexture of the images. Finally, since the selected OSU TMAimages do not contain large color intensity variations, we did notinclude the color normalization step in our current pipeline.
Morphometric analysis for cell nucleiFor breast cancer tissue, the abundance of tumor cells is crucialto the diagnosis and prognosis of the patients. Typically, the sizeof the tumor is a key factor to consider, when the tumor gradeis given. Additionally, it is well known that tumor with highergrades often leads to shorter survival, early recurrence, andmetastasis.21 22 The density of tumor cells along with othertypes of cells, for example lymphocytes and stromal cells, areessential to the quantitative analysis of the histopathological fea-tures of the cancer.23 To evaluate these cellular characteristics,we first identify cell nuclei within each selected patch of thetissue slide images. The pipeline of cell nuclei quantification isillustrated in figure 3. After removing the background, artifacts,and white space regions, a threshold-based segmentation step
using the Otsu algorithm24 is applied to a superpixel to obtain acoarse segmentation of the cell nuclei (figure 3A–C). In histo-pathological images, nuclei often overlap with each otherand form clumps of cells during fixation and staining. Theclumps are separated with an edge-cut set selection algorithm(figure 3D).25 Objects without enough intrinsic nucleus area areconsidered artifacts and not counted for the analysis.
Morphological feature extraction of tumor and itsmicroenvironmentBesides tumor density being an important characteristic ofcancer tissue, morphology of tumor tissue is heavily influencedby stromal and immune cells as well as extracellular matrix(ECM). Here, we measured three classes of morphological fea-tures describing the distribution and spatial information of thetumor and its microenvironment. Figure 3 illustrates the extrac-tion of nucleus from other molecular compartments. After weobtained the segmentation of the nuclei, three categories ofmorphological features are measured on the nuclei: signal inten-sity, texture, and shape. Shape features include the area of thecell nuclei and eccentricity. These features are tested to be dis-criminatory and representative for survival of the generic breastcancer population.5 Examples of morphological features aredescribed in table 2. A full list and summarized descriptions ofimage features are shown in online supplementary table S1.After features for each individual superpixel in a slide areextracted, the mean estimate of these features is obtained to rep-resent the feature vector for this whole slide.
In addition to the distribution and morphology of the nuclei,stromal components such as fibroblasts, ECM, cellular
Figure 1 The workflow of cross-datasets feature discovery and validation. (A) Steps for discovering correlations between morphological featuresand expression profiles of gene clusters using The Cancer Genome Atlas (TCGA) data. (B) Survival-related morphological features are discoveredusing the Ohio State University (OSU) triple negative breast cancer (TNBC) cohort. (C) Gene clusters strongly correlating with the survival-relatedmorphological features are tested for survival using public breast cancer datasets. TMA, tissue microarray.
682 Wang C, et al. J Am Med Inform Assoc 2013;20:680–687. doi:10.1136/amiajnl-2012-001538
Research and applications
constituents of the vasculature, inflammatory/immune cells, andadipose tissue arrangement and interaction with the cancer cellsare also essential to the tumor development and growth.Especially at the site of the primary tumor in the breast, theinteraction between tumor cells and their surrounding milieu isreciprocal; tumor cells influence the stroma and vice versa,ultimately fueling tumor progression.21 In our study, we alsomeasure the structure of the stromal compartment of the micro-environment in a systematic way. Within each homogeneousregion (figure 1), we measured the spatial features, texture,intensity, and morphology of the tissue and build the descriptivefeatures of each of these patches, so that other components inthe tissue were measured by these features. The complete list offeatures is given in online supplementary table S1.
Correlations between gene expression and tissuemorphology using TCGA datamRNA expression profiles for the 41 selected TNBC tumors inTCGA were transformed from RPKM (reads per kilobase permillion) normalized Illumina HiSeq 2000 RNA-seq readcounts.The mRNA data were preprocessed as follows: first, we selected
genes with top 75% variance. Next, we clustered the mRNAexpressions into K gene clusters (metagenes) using an iterativeK-means clustering algorithm after 100 iterations. After examin-ing the cluster homogeneity of these metagenes, we determined50 (K=50) clusters that represented the measured gene expres-sions the best. Finally, each cluster was represented by its eigen-gene, which was defined as the first principal component fromprincipal component analysis on the expression profiles of genesin this cluster.26
Pearson correlation coefficients (PCCs) between metageneexpression and morphological features were calculated asPCCðfi;mjÞ ¼ covðfi;mjÞ=sfismj , where fi is a feature vector forall samples and mj is the eigengene expression of metagene jfor the same samples. All pairs of correlations between featuresand eigengenes were obtained and the correlation matrix wasthen formed. Enrichment analysis on the selected metageneswas carried out using TOPPGene (http://toppgene.cchmc.org/).
Survival analysis of OSU and public datasetsSurvival analysis was performed with OSU TNBC datasets, withmedian survival time of 75 months. Survival was calculated
Figure 2 The workflow of the histopathological image analysis. First, after the removal of background and noise, each tissue slide (or tissuemicroarray, TMA) image was segmented into ‘superpixels’ delineating the tumor and the stromal compartments of the tissue (green lines mark theboundary of the superpixels in the slide). Then, each superpixel is represented by a series of quantitative morphological features. OSU, Ohio StateUniversity; TCGA, The Cancer Genome Atlas; TNBC, triple negative breast cancer.
Figure 3 Nuclei segmentation within each region of interest. (A) An example of the original superpixel. (B) The result after Ostu cellularsegmentation. Some of the nuclei overlap and form large clumps. (C) Boundary of the cell nuclei. (D) Final segmentation of the cell nuclei afterusing edge cut (example indicated by red arrow).
Wang C, et al. J Am Med Inform Assoc 2013;20:680–687. doi:10.1136/amiajnl-2012-001538 683
Research and applications

from the time of initial diagnosis of breast cancer to the time ofdeath. Patients were divided into two groups as determined byfeature values being greater or lower than the median value.Univariate Cox proportional hazards regression models werefitted to estimate the hazards of death among patients usingeach morphological feature. p Values were calculated based onunivariate regression models to determine the significance ofeach covariate of interest, where p<0.05 was considered signifi-cant. Kaplan–Meier estimators were computed to plot the sur-vival curves for covariates which were deemed to be significant.For survival analysis of metagenes on public datasets, a prognos-tic index of each patient was calculated by the sum of geneexpression weighted by the hazard coefficients that were esti-mated by Cox proportional hazards model. After 10 times of10-fold cross-validation, the patients were divided by the 50percentile of the tested prognostic index with statistical signifi-cance evaluated by log-rank test.
RESULTS AND DISCUSSIONTranslational discovery of survival-related morphologicalfeatures by cancer-related genesIn this study, we applied our proposed image analysis workflowon the more than 400 slide H&E images and extracted 37previously-tested morphological features. We investigated thecorrelations between these features and the transcriptionalexpression profiles and found 23 significant positive statisticallyassociations and 25 negative ones. Analysis on the 143OSU TNBC TMA images as the validation set unveils four
morphological features that have strong correlations with sur-vival. The corresponding gene clusters of these features werevalidated using two other independent datasets.
Metagenes with strong correlations to morphologicalfeaturesPCCs between expression of the 50 metagenes and morphologicalfeatures were calculated and are shown in figure 4A. Forty-eightstrong correlations (|PCC|>0.5) are highlighted in figure 4B, ofwhich 23 are positive correlations and 25 are negative (see onlinesupplementary table S3). Examples of morphology-correlatedmetagenes are listed in table 3, along with their major molecularfunctions and regulated human phenotypes obtained fromenrichment analysis. Some of the metagenes strongly correlatewith multiple morphological features. For instance, MetaGene_2includes genes (eg, MYOT, ACTA1) regulating molecular struc-tural constituent of muscle motor activity and it controls theabnormality of protein fibers, which is the major component ofthe tumor microenvironment and is associated with fibroblastcells. It is noteworthy that MetaGene_2 negatively correlateswith most morphological features.
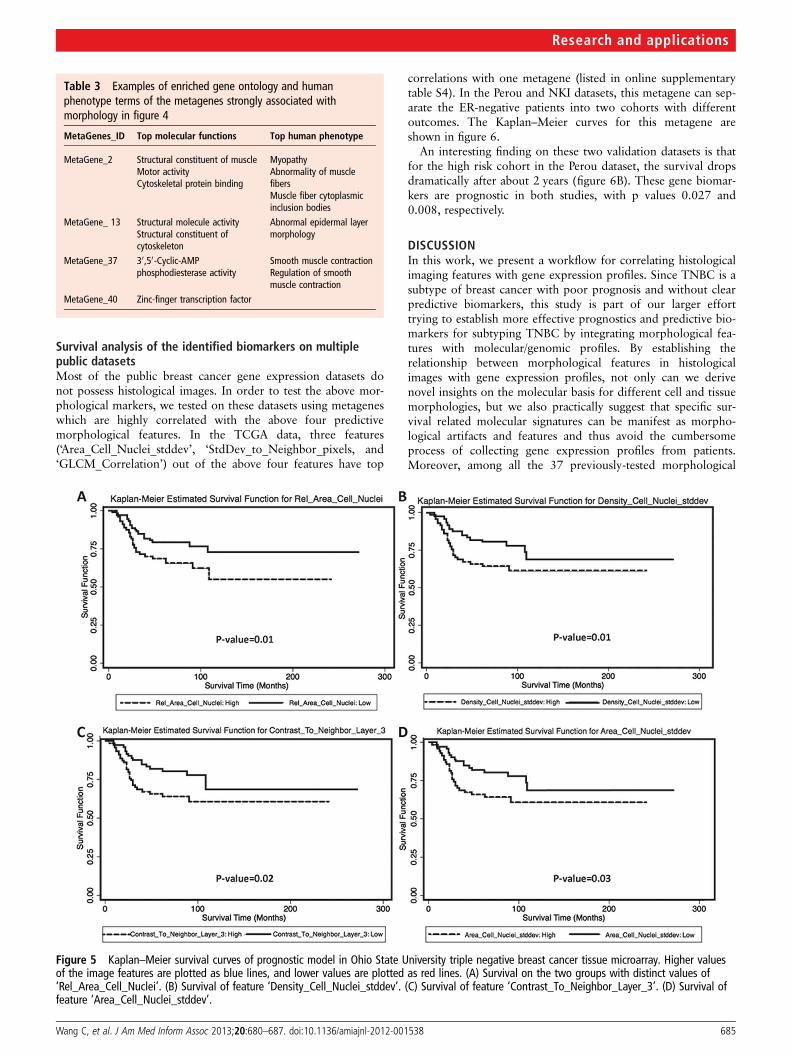
Survival of TNBC based on morphological biomarkersWe conducted univariate survival analysis of the morphologicalfeatures measuring variability of the TNBC tissue slides. Coxproportional hazard models were fitted based on patient’s sur-vival time and morphological features. Survival tests of the topfour predictive image features are shown in figure 5. Feature‘Area_Cell_Nuclei_stddev’ measures the SD of the size of thenuclei. Higher values of this feature imply larger variations innuclei sizes in the poorer prognosis group. This statistic wasobtained by analyzing more than 30 000 cell nuclei of TNBCs inthe validation cohort. Another marked characteristic of the poorsurvival group is the pixel density gradient among neighborhoodof pixels. A high value indicates more dramatic deviations fromthe normal uniformly distributed tissue texture. The larger dis-continuity, as noted in the survival curves among patients withpoor prognosis, may result from a larger proportion of tumorcells. Since we kept the tumor size bias as small as possible whenthe ROIs were selected and size measurements were normalizedby the size of the ROIs, the measurement bias is minimized.
Figure 4 Pairwise correlation heat map between metagene expression and morphology of tissue in The Cancer Genome Atlas discover set.(A) Continuous correlation without threshold. The blue color demonstrates negative correlation; the red color demonstrates the positive correlation.(B) Thresholded correlation (|PCC|>0.5).
Table 2 Examples of morphological features of cancer tissueimages.
Feature name Description
GLCM_Ang_2nd_Moment Haralick Texture. GLCM angular second moment(akin to variance)
Rel_Border_To_Image_Border Rel. Border To determines the relative borderlength an object shares with the image border
GLCM_Entropy The value for entropy is high, if elements ofGLCM are distributed equally
Rel_Area_Cell_Nuclei Mean value of areas within cell nucleiDensity_Cell_Nuclei_Stddev SD of the densities of cell nuclei
GLCM, gray-level co-occurrence matrix.
684 Wang C, et al. J Am Med Inform Assoc 2013;20:680–687. doi:10.1136/amiajnl-2012-001538
Research and applications
Survival analysis of the identified biomarkers on multiplepublic datasetsMost of the public breast cancer gene expression datasets donot possess histological images. In order to test the above mor-phological markers, we tested on these datasets using metageneswhich are highly correlated with the above four predictivemorphological features. In the TCGA data, three features(‘Area_Cell_Nuclei_stddev’, ‘StdDev_to_Neighbor_pixels, and‘GLCM_Correlation’) out of the above four features have top
correlations with one metagene (listed in online supplementarytable S4). In the Perou and NKI datasets, this metagene can sep-arate the ER-negative patients into two cohorts with differentoutcomes. The Kaplan–Meier curves for this metagene areshown in figure 6.
An interesting finding on these two validation datasets is thatfor the high risk cohort in the Perou dataset, the survival dropsdramatically after about 2 years (figure 6B). These gene biomar-kers are prognostic in both studies, with p values 0.027 and0.008, respectively.
DISCUSSIONIn this work, we present a workflow for correlating histologicalimaging features with gene expression profiles. Since TNBC is asubtype of breast cancer with poor prognosis and without clearpredictive biomarkers, this study is part of our larger efforttrying to establish more effective prognostics and predictive bio-markers for subtyping TNBC by integrating morphological fea-tures with molecular/genomic profiles. By establishing therelationship between morphological features in histologicalimages with gene expression profiles, not only can we derivenovel insights on the molecular basis for different cell and tissuemorphologies, but we also practically suggest that specific sur-vival related molecular signatures can be manifest as morpho-logical artifacts and features and thus avoid the cumbersomeprocess of collecting gene expression profiles from patients.Moreover, among all the 37 previously-tested morphological
Figure 5 Kaplan–Meier survival curves of prognostic model in Ohio State University triple negative breast cancer tissue microarray. Higher valuesof the image features are plotted as blue lines, and lower values are plotted as red lines. (A) Survival on the two groups with distinct values of‘Rel_Area_Cell_Nuclei’. (B) Survival of feature ‘Density_Cell_Nuclei_stddev’. (C) Survival of feature ‘Contrast_To_Neighbor_Layer_3’. (D) Survival offeature ‘Area_Cell_Nuclei_stddev’.
Table 3 Examples of enriched gene ontology and humanphenotype terms of the metagenes strongly associated withmorphology in figure 4
MetaGenes_ID Top molecular functions Top human phenotype
MetaGene_2 Structural constituent of muscleMotor activityCytoskeletal protein binding
MyopathyAbnormality of musclefibersMuscle fiber cytoplasmicinclusion bodies
MetaGene_ 13 Structural molecule activityStructural constituent ofcytoskeleton
Abnormal epidermal layermorphology
MetaGene_37 30,50-Cyclic-AMPphosphodiesterase activity
Smooth muscle contractionRegulation of smoothmuscle contraction
MetaGene_40 Zinc-finger transcription factor
Wang C, et al. J Am Med Inform Assoc 2013;20:680–687. doi:10.1136/amiajnl-2012-001538 685
Research and applications

features, the top prognostic ones are related to cell nuclei.Therefore, our study validated in a novel manner that nuclearfeatures, which have been used in tumor grading in clinical prac-tice, are prognostic in TNBC.
To achieve this goal, we took further advantage of TCGAdata, which proved to be an invaluable resource for such inte-grative genomic research. Even though the TCGA breast cancerdata is relatively new and the follow-up time for patients is notlong enough for effective survival analysis on TNBC patients,the matched histological images with gene expression profilesnevertheless provides the bridge for these two data modalitiesallowing us to also use multiple modalities of data from differ-ent sources (eg, OSU cohort as well as NCBI GEO).
Specifically in this study we identified metagenes that arehighly correlated with the four morphological features that canpredict TNBC patient survival using the OSU cohort. Wefurther determined that the features that best separated thebetter and worse survival groups were the cellularity of epithe-lial cells and the shape of the cancer cells. Essentially, the areaof cancer cell nuclei and the diversity of the area of nuclei showgreat prognostic power for survival. To demonstrate a distinc-tion between low-value features and high-value features, the boxplot of the area-based features and the patches with extremevalues are shown in online supplementary figure S1.
While we currently do not have another independent datasetto validate these morphological features, we were able to test ifthe expression profiles of the associated metagenes have similarpredictive power for multiple large datasets. We found that twoof five gene clusters show predictive power in at least one of thetest data. In particular, MetaGene_2 has strong predictive powerin both public datasets. This metagene is enriched with cytoskel-eton and fiber genes, which is not only consistent with its asso-ciation with cell morphology, but also implies its potential rolesin the development of tumor microenvironment including thestroma. The other metagene (MetaGene_13) is enriched withepidermal layer development indicating its association withtumor epithelial cells, which may explain its role in cancerdevelopment and relationship with tumor cell morphology.These observations strongly suggest that our approach effectivelyidentified gene clusters that can partially explain the morpho-logical characteristics and can be used as predictive markers.Additionally, our methods to process whole tissue slides improvethe current state-of-the-art pathological TMA image processing.
This study has several limitations: first, we only utilized thetissue slide images of TCGA to measure the patients’ phenotypes.The tissue slides were adjacent to tissues from which genomicdata were derived. Thus, correlations between the morphologyof these areas and genomic data are better reflected. However,these slide images are obtained from frozen sections and maypossess larger artifacts than the diagnostic images. Another limi-tation of this study is that we did not differentiate tumor epithe-lial, adipose, and stromal tissue in our measurement of themorphology. Classification of these cell types is an ongoing studyand will appear in a future publication. Recently Yuan et al8
showed that immune cells can be used as an effective biomarkerfor prognosis, suggesting tissue specific morphological featuresshould be explored. We plan to carry out a systematic analysis ondifferent compartments of the tumor region.
CONCLUSIONWe present a novel workflow for discovering the associationsbetween histological features with gene expression profiles. Ouranalysis reveals 48 pairs of strongly correlated morphologicalfeatures and gene clusters. Four of the morphological featureswere identified as potential biomarkers separating TNBCpatients into groups with different survival in a large validationcohort. Gene ontology analysis suggests that the high correla-tions are consistent with development and tumor relatedfunctions. Additionally, these morphological features on thetumor tissues can be extended as prognostic biomarkers forER-negative breast cancers as the top gene cluster correlatedwith these morphological features was shown to be effective forpredicting patient survival for ER-negative breast cancers in twoindependent public datasets.
Correction notice This paper has been corrected since it was published Online First.In table 1, the number for ‘Race’ and ‘Pruned set’ has been changed from 81:9 to 91:9.On page 5, two sentences have been added to the end of the first paragraph.
Contributors KH, RM, and CLS conceived the data integration idea and led thestudy. KH, RM, and CW designed the computational workflow. CW implementedthe computational workflow and carried out the data analysis with KH and RM.CLS provided the OSU TNBC images. DZ reviewed the histology images. CLS and DZprovided the clinical interpretations. TP conducted the survival analysis for publicgene expression datasets. CW, KH, and RM wrote the manuscript. CLS and DZrevised the manuscript. All authors reviewed and approved the manuscript.
Funding This work is partially supported by OSU-Howard Hughes MedicalInstitution MED into Grad Scholar Program (56006765), Stefanie Spielman Fund for
Figure 6 Kaplan–Meier curves for the metagene that shows the highest correlation with the image features. All time is represented in months.(A) Survival on the NKI ER-negative patient subset. A higher risk group was revealed by this metagene. (B) Survival on the Perou dataset,ER-negative patient subset. This list of genes can separate the patients into groups with very significantly different outcomes.
686 Wang C, et al. J Am Med Inform Assoc 2013;20:680–687. doi:10.1136/amiajnl-2012-001538
Research and applications
Breast Cancer Research, NCI R01CA141090, and UKY-OSU CCTS Joint Pilot Award(UL1RR033173-01, 8UL1TR000090-05).
Competing interests None.
Ethics approval The Ohio State University IRB.
Provenance and peer review Not commissioned; externally peer reviewed.
Open Access This is an Open Access article distributed in accordance with theCreative Commons Attribution Non Commercial (CC BY-NC 3.0) license, which permitsothers to distribute, remix, adapt, build upon this work non-commercially, and licensetheir derivative works on different terms, provided the original work is properly cited andthe use is non-commercial. See: http://creativecommons.org/licenses/by-nc/3.0/
REFERENCES1 Irshad S, Ellis P, Tutt A. Molecular heterogeneity of triple-negative breast cancer and
its clinical implications. Curr Opin Oncol 2011;23:566–77.2 Perou CM. Molecular stratification of triple-negative breast cancers. Oncologist
2011;16:61–70.3 Nafe R, Franz K, Schlote W, et al. Morphology of tumor cell nuclei is significantly related
with survival time of patients with glioblastomas. Clin Cancer Res 2005;11:2141–8.4 Khan OA, Fitzgerald JJ, Field ML, et al. Histological determinants of survival in
completely resected T1-2N1M0 nonsmall cell cancer of the lung. Ann Thorac Surg2004;77:1173–8.
5 Beck AH, Sangoi AR, Leung S, et al. Systematic analysis of breast cancer morphologyuncovers stromal features associated with survival. Sci Transl Med 2011;3:108–13.
6 Fuchs TJ, Buhmann JM. Computational pathology: challenges and promises fortissue analysis. Comput Med Imaging Graph 2011;35:515–30.
7 Pham NA, Morrison A, Schwock J, et al. Quantitative image analysis ofimmunohistochemical stains using a CMYK color model. Diagn Pathol 2007;2:8.
8 Yuan Y, Failmezger H, Rueda OM, et al. Quantitative image analysis of cellularheterogeneity in breast tumors complements genomic profiling. Sci Transl Med2012;4:157ra143.
9 Basavanhally A, Feldman M, Shih N, et al. Multi-field-of-view strategy forimage-based outcome prediction of multi-parametric estrogen receptor-positivebreast cancer histopathology: comparison to Oncotype DX. J Pathol Inform2011;2:S1.
10 Gil J, Wu HS. Applications of image analysis to anatomic pathology: realities andpromises. Cancer Invest 2003;21:950–9.
11 Sotiriou C, Neo SY, McShane LM, et al. Breast cancer classification and prognosisbased on gene expression profiles from a population-based study. Proc Natl AcadSci U S A 2003;100:10393–8.
12 Mook S, Schmidt MK, Viale G, et al. The 70-gene prognosis-signature predictsdisease outcome in breast cancer patients with 1–3 positive lymph nodes in anindependent validation study. Breast Cancer Res Treat 2009;116:295–302.
13 Perou CM, Sorlie T, Eisen MB, et al. Molecular portraits of human breast tumours.Nature 2000;406:747–52.
14 Koboldt DC, Fulton RS, McLellan MD, et al. Comprehensive molecular portraits ofhuman breast tumours. Nature 2012;490:61–70.
15 Cooper LA, Kong J, Gutman DA, et al. Integrated morphologic analysis for theidentification and characterization of disease subtypes. J Am Med Inform Assoc2012;19:317–23.
16 Chang H, Fontenay GV, Han J, et al. Morphometic analysis of TCGA glioblastomamultiforme. BMC Bioinformatics 2011;12:484.
17 The Cancer Genome Atlas Network. Comprehensive molecular portraits of humanbreast tumours. Nature 2008;490:61–70.
18 Weigelt B, Hu ZY, He XP, et al. Molecular portraits and 70-gene prognosissignature are preserved throughout the metastatic process of breast cancer.Cancer Res 2005;65:9155–8.
19 van’t Veer LJ, Dai HY, van de Vijver MJ, et al. Gene expression profiling predictsclinical outcome of breast cancer. Nature 2002;415:530–6.
20 Liu MY, Tuzel O, Ramalingam S, et al. Entropy rate superpixel segmentation. ProcCVPR IEEE Colorado Springs, USA; 2011.
21 Frost AR, Hurst DR, Shevde LA, et al. The influence of the cancermicroenvironment on the process of metastasis. Int J Breast Cancer 2012;2012:Article ID 756257.
22 Schnitt SJ. Classification and prognosis of invasive breast cancer: from morphologyto molecular taxonomy. Mod Pathol 2010;(23 Suppl 2):S60–4.
23 Baxevanis CN, Dedoussis GV, Papadopoulos NG, et al. Tumor specific cytolysis bytumor infiltrating lymphocytes in breast cancer. Cancer 1994;74:1275–82.
24 Cheriet M, Said JN, Suen CY. A recursive thresholding technique for imagesegmentation. IEEE Trans Image Process 1998;7:918–21.
25 Wen Q, Chang H, Parvin B. A delaunay triangulation approach for segmentingclumps of nuclei. 2009 IEEE International Symposium on Biomedical ImagingBoston, Massachusetts, USA: From Nano to Macro, Vols 1 and 2; 2009: 9–12.
26 Alter O, Brown PO, Botstein D. Singular value decomposition for genome-wideexpression data processing and modeling. Proc Natl Acad Sci U S A2000;97:10101–6.
Wang C, et al. J Am Med Inform Assoc 2013;20:680–687. doi:10.1136/amiajnl-2012-001538 687
Research and applications