Embed Size (px)
Citation preview

Identifying Sources of Organic Matter
to Benthic Organisms in the Beaufort and Chukchi
Outer Continental Shelves
Principal Investigator: Matthew J. Wooller1
Co-PI: Katrin Iken1, Diane O’Brien2
1College of Fisheries and Ocean Sciences, University of Alaska Fairbanks
2Institute of Arctic Biology, University of Alaska Fairbanks
Final Report OCS Study BOEM 2019-030
May 2019

Contact Information:
Coastal Marine Institute College of Fisheries and Ocean Sciences University of Alaska Fairbanks P. O. Box 757220 Fairbanks, AK 99775-7220 [email protected] Phone: 907.474.6782
This study was funded by the U.S. Department of the Interior, Bureau of Ocean Energy Management (BOEM) Alaska OCS Region (Cooperative Agreement M16AC00005) and the University of Alaska Fairbanks. This report, OCS Study BOEM 2019-030, is available through the Coastal Marine Institute and select federal depository libraries. Electronic access is available at http://www.boem.gov/Alaska-Scientific-Publications.
The views and conclusions contained in this document are those of the authors and should not be interpreted as representing the opinions or policies of the U.S. Government. Mention of trade names or commercial products does not constitute their endorsement by the U.S. Government.

ii
Table of Contents List of Figures ................................................................................................................................ iii
List Tables ...................................................................................................................................... iv
Abstract ............................................................................................................................................v
Introduction ......................................................................................................................................1
Background ..................................................................................................................................1
Objectives ....................................................................................................................................2
Hypotheses ...................................................................................................................................3
Methods............................................................................................................................................4
Study Area/Sample Collection .....................................................................................................4
Bulk Stable Isotope Analysis .......................................................................................................7
Compound-specific Stable Carbon Isotope Analyses of Amino Acids .......................................8
Data Analysis ...............................................................................................................................9
Results ............................................................................................................................................11
Endmember Results ...................................................................................................................11
Hanna Shoal Region ..................................................................................................................13
Chukchi Region .........................................................................................................................15
Beaufort Region .........................................................................................................................21
Leucine to Isoleucine Index .......................................................................................................25
Shell vs. Muscle Comparison ....................................................................................................27
Discussion ......................................................................................................................................29
Endmember Results ...................................................................................................................29
Hanna Shoal and Chukchi Regions............................................................................................29
Beaufort Region .........................................................................................................................31
Shell vs. Muscle Comparison ....................................................................................................32
Conclusions ....................................................................................................................................34
Acknowledgments..........................................................................................................................34
Study Products ...............................................................................................................................35
References ......................................................................................................................................37

iii
List of Figures Figure 1: Stable carbon isotope amino acid “fingerprints” (linear discriminant function analysis) of organic matter sources (from Larsen et al. 2013) ........................................................................2
Figure 2: Locations of the Beaufort and Chukchi Seas and their major oceanographic influences (courtesy of Seth Danielson) ............................................................................................................4
Figure 3: Beaufort Sea region where archived benthic invertebrates were collected (Transboundary project 2014) ..........................................................................................................5
Figure 4: Chukchi Sea region where archived benthic invertebrates were collected (AMBON project 2015) ....................................................................................................................................5
Figure 5: Hanna Shoal region where archived benthic invertebrates were collected (COMIDA-Hanna Shoal) ....................................................................................................................................6
Figure 6: Linear discriminant analysis based on the mean-centered δ13CEAA values (Thr, Val, Leu, Ile, Phe) of all endmembers ...................................................................................................13
Figure 7: Astarte spp. and Macoma spp. sampling locations and estimated dietary contributions in Hanna Shoal individuals (simmr solo runs) ...............................................................................14
Figure 8: Proportional contributions of diet sources to Astarte spp. and Macoma spp. from Hanna Shoal as modeled by simmr ...........................................................................................................15
Figure 9: Anonyx sp. (amphipod) locations and estimated dietary contributions in the Chukchi individuals (simmr solo runs).........................................................................................................16
Figure 10: Argis sp. (shrimp) locations and estimated dietary contributions in the Chukchi individuals (simmr solo runs).........................................................................................................16
Figure 11: Buccinum sp. (sea snail) locations and estimated dietary contributions in the Chukchi individuals (simmr solo runs).........................................................................................................17
Figure 12: Chionoecetes sp. (snow crab) locations and estimated dietary contributions in the Chukchi individuals (simmr solo runs) ..........................................................................................17
Figure 13: Eualus sp. (shrimp) locations and estimated dietary contributions in the Chukchi individuals (simmr solo runs).........................................................................................................18
Figure 14: Macoma sp. (clam) locations and estimated dietary contributions in the Chukchi individuals (simmr solo runs).........................................................................................................18
Figure 15: Alcyonidium sp. (bryozoan) locations and estimated dietary contributions in the Chukchi individuals (simmr solo runs). .........................................................................................19
Figure 16: Serripes sp. (clam) locations and estimated dietary contributions in the Chukchi individuals (simmr solo runs).........................................................................................................19
Figure 17: Nuculana sp. (clam) locations and estimated dietary contributions in the Chukchi individuals (simmr solo runs).........................................................................................................20
Figure 18: Maldanidae sp. (worms) locations and estimated dietary contributions in the Chukchi individuals (simmr solo runs).........................................................................................................20

iv
Figure 19: Eualus sp. (shrimp) locations and estimated dietary contributions in the Beaufort Sea individuals (simmr solo runs).........................................................................................................21
Figure 20: Astarte spp. (clam) locations and estimated dietary contributions in the Beaufort Sea individuals (simmr solo runs).........................................................................................................22
Figure 21: Sabinea sp. (shrimp) locations and estimated dietary contributions in the Beaufort Sea individuals (simmr solo runs).........................................................................................................23
Figure 22: Bathyarca sp. (bivalve) locations and estimated dietary contributions in the Beaufort Sea individuals (simmr solo runs) ..................................................................................................24
Figure 23: Leucine to isoleucine indexes of inverts from the Beaufort Sea vs. station depth .......25
Figure 24: Leucine to isoleucine indexes of Astarte spp. from the Beaufort Sea vs. station depth ...............................................................................................................................................26
Figure 25: Proportional contributions of bacterial and phytoplankton EAAs vs. water depth for Astarte spp. from the Beaufort Sea ................................................................................................26
Figure 26: Shell and muscle centered average amino acid δ13C values for Macoma calcarea plotted against each other and on the same axis by amino acid .....................................................27
Figure 27: Proportional contributions of diet sources to Macoma calcarea muscle and shell as modeled by simmr ..........................................................................................................................28
List of Tables Table 1: Longitudes and latitudes of stations with samples available from the COMIDA-Hanna Shoal archives (from Kenneth Dunton) ...........................................................................................6
Table 2: Datasets used for mixing model endmember inputs ........................................................12
Table 3: Mixing model results (dietary proportions) based on EAA fingerprints for endmember-source dataset sensitivity tests .......................................................................................................12
Table 4: Mixing model dietary proportion estimates based on EAA fingerprints for Macoma calcarea muscle and shell samples ................................................................................................27

v
Abstract
Benthic invertebrate communities are an essential ecosystem component in Arctic food webs in terms of energy transfer to higher trophic levels and mineralization. Currently, the proportional contributions of different sources of organic matter (marine, terrestrial, or microbial production) that sustain benthic organisms in the Arctic are unclear. This project provided a better understanding of the organic matter sources consumed by benthic organisms using a state-of-the-art essential amino acid (EAA) “fingerprinting” approach. Unlike non-essential amino acids, the term “essential” means that they only originate from the organisms that synthesized them (e.g., photosynthetic or microbial organisms) and cannot be synthesized by consumers. The EAAs have specific stable carbon isotope fingerprints, depending on the producer type, and they differ between marine, terrestrial, and microbial producers. The EAA fingerprints are incorporated into and conserved within consumers, creating a pattern or “stable isotope fingerprint,” which can be statistically compared with the EAA fingerprints of the primary producers. “Fingerprints” allow the separation of microbial and terrestrial carbon sources from marine production, filling a gap identified in previous benthic food web work involving systems in the Arctic. This is a particularly powerful tool to quantify the proportional contribution by microbial, terrestrial plant, and marine primary producers to consumers.
We found that EAA fingerprints in the soft tissues of clams from the Arctic marine environment were reflected in the signatures preserved in the shells of these organisms. This important methodological finding will allow future application of the approach to analyses of archeological and geological clam samples. We compared results from our analyses of primary producers (endmembers in terrestrial plants and phytoplankton) with literature values and found that most endmembers of the same category had very similar EAA fingerprints. This suggests that EAA isotope fingerprints of primary producers are taxon-specific and driven by broad and deep phylogenetic differences in EAA synthesis rather than environmental and geographic differences.
Archived benthic invertebrates were analyzed from three regions, Hanna Shoal, Chukchi Sea, and the Beaufort Sea. In the Hanna Shoal and Chukchi samples, which came from a relatively uniform water depth, we found that phytoplankton and terrestrial derived EAAs made the greatest proportional contributions to benthic invertebrates. This finding supports observations of highly productive phytoplankton blooms in the region. The Hanna Shoal bivalve model estimated that bacteria made up the next highest proportion of bivalve EAAs, which may reflect the reworking and ecological availability of more refractory organic matter. There appeared to be some differences between the two bivalve species analyzed from the Hanna Shoal. Phytoplankton was estimated to contribute a higher proportion of EAAs, and terrestrial organic matter and bacteria less, to Astarte spp. than found with Macoma spp. These differences are likely due to their different feeding modes.
In contrast to the Chukchi region and Hanna Shoal, the results from the Beaufort region indicated a greater contribution of EAAs from sources other than phytoplankton and terrestrial organic matter. Most notably, there appeared to be a greater contribution of bacterial and

vi
macroalgal sources of EAAs in the invertebrates. Additionally, water depth influenced the source of the proportional contributions, with more bacterial-derived EAAs at greater depth. A future direction would be to apply compound-specific amino acid and fatty acid analyses on the same sample. This would allow the determination of the proportional contribution of marine photosynthetic sources as a whole (vs. terrestrial and bacterial sources), and the determination of proportional contributions of ice algae and phytoplankton based on the fatty acids data.

1
Introduction
Background
Arctic shelf systems are often considered benthic-dominated systems because much of the
primary production from phytoplankton and sea ice (i.e., ice algal production) goes ungrazed by
zooplankton and sinks to the seafloor (Grebmeier et al. 2007b, a). Tight pelagic-benthic coupling
results in rich invertebrate communities dominating the benthic marine ecosystems in the Arctic
(Piepenburg 2005; Dunton et al. 2006). Benthic invertebrates are important in remineralization
processes and as prey for higher trophic levels (Seymour et al. 2014a, b).
The nature of the Arctic benthic communities is likely to be affected by changes in the
climate, environment, and human use of the Arctic system. For example, changes in the organic
matter sources supporting the complex benthic food webs could alter energy flow through the
system (Iken et al. 2005, 2010; McTigue and Dunton 2014, 2017; Divine et al. 2015; Kȩdra et al.
2015). The Chukchi Sea, in particular, experiences dramatic sea-ice dynamics and, possibly,
fluctuations in the overall quantity of marine primary production. Benthic food webs in the
Chukchi Sea are also sensitive to hydrographic conditions (Iken et al. 2010; Feder et al. 2011; Tu
et al. 2015), which increases the probability that climate warming will have an impact. Currently,
the proportional contributions of organic matter sources (phytoplankton, microphytobenthos, ice
algae, terrestrial sources, and microbial production) that sustain these benthic organisms through
food web links are unclear (McTigue and Dunton 2014, 2017 ).
Depending on the specificity of the analysis, fatty acids and their stable isotope
composition can be used to distinguish sources of organic matter (Graham et al. 2014; Wang et
al. 2015; Wang et al. 2016). To date, Arctic food web research has largely employed bulk stable
isotope analysis of the total organic carbon and nitrogen in tissue samples (Bentzen et al. 2007,
2014; Feder et al. 2011; Savory et al. 2014; Seymour et al. 2014a, b). This project used a novel
approach, “stable isotope fingerprinting,” to identify and quantify links between organic matter
sources and benthic organisms in the Arctic marine environment. Stable isotope fingerprinting
provides greater organic matter source specificity and differentiation by examining the isotopic
signatures of individual essential amino acids (EAAs) originating from the food sources
consumed by an organism (Larsen et al. 2009, 2013). Unlike non-essential amino acids, EAAs
cannot be synthesized by consumers; rather, EAAs are synthesized by photosynthetic or
microbial organisms and transferred to consumers. The EAAs have specific stable isotope values
depending on whether the producer is marine photosynthetic (EAAs derived from dissolved
organic carbon), terrestrial photosynthetic (EAAs derived from atmospheric carbon dioxide), or
microbial (Figure 1). Isotope values are conserved within a consumer, so the stable carbon
isotopic values of the eight EAAs (phenylalanine, valine, threonine, tryptophan, methionine,
leucine, isoleucine, and lysine) can be individually measured. The relative isotopic difference
between these values creates a “stable isotope fingerprint,” which can be used to identify the
source and calculate source-specific proportional contributions of EAAs to a consumer organism
(Larsen et al. 2009, 2013).

2
Figure 1: Stable carbon isotope amino acid “fingerprints” (linear discriminant function analysis) of
organic matter sources (from Larsen et al. 2013).
Quantitatively determining links between producers and benthic consumers helps define
the extent and strength of pelagic-benthic coupling in the Beaufort and Chukchi Seas. Further,
the data can inform modeling projections based on changes in proportions of source inputs into
the marine environment and provide a baseline for comparative studies and monitoring activities.
Understanding the key organic matter sources and links that support the rich benthos of the
Beaufort and Chukchi Seas contributes significantly to our knowledge of ecosystem function and
resilience.
Objectives
The primary research goal for the project was to quantify proportional contributions of different
organic matter sources consumed by benthic invertebrates on the Outer Continental Shelf (OCS)
of the Beaufort and Chukchi Seas. Sources of organic matter in the Beaufort and Chukchi Seas
include marine phytoplankton and sea ice algal, microphytobenthic, terrestrial, and microbial
production. For this project, we used benthic invertebrate samples from existing archives

3
containing representatives of all benthic biomass-dominating taxa (crustaceans, mollusks, and
echinoderms) in the region. We analyzed a subset of samples drawn from more than 5,000
specimens collected across the Beaufort and Chukchi shelf systems, which allowed us to cost-
effectively estimate the proportional contribution of organic matter sources to a range of benthic
invertebrates with different feeding modes and lifestyles.
Objective 1: Measure the stable carbon isotope compositions of EAAs from archived
benthic organisms that contribute substantially to benthic biomass and have a variety of
feeding types and mobility in the Beaufort Sea OCS.
Objective 2: Perform EAA fingerprinting of archived benthic samples from the Chukchi
Sea OCS.
Objective 3: Quantify the proportional contribution of marine photosynthetic, terrestrial
photosynthetic, and microbial-derived EAAs in benthic organisms from the Beaufort and
Chukchi Seas.
Hypotheses
There is significant terrestrial matter imported into the Beaufort Sea region through major river
systems, coastal erosion, and possibly melting nearshore ice. Bulk stable isotope studies suggest
that both terrestrial and microbial carbon sources may be important to benthic food webs in the
region (Dunton et al. 2006; Divine et al. 2015).
Hypothesis 1: Essential amino acids from microbial-reworking of organic matter from
terrestrial and microbial sources provide the dominant proportional contribution to
benthic organisms in the Beaufort Sea.
Photosynthetic sympagic, microphytobenthic, and pelagic sources of organic matter have
been proposed as sources of organic matter to benthic communities in the Chukchi Sea
(Iken et al. 2010; McTigue and Dunton 2014, 2017). The marine photosynthetic
contribution could be particularly significant in the Hanna Shoal region (northeast
Chukchi shelf), where McTigue and Dunton (2014) recently documented unprecedented
high chlorophyll a concentrations in surface sediment samples.
Hypothesis 2: Marine, photosynthetically-derived organic matter (sympagic,
microphytobenthic, or pelagic) provides the dominant proportional contribution of EAAs
to benthic organisms in the Chukchi Sea.

4
Methods
Study Area/Sample Collection
Samples were drawn from a large archive (>5,000 samples) of benthic marine invertebrates taken
from the Chukchi and Beaufort Seas (Figure 2) during the BOEM-funded 2014 Transboundary
cruise in the Arctic Beaufort Sea (Figure 3) and the AMBON (Figure 4) and COMIDA-Hanna
Shoal (Figure 5) projects in the Chukchi Sea. The AMBON cruise report (Iken 2015) includes
detailed oceanographic information related to the project study area. For the Hanna Shoal
samples, we analyzed two bivalve genera (Astarte spp. and Macoma spp.) collected in 2012 and
2013 as part of the Hanna Shoal Ecosystem Study, an extension of the COMIDA CAB program.
Sampling stations were oriented around 72 °N, 162 °W in the Hanna Shoal region (Figure 5 and
Table 1). Samples were collected using a van Veen grab, then sorted, identified, and dried at
60°C onboard.
Figure 2: Locations of the Beaufort and Chukchi Seas and their major oceanographic influences (courtesy
of Seth Danielson). The black circle represents the approximate position of the Katie’s Floeberg feature as
described by Barrett and Stringer 1978.

5
Figure 3: Beaufort Sea region where archived benthic invertebrates were collected (Transboundary
project 2014).
Figure 4: Chukchi Sea region where archived benthic invertebrates were collected (AMBON project
2015).

6
Table 1: Longitudes and latitudes of stations with samples available from the COMIDA-Hanna Shoal
archives (from Kenneth Dunton).
Station lat long Station lat long Station lat long
E1-10 70.315 -147.732 H28 72.4006 -159.3462 H109 71.5 -159.512
E3-7 70.325 -147.649 H32 71.777 -159.007 H112 72.7937 -164.8982
CB05DSE-2 70.026 -145.259 H34 71.9874 -160.4038 H1 71.6513 -162.6365
DS4 70.025 -145.253 HS3 71.943 -162.6993 H3 71.8699 -162.0476
W3-9 70.376 -147.794 HS3 71.943 -162.6993 H3 71.8699 -162.0476
DS-11 70.322 -147.579 H112 72.7937 -164.8982 H4 72.5449 -162.2542
W3-9 70.376 -147.794 H112 72.7937 -164.8982 H10 72.303 -164.2588
H1 71.6513 -162.6365 UTX8 71.7255 -163.4562 H21 72.5213 -164.738
H3 71.8699 -162.0476 UTX8 71.7255 -163.4562 H21 72.5213 -164.738
H5 72.088 -161.7187 CBL11 72.1033 -165.4556 H24 71.6273 -164.7991
H6 72.1603 -163.5761 BARC10 71.62 -157.9305 H30 72.7425 -163.6716
H10 72.303 -164.2588 H4 72.5449 -162.2542 H37 71.553 -160.687
H10 72.303 -164.2588 H30 72.7425 -163.6716 H37 71.553 -160.687
H19 71.7144 -161.5679 H30 72.7425 -163.6716 H38 71.611 -159.36
H19 71.7144 -161.5679 H4 72.5449 -162.2542 CBL15 71.7274 -160.7183
H24 71.6273 -164.7991 H9 72.2189 -160.873 H17 71.9913 -163.3834
H6 72.1603 -163.5761 H9 72.2189 -160.873 H32 71.777 -159.007
H6 72.1603 -163.5761 H32 71.777 -159.007 UTX8 71.7255 -163.4562
H9 72.2189 -160.873 H33 71.8228 -159.7722 UTX8 71.7255 -163.4562
H17 71.9913 -163.3834 H33 71.8228 -159.7722 CBL11 72.1033 -165.4556
H17 71.9913 -163.3834 HS3 71.943 -162.6993 H17 71.9913 -163.3834
H28 72.4006 -159.3462 HS3 71.943 -162.6993
Figure 5: Hanna Shoal region where archived benthic invertebrates were collected (COMIDA-Hanna
Shoal).
7
We also wished to examine the relationship between shell and muscle EAA stable carbon
isotope fingerprints, which could allow this approach to be applied to ancient shells to
investigate long-term changes. For this purpose, we selected 13 Macoma calcarea samples (with
both shell and muscle materials present) to maximize the available geographic and isotopic range
based on bulk carbon isotope analyses. These archived samples had been collected with van
Veen grabs as part of the 2015 AMBON research cruise in the Chukchi Sea.
A suite of potential Arctic primary producers (endmembers) was compiled to compare
with published EAA stable carbon isotope fingerprints (Larsen et al. 2009, 2013; McMahon et al.
2016). SCUBA divers collected five red algae species (Coccotylus truncatus, Dilsea sp.,
Rhodomela sp., Odonthalia dentata, and Phycodrys sp.) and two kelp species (Laminaria
saccharina and Alaria esculenta) from 5–10 m water depth along the Beaufort Sea coast. Five
terrestrial plant species (Eriophorum angustifolium, Salix herbacea, Rhododendron
groenlandicum, Alnus sp., and Betula pendula) were collected from the University of Alaska
Fairbanks campus. Terrestrial samples and macroalgae were dried and pressed in a herbarium
press. Four Arctic diatom species (Skeletonema marinoii, Coscinodiscus sp., Porosira glacialis,
and Chaetoceros furallatus) were cultured for use in the study.
The cultured diatoms were isolated from water samples or germinated from spore-
containing sediment samples from the Barents Sea or the coast of northern Norway. Species
were identified by a combination of morphological and molecular methods. Stock cultures were
held in a climate-controlled room at the Norwegian College of Fishery Science, University of
Tromsø, at 5±0.5°C and 50 µmol m-2
s-1
scalar irradiance with a photoperiod of 14:10 hour
(light:dark) in Guillard’s f/250 marine water enrichment solution. Cultures were grown semi-
continuously in 100 L Plexiglas cylinders by diluting the cultures with fresh, nutrient-replete
culture medium once they reached the late exponential phase. The culture medium was prepared
from filtered (0.22 µm), pasteurized, local seawater (Tromsø Sound, 25 m depth) by adding
silicate (final concentration 12.3 µM) and a commercial, amino acid-free, nutrient mixture
(SubstralTM, 0.25 ml L-1
; The Scotts Company [Nordics] A/S, Denmark). All cultures were
aerated with compressed air to avoid sedimentation and CO2-limitation. Culture samples were
collected by concentrating cells onto a plankton net (mesh size 5–20 µm) before centrifuging at
3500 rpm for five minutes in a cooled centrifuge (4°C). The resulting wet pellets were
transferred into 50 ml Falcon tubes and stored at -80°C.
Bulk Stable Isotope Analysis
The elemental composition of shell, muscle, and endmember samples was determined by bulk
stable isotope analysis before proceeding with compound-specific isotope analysis. Endmember
samples were lyophilized for approximately 48 hours and weighed to 0.2–0.5 mg into tin
capsules for bulk stable carbon and nitrogen isotope analysis. The foot of each bivalve specimen
was removed, rinsed with deionized water, lyophilized, and powdered using a Wig-L-Bug®
grinding mill. The samples were then weighed to approximately 0.5 mg into tin capsules for bulk
stable carbon and nitrogen isotope analysis. The remaining powdered samples were lipid-

8
extracted by repeatedly soaking in 2:1 chloroform-methanol, decanting, and adding fresh
solution until the supernatant was clear (approximately three times per sample). The samples
were lyophilized and weighed to approximately 0.5 mg into tin capsules for bulk stable carbon
and nitrogen isotope analysis.
Whole shells were thoroughly scrubbed and rinsed with deionized water to remove
potential surface contaminants, which also resulted in the removal of the periostracum. Shells
were then powdered using a Wig-L-Bug® grinding mill. The powder was demineralized by
soaking in 6N HCl for ~24 hours, decanting, and adding fresh HCl until bubbling ceased.
Samples were then rinsed in deionized water to remove HCl until the pH was neutral, centrifuged
at 5000 rpm for 10 minutes, and lyophilized. The resulting organic matter was weighed to
approximately 0.5 mg into tin capsules for bulk carbon and nitrogen stable isotope analysis. Due
to small size, some shell samples were excluded from the bulk analysis to ensure that there
would be adequate material left for amino acid stable carbon isotope analysis (described below).
Bulk carbon and nitrogen samples were analyzed using continuous-flow isotope ratio
mass spectrometry on a Thermo Scientific Flash 2000 elemental analyzer interfaced via a
Thermo Scientific Conflo IV to a Thermo Scientific DeltaVPlus
Isotope Ratio Mass Spectrometer
(IRMS). Stable isotope ratios are reported in delta (δ) notation as ((Rsample
/ Rstandard
) –1) x
1000‰, where R is the ratio of heavy to light isotope. The standard for carbon was Vienna Pee
Dee Belemnite (VPDB), and the standard for nitrogen was air. Analytical error from multiple (n
= 22) analyses of an internal laboratory standard (peptone) was ≤0.3‰. Analyses were
performed at the Alaska Stable Isotope Facility at the University of Alaska Fairbanks (UAF).
Compound-specific Stable Carbon Isotope Analyses of Amino Acids
Lipid-extracted and lyophilized endmembers and bivalve muscle samples were weighed to
approximately 2.5–3.0 mg into 13 x 100 mm Pyrex VWR culture tubes with PFTE lined screw
caps. Some shell samples did not yield sufficient organic matter to weigh out to this sample
weight. For these specimens, all of the organic matter remaining after demineralization was used
for amino acid stable isotope analysis, and samples were concentrated down accordingly in the
final step of amino acid derivatization. One ml of 6N HCl was added to each sample before
flushing with N2 gas to remove oxygen. The samples were then hydrolyzed on a heating block at
110°C for 20 hours. After hydrolysis, samples were passed through a 0.2 µm Millex-GP filter
into new dram vials. Next, 25 µl of 0.1 mM norleucine was added to each sample as an internal
standard. Samples were dried on an N-evaporator in a 60°C water bath. To form amino acid
isopropyl esters, 2 ml of freshly prepared 2-propanol acidified with acetyl chloride was added to
each sample, and samples were heated to 110°C for 60 minutes. Samples were then dried on an
N-evaporator in a 60°C water bath and washed and evaporated twice with dichloromethane
(DCM). To acetylate the samples, 0.5 ml of DCM and 0.5 ml of trifluoroacetic anhydride were
added, and samples were heated to 100°C for 10 minutes. Samples were then dried on an N-
evaporator at room temperature and washed and evaporated twice with DCM. Finally, 250 µl of
DCM was added to each sample to transfer them to GC vials. A pure 12-amino acid standard of

9
equal concentrations of alanine (Ala), glycine (Gly), threonine (Thr), serine (Ser), valine (Val),
leucine (Leu), isoleucine (Ile), norleucine (Nle), proline (Pro), aspartic acid (Asp), glutamic acid
(Glu), and phenylalanine (Phe) was prepared concurrently, with each batch of samples using the
same methods described above to account for fractionation during preparation (O’Brien et al.
2002).
Derivatized samples were injected using an auto-sampler (Thermo-Scientific TriPlus
RSH) into an Agilent Single Taper Ultra Inert Liner (#5190-2293) held at 280°C for 2 minutes.
The compounds were separated on a Thermo TraceGOLD TG-200MS GC column (60 m x 0.32
mm x 0.25 um) installed on an Agilent 6890N gas chromatograph (GC) interfaced with a
Thermo Scientific DeltaVPlus
IRMS via a GC-III combustion (C) interface. The oven temperature
of the GC started at 50°C and heated at 15°C min-1
to 140°C, followed by 3°C min-1
to 152°C
and held for 4 minutes, then 10°C min-1
to 245°C and held for 10 minutes, and finally 5°C min-1
to 290°C and held for 5 minutes. Each sample was run in triplicate, and the average
reproducibility (1 standard deviation) across all amino acids from samples was ≤1‰. Average
reproducibility from all amino acids from the pure standards was ≤0.6‰. Average
reproducibility for the internal standard (norleucine) from all analyses was ≤0.7‰.
Data Analysis
Each amino acid δ13
Cvalue was corrected by subtracting the difference between the δ13
C value of
norleucine (the internal standard) from the same analysis (injection) and the average δ13
C value
of norleucine across all project analyses. In accordance with published protocols (O’Brien et al.
2002), amino acid δ13
C values were corrected for the carbon added as a result of derivatization.
The δ13
CEAA values were mean-centered (normalized) by subtracting each value from the average
of the δ13
CEAA values for that sample (Larsen et al. 2009). This allowed direct comparison of
δ13
CEAA patterns (“fingerprints”) among samples (Larsen et al. 2013).
Statistical analyses were performed in Microsoft Excel 2011 version 14.7.0 and R version
3.4.0 with RStudio interface version 1.0.143. Mixing models were generated (using R package in
simmr; Parnell et al. 2013) to estimate proportional contributions of primary producers to bivalve
EAAs. Phytoplankton endmember data generated in this study were used as mixing model inputs
because our data were more taxonomically constrained (i.e., all diatoms) than the literature
phytoplankton data. We also used terrestrial plant, red algae, and brown algae endmember data
generated in this study. Published data values (Larsen et al. 2009, 2013) were used for bacterial
endmembers because Arctic marine bacterial samples cultured on amino acid-free media were
unavailable to us. To compare bivalve shell and muscle δ13
CEAA fingerprints, the mixing model
was performed separately for the two tissue types. The δ13
CEAA values for bivalve shells and
muscle were also compared with paired t-tests to test the hypothesis that shell and tissue
endmember signatures were not different.
We used polynomial contrasts to evaluate whether the δ13
CEAA patterns of the
endmembers generated in this study were distinct and to assess how they compared with
previously published values of the same endmember categories (Larsen et al. 2009, 2013;

10
McMahon et al. 2016, 2018). These tests are critical as separation of endmember signatures is a
necessary condition for further analysis. Mixed models were used with dataset and EAA identity
as fixed factors and species by EAA interaction as the random factor. Significant interactions
between dataset and EAA identity were considered evidence that the datasets followed
statistically different patterns. We also performed a linear discriminant analysis (LDA) of the
endmember datasets (Larsen et al. 2009, 2013; McMahon et al. 2016, 2018) to test whether the
endmember categories were classified differently, regardless of any statistical differences
detected between published and generated endmember data.

11
Results
The EAA fingerprinting data generated in this study were compared to a previously published
database of amino acid fingerprints from primary production sources (Larsen et al. 2009, 2013)
to identify amino acid sources for the tested benthic organisms. Eleven amino acids were
resolved successfully for all samples: alanine (Ala), glycine (Gly), threonine (Thr), serine (Ser),
valine (Val), leucine (Leu), isoleucine (Ile), proline (Pro), aspartic acid (Asp), glutamic acid
(Glu), and phenylalanine (Phe). Of these, we focused on the EAA (Thr, Val, Leu, Ile, Phe)
because they are not synthesized by animals and must be derived from sources of primary
production without significant fractionation.
Endmember Results
To validate the use of the Arctic diatom species endmembers as a model input for making
estimates of diet proportions of Arctic bivalves, we tested how model results would change with
differing endmember values. Three mixing model runs (sensitivity tests) were conducted using
different datasets (Table 2). Dataset 1 included only published (literature) data (Larsen et al.
2009, 2013; McMahon et al. 2016, 2018). Dataset 2 included values generated from this study
for Arctic diatoms (used as the phytoplankton –diatom endmember), Arctic red algae, Arctic
brown algae and Arctic terrestrial matter (Rowe et al. in press) and published bacterial
endmember values (Larsen et al. 2009, 2013; McMahon et al. 2016, 2018). Dataset 3 pooled both
published and newly generated values for endmember inputs. The Hanna Shoal bivalve EAA
δ13
C values were used as inputs for the mixing model sensitivity tests to estimate the
proportional contributions of the endmembers to the diets of these bivalves. The outputs of the
three different models were then compared to examine the effects of endmember source
differences.
Overall, these sensitivity tests confirmed that the phytoplankton values were driving most
of the differences in the estimates of proportional contributions from different sources between
the models (Table 3). Based also on the LDA results (Figure 6), which showed that our Arctic
diatoms (phytoplankton) were more distinct than the taxonomically diverse data set present by
Larsen et al. (2009, 2013), we were justified in using Dataset 2 (our cultured Arctic
phytoplankton data and published bacteria endmember data) in the mixing models presented
here. Phytoplankton was estimated to make up the largest proportional contribution of EAA in
our test series of Macoma sp.
12
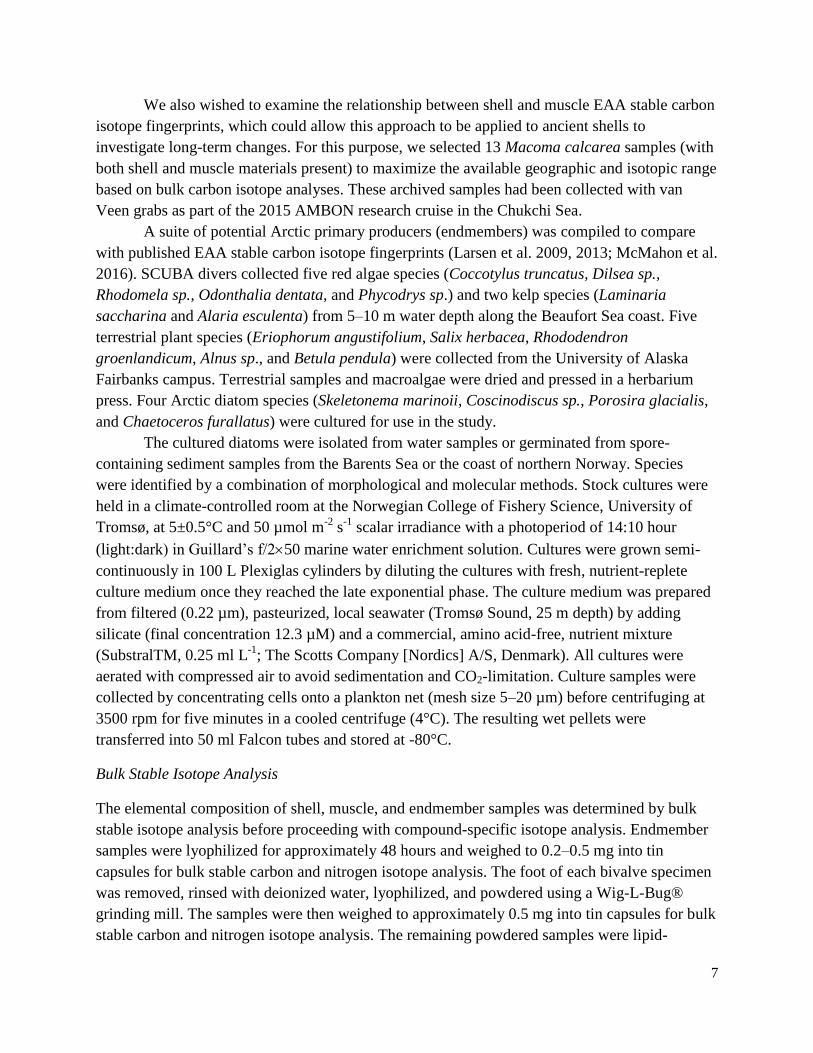
Table 2: Datasets used for mixing model endmember inputs. δ13
CEAA values have been centered to the
mean values of all five EAAs per data set and are expressed in per mil (‰).
Dataset 1
Endmember Thr Val Leu Ile Phe
Red algae -8.9±2.2 2.0±1.5 3.9±0.9 -0.7±1.0 3.7±0.7
Brown algae -13.3±3.7 2.6±1.1 6.5±1.2 0.2±1.6 4.0±1.4
Phytoplankton -10.7±2.0 2.7±1.0 5.7±1.2 -1.9±1.5 4.1±1.0
Bacteria -4.8±3.4 1.5±1.5 0.2±1.0 -0.1±1.2 3.1±1.6
Terrestrial plants -13.9±2.2 5.1±0.8 7.9±1.1 -0.1±0.9 0.9±1.3
Dataset 2
Endmember Thr Val Leu Ile Phe
Red algae -9.8±2.7 2.1±0.4 3.2±1.5 0.2±1.1 4.3±1.7
Brown algae -15.8±1.0 2.3±0.3 8.9±0.2 -1.3±1.4 5.9±0.8
Phytoplankton -15.0±3.0 4.8±0.8 11.6±1.4 -5.6±1.3 4.2±1.7
Bacteria -4.8±3.4 1.5±1.5 0.2±1.1 -0.1±1.2 3.1±1.6
Terrestrial plants -10.7±3.3 6.5±1.3 6.7±1.1 -0.7±2.6 -1.8±1.7
Dataset 3
Endmember Thr Val Leu Ile Phe
Red algae -9.1±2.3 2.0±1.3 3.7±1.1 -0.5±1.0 3.8±1.0
Brown algae -13.6±3.5 2.5±1.0 6.8±1.4 0.0±1.7 4.3±1.5
Phytoplankton -11.1±2.6 2.9±1.2 6.3±2.4 -2.3±2.1 4.2±1.1
Bacteria -4.8±3.4 1.5±1.5 0.2±1.1 -0.1±1.2 3.1±1.6
Terrestrial plants -13.3±2.6 5.4±1.0 7.7±1.2 -0.2±1.3 0.4±1.7
Table 3: Mixing model results (dietary proportions) based on EAA fingerprints for endmember-source
dataset sensitivity tests. Values are expressed in percent plus or minus the standard deviation.
Endmember Dataset 1 Dataset 2 Dataset 3
Red algae 2±2 3±2 5±3
Brown algae 3±2 2±1 7±4
Phytoplankton 48±5 54±2 46±7
Bacteria 1±1 33±2 3±2
Terrestrial plants 46±4 8±3 39±4
The LDA confidence ellipses for terrestrial plants, bacteria, red algae, brown algae, and
Arctic phytoplankton did not overlap with those of any other endmembers, indicating that these
endmembers were distinct from each other (Figure 6) and satisfying the condition that sources
used for stable isotope diet reconstructions should have significantly different values. With this
condition met, we proceeded with using these endmember data to generate mixing models.
However, the confidence ellipses of brown algae and phytoplankton using literature values did
overlap, suggesting that these endmember sources may need further investigation or combining
(Figure 6). Furthermore, the dataset by EAA interaction of the polynomial contrasts was

13
significant (p<0.0001) for all parameters investigated except brown algae. This finding indicated
that there were subtle differences in how values changed between EAAs by dataset for each
endmember category, despite the similarity of general fingerprints of the same endmember
categories from different datasets.
Figure 6: Linear discriminant analysis based on the mean-centered δ
13CEAA values (Thr, Val, Leu, Ile,
Phe) of all endmembers (McMahon et al. 2006, 2016, Larsen et al. 2009, 2013). The crosses indicate the
mean value plus the standard ellipses for each primary production source of the same color (redrawn from
Rowe et al., in press).
Hanna Shoal Region
Estimated dietary proportions of Hanna Shoal Astarte spp. and Macoma spp. samples from the
mixing model are presented in Figures 7 and 8. The highest source contributions were from
phytoplankton and bacteria for both genera, though the absolute proportions varied.
Phytoplankton was estimated to contribute a higher proportion to EAAs of Astarte spp. than to
Macoma spp. There were slightly higher contributions of bacteria and terrestrial plants to
Macoma spp.

14
Figure 7: Astarte spp. (a) and Macoma spp. (b) sampling locations and estimated dietary contributions in
Hanna Shoal individuals (simmr solo runs) (redrawn from Rowe et al., in press).

15
Figure 8: Proportional contributions of diet sources to Astarte spp. (a) and Macoma spp. (b) from Hanna
Shoal as modeled by simmr (redrawn from Rowe et al., in press).
Chukchi Region
Estimated dietary proportions in the Chukchi Sea samples are presented in Figures 9–18. The
proportional contributions of the different EAA sources varied according to species and by
location. Buccinum sp. Alcyonidium sp. Anonyx sp. and Macoma sp. all showed high
contributions from a terrestrial source at most locations sampled. In this regard, the findings were
similar to the results from the Hannah Shoal, which indicated a large contribution of terrestrially
derived EAAs at some stations. Macoma spp. was common to both Hannah Shoal and Chukchi
Sea samples. For both regions, Macoma spp. samples reflected high contributions of terrestrial-
derived EAAs, which could have originated from coastal inputs. Essential amino acids from
phytoplankton and bacteria made major contributions to Argis sp. Eualus sp. Chionoecetes sp.
and Maldanidae sp. No relationships for amino acid sources vs. water depth were defined due to
the relatively uniform depth gradient in the sample area.
An unexpected result came from the analyses of echinoderms (e.g., Ophiocten sericeum)
from Hanna Shoal and Chukchi Sea samples; echinoderms from both regions had a very limited
number of amino acids. To our knowledge, ours was the first analyses of this kind for
echinoderms, so we only speculate that this finding reflects an unknown taxon-specific
biochemical issue.

16
Figure 9: Anonyx sp. (amphipod) locations and estimated dietary contributions in the Chukchi Sea
individuals (simmr solo runs).
Figure 10: Argis sp. (shrimp) locations and estimated dietary contributions in the Chukchi Sea individuals
(simmr solo runs).

17
Figure 11: Buccinum sp. (sea snail) locations and estimated dietary contributions in the Chukchi Sea
individuals (simmr solo runs).
Figure 12: Chionoecetes sp. (snow crab) locations and estimated dietary contributions in the Chukchi Sea
individuals (simmr solo runs).

18
Figure 13: Eualus sp. (shrimp) locations and estimated dietary contributions in the Chukchi Sea
individuals (simmr solo runs).
Figure 14: Macoma sp. (clam) locations and estimated dietary contributions in the Chukchi Sea
individuals (simmr solo runs).

19
Figure 15: Alcyonidium sp. (bryozoan) locations and estimated dietary contributions in the Chukchi Sea
individuals (simmr solo runs).
Figure 16: Serripes sp. (clam) locations and estimated dietary contributions in the Chukchi Sea
individuals (simmr solo runs).

20
Figure 17: Nuculana sp. (clam) locations and estimated dietary contributions in the Chukchi Sea
individuals (simmr solo runs).
Figure 18: Maldanidae sp. (worm) locations and estimated dietary contributions in the Chukchi Sea
individuals (simmr solo runs).
21
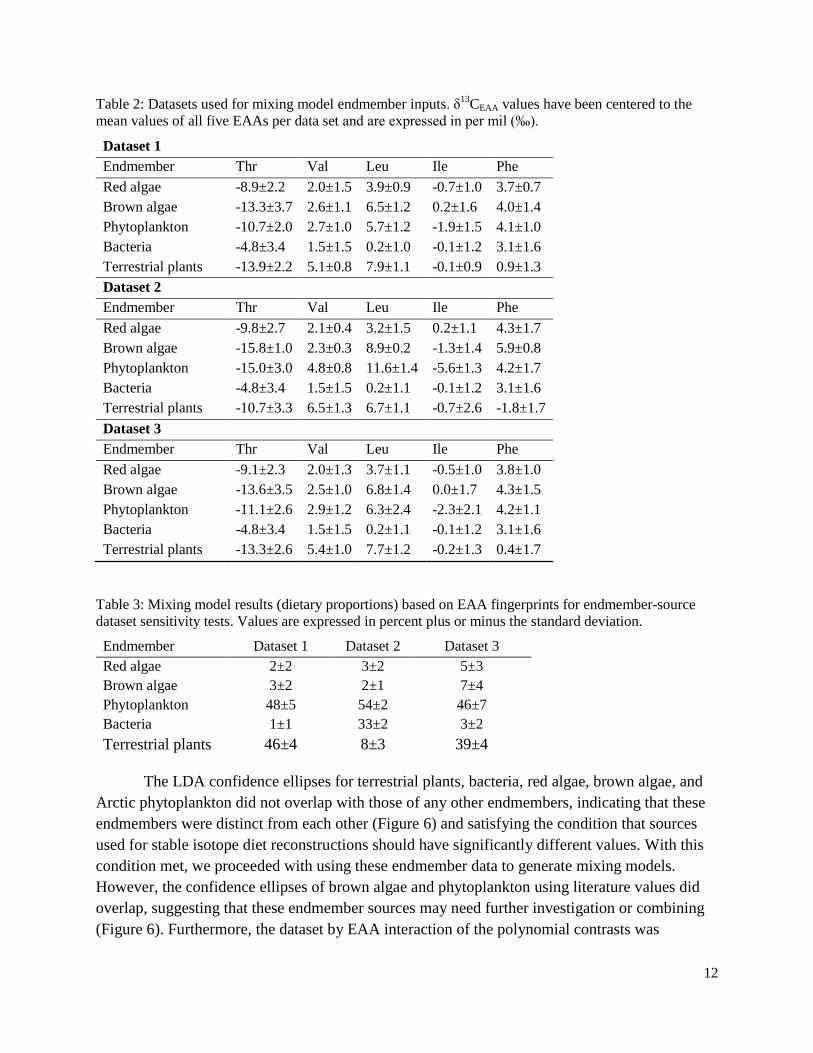
Beaufort Region
Estimated dietary proportions in the Beaufort Sea samples are presented in Figures 19–22. The
source contributions varied by species, and bacterial EAA contributions were higher in many of
the Beaufort Sea samples compared with those from the Hanna Shoal and Chukchi Sea regions.
Samples from deeper locations had a greater contribution of bacterial EAAs.
Figure 19: Eualus sp. (shrimp) locations and estimated dietary contributions in the Beaufort Sea
individuals (simmr solo runs).

22
Figure 20: Astarte spp. (clam) locations and estimated dietary contributions in the Beaufort Sea
individuals (simmr solo runs).

23
Figure 21: Sabinea sp. (shrimp) locations and estimated dietary contributions in the Beaufort Sea
individuals (simmr solo runs).

24
Figure 22: Bathyarca sp. (bivalve) locations and estimated dietary contributions in the Beaufort Sea
individuals (simmr solo runs).

25
Leucine to Isoleucine Index
Beaufort Sea samples represented a range of sampling water depths, so it was possible to
examine the isoleucine to leucine index (ratio of one to the other, Larsen et al. 2009, 2013) as a
marker of bacterial contribution (i.e., a higher ratio indicates a higher relative contribution of
bacterially derived amino acids). The isoleucine to leucine index for both Sabinea
septemcarinata and Astarte spp. showed significant increases along an exponential-linear
relationship with the water depth (Figure 23 and 24), though both organisms did not cover the
complete depth range. No linear relationship was evident for Eualus sp. vs. depth, and the index
was highly variable within and between depth brackets above ~ 400 m water depth for this
organism (Figure 23). Astarte spp. had the lowest isoleucine to leucine values, at water depths of
<50 m.
We found that the isoleucine to leucine index values of our phytoplankton endmembers
were the lowest of all the sources we tested, while the bacteria values were the highest, which is
consistent with the previous findings of Larsen et al. (2009, 2013). This finding indicates that the
isoleucine to leucine index is useful as an indicator of the contribution of both phytoplankton and
bacteria when one source is low and the other is high. For example, the index showed increasing
bacterial contributions with depth in Astarte spp. This was consistent with the mixing model
results for Astarte spp., which indicated that bacterial contributions of EAAs increased from
~10% at the shallowest depths sampled (~25 m) to ~50% at the deeper depths (200 m – 500 m).
The increase in bacterial contributions with depth correlated with a decrease in phytoplankton
contributions. In the shallowest sampling locations, phytoplankton contributed up to 50% in
Astarte spp. but dropped to ~25% beyond 100 m (Figure 25).
Figure 23: Leucine to isoleucine indexes of inverts from the Beaufort Sea vs. station depth (±1 SD).

26
Figure 24: Leucine to isoleucine indexes of Astarte spp. from the Beaufort Sea vs. station depth.
Figure 25: Proportional contributions of bacterial (a) and phytoplankton (b) EAAs vs. water depth for
Astarte spp. from the Beaufort Sea (error bar ± 1 SD).

27
Shell vs. Muscle Comparison
Before lipid extraction, the bulk δ13
C values of individual shell samples of Macoma calcarea
were significantly different from their corresponding muscle samples (paired 2-sample t-test,
p<0.002). After lipid extraction of the muscle, the bulk δ13
C values of the two tissue types were
not significantly different (paired 2-sample t-test, p=0.479). The mean C:N value of organic shell
materials was 3.9 (±0.2).
The relationship between shell and muscle 13
CEAA values was tightly correlated and
close to a 1:1 line (y = 0.85x, R² = 0.91), suggesting similar values of EAA across tissues and
similar patterns in the EAA fingerprints (Figure 26a). However, δ13
C values of Thr, Val, and Ile
were significantly different across tissue types (paired 2-sample t-tests, all p<0.003) (Figure
26b). The model estimated phytoplankton and bacteria as the two highest-ranking EAA sources
to Macoma calcarea muscle (Table 4). When using shell values from the same individuals, the
model also estimated phytoplankton as the highest dietary proportion, but the subsequent
rankings differed with terrestrial plants ranked second, and bacteria ranked last (Table 4).
Figure 26: Shell and muscle centered average amino acid δ
13C values for Macoma calcarea plotted
against each other (a) and on the same axis by amino acid (b) (error bar ±1 SD).
Table 4: Mixing model dietary proportion estimates based on EAA fingerprints for Macoma calcarea
muscle and shell samples. Values are expressed in percent (%).
Endmember muscle shell
Phytoplankton 59±10 43±6
Terrestrial plants 5±4 26±5
Brown algae 9±9 19±8
Red algae 9±7 7±4
Bacteria 19±7 5±3

28
Figure 27: Proportional contributions of diet sources to Macoma calcarea muscle (a) and shell (b) as
modeled by simmr.
29
Discussion
Endmember Results
In comparisons between our endmembers and literature values, most endmembers of the same
category had very similar EAA isotope fingerprints, despite some statistical differences. These
patterns were apparent even over a wide geographic spread. For example, the fingerprints of
Arctic red algae analyzed in this study and tropical red algae (McMahon et al. 2016) were
remarkably similar. This finding was consistent with previously published conclusions (Larsen et
al. 2009, 2013) that EAA isotope fingerprints of primary producers are taxon-specific, driven by
broad and deep phylogenetic differences in amino acid synthesis rather than environmental and
geographic differences. However, there were slight differences in fingerprints between datasets,
most notably for phytoplankton. The differences in phytoplankton values from different datasets
had some effects on our mixing model results. While our results suggest that phylogenetically
close endmember groups such as red algae, brown algae, or terrestrial plants produce consistent
EAA isotope fingerprints regardless of location, “phytoplankton,” as characterized here, is a
metabolically and taxonomically diverse functional group and species compositions can change
dramatically with location, environmental conditions, and time.
Similarly, bacteria are very diverse in EAA synthesis, and these pathways are not yet well
understood. Categorizing primary production sources with common broad groupings like
“phytoplankton” and “bacteria” is useful for simplicity but could mask differences in levels of
diversity within these groups. For example, the Larsen et al. (2013) microalgae category
(equivalent to our phytoplankton category) contained samples of both cyanobacteria and
diatoms. However, diatoms are taxonomically much closer to brown algae, which were classified
as a separate category in Larsen et al. (2013). The phytoplankton cultures used in this study were
from specific species of diatoms. Therefore, we suggest that continued efforts need to be made to
determine endmember values by increasing phylogenetically consistent representation, especially
concerning phytoplankton and bacteria.
Hanna Shoal and Chukchi Sea Regions
Our mixing models showed that phytoplankton is the most important contributor of EAAs to
Hanna Shoal bivalves. This finding was consistent with our Hypothesis 2 and observations of
highly productive phytoplankton blooms in the region (Arrigo et al. 2014; Arrigo and van Dijken
2015). Additionally, the phytoplankton endmembers in the models encompass ice algae, which
are largely composed of diatoms (Budge et al. 2008). Therefore, these results may also reflect a
contribution of ice algae as a food source for bivalves, as has been suggested for various species
(McMahon et al. 2006; Dunton et al. 2017). The Hanna Shoal bivalve model estimated that
bacteria made up the next highest proportion of bivalve EAAs, which may reflect the reworking
and ecological availability of more refractory organic matter.
Surprisingly, the model estimated larger diet contributions of terrestrial organic matter to
Hanna Shoal bivalves than brown algae or red algae, particularly to Macoma spp. This is
30
difficult to explain geographically, as Hanna Shoal is far offshore. Sediment-laden ice sheets,
transported by the Beaufort Gyre into the western Beaufort Sea and Chukchi Sea, may be one
pathway for the introduction of terrestrial organic matter to this region (Babb et al. 2013). During
their westward transport, these large ice sheets can get trapped behind Katie's Floeberg, a
shallow-water feature on top of Hanna Shoal (Barrett and Stringer 2006). As the ice melts,
sediments containing terrestrial organic matter could collect around Hanna Shoal. However, this
mechanism would require that tidewater glaciers entrain large amounts of terrestrial organic
matter for transfer to the Hanna Shoal. A more plausible explanation is that Hanna Shoal is
located downstream of sediment-laden ice that entrains significant amounts of sediment and
terrestrial organic matter and is advected out of shallow waters in the Beaufort and Chukchi Seas
(Eicken et al. 2005). The terrestrial organic matter is released to the Hanna Shoal benthos when
the ice melts. Another scenario is the advection of river-derived organic matter with currents
running adjacent to Hanna Shoal (Feder et al. 1994).
There also appeared to be some source differences between the two bivalve species we
investigated. Phytoplankton was estimated to contribute a higher proportion of EAAs to Astarte
spp. than to Macoma spp., while terrestrial organic matter and bacteria were estimated to
contribute less to Astarte spp. The differences in endmember contributions are likely due to
different feeding modes. As suspension feeders, Astarte spp. filter particles from the water
column. In contrast, Macoma spp. are surface deposit feeders and extract organic matter from
ingested surface sediments (Macdonald et al. 2010). This may allow Macoma spp. to take
advantage of a wider range of deposited organic matter sources (Young et al. 2017) and consume
more bacteria in deposited carbon.
The mixing models showed that phytoplankton and terrestrial derived EAAs were, in
most cases and at most locations, the dominant contributors of EAAs to Chukchi Sea
invertebrates. As in the Hanna Shoal region, this finding is also supported by observations of
highly productive phytoplankton blooms and terrestrial organic material inputs in the region
(Arrigo et al. 2014; Arrigo and van Dijken 2015). Additionally, the phytoplankton endmembers
in the models encompass ice algae, which are largely composed of diatoms (Budge et al. 2008).
Therefore, these results may also reflect a contribution of ice algae as a food source, as has been
suggested for various arctic bivalve species (McMahon et al. 2006; Dunton et al. 2017). Marine
photosynthetic sources could include ice algae, open-ocean phytoplankton, and the
microphytobenthos. The mixing models using amino acid fingerprinting are not able to
distinguish the contribution of ice algae vs. open-ocean phytoplankton; however, we have
previously used compound-specific carbon isotope analyses of fatty acids to do so. Applying
compound-specific amino acid and fatty acid analyses on the same sample would allow
determination of the proportional contribution of marine photosynthetic sources as a whole
(based on the amino acids) vs. other sources (e.g., terrestrial and bacterial) and the proportional
contribution of ice algae vs. phytoplankton (based on the fatty acids).
31
Beaufort Region
In contrast to the Chukchi Sea and Hanna Shoal samples, the Beaufort Sea samples indicated a
greater contribution of EAAs from sources other than phytoplankton and terrestrial organic
matter. The Beaufort benthic food web may be particularly sensitive to environmental changes
(Divine et al. 2015). Low redundancy and high trophic separation make the ecosystem less
effective at responding to changes in environmental conditions (Divine et al. 2015). Compared to
the Chukchi Sea, the Beaufort Sea is more nutrient-poor, the pelagic-benthic coupling is weaker,
and the ice algae contribution is an order of magnitude smaller (Dunton et al. 2005, 2006).
Consequently, benthic invertebrate communities in the western Beaufort rely on terrestrial
organic matter inputs and the advection of allochthonous carbon from the Chukchi Sea (Divine et
al. 2015). These sources of organic matter are more refractory than fresh primary production and
are likely to shift in abundance due to changing hydrographic patterns and increased freshwater
inputs brought upon by climate change (Divine et al. 2015). Energy flow through the system
could be altered as the proportions of different organic matter sources delivered to benthic food
webs in the Arctic change (Iken et al. 2010; McTigue and Dunton 2014; Divine et al. 2015;
Kedra et al. 2015; McTigue et al. 2015).
Consistent with Hypothesis 1, there appeared to be a greater contribution of bacterial and
macroalgal sources of EAAs in the invertebrates from the Beaufort region. Water depth also
appeared to be an influence on the source of the proportional contributions, with an increased
contribution of bacterial-derived EAAs observed at greater water depth. This finding was evident
in both the isoleucine to leucine index, used as a proxy for bacterial contributions (Larsen et al.
2009, 2013), and the mixing model results from the Astarte spp. samples. The mixing model
results also showed a decrease in the contribution of phytoplankton with an increase in water
depth.
Terrestrial organic matter has typically been considered an inferior carbon source for
marine consumers (Schell 1983), but results from bulk stable isotope analyses of benthic
ecosystems in the Beaufort Sea indicate that terrestrial carbon may be utilized in marine benthic
food webs in significant amounts, possibly after microbial processing (Dunton et al. 2006;
Garneau et al. 2009; Divine et al. 2015). Permafrost melting and increased river discharge
influence the delivery of terrestrial organic matter into the marine system, as in the area of the
Mackenzie River Delta in the eastern Beaufort Sea (McClelland et al. 2014) and many smaller
river systems in the western Beaufort (Dunton et al. 2006).
We are not certain why we did not observe larger terrestrial signal in the samples
collected in the Beaufort Sea, where there is extensive landfast ice and large volumes of
sediment deposition. However, the large contributions of bacterial-derived amino acids to
individuals sampled from the region could be fueled by terrestrial organic matter. The depth
gradient in the Beaufort may add distance and time between input and consumption, allowing
time for bacteria to act on the terrestrial organic matter. In theory, break down of terrestrial
organic matter should result in the conversion of organic matter from terrestrial form to bacterial
form. We are unable to distinguish autotrophic vs. heterotrophic bacterial production using this

32
method. The mixing model results provide estimates of the proportional contribution of the
different sources of EAAs to benthic organisms and are not a proxy for source materials being
deposited on the sediment.
We did not find obvious spatial trends in the proportional contribution of terrestrial
sources. This was surprising, as we had expected that the influences of the Mackenzie River or
coastal erosion might be evident at stations closest to them, or along water currents carrying
these potential sources of terrestrial organic matter. Instead, terrestrial organic matter was
estimated to contribute a relatively small proportion to most samples in the Beaufort, regardless
of location. We hesitate to jump to the conclusion that terrestrial sources are unimportant to the
Beaufort benthos. For instance, it has previously been shown that terrestrial organic matter is
heavily utilized by fish in Beaufort lagoons (Dunton et al. 2006). Our results may indicate that
terrestrial organic matter is reworked by bacteria before it can be consumed by benthic
invertebrates (Garneau et al. 2009).
Shell vs. Muscle Comparison
The EAA isotope fingerprints of Macoma calcarea shell and muscle were very similar. The
mixing model results of using the EAA isotope fingerprints from these two tissue types both
identified phytoplankton as the highest contributor to the bivalves’ EAAs. This similarity
indicates that shells can be used to estimate the proportional contributions of the dominant source
of EAAs to the diets of bivalves when soft tissues are not available for analyses. However, the
model results for the other dietary sources differed in estimated proportion and the relative
ranking of their importance between the two tissue types; possibly because the formation of soft
tissues and shell organics represent different time frames within the lifetime of a bivalve (Misarti
et al. 2017). Due to the minute organic matter fraction in each shell, and potentially irregular
growth bands (Moss et al. 2018), we homogenized whole shells to yield enough sample for
analysis. This resulted in time-averaging the lifespan of the bivalves while muscle tissue would
likely have a shorter temporal window, which may explain some of the offset between shell and
muscle isotopic values.
Future research efforts could be dedicated to a long-term controlled feeding study of
bivalve species to identify the factors causing differences between EAAs in shells and muscle.
After the relationship between shell and muscle fingerprints are refined, either by applying a
correction based on the differences for certain EAAs we have observed or from the results of
feeding studies, research directions could include analyses of archaeological bivalve remains
(i.e., from archeological middens) or death assemblages to establish a pre-industrial baseline.
Patterns of amino acid δ15
N values of modern bivalve shells are consistent with archaeological
shell samples of the same taxa (Misarti et al. 2017), suggesting that amino acid δ13
C patterns are
likely consistent as well. The similarities in the estimates of the proportional contributions of
phytoplankton to bivalves using either shell or muscle samples indicate that archived Macoma
spp. shells could be used to investigate changes in the proportional contribution of phytoplankton
over time. This would be a valuable parameter to examine given predictions for phytoplankton

33
biomass to increase in the future and the likelihood that it has changed in the past. Identifying
how organic matter pathways have changed both in recent years and over longer (millennial)
timescales will yield a better understanding of how current changes are altering the Arctic
ecosystem.

34
Conclusions
We found that the EAA isotope fingerprinting method can be used to distinguish sources of
Arctic primary producers to two invertebrate species. However, this method is limited in its
resolution and cannot separate taxonomically similar endmembers. For example, the importance
of ice algae to the diets of the bivalves in this study remains obscured by the inability to
distinguish them from pelagic phytoplankton, as both are composed largely of diatoms. This
problem might be resolved by completing stable carbon isotope analyses of EAAs and fatty acids
on the same samples. Stable carbon isotope analyses of fatty acids, coupled with fatty acid
profiling, has been successfully used at high-latitude marine locations to determine the
proportional contribution of ice algal-derived fatty acids. Based on prior fatty acid stable carbon
isotope data, the proportional contribution of ice-derived particulate organic matter to Bering Sea
bivalve species Macoma calcarea and Nuculana radiata has been estimated to be as high as 47%
(Oxtoby et al. 2016), suggesting that it may be a highly important food source to bivalves in the
Chukchi Sea as well.
Results from this study indicate that phytoplankton and terrestrial sources were the most
important sources of EAAs to the invertebrate samples from Hanna Shoal and the Chukchi Sea.
Bacterial and macro-algal sources made high contributions to invertebrates in the Beaufort Sea,
and bacterial sources seemed to make a higher proportional contribution to species with
increasing water depth. Bacteria were also the second most important source to the invertebrates
investigated from Hanna Shoal and the Chukchi Sea, so it is clear that bacteria are certainly an
important contributor of EAAs throughout the entire region. Mixing model estimates of
individual invertebrate samples showed that terrestrial organic matter contributed a substantial
dietary proportion to some individuals in the Hanna Shoal and the Chukchi Sea, particularly in
Macoma spp.
Paired shell and muscle samples from Macoma calcarea had similar EAA carbon stable
isotope fingerprints, with differences in some amino acids that may reflect the different time
frames recorded in the two tissue types. Mixing models run with the muscle and shell values
revealed phytoplankton to be the highest contributing source of EAAs to both shell and muscle
samples of Macoma calcarea.
Overall, our results indicate that amino acid fingerprinting shows considerable potential
for tracking changes in essential amino acid sources in the Arctic marine environment.
Acknowledgments
This study was funded through the Coastal Marine Institute/BOEM with cost-share funding from
the University of Alaska Fairbanks. We thank Kenneth Dunton (Texas A&M) for contributing
samples from Hanna Shoal, Martina Uradnikova and Renate Døving Osvik (UiT Norway's
Arctic University) for supplying us with phytoplankton cultures, and Arny Blanchard (UAF) for
assistance with statistics. We also thank Ann-Christine Zinkann and Kyungcheol Choy (UAF)
for preparing and analyzing samples from the Chukchi Sea and Beaufort Sea regions,
respectively, and Kate Wedemeyer and Warren Horowitz (BOEM) for valuable input.

35
Study Products
Audrey Rowe, Arny Blanchard, Katrin Iken, Diane O’Brien, Martina Uradnikova, Renate
Døving Osvik, Matthew Wooller (In Press). Estimates of primary production sources to Arctic
bivalves using amino acid stable carbon isotope fingerprinting. Stable Isotopes in Environmental
and Health Studies.
Ann-Christine Zinkann, Katrin Iken, Diane O’Brien, Matthew Wooller (2019). Digging Deep:
Depth distribution and utilization of carbon sources in the Chukchi Sea sediments. Oral
presentation, Benthic Ecology Conference, Newfoundland, Canada.
Ann-Christine Zinkann, Katrin Iken, Diane, O’Brien, Matthew Wooller (2019). Digging Deep:
Depth distribution and utilization of carbon sources in the Chukchi Sea sediments. Oral
presentation, Alaska Marine Science Symposium, Anchorage, Alaska.
Matthew Wooller, Katrin Iken, Audrey Rowe, Arny Blanchard, Diane O’Brien (2019).
Identifying sources of organic matter to benthic organisms in the Beaufort. Poster presentation,
Alaska Marine Science Symposium, Anchorage, Alaska.
Matthew Wooller, Katrin Iken, Audrey Rowe, Arny Blanchard, Diane O’Brien (2019).
Identifying sources of organic matter to benthic organisms in the Beaufort. Oral presentation,
CMI Annual Research Review, Anchorage, Alaska.
Audrey Rowe, Arny Blanchard, Katrin Iken, Diane O’Brien, Matthew Wooller (2018).
Developing stable isotope fingerprinting of bivalve shells to detect long-term changes in organic
matter sources into the Arctic marine ecosystem. Poster presentation, Alaska Marine Science
Symposium, Anchorage, Alaska.
Matthew Wooller, Katrin Iken, Audrey Rowe, Arny Blanchard, Diane O’Brien (2018).
Identifying sources of organic matter to benthic organisms in the Beaufort. Oral presentation,
CMI Annual Research Review, Anchorage, Alaska.
Audrey Rowe, Arny Blanchard, Katrin Iken, Diane O’Brien, Martina Uradnikova, Renate
Døving Osvik, Matthew Wooller (2018). Stable carbon isotope amino acid fingerprinting of
shells from two Arctic clam genera to track primary production sources. Poster presentation,
ISOECOL, Viña Del Mar, Chile.
Audrey Rowe (2018). Estimates of primary production sources to Arctic bivalves using amino
acid stable carbon isotope fingerprinting. MSc Thesis, College of Fisheries and Ocean Sciences,
University of Alaska Fairbanks, Fairbanks, Alaska.
Matthew Wooller, Arny Blanchard, Ann Christine Zinkann, Kyungcheol Choy, Katrin Iken,
Diane O’Brien, Audrey Rowe (2018). Determining primary production sources to benthic
organisms in the Arctic using stable isotope fingerprinting. Oral presentation, Alaska Marine
Science Symposium, Anchorage, Alaska.
36
Ann-Christine Zinkann, Katrin Iken, Diane O’Brien, Matthew Wooller (2018). Identifying the
sources of amino acids to benthic invertebrates across the Chukchi Sea shelf using compound-
specific stable isotope analyses. Poster presentation, Alaska Marine Science Symposium,
Anchorage, Alaska.
Audrey Rowe, Katrin Iken, Diane O’Brien, Matthew Wooller (2017). Analyzing shifts in the
base of the Arctic marine food web using amino acid stable isotope fingerprinting. Oral
presentation, Water and Environmental Research Center, University Seminar Series, Fairbanks,
Alaska.
Ann-Christine Zinkann, Katrin Iken, Diane O’Brien, Matthew Wooller (2018). Contribution of
microbially-derived carbon to benthic invertebrates across the Chukchi Sea shelf using amino
acid specific stable isotope analyses. Oral presentation, Ocean Science Meeting, Portland,
Oregon.

37
References
Arrigo KR, Perovich DK, Pickart RS, et al (2014) Phytoplankton blooms beneath the sea ice in
the Chukchi Sea. Deep Res Part II Top Stud Oceanogr. doi: 10.1016/j.dsr2.2014.03.018
Arrigo KR, van Dijken GL (2015) Continued increases in Arctic Ocean primary production.
Prog Oceanogr. doi: 10.1016/j.pocean.2015.05.002
Babb DG, Galley RJ, Asplin MG, et al (2013) Multiyear sea ice export through the Bering Strait
during winter 2011-2012. J Geophys Res Ocean. doi: 10.1002/jgrc.20383
Barrett SA, Stringer WJ (2006) Growth mechanisms of “Katie’s Floeberg.” Arct Alp Res. doi:
10.2307/1550744
Barrett SA, Stringer WJ (1978) Growth Mechanisms of "Katie's Floeberg." Arct Alp Res. doi:
10.1080/00040851.1978.12004015.
Bentzen TW, Follman EH, Amstrup SC, et al (2007) Variation in winter diet of southern
Beaufort Sea polar bears inferred from stable isotope analysis. Can J Zool. doi:
10.1139/Z07-036
Bentzen TW, Shideler RT, O’Hara TM (2014) Use of stable isotope analysis to identify food-
conditioned grizzly bears on Alaska’s North Slope. Ursus. doi: 10.2192/ursus-d-13-
00002.1
Budge SM, Wooller MJ, Springer AM, et al (2008) Tracing carbon flow in an arctic marine food
web using fatty acid-stable isotope analysis. Oecologia. doi: 10.1007/s00442-008-1053-7
Divine LM, Iken K, Bluhm BA (2015) Regional benthic food web structure on the Alaska
Beaufort Sea shelf. Mar Ecol Prog Ser. doi: 10.3354/meps11340
Dunton KH, Grebmeier JM, Trefry JH (2017) Hanna Shoal: An integrative study of a High
Arctic marine ecosystem in the Chukchi Sea. Deep Sea Res Part II Top Stud Oceanogr.
doi: 10.1016/j.dsr2.2017.09.001
Dunton KH, Weingartner T, Carmack EC (2006) The nearshore western Beaufort Sea
ecosystem: Circulation and importance of terrestrial carbon in arctic coastal food webs.
Prog Oceanogr. doi: 10.1016/j.pocean.2006.09.011
Eicken H, Gradinger R, Gaylord A, et al (2005) Sediment transport by sea ice in the Chukchi and
Beaufort Seas: Increasing importance due to changing ice conditions? Deep Res Part II
Top Stud Oceanogr. doi: 10.1016/j.dsr2.2005.10.006
Feder HM, Iken K, Blanchard AL, et al (2011) Benthic food web structure in the southeastern
Chukchi Sea: An assessment using δ13
C and δ15
N analyses. Polar Biol. doi:
10.1007/s00300-010-0906-9
Feder HM, Naidu AS, Jewett SC, et al (1994) The northeastern Chukchi Sea: Benthos-
environmental interactions. Mar Ecol Prog Ser. doi: 10.3354/meps111171
Garneau MÈ, Vincent WF, Terrado R, Lovejoy C (2009) Importance of particle-associated
bacterial heterotrophy in a coastal Arctic ecosystem. J Mar Syst. doi:
10.1016/j.jmarsys.2008.09.002
38
Graham C, Oxtoby L, Wang SW, et al (2014) Sourcing fatty acids to juvenile polar cod
(Boreogadus saida) in the Beaufort Sea using compound-specific stable carbon isotope
analyses. Polar Biol. doi: 10.1007/s00300-014-1470-5
Grebmeier J, Feder H, McRoy C (2007a) Pelagic-benthic coupling on the shelf of the northern
Bering and Chukchi Seas. II. Benthic community structure. Mar Ecol Prog Ser. doi:
10.3354/meps051253
Grebmeier J, McRoy C, Feder H (2007b) Pelagic-benthic coupling on the shelf of the northern
Bering and Chukchi Seas. I. Food supply source and benthic bio-mass. Mar Ecol Prog
Ser. doi: 10.3354/meps048057
Iken K (2015) Arctic Marine Biodiversity Observing Network (AMBON) 2015 cruise report.
http://ambon-us.org/wp-content/uploads/2015/09/AMBON-2015-cruise-report.pdf
Iken K, Bluhm B, Dunton K (2010) Benthic food-web structure under differing water mass
properties in the southern Chukchi Sea. Deep Res Part II Top Stud Oceanogr. doi:
10.1016/j.dsr2.2009.08.007
Iken K, Bluhm BA, Gradinger R (2005) Food web structure in the high Arctic Canada Basin:
Evidence from δ13
C and δ15
N analysis. Polar Biol. doi: 10.1007/s00300-004-0669-2
Kȩdra M, Moritz C, Choy ES, et al (2015) Status and trends in the structure of Arctic benthic
food webs. Polar Res. doi: 10.3402/polar.v34.23775
Larsen T, Lee Taylor D, Leigh MB, O’Brien DM (2009) Stable isotope fingerprinting: A novel
method for identifying plant, fungal, or bacterial origins of amino acids. Ecology. doi:
10.1890/08-1695.1
Larsen T, Ventura M, Andersen N, et al (2013) Tracing carbon sources through aquatic and
terrestrial food webs using amino acid stable isotope fingerprinting. PLoS One. doi:
10.1371/journal.pone.0073441
Macdonald TA, Burd BJ, Macdonald VI, et al (2010) Taxonomic and Feeding Guild
Classification for the Marine Benthic Macroinvertebrates of the Strait of Georgia, British
Columbia Canadian Technical Report of Fisheries and Aquatic Sciences 2874. Can Tech
Rep Fish Aquat Sci. doi: 10.1002/prot.20320
McClelland JW, Townsend-Small A, Holmes RM, et al (2014) River export of nutrients and
organic matter from the North Slope of Alaska to the Beaufort Sea. Water Resour Res.
doi: 10.1002/2013WR014722
McMahon KW, Ambrose WG, Johnson BJ, et al (2006) Benthic community response to ice
algae and phytoplankton in Ny Ålesund, Svalbard. Mar Ecol Prog Ser. doi:
10.3354/meps310001
McMahon KW, Thorrold SR, Houghton LA, Berumen ML (2016) Tracing carbon flow through
coral reef food webs using a compound-specific stable isotope approach. Oecologia. doi:
10.1007/s00442-015-3475-3
McMahon KW, Williams B, Guilderson TP, et al (2018) Calibrating amino acid δ13
C and δ15
N
offsets between polyp and protein skeleton to develop proteinaceous deep-sea corals as
paleoceanographic archives. Geochim Cosmochim Acta. doi: 10.1016/j.gca.2017.09.048

39
McTigue ND, Dunton KH (2017) Trophodynamics of the Hanna Shoal Ecosystem (Chukchi Sea,
Alaska): Connecting multiple end-members to a rich food web. Deep Res Part II Top
Stud Oceanogr. doi: 10.1016/j.dsr2.2017.08.010
McTigue ND, Dunton KH (2014) Trophodynamics and organic matter assimilation pathways in
the northeast Chukchi Sea, Alaska. Deep Res Part II Top Stud Oceanogr. doi:
10.1016/j.dsr2.2013.07.016
Misarti N, Gier E, Finney B, et al (2017) Compound-specific amino acid δ15
N values in
archaeological shell: Assessing diagenetic integrity and potential for isotopic baseline
reconstruction. Rapid Commun Mass Spectrom. doi: 10.1002/rcm.7963
Moss DK, Surge D, Khaitov V (2018) Lifespan and growth of Astarte borealis (Bivalvia) from
Kandalaksha Gulf, White Sea, Russia. Polar Biol. doi: 10.1007/s00300-018-2290-9
O’Brien DM, Fogel ML, Boggs CL (2002) Renewable and nonrenewable resources: Amino acid
turnover and allocation to reproduction in Lepidoptera. Proc Natl Acad Sci. doi:
10.1073/pnas.072346699
Oxtoby LE, Budge SM, Iken K, et al (2016) Feeding ecologies of key bivalve and polychaete
species in the Bering Sea as elucidated by fatty acid and compound-specific stable
isotope analyses. Mar Ecol Prog Ser. doi: 10.3354/meps11863
Parnell AC, Phillips DL, Bearhop S, et al (2013) Bayesian stable isotope mixing models.
Environmetrics. doi: 10.1002/env.2221
Piepenburg D (2005) Recent research on Arctic benthos: Common notions need to be revised.
Polar Biol. doi: 10.1007/s00300-005-0013-5
Rowe A, Blanchard A, Iken K, O’Brien D, Uradnikova M, Osvik RD, Wooller MJ (in press).
Estimates of primary production sources to Arctic bivalves using amino acid stable
carbon isotope fingerprinting. Stable Isotopes in Environmental and Health Studies.
Savory, GA, Hunter, CM, O’Brien DM (2014) Anthropogenic food use and diet overlap between
red foxes (Vulpes vulpes). Can J Zool. doi: 10.1139/cjz-2013-0283
Schell DM (1983) Carbon-13 and carbon-14 abundances in Alaskan aquatic organisms: Delayed
production from peat in arctic food webs. Science. doi: 10.1126/science.219.4588.106
Seymour J, Horstmann-Dehn L, Wooller MJ (2014a) Proportion of higher-trophic-level prey in
the diet of Pacific walruses (Odobenus rosmarus divergens). Polar Biol. doi:
10.1007/s00300-014-1492-z
Seymour J, Horstmann-Dehn L, Wooller MJ (2014b) Inter-annual variability in the proportional
contribution of higher trophic levels to the diet of Pacific walruses. Polar Biol. doi:
10.1007/s00300-014-1460-7
Tu KL, Blanchard AL, Iken K, Horstmann-Dehn L (2015) Small-scale spatial variability in
benthic food webs in the northeastern Chukchi Sea. Mar Ecol Prog Ser. doi:
10.3354/meps11216
Wang SW, Budge SM, Iken K, et al (2015) Importance of sympagic production to Bering Sea
zooplankton as revealed from fatty acid-carbon stable isotope analyses. Mar Ecol Prog
Ser. doi: 10.3354/meps11076

40
Wang SW, Springer AM, Budge SM, et al (2016) Carbon sources and trophic relationships of ice
seals during recent environmental shifts in the Bering Sea. Ecol Appl. doi:
10.1890/14.2421/suppinfo
Young JK, Black BA, Clarke JT, et al (2017) Abundance, biomass and caloric content of
Chukchi Sea bivalves and association with Pacific walrus (Odobenus rosmarus
divergens) relative density and distribution in the northeastern Chukchi Sea. Deep Res
Part II Top Stud Oceanogr. doi: 10.1016/j.dsr2.2017.04.017

The Department of the Interior Mission
As the Nation’s principal conservation agency, the Department of the Interior has responsibility for most of our nationally owned public lands and natural resources. This includes fostering the sound use of our land and water resources, protecting our fish, wildlife and biological diversity; preserving the environmental and cultural values of our national parks and historical places; and providing for the enjoyment of life through outdoor recreation. The Department assesses our energy and mineral resources and works to ensure that their development is in the best interests of all our people by encouraging stewardship and citizen participation in their care. The Department also has a major responsibility for American Indian reservation communities and for people who live in island communities. The Bureau of Ocean Energy Management
The Bureau of Ocean Energy Management (BOEM) works to manage the exploration and development of the nation's offshore resources in a way that appropriately balances economic development, energy independence, and environmental protection through oil and gas leases, renewable energy development and environmental reviews and studies.