Embed Size (px)
Citation preview
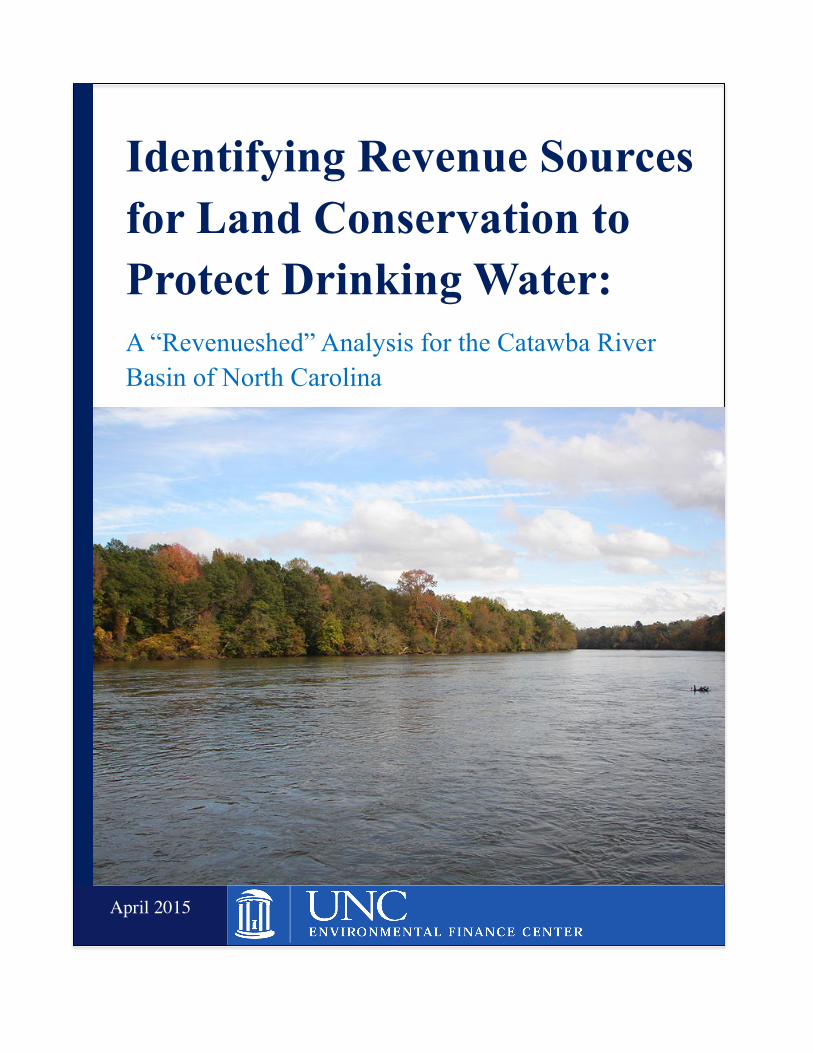
Identifying Revenue Sources for Land Conservation to Protect Drinking Water: A “Revenueshed” Analysis for the Catawba River Basin of North Carolina
April 2015
Environmental Finance Center at the University of North Carolina | 1
About the Environmental Finance Center The Environmental Finance Center is part of a network of university-based centers that work on environmental issues, including water resources, solid waste management, energy, and land conservation. The EFC at UNC partners with organizations across the United States to assist communities, provide training and policy analysis services, and disseminate tools and research on a variety of environmental finance and policy topics. The EFC at UNC is dedicated to enhancing the ability of governments to provide environmental programs and services in fair, effective, and financially sustainable ways. Acknowledgements Researched and written by Mary Tiger, Anna McGeehan, and Jeff Hughes This report and accompanying tool was funded by the Foothills Conservancy of North Carolina and the Catawba Lands Conservancy. The analysis would not have been possible without the data and resources available through the North Carolina Department of Environment and Natural Resources and the North Carolina Department of the State Treasurer. This report is a product of the Environmental Finance Center at the University of North Carolina at Chapel Hill. Findings, interpretations, and conclusions included in this report are those of the authors and do not necessarily reflect the views of EFC funders, the University of North Carolina, the School of Government, or those who provided review. Cover image courtesy of Holden LeCroy under Creative Commons.
© 2015 Environmental Finance Center
School of Government Knapp-Sanders Building, CB# 3330
University of North Carolina at Chapel Hill Chapel Hill, NC 27599-3330
www.efc.sog.unc.edu
All rights reserved

Environmental Finance Center at the University of North Carolina | 2
1. Executive Summary This report examines the potential for generating a cooperative, sustainable revenue stream among the local governments and public utilities in the North Carolina Catawba River Basin (CRB) for the conservation of watershed lands and implementation of other watershed protection strategies.
Figure 1: Catawba River Basin, North Carolina One of the primary challenges of watershed protection is that jurisdictional and watershed boundaries rarely align. This generates questions about who is responsible, and who should pay, for watershed protection. In this report, the EFC developed and applied the concept of a revenueshed, which is the area within which revenue is generated for watershed protection, in order to address these challenges. This concept addresses four objectives: (1) to cultivate accountability, (2) to generate discussions among local governments, (3) to develop interactive financial tools to assist in policy decision-making, and (4) to discuss strategies for implementing watershed protection financing as a sustainable revenue stream among watershed beneficiaries and “impactors”. Examples of policy implications highlighted in the report:
1. Hydrological connectedness bonds residents up- and downstream. Upstream communities’ land-use decisions, stormwater runoff, and wastewater treatment plants have a significant impact on water quality in the CRB. Despite this obvious connection, there are limited examples of local governments “connecting” their revenue-generating authority in ways that mirror hydrological boundaries.
2. Watershed restoration regulations promote the “polluter pays” principle, resulting in less
attention towards the “beneficiary pays” principle. Downstream communities located outside of the CRB use water impounded in the watershed’s reservoirs. This water has helped fuel regional growth and now supports a population exceeding 1.5 million. These downstream communities do not directly impact the water quality and quantity flowing into the Catawba River, but they are heavily invested in up-stream water supply and quality.
3. Leveraging the resources necessary for comprehensive restoration requires jurisdictional collaboration. The population in the CRB and adjacent areas has grown rapidly in recent decades, placing increased stress on the quality and quantity of water resources. Growing populations require advance, proactive planning to increase water security. Collaboration between local jurisdictions within and adjacent to the CRB is critical to effectively manage and protect
Environmental Finance Center at the University of North Carolina | 3
water resources and meet growing demand. Piecemeal restoration and preservation financing lack economies of scale and the beneficiary pooling advantages of a more comprehensive approach.
4. North Carolina law provides the autonomy to implement watershed protection taxes and
pay for it through utility fees (N.C. General Statutes §160A-314, §162A-9, §162A-49). The boundaries of water utilities often expand outside of their base municipality, as opposed to stormwater utilities, whose jurisdictional boundaries are limited to those customers located inside the municipality. Stormwater fees are collected to minimize the impact of a city on its watershed and are often used to protect the water flowing downstream. Water utilities are an ideal conduit through which to leverage watershed protection fees because their concern is upstream and they focus on protecting their own water supply source. Additionally, wastewater utilities are already collecting fees to ensure downstream water quality.
5. Watershed protection often costs less than watershed restoration. It costs less money to protect a watershed now than to attempt to restore a watershed to health in the future. A study from Duke University’s Nicholas School of the Environment estimated the average willingness-to-pay for watershed protection in the Catawba River watershed is $139 per year per residential household (Kramer & Eisen-Hecht 2002). Most examples of explicit watershed protection fees cost less than $20 per year per resident/user.
6. Utilities in the CRB watershed already contribute a great deal to watershed protection. In 2014, water, wastewater, and stormwater utilities in the CRB collected nearly $3.6 billion (water and wastewater) and over $66 million (stormwater), respectively, to protect water quality. This money was spent on disinfecting and distributing clean drinking water, treating wastewater, and mitigating the impact of urban stormwater run-off.

Environmental Finance Center at the University of North Carolina | 4
2. Water Quality in the Catawba River Basin and the Importance of Boundaries: Applying the Revenueshed Concept
The Catawba River Basin (CRB) is located in the southwestern part of North Carolina, flowing approximately 3,004 miles southeast into South Carolina (NC DWR 2007, 2-36). It is divided into four sub-basins, including the Upper Catawba, South Fork, Lower Catawba, and Wateree (NC DWR 2007). The CRB is the eighth largest river system in North Carolina, containing over 9,000 miles of rivers and streams. It is also one of the most densely populated. According to the 2010 US Census Bureau, over 1.5 million people live in the Catawba Basin, an increase of nearly 50% from 2000. For the purposes of this report, the CRB boundaries include the entire City of Charlotte, nearly two-thirds of Mecklenburg County, as well as 47 other municipalities, 10 counties, and 38 water, wastewater, and stormwater utilities. This major population base generates pressure for growth, development, and natural resource management, placing considerable strain on water quality, open space, and wildlife habitat. According to the Catawba Riverkeeper, at least one-third of the surface water in the basin is impaired. Sources of water pollution include nutrient runoff from fertilizers, fecal coliform runoff from improper sewage treatment, animal waste, sewage spills, and boat discharges, sedimentation from development and land conversion, and mercury pollution from industrial processes (Catawba Riverkeeper, nd). Currently, several local municipalities, Duke Energy, and non-governmental organizations share major responsibilities in protecting and managing the basin’s water resources. Additionally, there is a group of Catawba River Basin communities that have come together to form the nonprofit Catawba-Wateree Water Management Group. Per their website (www.catawbawatereewmg.org), a key driver to the communities that comprise the Catawba-Wateree Water Management Group is the recognition that if we keep dealing with water in the same manner that we have done historically, we will not be able to meet anticipated needs. The group is comprised of 18 public water utilities1 in NC and SC and Duke Energy Carolinas, LLC. In an effort to better understand the CRB water system and to help inform local government initiatives, the EFC developed an analytical approach to examining watershed protection challenges. We refer to this approach as a revenueshed analysis, which is used to explore the complex relationships between environmental services, local government jurisdictions, and watershed boundaries. The revenueshed analysis provided the framework to identify and analyze potential revenue streams for watershed protection, with the ultimate goal of providing information that generates discussions and assists in the development of a dedicated watershed protection revenue stream. Our revenueshed analysis is not designed to be a complete “ecosystem services” study of the CRB, but rather to serve as a pragmatic snapshot of the user entities and current revenues based around water supply, demand, wastewater discharge, and stormwater management. For example, our analysis does not include economic assessments of less tangible and more difficult revenue capture services such as the value of natural capital providing goods (water, fish, forests) and services (flood protection, recreation clean water, forests removing nutrients and sediment, biodiversity, etc.). As a result, the baseline characterization and potential revenue solutions outlined in the analysis only assess existing governmental services such as stormwater, land use planning, and drinking water provision. 1 Public utility members include City of Belmont (NC), City of Camden (SC), Union-Lancaster Catawba River Water Treatment Plant (NC/SC), Charlotte Water (NC), Chester Metropolitan District (SC), City of Gastonia (NC), Town of Granite Falls (NC), City of Hickory (NC), City of Lenoir (NC), Lincoln County (NC), Town of Mooresville (NC), City of Morganton (NC), City of Mount Holly (NC), City of Rock Hill (SC), City of Statesville (NC), Two Rivers Utilities (NC), and Town of Valdese (NC).

Environmental Finance Center at the University of North Carolina | 5
2.1 Introduction to the Catawba River Basin (CRB) This section provides background information on the CRB and describes the attributes and advantages of the revenueshed approach. The CRB contains four sub-basins spanning both North Carolina and South Carolina, including the Upper Catawba, South Fork Catawba, Lower Catawba, and Wateree (Table 1, Figure 2). The analysis in this report and analysis is limited to local governments and public utilities in North Carolina. It does not include South Carolina local governments or public utilities, nor does it include private utilities, like Aqua America, that have a significant role in the water resources of the Catawba Riverbasin. It also does not include distributed systems, such as onsite wastewater treatment systems. Future analysis could include these entities, but data was not readily available to the Environmental Finance Center on their finances. Table 1: Sub-Basins of the Catawba River
Hydrologic Unit Code (HUC)
Sub-Basin Name States Major Streams
03050101 Upper Catawba NC, SC Linville Rv., Johns Rv., Catawba Main Stem, Long Cr
03050102 South Fork Catawba NC South Fork Catawba, Henry Fork, Jacob Fork
03020103 Lower Catawba NC, SC Catawba Main Stem, Irwin Cr., Sugar Cr., Briar Cr.
03020104 Wateree SC Wateree Rv., Colonels Cr Source: NC DWR 2007, 2-36. Access at: http://www.ncwater.org/files/publications/Final_Draft_Catawba_River_Basin_Plan_2007.pdf
Figure 2: Hydrologic Sub-basins in Catawba, NC Source: NC DWR 2007, 2-37. Access at: http://www.ncwater.org/files/publications/Final_Draft_Catawba_River_Basin_Plan_2007.pdf

Environmental Finance Center at the University of North Carolina | 6
Upper Catawba River Sub-Basin The Upper Catawba River Sub-Basin is located primarily in North Carolina, though approximately 138 square miles extends into South Carolina (See Figure 3) (NRCS 2010, 2). It is a highly urbanized sub-basin, with approximately 8 percent impervious coverage within the sub-basin watershed and continued urbanization from areas such as Charlotte, North Carolina and Rock Hill, South Carolina (NRCS 2010, 3). An estimated 72 percent of land in the Sub-Basin is considered “highly erodible” according to 2010 data (NRCS 2010, 8). Water withdrawals to support urban development, agriculture, and livestock drive water quality and quantity concerns, and upstream pressure from urban areas in Cabarrus and Mecklenburg Counties also compound water resource issues (NRCS 2010, 10).
Figure 3: Upper Catawba River Sub-Basin, Land Use and Land Cover Source: NRCS 2010, 3 Access at: http://www.esri.sc.edu/projects/usda/conservation_documents/RWAs/Upper%20Catawba.pdf South Fork Sub-Basin The South Fork Sub-Basin is the second largest in the Catawba River Basin, covering an estimated 661 square miles (Figure 4). Based on 2010 data, approximately 47 percent of land in the sub-basin is forest, 30 percent agricultural, and 18 percent urban (NC DWQ 2010, 2.1). There are 11 major discharge facilities serving Hickory, Newton, Lincolnton, Gastonia, and Belmont (NC DWQ 2010, 2.1). Water quality issues from urban development, outdated septic systems, and stormwater runoff have resulted in excess bacterial levels and low pH for much of the watershed (NC DWQ 2010, 2.3).
Figure 4: South Fork Catawba River Sub-Basin Source: NC DWQ 2010 Access at: http://www.piedmontnutrientsourcebook.org/Assetts/lid/SouthFork_Catawba_Subbasin.pdf

Environmental Finance Center at the University of North Carolina | 7
Lower Catawba Sub-Basin The Lower Catawba sub-basin covers approximately 927 square miles and begins downstream of Lake Wylie (Figure 5) (NRCS 2010, 2). Approximately 11 percent of the sub-basin watershed is urbanized, largely from areas such as Rock Hill, South Carolina and Charlotte, North Carolina (NRCS 2010. 4). Water withdrawals from the Lower Catawba Sub-Basin to areas throughout Cabarrus County, North Carolina have caused ongoing legal battles and resource disputes between entities in the southern part of North Carolina and rapidly growing Lancaster County in South Carolina.
Figure 5: Land Use and Land Cover in the Lower Catawba Sub-Basin Source: NRCS 2010, 3 Access at: http://www.esri.sc.edu/projects/ usda/conservation_documents/RWAs/Lower%20Catawba.pdf
Environmental Finance Center at the University of North Carolina | 8
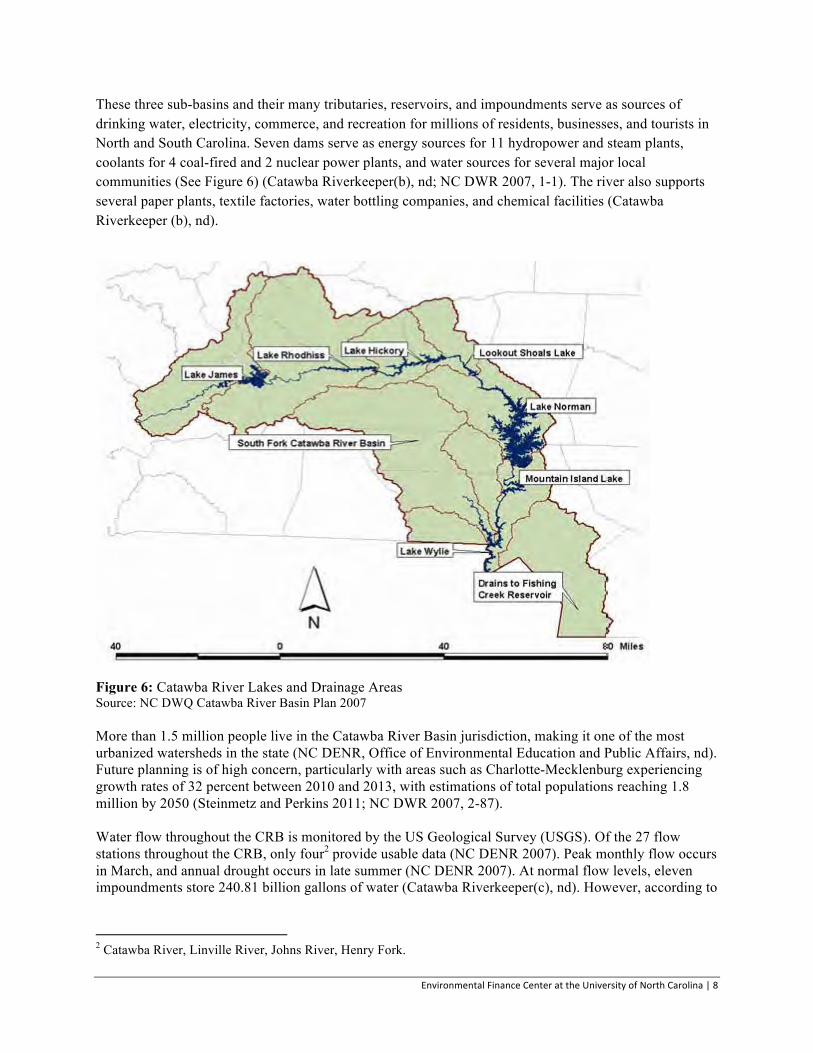
These three sub-basins and their many tributaries, reservoirs, and impoundments serve as sources of drinking water, electricity, commerce, and recreation for millions of residents, businesses, and tourists in North and South Carolina. Seven dams serve as energy sources for 11 hydropower and steam plants, coolants for 4 coal-fired and 2 nuclear power plants, and water sources for several major local communities (See Figure 6) (Catawba Riverkeeper(b), nd; NC DWR 2007, 1-1). The river also supports several paper plants, textile factories, water bottling companies, and chemical facilities (Catawba Riverkeeper (b), nd).
Figure 6: Catawba River Lakes and Drainage Areas Source: NC DWQ Catawba River Basin Plan 2007 More than 1.5 million people live in the Catawba River Basin jurisdiction, making it one of the most urbanized watersheds in the state (NC DENR, Office of Environmental Education and Public Affairs, nd). Future planning is of high concern, particularly with areas such as Charlotte-Mecklenburg experiencing growth rates of 32 percent between 2010 and 2013, with estimations of total populations reaching 1.8 million by 2050 (Steinmetz and Perkins 2011; NC DWR 2007, 2-87). Water flow throughout the CRB is monitored by the US Geological Survey (USGS). Of the 27 flow stations throughout the CRB, only four2 provide usable data (NC DENR 2007). Peak monthly flow occurs in March, and annual drought occurs in late summer (NC DENR 2007). At normal flow levels, eleven impoundments store 240.81 billion gallons of water (Catawba Riverkeeper(c), nd). However, according to
2 Catawba River, Linville River, Johns River, Henry Fork.
Environmental Finance Center at the University of North Carolina | 9
NC DENR, approximately 50 percent of the time, water flow varies at or below 110 cubic feet per second (cfs) to 275 cfs. Ninety percent of the time, flow varies between 52 cfs to 125 cfs (NC DWR 2007, 2-46). In 2006, water withdrawals in the CRB totaled 420 million gallons per day (MGD), and 323 gallons per individual (Catawba Riverkeeper(c), nd). Three reservoirs, including Mountain Island Lake, Fishing Creek Reservoir, and Lake Wylie provide a majority of drinking water in the basin. These three reservoirs are located near the Cities of Charlotte and Gastonia, which are the major municipal communities responsible for some of the basin’s largest surface-water withdrawals (NC DWR 2007, 2-4). Additionally, approximately two-dozen municipalities are responsible for wastewater discharges throughout the basin. In 2009, the City of Charlotte Municipal Utilities Department discharged over 30 billion gallons through its three wastewater treatment plants (Catawba Riverkeeper(c), nd). In addition to stresses from urbanization and growing demand, the CRB has long struggled with a range of ecological issues that impact water quality. According to the Catawba Riverkeeper, there are approximately 550 permitted pollution discharge areas throughout the CRB, and many more unpermitted discharge areas. Some of the most prevalent environmental issues associated with effluent waste include sedimentation, bacterial contamination, and nutrient loading (Catawba Riverkeeper(c), nd). According to the North Carolina Department of Water Quality (NC DWQ), the CRB suffers from basin-wide low pH levels caused by a combination of low stream flows, atmospheric deposition, development impacts, or decreased buffering capacity (NC DWQ 2010). An increase in stormwater runoff also has severe impacts on basin-wide water quality. Nonpoint source pollution in stormwater runoff in the Charlotte-Mecklenburg area alone has increased 55 percent since 1987 (Charlotte-Mecklenburg Stormwater Services 2007). This increase in volume and velocity intensifies flooding and can cause stream bank erosion and ecological damage (NC DWQ 2010). Impacts from poultry and farm productions are also driving sedimentation and erosion throughout the basin, especially along the CRB’s high quality headwaters. Agricultural practices are currently exempt from having to complete a sediment and erosion control plan, which is a state requirement for any land disturbing activity over an acre (NC DWQ 2010). Nitrogen loading from septic systems is also increasing nutrient levels throughout the CRB. In 1990, the CRB had the highest average septic system density on a river basin scale of all other basins in the state (NC DWQ 2010). Based on 1990 data, a population of 406,797 people using septic systems resulted in nitrogen loading of nearly 4.1 million pounds per year, a rate that has only increased with the area’s tremendous growth (NC DWQ 2010).
In 2008, American Rivers listed the Catawba River as the most endangered river in the United States due to development trends, poor water management practices, and the threat of pollution from coal ash ponds (American Rivers 2008, 8). The following year, the EPA released a report identifying 44 of the most hazardous coal ash ponds in the United States. The report revealed that three facilities with a total of five ponds are located in the CRB, all of which are positioned on reservoirs that are used as drinking water sources for neighboring jurisdictions (Catawba Riverkeeper(a), nd). Pollution and development practices in the CRB are compounded by a tremendous increase in water demand. Based on 2005 data, approximately 170 millions of water gallons per day were pumped from the Catawba to other river basins. By the year 2058, as much as 458 mgd could be sent to other basins (Catawba Riverkeeper(b), nd). The CRB’s dwindling capacity has caused ongoing disputes between neighboring jurisdictions as several entities struggle to balance economic growth and sustainable resource management. One major legal battles over the Catawba Riverbasin over the last several years has been between North Carolina and South Carolina. In 2007, the Towns of Kannapolis and Concord, in Cabarrus County North Carolina, received a certificate from the North Carolina Environmental Management Commission (EMC)
Environmental Finance Center at the University of North Carolina | 10
to withdraw 10 mgd from the Catawba River Basin and 10 mgd from the Yadkin River basin and to discharge water into the Rocky River Sub basin, located in the Yadkin River Basin. Originally, this transfer was intended to accommodate nearly all of the local water supply needs of Kannapolis and Concord, which were projected to have a major water shortage by 2035 (Artz 2008, 5). A portion of the transferred water was slated to help support new development in the City of Concord, including a proposed water park (Catawba Riverkeeper(b), nd). In response to the proposed transfer, South Carolina filed a complaint with the Supreme Court claiming the transfer would harm residents of South Carolina. A settlement was eventually reached limiting withdrawals during moderate and severe droughts (Stabley 2009). There are a multitude of challenges facing the Catawba River Basin that involve an entangled web of stakeholders. The following sections will summarize resource use and financial resources in the CRB by a sub-set of these stakeholders, including local governments and water, wastewater, and stormwater utilities.
2.2 Revenueshed Concept
The EPA identifies a “watershed planning approach” as one of the four pillars of sustainable infrastructure. However, many watershed plans, despite receiving wide public support, have yet to be implemented due to a lack of coordination and financial resources. If stakeholders in the river basin can coordinate their thinking and objectives, and implement protection on a watershed level, a small amount of financial resources can be leveraged to make a big impact. 2.2.1. What is a revenueshed? We define a revenueshed as the geographic area within which revenue is generated for a specific purpose. Here, a revenueshed describes the area within which revenue is generated for watershed protection.
2.2.2. What are the advantages of the revenueshed analysis framework? Jurisdictional boundaries were developed to meet social, economic, and/or political needs, rather than to coincide with hydrologic boundaries. As a result, jurisdictional boundaries (sources of revenue for watershed protection) often do not match watershed boundaries. This leads to:
• Multiple jurisdictions being responsible for financing watershed protection in a single watershed. This often results in a free-rider problem whereby all jurisdictions want the benefit of clean water, but nobody wants to pay for it. Pooling revenue from these communities for efforts that exceed their jurisdictional boundaries is difficult. A consequence is that water quality is not directly addressed until it approaches a crisis point where action is necessary.
• Single jurisdictions become responsible for watershed protection in multiple watersheds. All jurisdictions have limited financial resources; therefore, decisions have to be made regarding how much money is invested in each watershed. In addition, each watershed may have different legislative requirements for water quality and/or watershed protection.
• Water quality and quantity are affected by decisions made upstream. Who is responsible for ensuring the quality and quantity of water available for downstream users? The upstream impacting jurisdictions, the downstream benefitting jurisdictions, or both?

Environmental Finance Center at the University of North Carolina | 11
2.2.3. How can revenuesheds be used as a tool for watershed protection? Grigg (1999) stated that the main challenge for water resource management in the future will be institutional, particularly regarding questions about who is responsible for, and who should pay for, water resource management. We have applied the revenueshed concept to address these challenges along three main avenues (Figure 7):
Figure 7: Revenueshed concept Venn diagram
1. Revenuesheds are used to cultivate accountability by providing an unbiased documentation of the
baseline revenue generated by each jurisdiction from water, wastewater, and stormwater fees within a specific watershed. Additional sources of revenue may also be considered, such as property taxes, grants, and corporate contributions. These sources of revenue can be explored with respect to the proportion of the jurisdiction within the watershed, per capita, per impaired streams, etc.
2. Revenuesheds are used to generate discussions among jurisdictions directly related to the watershed. The data are summarized to give local context to the effort.
3. Revenuesheds can be used to develop scenarios to assist in policy decision-making and fund
watershed protection. This includes examining how to collaboratively and intentionally finance a project or generate a dedicated revenue stream, which is particularly important if there is unclear leadership or responsibility. Commonly, this ambiguity is the result of a negative externality where personal or community decisions have a broader impact on the watershed as a whole. For example, land conversion or poor agricultural practices are land use decisions that impact water quality in surrounding streams. Downstream water users are impacted by the cumulative effect of decisions that lead to water quality degradation, but it is unclear who is directly responsible and whether the polluters or the water users are responsible for improving water quality to the level required for its desired use. The accompanying financial tool can be used to promote the implementation of actual policies that lead to sustainable watershed protection financing.
Environmental Finance Center at the University of North Carolina | 12
2.3 Integrating Revenuesheds with North Carolina State Legislation for Watershed Protection
In the mid-1980s, the Pamlico River estuary had excess nutrients in the water that led to algal blooms and stressed biota. North Carolina responded by designating the entire Tar-Pamlico River Basin as Nutrient Sensitive Waters (NSW) in 1990 and has worked towards developing basin-wide strategies to reduce the nutrient load entering the estuary. This approach to watershed protection can be labeled a “problemshed” approach, whereby the specific water body is the problem and the watershed draining into that region is the problemshed (Gerlak, 2006). This approach has been taken by the State of North Carolina on multiple occasions since the 1990s. Currently, there is no such legislation concerning the Catawba River Basin. The two most recent and controversial watershed rules were passed for Jordan Lake in 2009 and Falls Lake in 2011. The controversy highlights two challenges to the problemshed approach:
1. First, the problemshed only looks to the upstream jurisdictions as a resource to improve water quality to the benefit of downstream users. This is particularly problematic for those jurisdictions that receive no benefit from water quality improvements (e.g. Durham is affected by Jordan Lake and Falls Lake Rules but neither lake is a main water supply for Durham). Revenuesheds address this issue by considering both the polluters and the beneficiaries as being viable financing options for sustainable watershed protection. The different jurisdictions are responsible for collaborating and discussing which options are feasible for their particular situation.
2. Second, serious implementation discussions and actions to improve water quality often occur only after a problem has been identified and mandatory legislation enacted. The process is reactive and likely more expensive than if proactive measures to improve water quality had been taken. The revenueshed approach provides an alternative means to examine jurisdictions and watersheds simultaneously and to proactively engage discussions on how to generate sustainable revenue for watershed protection. The goal is for sustainable watershed protection funding and implementation to occur prior to water quality impairment.
2.3.1. Implementation of Inter-Governmental Watershed Protection As part of previous research conducted for the Upper Neuse River Basins of NC, the EFC reviewed the underlying legal authority behind the most prevalent and promising multi-jurisdictional models for sharing water resource protection costs (Hughes, 2014). That research found that there are many models to consider for sharing resources to support watershed protection efforts. It also recommended that inter-governmental watershed protection efforts have trusted agents with strong leadership, that they link their model to basic objectives, and determine the importance of governance structures. Finally, it concludes that it is important to take into account multiple factors when exploring options for sharing contributions/payments.
Environmental Finance Center at the University of North Carolina | 13
3. Revenueshed Analysis Applied to the Catawba River Basin In North Carolina, the CRB provides water and natural resources to approximately 11 counties, 48 municipalities, nine water utilities, 4 wastewater utilities, 38 combined water and wastewater utilities, and 17 stormwater utilities. The following section summarizes the counties, cities, and the property tax revenue they collected in fiscal year 2014. This report and accompanying tool also explore three types of utilities and their relationship to watershed protection in the CRB. First, we look at drinking water utilities, for which revenue focus is on protecting their water supply. Second, we look at wastewater utilities, for which revenue focus is on discharging clean, treated water back into the watershed and meeting federal regulations. Third, we look at stormwater utilities whose revenue focus is on mitigating and improving the water quality of non-point source discharge as well as restoring impaired water bodies. All three types of utilities provide the opportunity to offer administrative and monetary resources for watershed protection. In this section we will outline the process of creating a revenueshed to cultivate financial accountability and generate discussions between jurisdictions. We will examine the jurisdictions that are directly tied to the CRB, explore the revenueshed characteristics for “impactors” (those jurisdictions located upstream that impact water quality), and “benefactors” (those jurisdictions benefiting from improved water quality downstream) with the understanding that these designations are rarely clear-cut and communities often are both impactors and benefactors of watersheds.
Environmental Finance Center at the University of North Carolina | 14
3.1 Cities and Counties in the Catawba River Basin
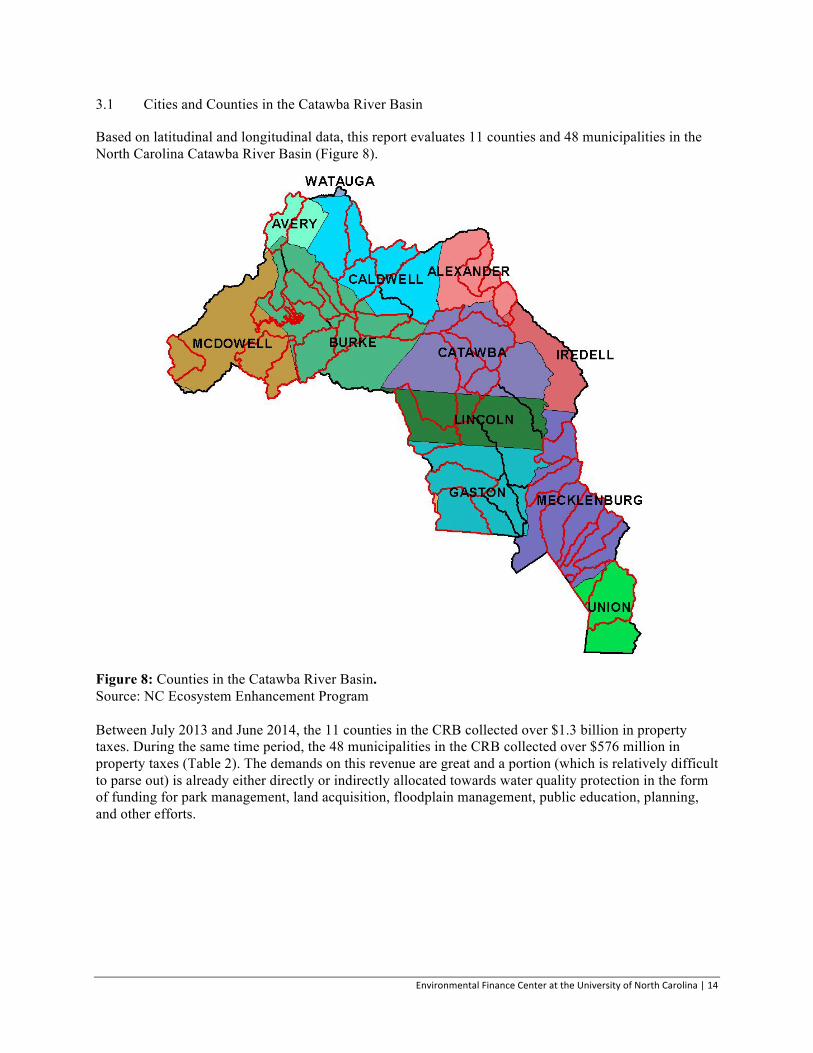
Based on latitudinal and longitudinal data, this report evaluates 11 counties and 48 municipalities in the North Carolina Catawba River Basin (Figure 8).
Figure 8: Counties in the Catawba River Basin. Source: NC Ecosystem Enhancement Program Between July 2013 and June 2014, the 11 counties in the CRB collected over $1.3 billion in property taxes. During the same time period, the 48 municipalities in the CRB collected over $576 million in property taxes (Table 2). The demands on this revenue are great and a portion (which is relatively difficult to parse out) is already either directly or indirectly allocated towards water quality protection in the form of funding for park management, land acquisition, floodplain management, public education, planning, and other efforts.
Environmental Finance Center at the University of North Carolina | 15
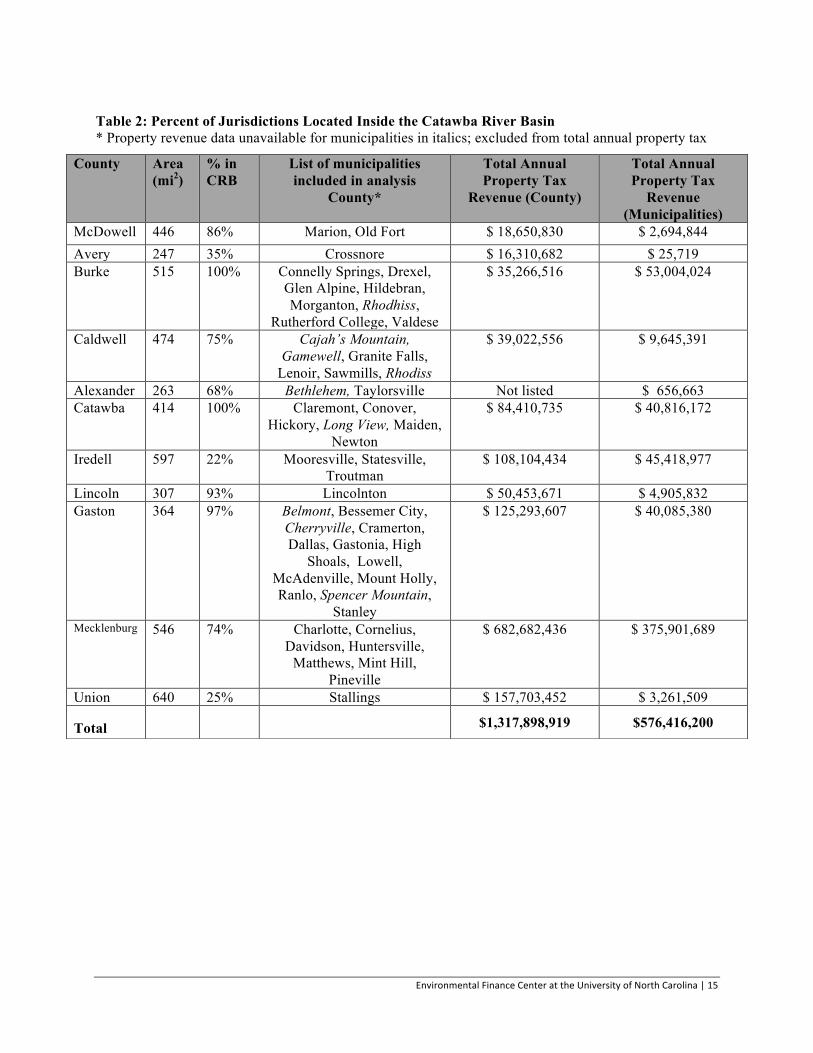
Table 2: Percent of Jurisdictions Located Inside the Catawba River Basin * Property revenue data unavailable for municipalities in italics; excluded from total annual property tax
County Area (mi2)
% in CRB
List of municipalities included in analysis
County*
Total Annual Property Tax
Revenue (County)
Total Annual Property Tax
Revenue (Municipalities)
McDowell 446 86% Marion, Old Fort $ 18,650,830 $ 2,694,844 Avery 247 35% Crossnore $ 16,310,682 $ 25,719 Burke 515 100% Connelly Springs, Drexel,
Glen Alpine, Hildebran, Morganton, Rhodhiss,
Rutherford College, Valdese
$ 35,266,516 $ 53,004,024
Caldwell 474 75% Cajah’s Mountain, Gamewell, Granite Falls,
Lenoir, Sawmills, Rhodiss
$ 39,022,556 $ 9,645,391
Alexander 263 68% Bethlehem, Taylorsville Not listed $ 656,663 Catawba 414 100% Claremont, Conover,
Hickory, Long View, Maiden, Newton
$ 84,410,735 $ 40,816,172
Iredell 597 22% Mooresville, Statesville, Troutman
$ 108,104,434
$ 45,418,977
Lincoln 307 93% Lincolnton $ 50,453,671 $ 4,905,832 Gaston 364 97% Belmont, Bessemer City,
Cherryville, Cramerton, Dallas, Gastonia, High
Shoals, Lowell, McAdenville, Mount Holly, Ranlo, Spencer Mountain,
Stanley
$ 125,293,607
$ 40,085,380
Mecklenburg 546 74% Charlotte, Cornelius, Davidson, Huntersville,
Matthews, Mint Hill, Pineville
$ 682,682,436
$ 375,901,689
Union 640 25% Stallings $ 157,703,452 $ 3,261,509
Total $1,317,898,919 $576,416,200
Environmental Finance Center at the University of North Carolina | 16
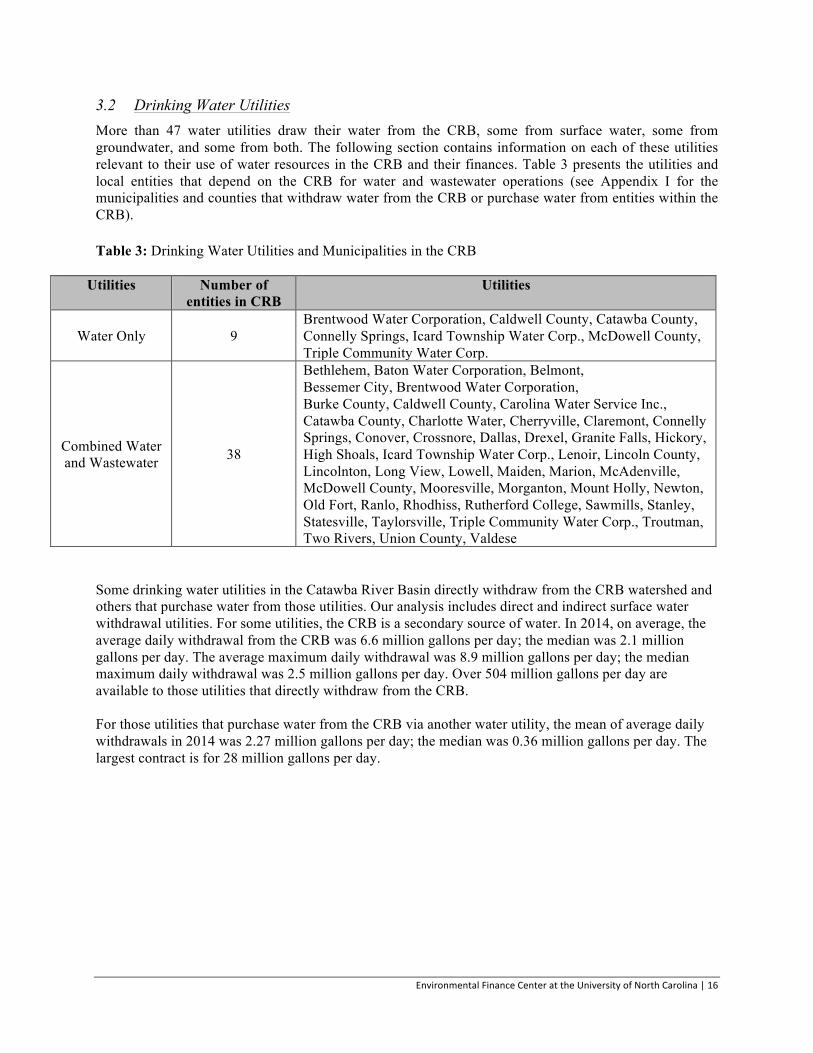
3.2 Drinking Water Utilities More than 47 water utilities draw their water from the CRB, some from surface water, some from groundwater, and some from both. The following section contains information on each of these utilities relevant to their use of water resources in the CRB and their finances. Table 3 presents the utilities and local entities that depend on the CRB for water and wastewater operations (see Appendix I for the municipalities and counties that withdraw water from the CRB or purchase water from entities within the CRB). Table 3: Drinking Water Utilities and Municipalities in the CRB
Some drinking water utilities in the Catawba River Basin directly withdraw from the CRB watershed and others that purchase water from those utilities. Our analysis includes direct and indirect surface water withdrawal utilities. For some utilities, the CRB is a secondary source of water. In 2014, on average, the average daily withdrawal from the CRB was 6.6 million gallons per day; the median was 2.1 million gallons per day. The average maximum daily withdrawal was 8.9 million gallons per day; the median maximum daily withdrawal was 2.5 million gallons per day. Over 504 million gallons per day are available to those utilities that directly withdraw from the CRB. For those utilities that purchase water from the CRB via another water utility, the mean of average daily withdrawals in 2014 was 2.27 million gallons per day; the median was 0.36 million gallons per day. The largest contract is for 28 million gallons per day.
Utilities Number of entities in CRB
Utilities
Water Only 9 Brentwood Water Corporation, Caldwell County, Catawba County, Connelly Springs, Icard Township Water Corp., McDowell County, Triple Community Water Corp.
Combined Water and Wastewater 38
Bethlehem, Baton Water Corporation, Belmont, Bessemer City, Brentwood Water Corporation, Burke County, Caldwell County, Carolina Water Service Inc., Catawba County, Charlotte Water, Cherryville, Claremont, Connelly Springs, Conover, Crossnore, Dallas, Drexel, Granite Falls, Hickory, High Shoals, Icard Township Water Corp., Lenoir, Lincoln County, Lincolnton, Long View, Lowell, Maiden, Marion, McAdenville, McDowell County, Mooresville, Morganton, Mount Holly, Newton, Old Fort, Ranlo, Rhodhiss, Rutherford College, Sawmills, Stanley, Statesville, Taylorsville, Triple Community Water Corp., Troutman, Two Rivers, Union County, Valdese

Environmental Finance Center at the University of North Carolina | 17
Table 4 outlines the 15 water utilities responsible for the largest water withdrawals or water purchases in the CRB (see Appendix II for complete list).
Table 4: 15 Largest Surface Water Withdrawals (or Max Contract) in 2014 (2013 if 2014 Local Water Supply data were not available)
Water Utility Reservoir Avg Daily
Withdrawal (MGD)
Max Day Withdrawal
(MGD)**
Available Raw Water Supply
(MGD)
Avg Daily Purchased
(MGD)
Max Contract
Charlotte Water
Lake Norman 17.910 25.75 55.0
Mt. Island Lake 79.0 104.9 108.0
Union County Purchases regular water from Anson County and Catawba River Water Supply Project 11.15 28
Two Rivers Utilities
Mountain Island Lake 17.73 27.11 75.0
South Fork Catawba
River 0 0 15.5
Hickory Lake Hickory 11.076 14.1 54.0
Morganton Catawba River 8.6 13.6 18.0
Mooresville Lake Norman 5.349 7.497 18.00
Lenoir Lake Rhodhiss 5.934 7.115 12.0
Lincolnton South Fork Catawba
River 3.063 5.871 12.0
Valdese Lake Rhodhiss 2.9 5.3 12.0
Statesville Lookout Shoals Lake 3.144 4.517 15
Marion
Buck Creek 0.624 2.8 2.8
Clear Creek 0.286 0.4 0.4
Mackey’s Creek 0.52 0.9 0.9
Mount Holly Mt. Island Lake 2.56 3.59 13.1
Maiden Purchases regular water from Hickory 1.241 3.25
Conover Purchases regular water from Hickory (Lake Hickory) 1.498 3.0
Belmont Lake Wylie 1.753 2.722 10.0
(Source: NC Local Water Supply Plans) *Ratio withdraw / supply was taken from LWSP and reflects purchase agreements and GW sources as well **Some systems reported a maximum of “0” on their Local Water Supply Plans
Environmental Finance Center at the University of North Carolina | 18
In 2014, the drinking water and wastewater utilities in the CRB collectively collected over $3.5 billion in revenues from over 465,000 residential customers and over 40,000 commercial customers. Far and above the rest, Charlotte Water accounted for $3.3 billion with 241,439 residential and 19,925 commercial customers. The least amount collected in annual revenues for an individual utility was $68,937 in McDowell County from 184 residential and 11 commercial customers. On average, the utilities in the CRB collected over $89 million in revenues; the median annual water and wastewater revenue was $2.3 million. The average number of residential customers was 10,582; the median was 2,834. The average number of commercial customers was 993; the median was 243. Charges for water service are typically divided between base charges and volumetric charges. Base charges may vary based on meter size or customer type and are charged on a regular basis, no matter the customer’s consumption. The minimum fixed base charge in the CRB is $0 (Mount Holly); the maximum base charge for residential and commercial customers was $30.18 per month (Catawba County). The average base charge for residential customers was $15.01 per month; the median was very close at $15.09 per month. For commercial customers, the average base charge was slightly higher at $15.87; the mean base charge for commercial customers was $15.24. Volumetric rates may vary by customer type, as well. A common consumption point to compare for residential customers is 5,000 gallons per month. This is slightly higher than the average residential water use in the CRB at 3,924 gallons per month. The minimum rate at 5,000 gallons charged by water utilities to residential in the CRB is $1.14 per thousand gallon (Morganton); the maximum rate was $7.62 per thousand gallon (Troutman). The average rate was $4.06 per thousand gallon; the median rate was $4.18 per thousand gallon. Commercial customers typically use more water than residential customers. The average water use for commercial customers in the CRB was 22,644 gallons per month; the median was 14,413 gallons per month. One utility reported very small demand from its commercial customers at 3,696 gallons per month (Stanley). The maximum average commercial water use reported in 2014 was 187,500 gallons per month by Drexel. The goal of the Catawba-Wateree River Basin Water Supply Master Plan is to “protect and preserve our available water supply and extend it into the next century.” The Catawba-Wateree Water Management Group recognizes that water efficiency will be critical in that effort. Water pricing will be an important method for achieving both water efficiency and financial resiliency. The Environmental Finance Center maintains a comprehensive database of water prices in the State of North Carolina and visualizes this data on the North Carolina Water and Wastewater Rates Dashboard. One dial on the dashboard evaluates water efficiency price signals in rates. It is important to note that if water (or wastewater) rates were increased for the purposes of raising money for watershed protection, it would have an additional benefit of encouraging water efficiency due to the price elasticity of demand.
Environmental Finance Center at the University of North Carolina | 19
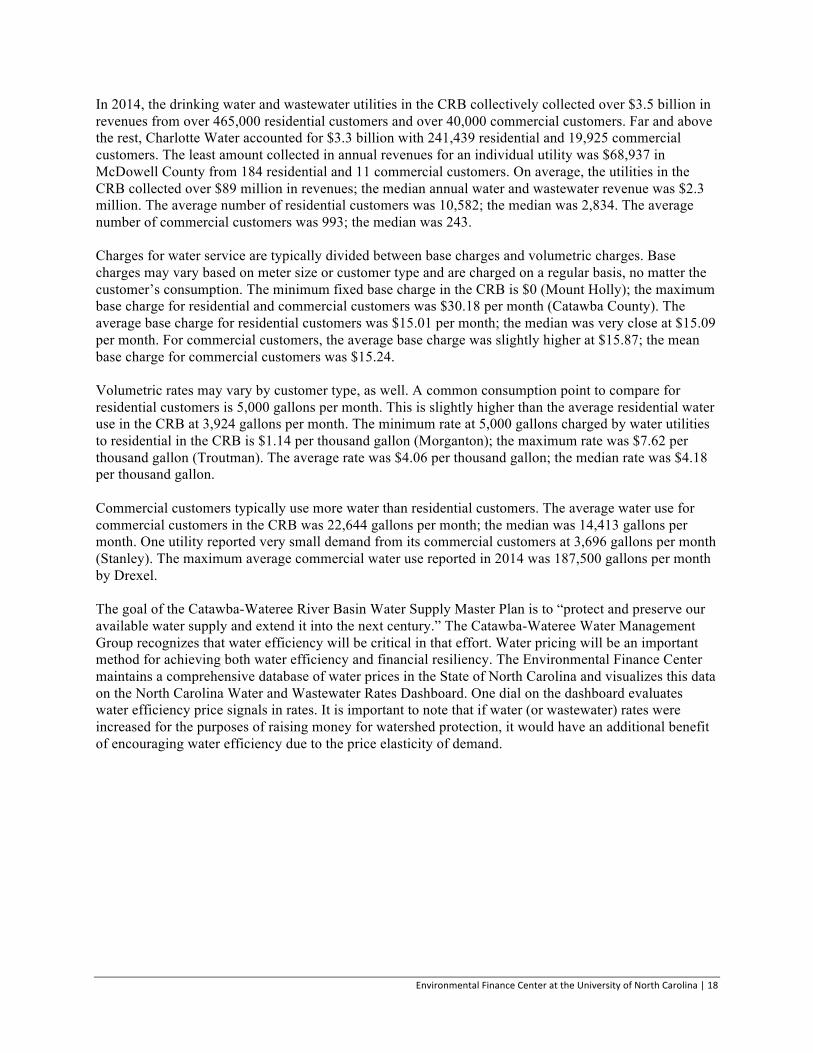
Table 5 summarizes current water rates charged by 15 largest revenue-generating utilities in the CRB (see Appendix III for complete list). Data was obtained from the local water supply plan (LWSP), annual financial data report (AFIR), and the 2014 EFC rate survey. This information was incorporated into the dashboard for the CRB to produce scenarios for the average impact on a household and the total revenue generated with an increase in the base or rate charge. Table 5: Water Utility Rates for 15 Largest Utilities Based on Annual Revenue Rates were converted to kgal for comparison.
Annual Water and
Wastewater Revenues
Number of Connections
(Res.)
Number of Connections
(Comm.)
Existing Water Base
Charge (Res.)
Water Rate at 5,000
Gallons (Res.)
Existing Water Base
Charge (Comm.)
Water Rate at 20,000
Gallons (Comm.)
Charlotte Water $3,356,959,937 241,439 19,925 $2.47 $3.56 $4.93 $3.49
Two Rivers Utilities $34,229,137 24,728 2,802 $11.86 $2.64 $11.86 $2.89
Union County $29,773,736 41,347 2,215 $6.10 $2.65 $6.10 $2.70
Hickory $22,956,285 19,212 3,472 $15.09 $1.47 $15.09 $1.47
Mooresville $19,635,753 11,232 1,864 $7.11 $5.19 $7.11 $4.87
Morganton $10,526,607 8,605 1,301 $8.70 $1.14 $8.70 $1.14
Statesville $9,433,727 9,527 2,095 $7.00 $2.77 $7.00 $2.77
Lincolnton $8,380,928 4,352 581 $15.32 $4.13 $15.32 $4.57
Lenoir $8,367,409 9,080 741 $10.02 $3.17 $10.02 $3.17
Lincoln County $7,673,169 9,810 711 $20.00 $4.72 $20.00 $5.72
Mount Holly $6,530,248 5,789 371 $0.00 $3.35 $0.00 $5.09
Belmont $6,046,318 4,543 324 $13.57 $6.98 $13.57 $6.04
Newton $6,002,377 5,485 464 $23.05 $2.75 $23.05 $2.75
Valdese $4,799,219 4,999 179 $27.24 $2.60 $26.26 $2.60
Conover $3,945,895 4,975 314 $11.00 $1.86 $11.00 $1.86
(Source: EFC 2015 Rates Survey and NC Local Government Commission)

Environmental Finance Center at the University of North Carolina | 20
3.3 Point Source (Municipal Wastewater Discharge in the CRB) Wastewater systems with sanitary overflow from pipes also contribute to water pollution in the CRB, particularly during heavy rain events. As a result, the analysis explores the revenue potential for watershed protection of wastewater utilities serving customers in the CRB. More than 42 wastewater utilities discharge into the CRB (Table 6). The following section contains information on each of these utilities relevant to their discharge into the CRB and their finances. Table 6: Wastewater Utilities in the CRB
This section examines centralized, municipal-owned wastewater treatment plants. We acknowledge that decentralized wastewater, such as septic tanks, are located throughout the CRB; however, due to lack of sufficient data we have not addressed these systems from a revenueshed standpoint, and they are not currently included in this analysis. Just as with the drinking water utilities, some wastewater utilities directly discharge into the Catawba River Basin, while others indirectly discharge through interconnections with other utilities. Across the basin, the mean average daily discharge for all wastewater utilities in the CRB was 1.9 million gallons per day; the mean was 0.3 million gallons per day. But the capacity that the systems have to discharge is much higher. The design capacity for direct dischargers or the maximum contract for indirect discharges averages around 3.7 million gallons per permit, with a mean of 0.75 million gallons per day.
Utilities Number of entities in CRB
Cities, Counties, Utilities
Wastewater Only 4 Cajah’s Mountain, Gamewell, Hildrebran, Sedgefield Sanitary District
Combined Water and Wastewater 38
Bethlehem, Baton Water Corporation, Belmont, Bessemer City, Brentwood Water Corporation, Burke County, Caldwell county, Carolina Water Service Inc., Catawba County, Charlotte Water, Cherryville, Claremont, Connelly Springs, Conover, Crossnore, Dallas, Drexel, Granite Falls, Hickory, High Shoals, Icard Township Water Corp., Lenoir, Lincoln County, Lincolnton, Long View, Lowell, Maiden, Marion, McAdenville, McDowell County, Mooresville, Morganton, Mount Holly, Newton, Old Fort, Ranlo, Rhodhiss, Rutherford College, Sawmills, Stanley, Statesville, Taylorsville, Triple Community Water Corp., Troutman, Two Rivers, Union County, Valdese
Environmental Finance Center at the University of North Carolina | 21
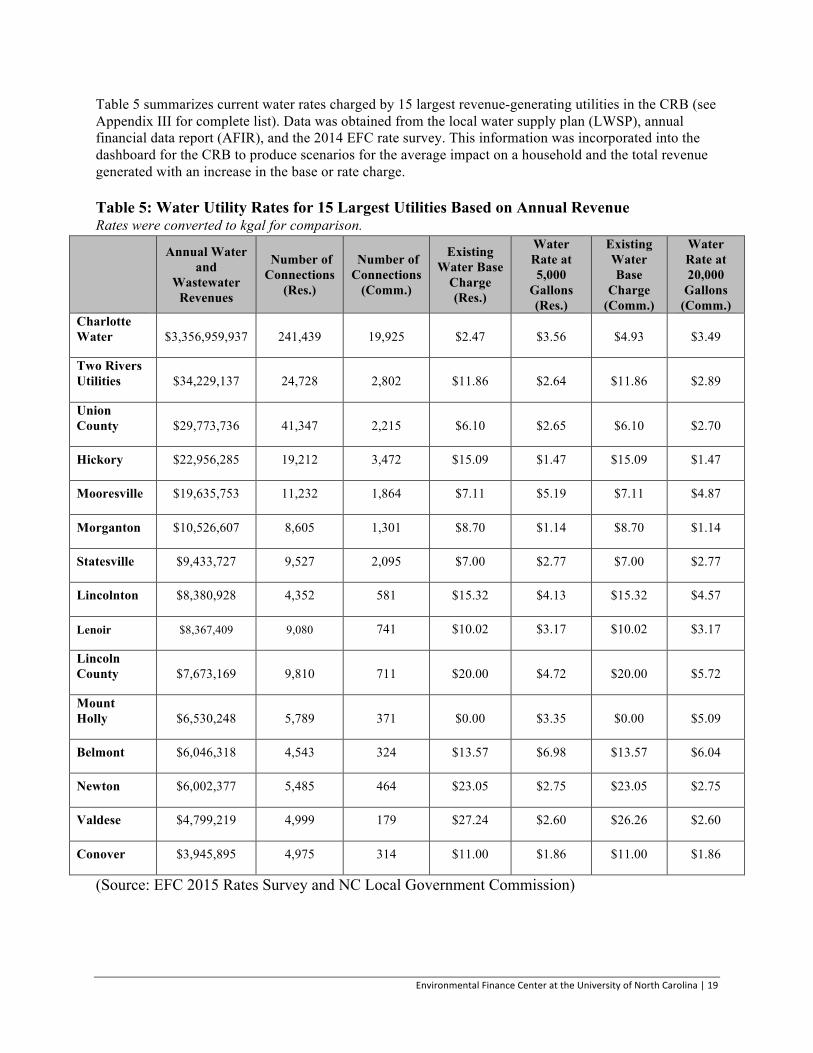
Table 7 identifies the largest municipal wastewater dischargers into the CRB, based on the total average daily discharge from their direct discharges and/or interconnections. (See Appendix IV for complete list.)
Table 7: Attributes of 15 Largest Municipal Wastewater Treatment Plants Discharging Into CRB (Based on sum of average daily discharge into the Catawba
Wastewater Utility
Direct Discharge (DD)
or Interconnection
(I)
Wastewater Interconnect
-ion
Design Capacity or Maximum
Contract (MGD)
Average Daily
Discharge (MGD)
Sum of Average
Daily Discharge
(MG)
Receiving Stream(s)
Charlotte Water
DD 20.0 11.42
84.0
Little Sugar Creek DD 15.0 9.13 Irwin Creek
DD 64.0 46.67 McAlpine Creek
DD 12.0 8.233 Mallard Creek DD 12.0 4.9 McDowell Creek
I Cabarrus County 0 3.660 Rocky River
Two Rivers Utilities
I City of Mooresville 2.000 0.001
9.4
See Mooresville
DD 4.0 0.595 South Fork
DD 16.0 6.2 South Fork
DD 0.75 0.22 Long Creek Tributary
DD 6.0 2.4 Crowders
Union County
DD 0.05 0.031
8.4
Clear Creek
DD 1.9 1.189 North Fork Crooked Creek
DD 0.231 0 Goose Creek
DD 6.0 3.291 Twelve Mile Creek
DD 0.05 0.03 Crooked Creek
DD 0.15 0.052 Land Application
I Charlotte Water 3.00 2.285 See Charlotte Water
I Lancaster County, SC 0.025 0.010
I Monroe 2.650 1.503
Hickory
DD 6.0 2.805
6.3
Catawba River
DD 9.0 2.547 Henry Fork River
DD 0 0.533 Catawba River
I City of Conover 0.625 0.423 See Conover
Morganton DD 10.5 4.7 4.7 Catawba River
Mooresville DD 7.5 3.957 4.0 Dye Creek
Environmental Finance Center at the University of North Carolina | 22
Wastewater Utility
Direct Discharge (DD)
or Interconnection
(I)
Wastewater Interconnect
-ion
Design Capacity or Maximum
Contract (MGD)
Average Daily
Discharge (MGD)
Sum of Average
Daily Discharge
(MG)
Receiving Stream(s)
Lenoir
DD 2.0 1.209
3.6
Gunpowder Creek
DD 6.0 2.408 Lower Creek
DD 3.9 0.014 Lake Rhodhiss
I Town of Sawmills 0.250 0.010 See Sawmills
Lincolnton DD 6.0 2.533 2.5 Catawba River South Fork
Mount Holly DD 4.0 2.240 2.2 Catawba River
Newton DD 7.5 1.753 1.8 Clark Creek
Conover
DD 1.5 0.658
1.5
Lyle Creek
DD 0.3 0 McLin Creek
DD 0.3 0 McLin Creek
I City of Newton 1.050 0.841 See Newton
Belmont DD 5.0 1.36
1.4 Catawba River
11.51 Dry Tons 0.272 Dry Tons Land Application
Cherryville DD 2.0 0.568
1.3 Indian Creek
DD 2.0 0.763 Land Application
Marion DD 3.0 0.977 1.3 Muddy Creek DD 0.68 0.288 Nicks Creek
McAdenville DD 0.13 0.036 South Fork Valdese DD 7.5 1.9 Lake Rhodhiss
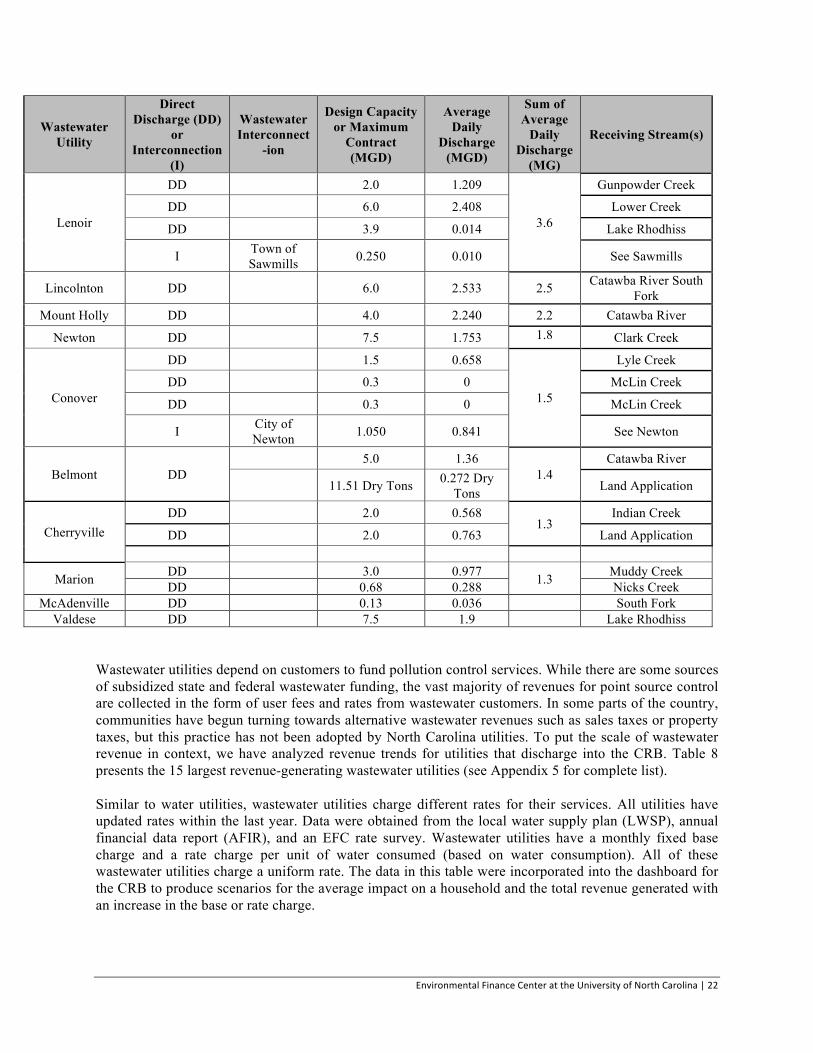
Wastewater utilities depend on customers to fund pollution control services. While there are some sources of subsidized state and federal wastewater funding, the vast majority of revenues for point source control are collected in the form of user fees and rates from wastewater customers. In some parts of the country, communities have begun turning towards alternative wastewater revenues such as sales taxes or property taxes, but this practice has not been adopted by North Carolina utilities. To put the scale of wastewater revenue in context, we have analyzed revenue trends for utilities that discharge into the CRB. Table 8 presents the 15 largest revenue-generating wastewater utilities (see Appendix 5 for complete list). Similar to water utilities, wastewater utilities charge different rates for their services. All utilities have updated rates within the last year. Data were obtained from the local water supply plan (LWSP), annual financial data report (AFIR), and an EFC rate survey. Wastewater utilities have a monthly fixed base charge and a rate charge per unit of water consumed (based on water consumption). All of these wastewater utilities charge a uniform rate. The data in this table were incorporated into the dashboard for the CRB to produce scenarios for the average impact on a household and the total revenue generated with an increase in the base or rate charge.
Environmental Finance Center at the University of North Carolina | 23
In 2014, the drinking water and wastewater utilities in the CRB collectively collected over $3.5 billion in revenues from over 465,000 residential customers and over 40,000 commercial customers. Far and above the rest, Charlotte Water accounted for $3.3 billion with 241,439 residential and 19,925 commercial customers. The least amount collected in annual revenues for an individual utility was $68,937 in McDowell County from 184 residential and 11 commercial customers. On average, the utilities in the CRB collected over $89 million in revenues; the median annual water and wastewater revenue was $2.3 million. The average number of residential customers was 10,582; the median was 2,834. The average number of commercial customers was 993; the median was 243. Charges for wastewater service is also divided between a base charge and volumetric charges. Base charges may vary based on meter size or customer type and are charged on a regular basis, no matter the customer’s consumption. The minimum fixed base charge in the CRB is $0 (Mount Holly); the maximum base charge for residential and commercial customers was $33.02 per month (Carolina Water Service). The average base charge for residential customers was $14.60 per month; the median was very close at $15.25 per month. The average base charge for commercial customers was $15.28 per month; the median was $15.55. Volumetric rates may vary by customer type, as well. A common consumption point to compare for residential customers is 5,000 gallons per month. This is slightly higher than the average residential water use in the CRB at 3,924 gallons per month. Since wastewater is typically billed against metered water consumption, this amount was used to compare wastewater rates, as well. The minimum rate per thousand gallon charged by wastewater utilities to residential in the CRB is $1.42 (Drexel); the maximum rate was $14.45 per thousand gallons (Stanley). The average rate was $5.31 per thousand gallons; the median rate was $4.84 per thousand gallons. Commercial customers typically use more water than residential customers. The average water use for commercial customers in the CRB was 22,644 gallons per month. At 20,000 gallons per month, Drexel charged the least for wastewater services at $1.42 per thousand gallon. Stanley charged the most at $18.80 per thousand gallon.
Environmental Finance Center at the University of North Carolina | 24
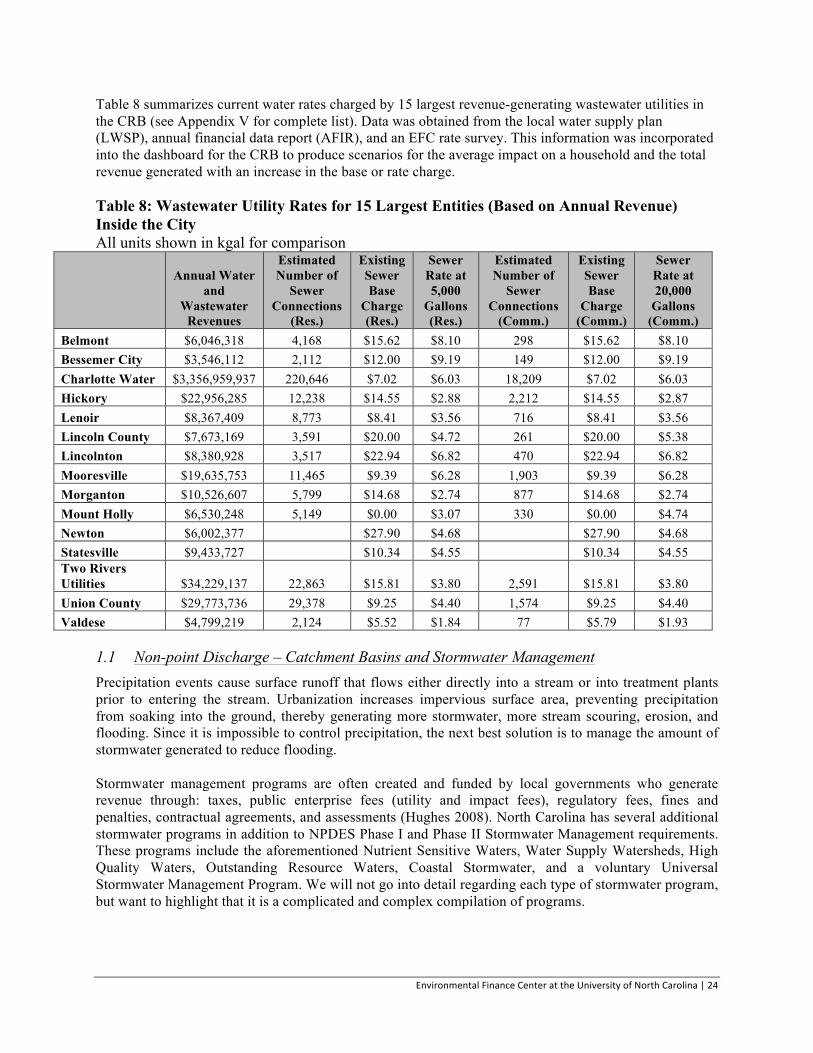
Table 8 summarizes current water rates charged by 15 largest revenue-generating wastewater utilities in the CRB (see Appendix V for complete list). Data was obtained from the local water supply plan (LWSP), annual financial data report (AFIR), and an EFC rate survey. This information was incorporated into the dashboard for the CRB to produce scenarios for the average impact on a household and the total revenue generated with an increase in the base or rate charge. Table 8: Wastewater Utility Rates for 15 Largest Entities (Based on Annual Revenue) Inside the City All units shown in kgal for comparison
Annual Water and
Wastewater Revenues
Estimated Number of
Sewer Connections
(Res.)
Existing Sewer Base
Charge (Res.)
Sewer Rate at 5,000
Gallons (Res.)
Estimated Number of
Sewer Connections
(Comm.)
Existing Sewer Base
Charge (Comm.)
Sewer Rate at 20,000
Gallons (Comm.)
Belmont $6,046,318 4,168 $15.62 $8.10 298 $15.62 $8.10 Bessemer City $3,546,112 2,112 $12.00 $9.19 149 $12.00 $9.19 Charlotte Water $3,356,959,937 220,646 $7.02 $6.03 18,209 $7.02 $6.03 Hickory $22,956,285 12,238 $14.55 $2.88 2,212 $14.55 $2.87 Lenoir $8,367,409 8,773 $8.41 $3.56 716 $8.41 $3.56 Lincoln County $7,673,169 3,591 $20.00 $4.72 261 $20.00 $5.38 Lincolnton $8,380,928 3,517 $22.94 $6.82 470 $22.94 $6.82 Mooresville $19,635,753 11,465 $9.39 $6.28 1,903 $9.39 $6.28 Morganton $10,526,607 5,799 $14.68 $2.74 877 $14.68 $2.74 Mount Holly $6,530,248 5,149 $0.00 $3.07 330 $0.00 $4.74 Newton $6,002,377
$27.90 $4.68
$27.90 $4.68
Statesville $9,433,727
$10.34 $4.55
$10.34 $4.55 Two Rivers Utilities $34,229,137 22,863 $15.81 $3.80 2,591 $15.81 $3.80 Union County $29,773,736 29,378 $9.25 $4.40 1,574 $9.25 $4.40 Valdese $4,799,219 2,124 $5.52 $1.84 77 $5.79 $1.93
1.1 Non-point Discharge – Catchment Basins and Stormwater Management Precipitation events cause surface runoff that flows either directly into a stream or into treatment plants prior to entering the stream. Urbanization increases impervious surface area, preventing precipitation from soaking into the ground, thereby generating more stormwater, more stream scouring, erosion, and flooding. Since it is impossible to control precipitation, the next best solution is to manage the amount of stormwater generated to reduce flooding. Stormwater management programs are often created and funded by local governments who generate revenue through: taxes, public enterprise fees (utility and impact fees), regulatory fees, fines and penalties, contractual agreements, and assessments (Hughes 2008). North Carolina has several additional stormwater programs in addition to NPDES Phase I and Phase II Stormwater Management requirements. These programs include the aforementioned Nutrient Sensitive Waters, Water Supply Watersheds, High Quality Waters, Outstanding Resource Waters, Coastal Stormwater, and a voluntary Universal Stormwater Management Program. We will not go into detail regarding each type of stormwater program, but want to highlight that it is a complicated and complex compilation of programs.
Environmental Finance Center at the University of North Carolina | 25
In this report, we focus on stormwater utilities since they are responsible for generating a dedicated revenue stream for stormwater management. Stormwater programs that are not included in a utility are mostly funded through property tax revenues and administered through another branch of city or county government. While these programs spend money for stormwater protection, the revenue stream is embedded within other funds and it is difficult to get accurate quantitative data for stormwater revenue. In North Carolina there were 38 stormwater utilities in 2006 (defined as a separate fee for the explicit purpose of stormwater management) and 52 stormwater utilities in 2012 (EFC 2011). A stormwater utility is responsible for finding the most cost effective way to comply with water quality standards and protect the quality of the receiving water body. The cities of Belmont, Bessemer, Cramerton, Gastonia, Mount Holly, Ranlo, and Stallings all operate stormwater utilities. Charlotte-Mecklenburg collects stormwater fees for a number of nearby municipalities, including Charlotte, Cornelius, Huntersville, Matthews, Mint Hill, Pineville, and unincorporated areas of Mecklenburg County. Geographically, each of the municipalities that currently have stormwater utilities are in the lower portions of the North Carolina Catawba Riverbasin. Table 9 includes revenue and rate data for each of these utilities.

Environmental Finance Center at the University of North Carolina | 27
Table 9: Stormwater Rates and Revenues for Stormwater Utilities in the CRB (FY14)
Stormwater Entity
Stormwater Annual
Revenue (FY14)
Basis of Fee (Res.)
Monthly Rate (Res.)
Average Monthly Charge
Residential Units
Number of Accounts
(Res.)
Basis of Fee (Comm.)
Monthly Rate (Comm.)
Commercial Unit
Number of Accounts (Comm.)
Belmont Data
unavailable Flat $3.00 $3.00
4,000 Flat $14.00
325 Bessemer City
Data unavailable Flat $2.07 $2.07
2,149 Flat $2.07
203
Charlotte $56,976,805 Tiered $10.18 $10.18 At Tier 2 142,666 Per Acre $156.41
Per Acre of Impervious
Surface 20,097
Cornelius $639,290 Tiered $4.17 $4.17 At Tier 2
Per Acre $56.19
Per Acre of Impervious
Surface
Cramerton $68,291
Data unavailable 1,682 Data unavailable 126 Dallas $88,281 Data unavailable
Davidson $238,692 Tiered $5.22 $5.22 At Tier 2 Data
unavailable Per Acre $87.00
Per Acre of Impervious
Surface Data
unavailable
Gastonia $2,140,036 Flat $3.25 $3.25
Data unavailable ERU $3.25
Data unavailable
Huntersville $1,370,272 Tiered $4.17 $4.17 At Tier 2 Data
unavailable Per Acre $ 56.19
Per Acre of Impervious
Surface Data
unavailable
Matthews $1,013,697 Tiered $4.17 $4.17 At Tier 2 Data
unavailable Per Acre $ 56.19
Per Acre of Impervious
Surface Data
unavailable

Environmental Finance Center at the University of North Carolina | 28
Stormwater Entity
Stormwater Annual
Revenue (FY14)
Basis of Fee (Res.)
Monthly Rate (Res.)
Average Monthly Charge
Residential Units
Number of Accounts
(Res.)
Basis of Fee (Comm.)
Monthly Rate (Comm.)
Commercial Unit
Number of Accounts (Comm.)
Mecklenburg County $1,339,077 Tiered $3.79 $3.79 At Tier 2 Data
unavailable Per Acre $ 49.85 Per Acre of Impervious
Surface
Data unavailable
Mint Hill $584,225 Tiered $4.17 $4.17 At Tier 2 Data unavailable Per Acre $56.19
Per Acre of Impervious
Surface
Data unavailable
Mooresville $814,602 ERU @ 2,700 sf $3.40 $3.40 Per ERU Data
unavailable ERU @ 2,700 sf $3.40 Data
unavailable Data
unavailable
Mount Holly $244,522 ERU $2.50 $2.50 Per ERU Data unavailable ERU $ 2.50 Data
unavailable Data
unavailable
Pineville $550,249 Tiered $4.17 $4.17 At Tier 2 Data unavailable Per Acre $ 56.19
Per Acre of Impervious
Surface
Data unavailable
Ranlo Data unavailable
Water Use (Per 1,000 Gallons)
$1.80 $9.00 Per 1,000 Gallons
Data unavailable
Water Use (Per 1,000 Gallons)
$1.80 Per Thousand Gallon
Data unavailable
Stallings $464,000
Flat (One Charge
Per Year; $46
divided by 12)
$3.83 $3.83 0 Data unavailable
ERU @ 2,060 sf $33.00
Data unavailable
Environmental Finance Center at the University of North Carolina | 29
4. Conclusion: Ongoing applications of the revenueshed concept The revenueshed concept was applied to the Catawba River Basin with the intention of generating conversations between multiple jurisdictions regarding how to protect the water quality of the nine water supply reservoirs located in CRB and how to generate a sustainable revenue fund dedicated to watershed protection. In conjunction with this report, a financial model (dashboard) was developed to help decision-makers test various scenarios for raising money (additional to existing revenue) to protect water quality in the Catawba River Basin.
5. Literature Cited American Rivers 2008. America’s Most Endangered Rivers. Accessed March 2015.
http://www.americanrivers.org/MER/PDFs/MER_2008.pdf
Annual Financial Information Reports (North Carolina State Treasurer). 2014. County and Municipal Financial Data. http://www.nctreasurer.com/lgc/units/unitlistjs.htm.
Artz, Jessica. 2008. Interbasin Water Transfers in the Southeastern United States: An Analysis of the Catawba Interbasin Transfer as a Water Management Tool. http://www.law.sc.edu/environmental/papers/200811/eas/artz.pdf.
Catawba Riverkeeper. About the Catawba-Wateree River. http://www.catawbariverkeeper.org/about-the-catawba/catawba-wateree-facts/.
Catawba Riverkeeper(a), no date. EPA Report Shows Catawba River Threatened by Coal Ash Waste. Accessed March 2015. http://www.catawbariverkeeper.org/epa-report-shows-catawba-river-threatened-by-coal-ash-waste.
Catawba Riverkeeper(b), no date. The Endangered River. Accessed March 2015. http://www.catawbariverkeeper.org/the-endangered-river.
Catawba Riverkeeper(c), no date. The Water of the Catawba. Accessed March 2015. http://www.catawbariverkeeper.org/join/about-the-catawba/maps-of-the-basin/the-water-of-the-catawba
EPA (Environmental Protection Agency) 2011. NC 2010 Integrated Report Categories 4 and 5 Impaired Waters. http://portal.ncdenr.org/c/document_library/get_file?uuid=8ff0bb29-62c2-4b33-810c-2eee5afa75e9&groupId=38364. Accessed through NCDENR portal on April 25, 2011.
Georgoulias, B. 2010. DWQ’s Stormwater Programs: Overview and Recent Changes. Presented at the Water Resources Research Institute & NC DWQ Stormwater Program Workshop in Clemmons, NC. April 22,2010. http://www.ncsu.edu/wrri/events/dwq/spring10/DWQ_SWPrograms_Overview_Apr2010.pdf. Last Accessed June 2011.
Gerlak, A.K. 2006. Federalism and U.S. Water Policy: Lessons for the Twenty-first Century. Publius: The Journal of Federalism 36 (2): pp. 231-257. DOI: 10.1093/publius/pji032.
Grigg, N.S. 1999. Integrated Water Resources Management: Who should lead, who should pay? Journal of the American Water Resources Association 35 (3): pp. 527-534.
Hughes, J. 2014. Institutional Models for Sharing Water Resource Protection Costs among Multiple Partners. The Environmental Finance Center at UNC Chapel Hill. http://www.efc.sog.unc.edu/reslib/item/institutional-models-sharing-water-resource-protection-costs-among-multiple-partners Accessed May 2014.
Environmental Finance Center at the University of North Carolina | 30
Kramer, R.A. and J.I. Eisen-Hecht. 2002. Estimating the Economic Value of Water Quality Protection in the Catawba River Basin. Water Resources Research. 38 (9), 1182, DOI: 10.1029/2001WR000755.
Natural Resources Conservation Service. 2010. Lower Catawba Subbasin. Accessed March 2015. http://www.esri.sc.edu/projects/usda/conservation_documents/RWAs/Lower%20Catawba.pdf.
Natural Resources Conservation Service. 2010. Upper Catawba Subbasin. Accessed March 2015. http://www.esri.sc.edu/projects/usda/conservation_documents/RWAs/Upper%20Catawba.pdf.
Natural Resources Conservation Service. 2010. Wateree Subbasin. Accessed March 2015. http://www.esri.sc.edu/projects/usda/conservation_documents/RWAs/Wateree.pdf.
North Carolina Department of Environment and Natural Resources, Office of Environmental Education and Public Affairs. No date. Catawba River Basin. http://www.eenorthcarolina.org/images/River%20Basin%20Images/final_web_catawba.pdf.
North Carolina Department of Environment and Natural Resources. 2009. Conservation Easement Program Annual Report to the Environmental Review Commission. Accessed March 2011. http://www.onencnaturally.com/PDFs/2009_Conservation_Tax_Credit_Program_Report_to_ERC.pdf
NC Division of Water Quality. 2007. Catawba River Basin Water Resources Plan.. Accessed March 2015. http://www.ncwater.org/files/publications/Final_Draft_Catawba_River_Basin_Plan_2007.pdf.
NC Division of Water Quality. 2010. South Fork of the Catawba River Basin. Accessed March 2015. http://portal.ncdenr.org/c/document_library/get_file?uuid=279b9508-0973-420f-b3d8-dfb67383f57e&groupId=38364.
Prahalad, P.P., M.P. Claggett, and N.T. Hoagland. 2007. Beyond Water Quality: can the Clean Water Act be used to reduce the quantity of stormwater runoff? Urban Law 39: pp. 85-110.
Stabley, Susan. 2010. Concord, Kannapolis Settle Catawba Water Dispute. Charlotte Business Journal. http://www.bizjournals.com/charlotte/stories/2010/01/18/daily22.html?page=all.
Steinmetz, Jeffrey A., and Reed M. Perkins. One Glass for Two People: C Case of Water Use Rights in the Eastern United States. National Center For Case Study Teaching in Science. http://sciencecases.lib.buffalo.edu/cs/files/water_rights.pdf.
White House Council on Environmental Quality. 2010. Progress Report of the Interagency Climate Change Adaptation Task Force: Recommended Actions in Support of a National Climate Change Adaptation Strategy. Pp 53. http://www.whitehouse.gov/sites/default/files/microsites/ceq/Interagency-Climate-Change-Adaptation-Progress-Report.pdf
Environmental Finance Center at the University of North Carolina | 31
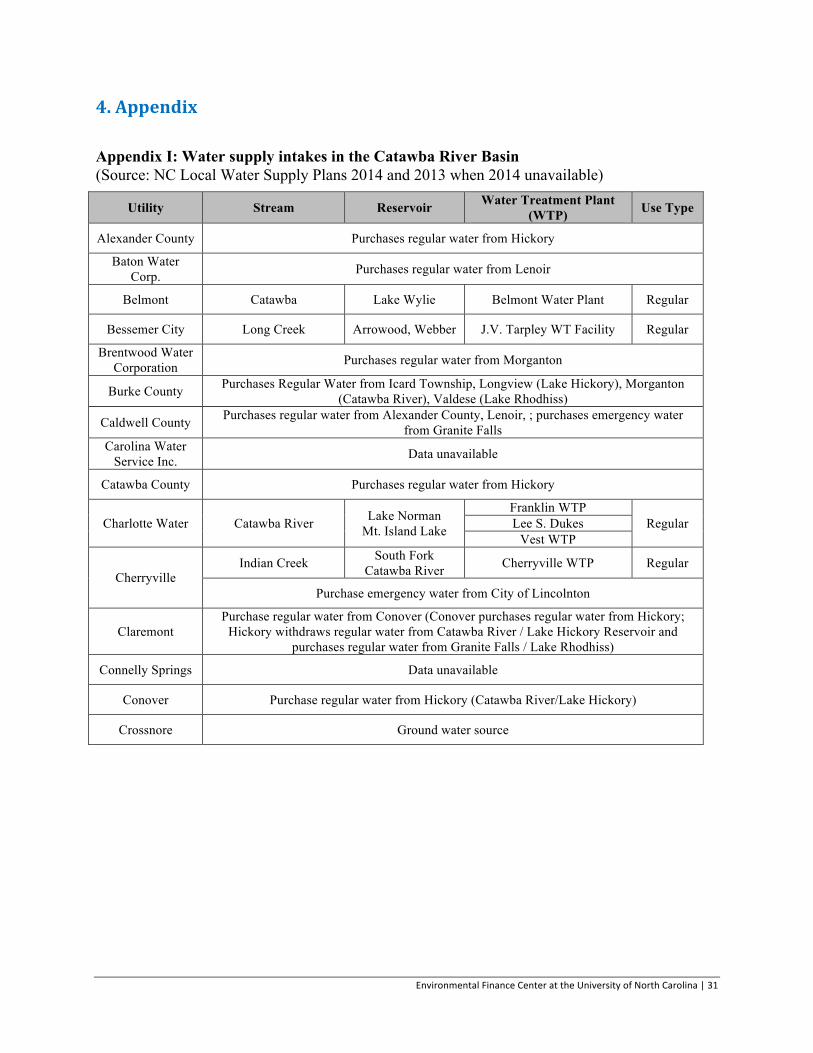
4. Appendix Appendix I: Water supply intakes in the Catawba River Basin (Source: NC Local Water Supply Plans 2014 and 2013 when 2014 unavailable)
Utility Stream Reservoir Water Treatment Plant (WTP) Use Type
Alexander County Purchases regular water from Hickory
Baton Water Corp. Purchases regular water from Lenoir
Belmont Catawba Lake Wylie Belmont Water Plant Regular
Bessemer City Long Creek Arrowood, Webber J.V. Tarpley WT Facility Regular
Brentwood Water Corporation Purchases regular water from Morganton
Burke County Purchases Regular Water from Icard Township, Longview (Lake Hickory), Morganton (Catawba River), Valdese (Lake Rhodhiss)
Caldwell County Purchases regular water from Alexander County, Lenoir, ; purchases emergency water from Granite Falls
Carolina Water Service Inc. Data unavailable
Catawba County Purchases regular water from Hickory
Charlotte Water Catawba River Lake Norman Mt. Island Lake
Franklin WTP Regular Lee S. Dukes
Vest WTP
Cherryville Indian Creek South Fork
Catawba River Cherryville WTP Regular
Purchase emergency water from City of Lincolnton
Claremont Purchase regular water from Conover (Conover purchases regular water from Hickory;
Hickory withdraws regular water from Catawba River / Lake Hickory Reservoir and purchases regular water from Granite Falls / Lake Rhodhiss)
Connelly Springs Data unavailable
Conover Purchase regular water from Hickory (Catawba River/Lake Hickory)
Crossnore Ground water source

Environmental Finance Center at the University of North Carolina | 32
Utility Stream Reservoir Water Treatment Plant (WTP) Use Type
Dallas
South Fork Catawba River
Town of Dallas Water Treatment
Dallas WTP Regular Purchase emergency water
from Gastonia
Drexel
Purchase regular water from:
NA NA Regular Icard Township WC Longview Morganton
Valdese
Granite Falls Catawba River Lake Rhodhiss Granite Falls WTP Regular
Hickory Catawba River Lake Hickory Hickory WTP Regular
High Shoals Purchases regular water from Lincoln County
Lenoir Catawba River Lake Rhodhiss Lenoir-Lake Rhodhiss WTP Regular
Lincoln County Catawba River Lake Norman Lake Norman WTP Regular
Lincolnton
South Fork Catawba River NA City of Lincolnton WTP Regular
Purchase emergency water from City of Cherryville, Lincoln County
Longview Catawba River Lake Hickory Long View WTP Regular
Lowell Purchase 100% of water from Two Rivers Utilities
Maiden Purchase regular water from City of Hickory
Purchase emergency water from Newton
Marion Buck Creek
NA Marion Water Treatment Plant Regular Clear Creek
Mackey’s Creek
McAdenville Purchase Regular Water from Gastonia (Two Rivers Utilities) and Emergency Water from Lowell
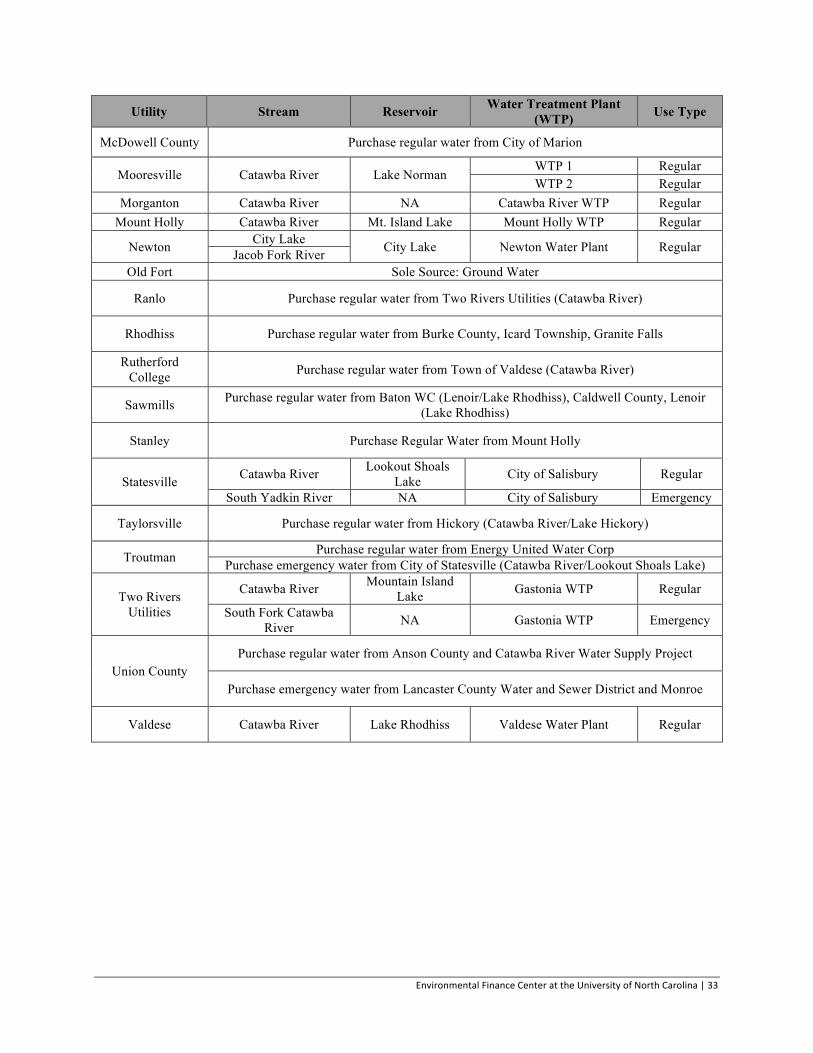
Environmental Finance Center at the University of North Carolina | 33
Utility Stream Reservoir Water Treatment Plant (WTP) Use Type
McDowell County Purchase regular water from City of Marion
Mooresville Catawba River Lake Norman WTP 1 Regular WTP 2 Regular
Morganton Catawba River NA Catawba River WTP Regular Mount Holly Catawba River Mt. Island Lake Mount Holly WTP Regular
Newton City Lake City Lake Newton Water Plant Regular Jacob Fork River Old Fort Sole Source: Ground Water
Ranlo Purchase regular water from Two Rivers Utilities (Catawba River)
Rhodhiss Purchase regular water from Burke County, Icard Township, Granite Falls
Rutherford College Purchase regular water from Town of Valdese (Catawba River)
Sawmills Purchase regular water from Baton WC (Lenoir/Lake Rhodhiss), Caldwell County, Lenoir (Lake Rhodhiss)
Stanley Purchase Regular Water from Mount Holly
Statesville Catawba River Lookout Shoals Lake City of Salisbury Regular
South Yadkin River NA City of Salisbury Emergency
Taylorsville Purchase regular water from Hickory (Catawba River/Lake Hickory)
Troutman Purchase regular water from Energy United Water Corp Purchase emergency water from City of Statesville (Catawba River/Lookout Shoals Lake)
Two Rivers Utilities
Catawba River Mountain Island Lake Gastonia WTP Regular
South Fork Catawba River NA Gastonia WTP Emergency
Union County Purchase regular water from Anson County and Catawba River Water Supply Project
Purchase emergency water from Lancaster County Water and Sewer District and Monroe
Valdese Catawba River Lake Rhodhiss Valdese Water Plant Regular
Environmental Finance Center at the University of North Carolina | 34
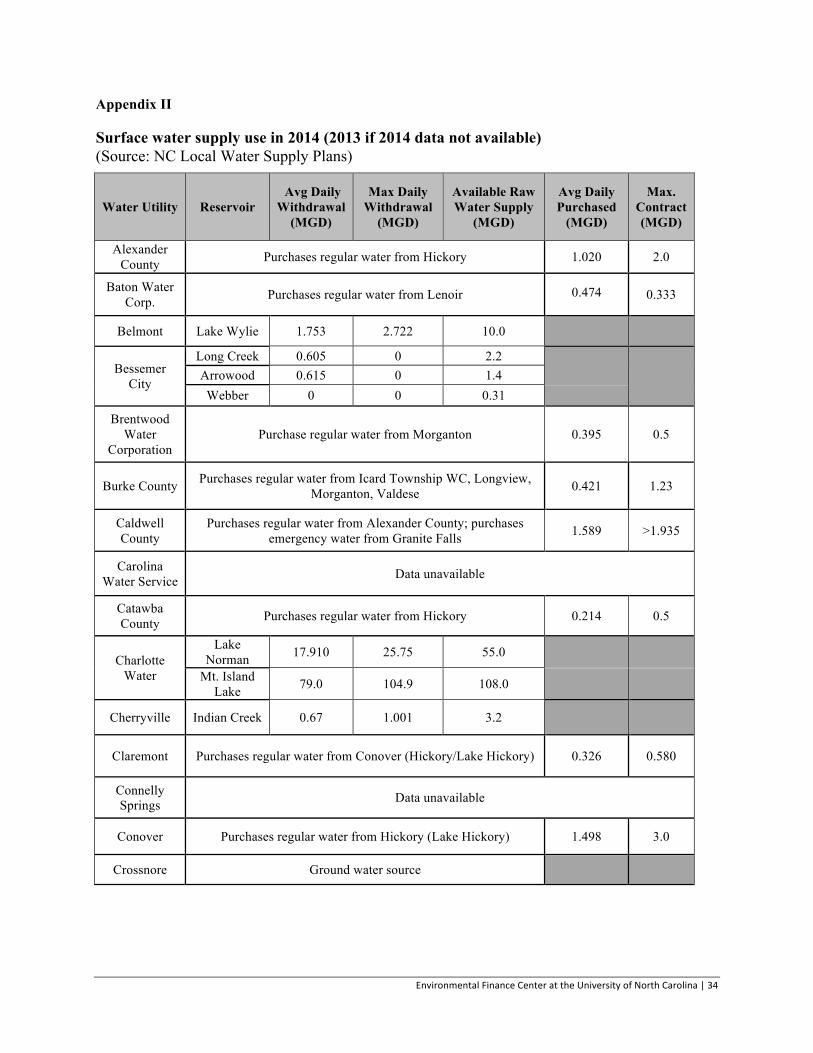
Appendix II
Surface water supply use in 2014 (2013 if 2014 data not available) (Source: NC Local Water Supply Plans)
Water Utility Reservoir Avg Daily
Withdrawal (MGD)
Max Daily Withdrawal
(MGD)
Available Raw Water Supply
(MGD)
Avg Daily Purchased
(MGD)
Max. Contract (MGD)
Alexander County Purchases regular water from Hickory 1.020 2.0
Baton Water Corp. Purchases regular water from Lenoir 0.474
0.333
Belmont Lake Wylie 1.753 2.722 10.0
Bessemer City
Long Creek 0.605 0 2.2
Arrowood 0.615 0 1.4 Webber 0 0 0.31
Brentwood Water
Corporation Purchase regular water from Morganton 0.395 0.5
Burke County Purchases regular water from Icard Township WC, Longview, Morganton, Valdese
0.421
1.23
Caldwell County
Purchases regular water from Alexander County; purchases emergency water from Granite Falls 1.589 >1.935
Carolina Water Service Data unavailable
Catawba County Purchases regular water from Hickory 0.214 0.5
Charlotte Water
Lake Norman 17.910 25.75 55.0
Mt. Island Lake 79.0 104.9 108.0
Cherryville Indian Creek 0.67 1.001 3.2
Claremont Purchases regular water from Conover (Hickory/Lake Hickory) 0.326 0.580
Connelly Springs Data unavailable
Conover Purchases regular water from Hickory (Lake Hickory) 1.498 3.0
Crossnore Ground water source

Environmental Finance Center at the University of North Carolina | 35
Water Utility Reservoir Avg Daily
Withdrawal (MGD)
Max Daily Withdrawal
(MGD)
Available Raw Water Supply
(MGD)
Avg Daily Purchased
(MGD)
Max. Contract (MGD)
Dallas
Town of Dallas Water
Treatment
0.656 0.841 1.0
Drexel Purchases regular water from Morganton 0.9 0.860
Granite Falls Lake Rhodhiss 1.168 2.329 2.5
Hickory Lake Hickory 11.076 14.1 54.0
High Shoals Purchases regular water from Lincoln County 0.029 0.1
Lenoir Lake Rhodhiss 5.934 7.115 12.0
Lincoln County
Lake Norman 2.5 0 12.0
Lincolnton South Fork Catawba
River 3.063 5.871 12.0
Longview Lake Hickory 0.813 1.091 2.0
Lowell Purchases regular water from Two Rivers Utilities 0.279 0.618
Maiden Purchases regular water from Hickory 1.241 3.25
Marion
Buck Creek 0.624 2.8 2.8 Clear Creek 0.286 0.4 0.4 Mackey’s
Creek 0.520 0.9 0.9
McAdenville Purchases regular water from Gastonia, purchases emergency water from Lowell 0.251 1
McDowell County Purchases regular water from Marion 0.036 0.2
Mooresville Lake Norman 5.349 7.497 18.00
Morganton Catawba River 8.6 13.6 18.0
Mount Holly Mt. Island Lake 2.56 3.59 13.1
Newton City Lake 3.747 0 8.0
Jacob Fork River 0 0 50.0
Old Fort Ground water source
Ranlo Purchases regular water from Two Rivers Utilities 0.321 0.5
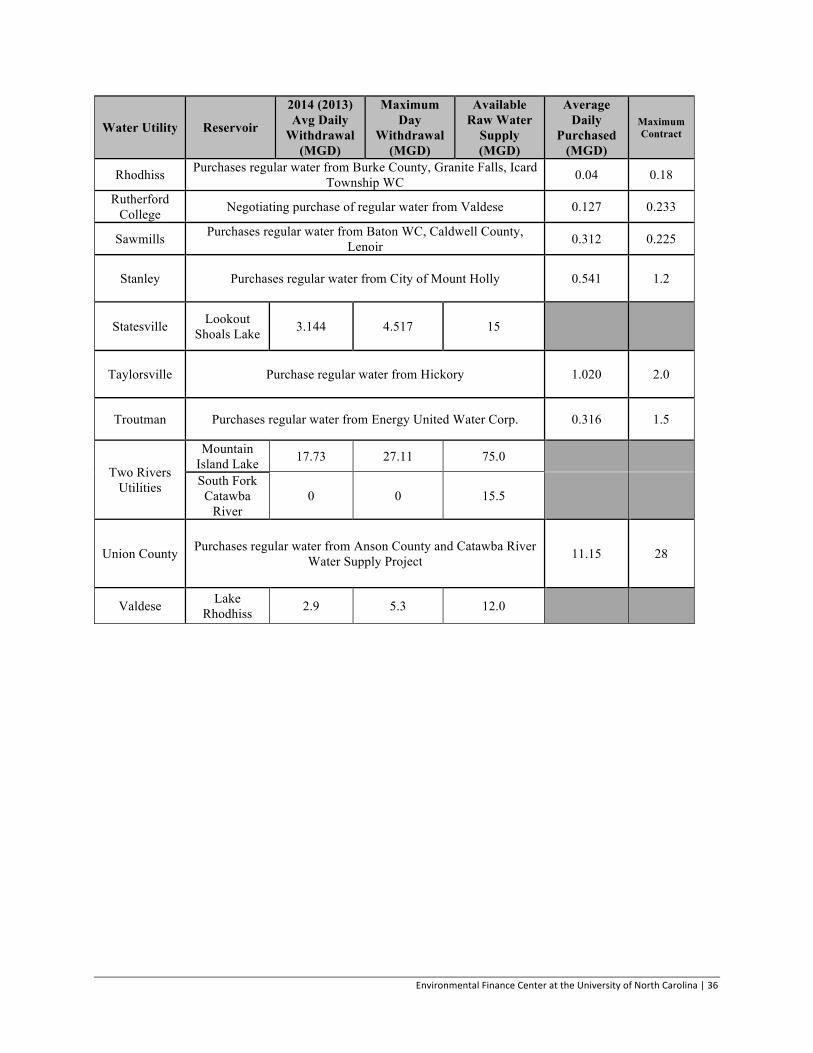
Environmental Finance Center at the University of North Carolina | 36
Water Utility Reservoir
2014 (2013) Avg Daily
Withdrawal (MGD)
Maximum Day
Withdrawal (MGD)
Available Raw Water
Supply (MGD)
Average Daily
Purchased (MGD)
Maximum Contract
Rhodhiss Purchases regular water from Burke County, Granite Falls, Icard Township WC 0.04 0.18
Rutherford College Negotiating purchase of regular water from Valdese 0.127 0.233
Sawmills Purchases regular water from Baton WC, Caldwell County, Lenoir 0.312 0.225
Stanley Purchases regular water from City of Mount Holly
0.541
1.2
Statesville Lookout Shoals Lake 3.144 4.517 15
Taylorsville Purchase regular water from Hickory 1.020 2.0
Troutman Purchases regular water from Energy United Water Corp. 0.316 1.5
Two Rivers Utilities
Mountain Island Lake 17.73 27.11 75.0
South Fork Catawba
River 0 0 15.5
Union County Purchases regular water from Anson County and Catawba River Water Supply Project 11.15 28
Valdese Lake Rhodhiss 2.9 5.3 12.0

Environmental Finance Center at the University of North Carolina | 37
Appendix III
Table 5: Water utility rates for customers inside the city limits (Source: EFC 2015 Rates Survey and NC Local Government Commission) Rates were converted to kgal for comparison.
Annual Water and
Wastewater Revenues
Number of Connections
(Res.)
Average Water Use
(Res.)
Number of Connections
(Comm.)
Average Water Use (Comm.)
Existing Water Base
Charge (Res.)
Water Rate at 5,000 Gallons
(Res.)
Existing Water Base
Charge (Comm.)
Water Rate at 20,000 Gallons
(Comm.)
Alexander County -
Bethlehem $2,328,982 4,638 3,913 264 26,023 $28.74 $1.47 $28.74 $1.47
Baton Water Corp.
Data unavailable 2,763 3,855 60 8,000 $18.55 $5.25 $18.55 $5.25
Belmont $6,046,318 4,543 3,975 324 16,019 $13.57 $6.98 $13.57 $6.04
Bessemer City $3,546,112 2,117 3,755 149 5,034 $8.80 $5.36 $8.80 $5.36
Brentwood Water
Corporation Data
unavailable 4,172 4,214 64 6,563 $16.50 $5.55 $16.50 $5.55
Burke County $1,481,228 1,739 3,399 32 75,000 $20.00 $4.56 $20.00 $4.56
Caldwell County $3,423,028 8,784 3,825 131 18,550 $20.25 $4.95 $21.81 $4.00
Carolina Water Service, Inc. Data unavailable $18.25 $5.44 $18.25 $5.44
Catawba County
677 5,406 49 28,163 $30.18 $2.94 $30.18 $2.94
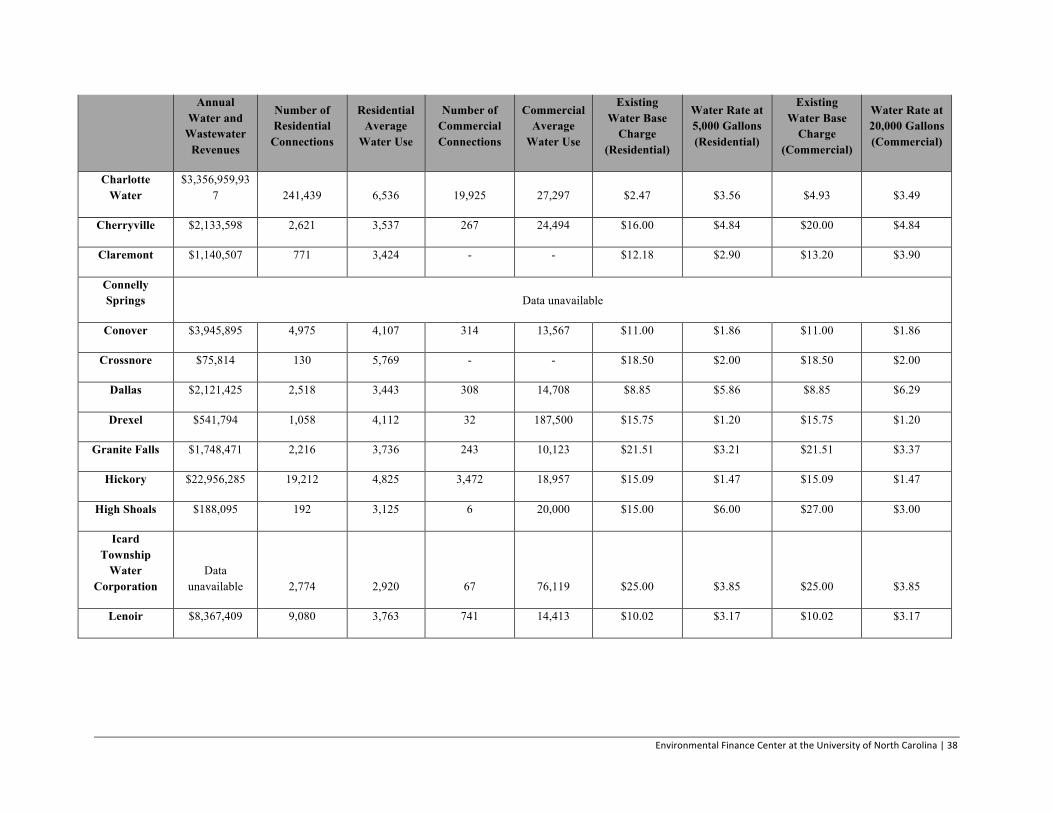
Environmental Finance Center at the University of North Carolina | 38
Annual Water and
Wastewater Revenues
Number of Residential
Connections
Residential Average
Water Use
Number of Commercial Connections
Commercial Average
Water Use
Existing Water Base
Charge (Residential)
Water Rate at 5,000 Gallons (Residential)
Existing Water Base
Charge (Commercial)
Water Rate at 20,000 Gallons (Commercial)
Charlotte Water
$3,356,959,937 241,439 6,536 19,925 27,297 $2.47 $3.56 $4.93 $3.49
Cherryville $2,133,598 2,621 3,537 267 24,494 $16.00 $4.84 $20.00 $4.84
Claremont $1,140,507 771 3,424 - - $12.18 $2.90 $13.20 $3.90
Connelly Springs Data unavailable
Conover $3,945,895 4,975 4,107 314 13,567 $11.00 $1.86 $11.00 $1.86
Crossnore $75,814 130 5,769 - - $18.50 $2.00 $18.50 $2.00
Dallas $2,121,425 2,518 3,443 308 14,708 $8.85 $5.86 $8.85 $6.29
Drexel $541,794 1,058 4,112 32 187,500 $15.75 $1.20 $15.75 $1.20
Granite Falls $1,748,471 2,216 3,736 243 10,123 $21.51 $3.21 $21.51 $3.37
Hickory $22,956,285 19,212 4,825 3,472 18,957 $15.09 $1.47 $15.09 $1.47
High Shoals $188,095 192 3,125 6 20,000 $15.00 $6.00 $27.00 $3.00
Icard Township
Water Corporation
Data unavailable 2,774 2,920 67 76,119 $25.00 $3.85 $25.00 $3.85
Lenoir $8,367,409 9,080 3,763 741 14,413 $10.02 $3.17 $10.02 $3.17

Environmental Finance Center at the University of North Carolina | 39
Annual Water and
Wastewater Revenues
Number of Residential
Connections
Residential Average
Water Use
Number of Commercial Connections
Commercial Average
Water Use
Existing Water Base
Charge (Residential)
Water Rate at 5,000 Gallons (Residential)
Existing Water Base
Charge (Commercial)
Water Rate at 20,000 Gallons (Commercial)
Lincoln County $7,673,169 9,810 4,281 711 8,439 $20.00 $4.72 $20.00 $5.72
Lincolnton $8,380,928 4,352 3,971 581 17,246 $15.32 $4.13 $15.32 $4.57
Long View $2,090,265 2,705 2,784 392 20,128 $15.10 $2.26 $15.10 $2.26
Lowell $958,705 1,521 3,688 102 9,118 $7.66 $5.78 $10.55 $7.66
Maiden $2,148,268 1,726 3,720 127 6,850 $14.16 $2.77 $14.16 $2.77
Marion $3,088,810 4,000 3,315 296 22,601 $13.41 $2.20 $13.41 $2.20
McAdenville $371,143 249 3,253 32 4,688 $3.64 $5.03 $3.64 $5.03
McDowell County $68,937 184 3,261 11 13,636 $12.00 $4.50 $12.00 $4.50
Mooresville $19,635,753 11,232 4,006 1,864 45,064 $7.11 $5.19 $7.11 $4.87
Morganton $10,526,607 8,605 5,254 1,301 23,359 $8.70 $1.14 $8.70 $1.14
Mount Holly $6,530,248 5,789 5,198 371 13,181 $0.00 $3.35 $0.00 $5.09
Newton $6,002,377 5,485 3,506 464 13,836 $23.05 $2.75 $23.05 $2.75
Old Fort $432,603 620 3,000 73 7,397 Data Unavailable
Ranlo $1,143,042 1,425 3,600 32 12,188 $11.05 $6.41 $11.05 $6.41
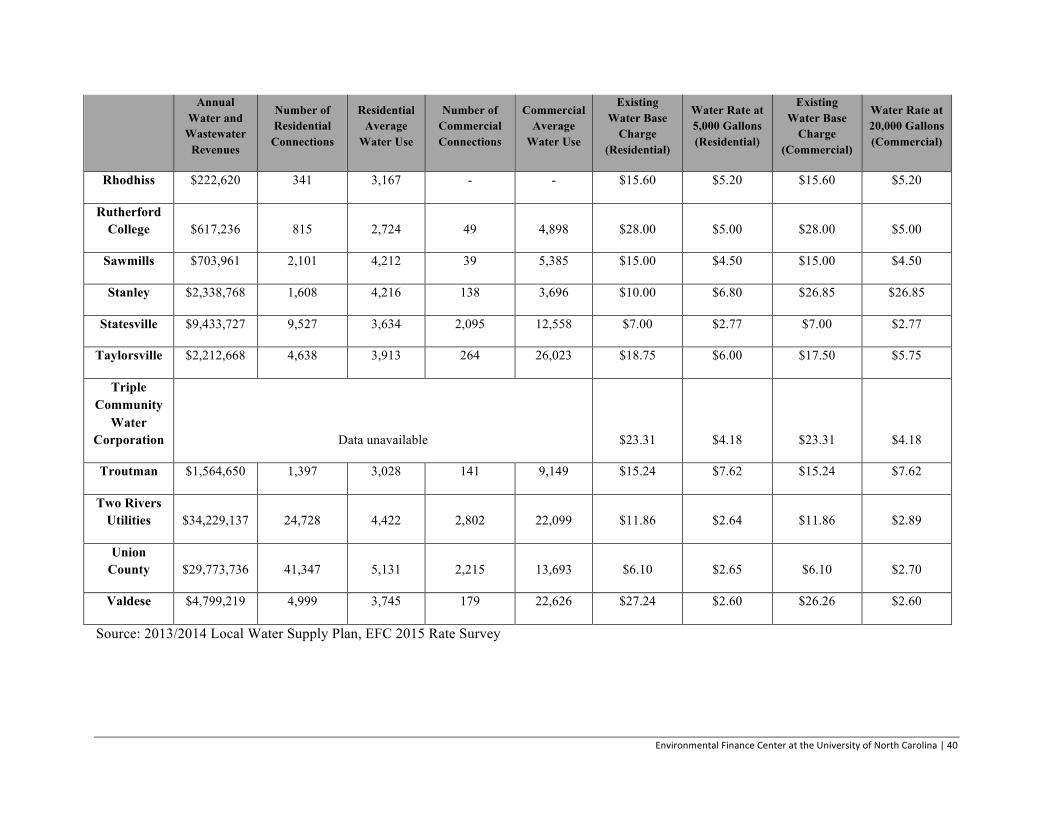
Environmental Finance Center at the University of North Carolina | 40
Annual Water and
Wastewater Revenues
Number of Residential
Connections
Residential Average
Water Use
Number of Commercial Connections
Commercial Average
Water Use
Existing Water Base
Charge (Residential)
Water Rate at 5,000 Gallons (Residential)
Existing Water Base
Charge (Commercial)
Water Rate at 20,000 Gallons (Commercial)
Rhodhiss $222,620 341 3,167 - - $15.60 $5.20 $15.60 $5.20
Rutherford College $617,236 815 2,724 49 4,898 $28.00 $5.00 $28.00 $5.00
Sawmills $703,961 2,101 4,212 39 5,385 $15.00 $4.50 $15.00 $4.50
Stanley $2,338,768 1,608 4,216 138 3,696 $10.00 $6.80 $26.85 $26.85
Statesville $9,433,727 9,527 3,634 2,095 12,558 $7.00 $2.77 $7.00 $2.77
Taylorsville $2,212,668 4,638 3,913 264 26,023 $18.75 $6.00 $17.50 $5.75
Triple Community
Water Corporation Data unavailable $23.31 $4.18 $23.31 $4.18
Troutman $1,564,650 1,397 3,028 141 9,149 $15.24 $7.62 $15.24 $7.62
Two Rivers Utilities $34,229,137 24,728 4,422 2,802 22,099 $11.86 $2.64 $11.86 $2.89
Union County $29,773,736 41,347 5,131 2,215 13,693 $6.10 $2.65 $6.10 $2.70
Valdese $4,799,219 4,999 3,745 179 22,626 $27.24 $2.60 $26.26 $2.60
Source: 2013/2014 Local Water Supply Plan, EFC 2015 Rate Survey

Environmental Finance Center at the University of North Carolina | 41
Appendix IV Attributes of municipal wastewater treatment plants discharging to CRB
Wastewater Utility
Direct Discharge (DD)
or Interconnection
(I)
Wastewater Interconnection
Design Capacity or Maximum Contract
(MGD)
Average Daily
Discharge (MGD)
Receiving Stream(s)
Alexander County I City of Hickory 0.5 0.061 See Hickory
Baton Water Corp. Data Unavailable
Belmont DD 5.0 1.36 Catawba River
11.51 Dry Tons 0.272 Dry Tons
Land Application
Bessemer City DD 1.5 0 Abernathy
Creek I City of Gastonia 1.609 0.686 See Gastonia
Burke County I City of Hickory 0.500 0.274 See Hickory
I City of Hickory 0.500 0.313 See Valdese
Cajah’s Mountain Data unavailable
Carolina Water Service Data unavailable
Charlotte Water
DD 20.0 11.42 Little Sugar Creek
DD 15.0 9.13 Irwin Creek DD 64.0 46.67 McAlpine Creek DD 12.0 8.233 Mallard Creek
DD 12.0 4.9 McDowell Creek
I Cabarrus County 0 3.660 Rocky River
Cherryville DD 2.0 0.568 Indian Creek
DD 2.0 0.763 Land Application
Claremont DD 0.1 0 Tributary DD 0.1 0.071 North DD 0.3 0.16 McLin Creek
Conover
DD 1.5 0.658 Lyle Creek DD 0.3 0 McLin Creek DD 0.3 0 McLin Creek
I City of Newton 1.050 0.841 See Newton
Crossnore DD 0.07 0.014 Mill Timber Creek
Dallas DD 0.6 0.37 UT Long Creek
DD 0 0.07 South Fork Catawba River
Drexel I Town of Valdese 0.500 0.182 See Valdese Gamewell Data Unavailable
Granite Falls DD 0.75 0.305 Gundpowder Creek
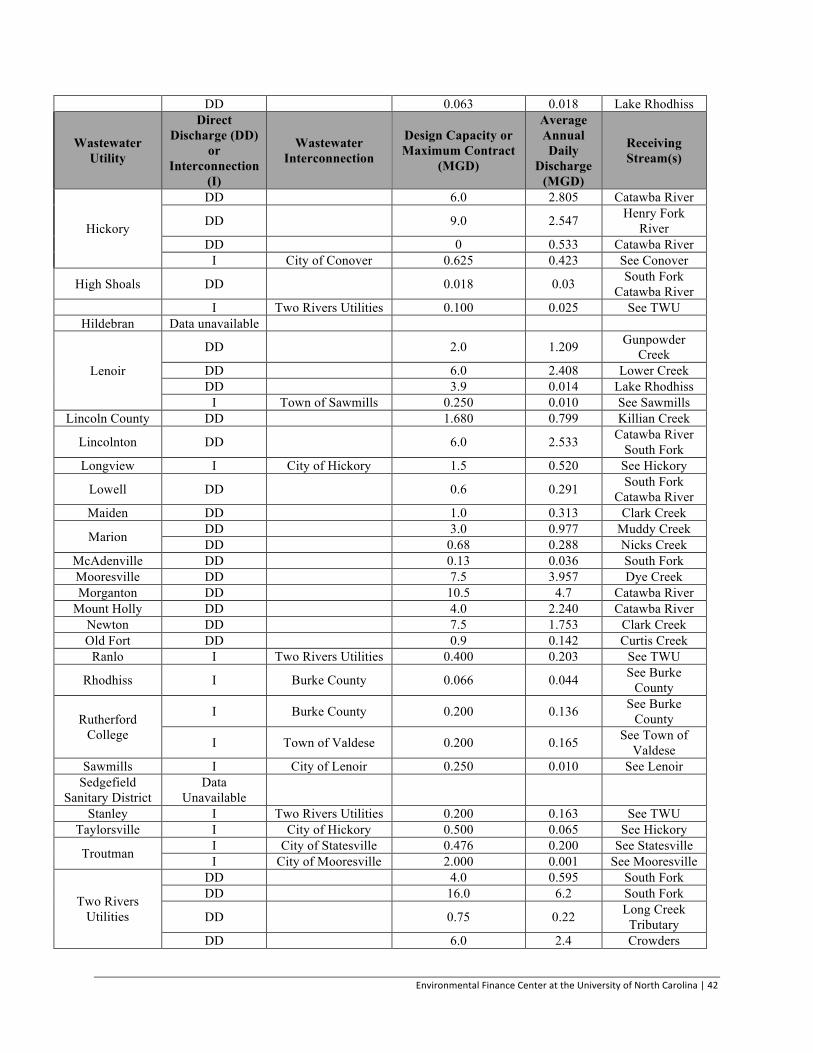
Environmental Finance Center at the University of North Carolina | 42
DD 0.063 0.018 Lake Rhodhiss
Wastewater Utility
Direct Discharge (DD)
or Interconnection
(I)
Wastewater Interconnection
Design Capacity or Maximum Contract
(MGD)
Average Annual Daily
Discharge (MGD)
Receiving Stream(s)
Hickory
DD 6.0 2.805 Catawba River
DD 9.0 2.547 Henry Fork River
DD 0 0.533 Catawba River I City of Conover 0.625 0.423 See Conover
High Shoals DD 0.018 0.03 South Fork Catawba River
I Two Rivers Utilities 0.100 0.025 See TWU Hildebran Data unavailable
Lenoir
DD 2.0 1.209 Gunpowder Creek
DD 6.0 2.408 Lower Creek DD 3.9 0.014 Lake Rhodhiss
I Town of Sawmills 0.250 0.010 See Sawmills Lincoln County DD 1.680 0.799 Killian Creek
Lincolnton DD 6.0 2.533 Catawba River South Fork
Longview I City of Hickory 1.5 0.520 See Hickory
Lowell DD 0.6 0.291 South Fork Catawba River
Maiden DD 1.0 0.313 Clark Creek
Marion DD 3.0 0.977 Muddy Creek DD 0.68 0.288 Nicks Creek
McAdenville DD 0.13 0.036 South Fork Mooresville DD 7.5 3.957 Dye Creek Morganton DD 10.5 4.7 Catawba River
Mount Holly DD 4.0 2.240 Catawba River Newton DD 7.5 1.753 Clark Creek Old Fort DD 0.9 0.142 Curtis Creek
Ranlo I Two Rivers Utilities 0.400 0.203 See TWU
Rhodhiss I Burke County 0.066 0.044 See Burke County
Rutherford College
I Burke County 0.200 0.136 See Burke County
I Town of Valdese 0.200 0.165 See Town of Valdese
Sawmills I City of Lenoir 0.250 0.010 See Lenoir Sedgefield
Sanitary District Data
Unavailable
Stanley I Two Rivers Utilities 0.200 0.163 See TWU Taylorsville I City of Hickory 0.500 0.065 See Hickory
Troutman I City of Statesville 0.476 0.200 See Statesville I City of Mooresville 2.000 0.001 See Mooresville
Two Rivers Utilities
DD 4.0 0.595 South Fork DD 16.0 6.2 South Fork
DD 0.75 0.22 Long Creek Tributary
DD 6.0 2.4 Crowders
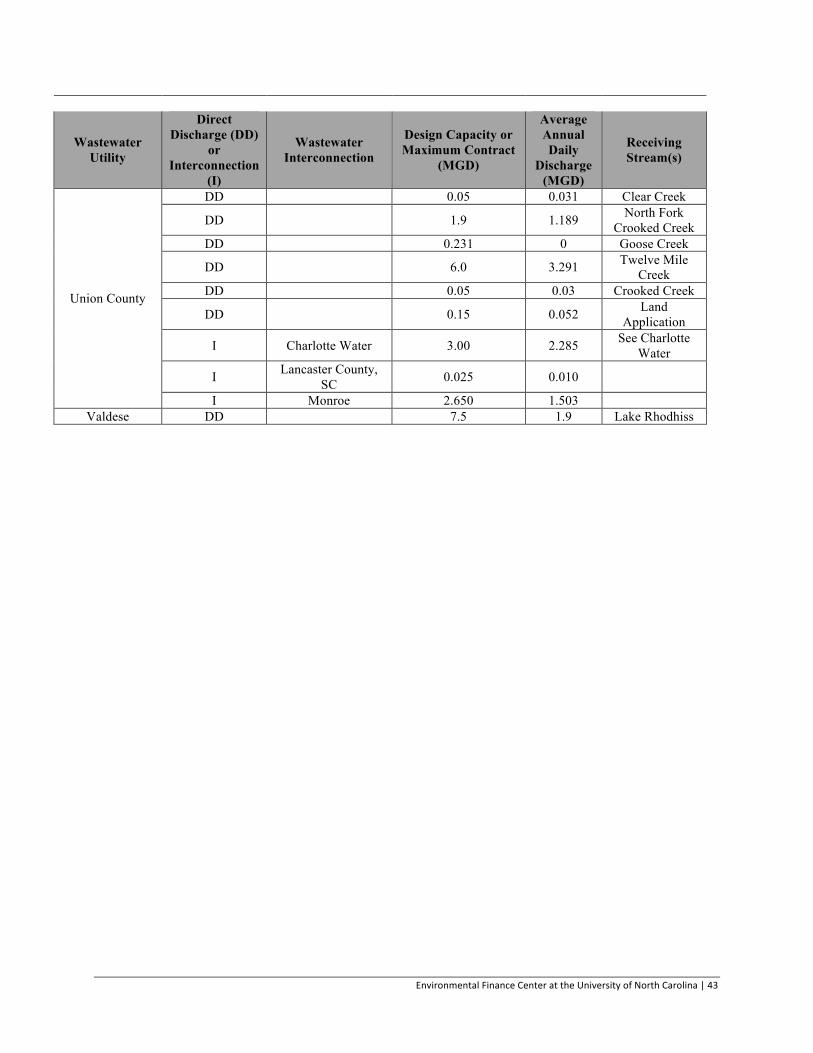
Environmental Finance Center at the University of North Carolina | 43
Wastewater Utility
Direct Discharge (DD)
or Interconnection
(I)
Wastewater Interconnection
Design Capacity or Maximum Contract
(MGD)
Average Annual Daily
Discharge (MGD)
Receiving Stream(s)
Union County
DD 0.05 0.031 Clear Creek
DD 1.9 1.189 North Fork Crooked Creek
DD 0.231 0 Goose Creek
DD 6.0 3.291 Twelve Mile Creek
DD 0.05 0.03 Crooked Creek
DD 0.15 0.052 Land Application
I Charlotte Water 3.00 2.285 See Charlotte Water
I Lancaster County, SC 0.025 0.010
I Monroe 2.650 1.503 Valdese DD 7.5 1.9 Lake Rhodhiss
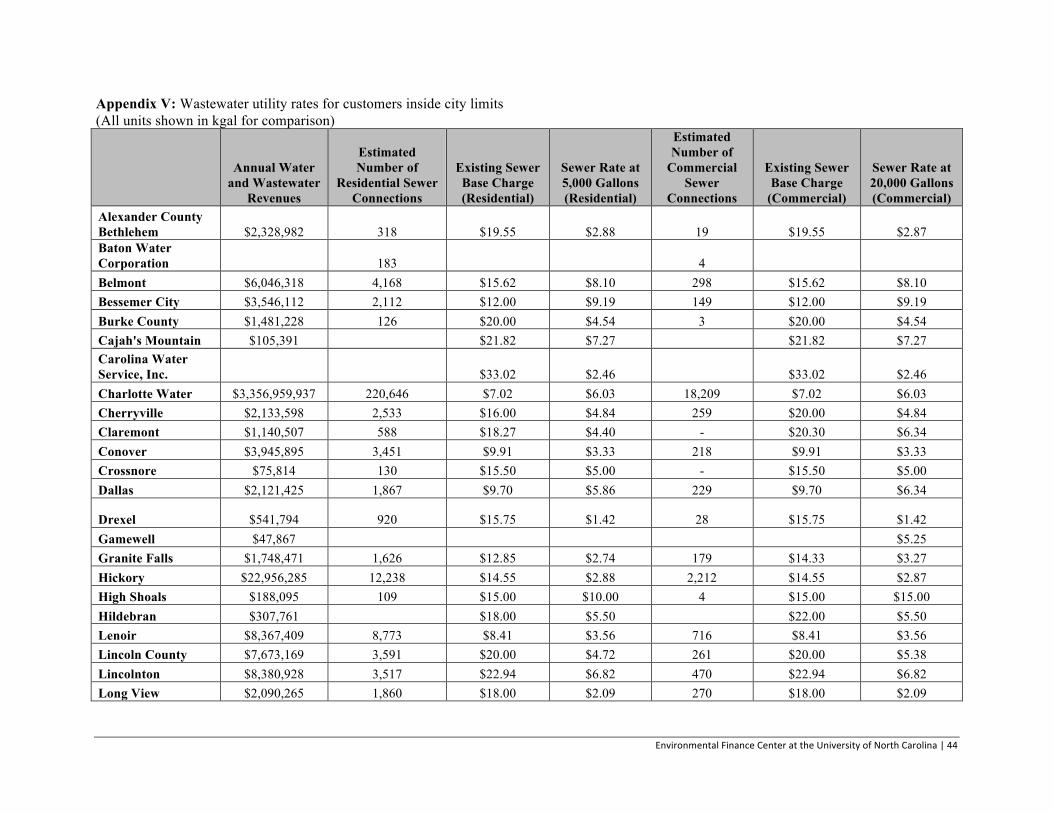
Environmental Finance Center at the University of North Carolina | 44
Appendix V: Wastewater utility rates for customers inside city limits (All units shown in kgal for comparison)
Annual Water and Wastewater
Revenues
Estimated Number of
Residential Sewer Connections
Existing Sewer Base Charge (Residential)
Sewer Rate at 5,000 Gallons (Residential)
Estimated Number of
Commercial Sewer
Connections
Existing Sewer Base Charge
(Commercial)
Sewer Rate at 20,000 Gallons (Commercial)
Alexander County Bethlehem $2,328,982 318 $19.55 $2.88 19 $19.55 $2.87 Baton Water Corporation
183
4
Belmont $6,046,318 4,168 $15.62 $8.10 298 $15.62 $8.10 Bessemer City $3,546,112 2,112 $12.00 $9.19 149 $12.00 $9.19 Burke County $1,481,228 126 $20.00 $4.54 3 $20.00 $4.54 Cajah's Mountain $105,391
$21.82 $7.27
$21.82 $7.27
Carolina Water Service, Inc.
$33.02 $2.46
$33.02 $2.46
Charlotte Water $3,356,959,937 220,646 $7.02 $6.03 18,209 $7.02 $6.03 Cherryville $2,133,598 2,533 $16.00 $4.84 259 $20.00 $4.84 Claremont $1,140,507 588 $18.27 $4.40 - $20.30 $6.34 Conover $3,945,895 3,451 $9.91 $3.33 218 $9.91 $3.33 Crossnore $75,814 130 $15.50 $5.00 - $15.50 $5.00 Dallas $2,121,425 1,867 $9.70 $5.86 229 $9.70 $6.34
Drexel $541,794 920 $15.75 $1.42 28 $15.75 $1.42 Gamewell $47,867
$5.25
Granite Falls $1,748,471 1,626 $12.85 $2.74 179 $14.33 $3.27 Hickory $22,956,285 12,238 $14.55 $2.88 2,212 $14.55 $2.87 High Shoals $188,095 109 $15.00 $10.00 4 $15.00 $15.00 Hildebran $307,761
$18.00 $5.50
$22.00 $5.50
Lenoir $8,367,409 8,773 $8.41 $3.56 716 $8.41 $3.56 Lincoln County $7,673,169 3,591 $20.00 $4.72 261 $20.00 $5.38 Lincolnton $8,380,928 3,517 $22.94 $6.82 470 $22.94 $6.82 Long View $2,090,265 1,860 $18.00 $2.09 270 $18.00 $2.09

Environmental Finance Center at the University of North Carolina | 45
Annual Water and Wastewater
Revenues
Estimated Number of
Residential Sewer Connections
Existing Sewer Base Charge (Residential)
Sewer Rate at 5,000 Gallons (Residential)
Estimated Number of
Commercial Sewer
Connections
Existing Sewer Base Charge
(Commercial)
Sewer Rate at 20,000 Gallons (Commercial)
Lowell $958,705 1,551 $8.75 $5.15 104 $9.04 $4.99 Maiden $2,148,268 1,423 $14.47 $4.84 105 $14.47 $4.84 Marion $3,088,810 2,841 $13.41 $2.20 211 $13.41 $2.20 McAdenville $371,143 164 $4.00 $9.00 21 $4.00 $9.00 Mooresville $19,635,753 11,465 $9.39 $6.28 1,903 $9.39 $6.28 Morganton $10,526,607 5,799 $14.68 $2.74 877 $14.68 $2.74 Mount Holly $6,530,248 5,149 $0.00 $3.07 330 $0.00 $4.74 Newton $6,002,377
$27.90 $4.68
$27.90 $4.68
Old Fort $432,603 400
47 Ranlo $1,143,042 1,343 $6.41 $6.41 31 $6.41 $6.41
Rhodhiss $222,620 289 $15.60 $7.15 - $15.60 $7.15 Rutherford College $617,236 616 $16.00 $5.30 37 $16.00 $3.05 Sawmills $703,961 383 $18.00 $5.00 8 $18.00 $5.00 Sedgefield Sanitary District $115,360
$2.04
Stanley $2,338,768 1,502 $10.00 $14.45 129 $26.65 $18.80 Statesville $9,433,727
$10.34 $4.55
$10.34 $4.55
Taylorsville $2,212,668 318 $18.78 $7.00 19 $17.50 $5.75 Troutman $1,564,650 1,020 $21.60 $10.80 103 $21.60 $10.80 Two Rivers Utilities $34,229,137 22,863 $15.81 $3.80 2,591 $15.81 $3.80 Union County $29,773,736 29,378 $9.25 $4.40 1,574 $9.25 $4.40 Valdese $4,799,219 2,124 $5.52 $1.84 77 $5.79 $1.93