Embed Size (px)
Citation preview

Identifying Performance Bottleneck using JRockit
- Shivaram Thirunavukkarasu Performance Engineer
Wipro Technologies

Table of Contents About JRockit Mission Control................................................................................................................ 3
Five things to look for in JRMC – Flight Recording ................................................................................. 3
Starting JRMC ..................................................................................................................................... 3
CPU/heap usage .................................................................................................................................. 4
CPU Usage ...................................................................................................................................... 4
Heap Usage ..................................................................................................................................... 4
Memory GC General....................................................................................................................... 4
Code Overview .............................................................................................................................. 5
CPU/Threads – Latency ....................................................................................................................... 5
Events Graphs................................................................................................................................. 6
Identifying Memory Leaks ...................................................................................................................... 6
Live Action ............................................................................................................................................. 7
Application under Test ........................................................................................................................ 8
Application Architecture...................................................................................................................... 8
Test case.............................................................................................................................................. 8
Load Test ............................................................................................................................................ 8
Pros & Cons .......................................................................................................................................... 11
Pros ................................................................................................................................................... 11
Cons .................................................................................................................................................. 12
Conclusion ............................................................................................................................................ 12
About JRockit Mission Control JRockit Mission Control (JRMC) is a suite of tools form Oracle which can be used to monitor and profile almost all Java applications. JRMC adds very little overhead to the application while actively profiling it for various events. The main comments of JRMC are
1. The management console – This is the main interface from which the end user can interact with the JRMC. It captures the live data from the application like GC, memory and CPU usage
2. The JRockit Runtime Analyzer – This is a on demand ‘flight recorder’ akin to a black box on an aeroplane. It produces detailed recording on the JVM. This data once captured can also be analyzed offline
3. The Memory Leak Detector – This is a tool for discovering and analyzing memory leaks. This tool can give detailed drill down of the heap and objects present in it
Five things to look for in JRMC – Flight Recording
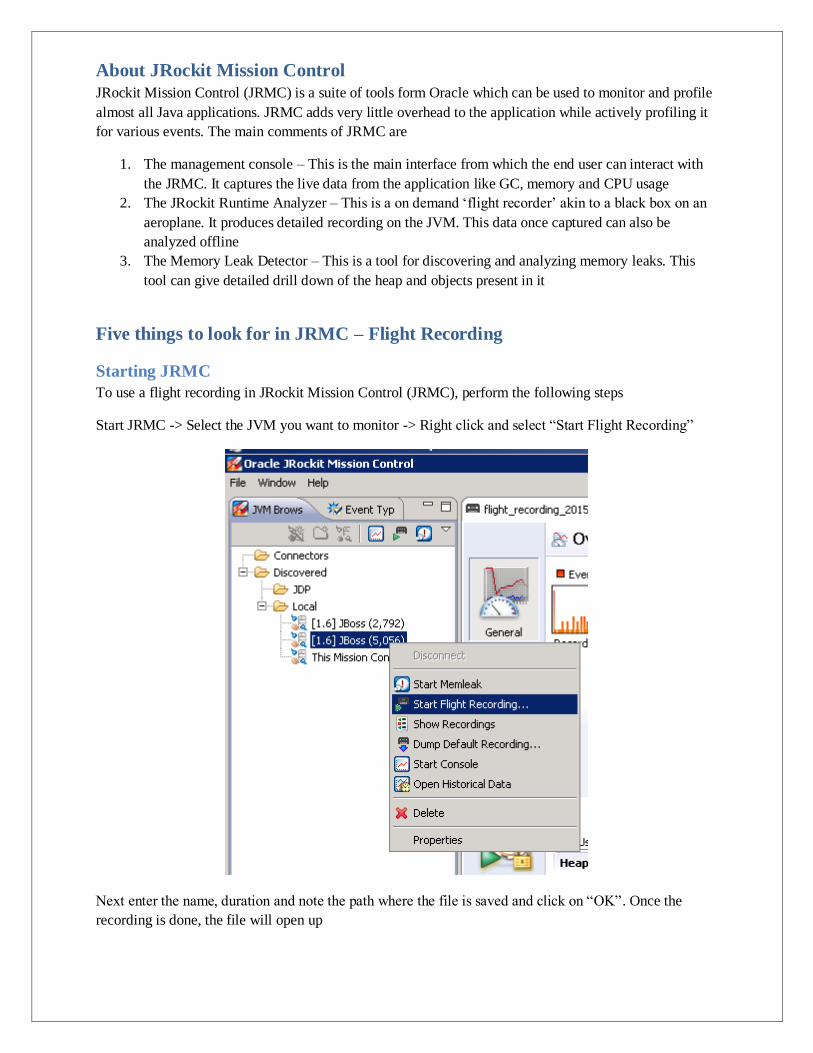
Starting JRMC To use a flight recording in JRockit Mission Control (JRMC), perform the following steps
Start JRMC -> Select the JVM you want to monitor -> Right click and select “Start Flight Recording”
Next enter the name, duration and note the path where the file is saved and click on “OK”. Once the recording is done, the file will open up

CPU/heap usage
CPU Usage This tab in the General Overview section shows the overall CPU utilization super imposed with the CPU utilization of the specific JVM.
Heap Usage This tab in the General Overview section shows the overall heap allocated for the JVM, the heap usage at regular intervals of time
Memory GC General The main section gives an overview on the GC behavior of the application. Some of the immediate things that can be seen here are.

1. Young Collection vs Old Collection GC count – If the young:old is not around the 75:25 mark, then either the GC algorithm used is incorrect or the eden space is not enough for the application
2. Average GC Time – This number for both young and old collections has to be in a few milliseconds. There is no absolute benchmark which states what an acceptable pause time is. Check the total time spent in GC vs time taken for measurement. This should give you a fair clue on what is happening
Code Overview Shows which package the application spent most time executing. As shown in the image, in our 5 min period, the package org.hsqldb had 55% execution
The section below on the same page also show which are the hot classes. As shown, org.hsqldb.Expression, jrockit.vm.Locks and org.hsqldb.Column are the top 3 classes
CPU/Threads – Latency This section shows where the application was waiting. As seen in the image below, the application under test has spent a significant amount of time being blocked. This means that when the blocking method is called, only one client can be served at a time. The stack trace below shows what is the main blocking class/method.

Events Graphs This section shows the various threads that being executed by the application and their current state
Identifying Memory Leaks One of the key features of JRMC is Leak Analysis of the heap. Simply right click on a JVM and select “Start Memleak”

This brings up a new window which shows what are the various classes loaded in the heap and what is their growth pattern.
From here we can drill down to a particular class and see who was the callee and how many times it was called
Live Action So far we have only seen what kind of data JRMC provides. Now it us put it into action

Application under Test
Application Architecture The Application under test is called GoSpace. It is Java based application hosted on Jboss and running a small HSQLDB in the back end
The following were the JVM setting for the frontend and
Frontend Backend -Xms128M -Xms256M -Xmx128M -Xmx256M JAVA_HOME – Default JAVA_HOME- JROCKIT home
Test case GoSpace is a simple travel application which lets the users login, select a “from” and “to” location and search for all available tickets. Once the users buy a ticket, they can logout of the application.
Load Test To see the JRMC in action, we will be running a load test on the application. The tool used is Jmeter (another free ware) and simulating a load of 50 concurrent users

Identifying Performance Bottlenecks
1. Run the load test 2. In the Flight recorder, check Overview Heap Usage. This indicates that most of the heap is
consumed and garbage collection is unable to free up space
3. Going to Memory GC Graph tab confirm the same behavior
4. Going to Code Overview shows that the hot package is org.hsqldb and in that the classes
org.hsqldb.Expression and org.hsql.Column are hot classes 5. Going to CPU/Thread Hot Threads, contention and Latencies also point to specific methods in
these classes 6. Start MemLeak on the backend JVM – From the image we can see that org.hsqldb.Expression has a
large growth.

7. Right click on the class select ‘Add to type graph’ and click on the plus on each method
The number on each arrow shows the number of times class was called. As we can see in the image, the class of interest shows 120,242. This is a possible candidate where memory leaks happen. Given that this class has been called by itself so many times, the dev team should look into it
So rather than just saying that the “Search” transaction is taking time, we can go one step further and say that following class org.hsqldb.Expression may be causing a memory leak and needs to be looked into

Market Landscape There are quite a few APM tools which do similar activities, but none of them are free. The most popular ones in the market are
dynaTrace AppDynamics New Relic YourKit …
All of these tools can perform the same functions as JRMC, but cons with all of them are
1. They all require agents to be installed on the server to monitor the performance 2. Change in the application start-up script/code (to include the agent) 3. Licenses are expensive on almost all of them 4. None of them are open source
Since JRMC now comes bundled along with all versions of Oracle JDK, no installation agent is required and since JRMC automatically detects JVMs, no need to change the application startup script/code
Pros & Cons
Pros The benefits of using the JRMC is monitoring and profiling the application are:
1. It’s FREE! And along with solid dev support identifying the troublemakers are much easier. 2. The DEV team need not change any code or include any special logging to get this report 3. Very low overhead while actively monitoring the application 4. Can use the same console to monitor various JVMs both local and outside. The only change needed to
monitor non-local JVMs is to enable JMX and specify the port

Cons 1. The only disadvantage is that, this tool can only be used to monitor Java application running on
Oracle JRockit VM. Using other VMs will only give back info and such detailed reports
N.B – This is not really a con as Oracle’s Jrockit is now part of all Oracle JVMs and JRMC now comes bundled along with Oracle JDK (1.7 and above)
Conclusion In conclusion we can say that rather than spending a lot of CapEx on tools, it is possible to use open source technologies & tools to perform an end to end performance testing and even identify the bottleneck. The solution may not be as elegant and jazzy and most of the paid tools, but in the end the result is the same. Given the way the software industry is moving towards open source, this tool will see a lot traction with large organizations.