Embed Size (px)
Citation preview
Identifying Optimal Feature Transforms for Classification and Prediction in Biological Systems: Recovering Receptive
Field Vectors from Sparse Recordings Konstantin Nikolic* and Benjamin Evans
Centre for Bio-Inspired Technology, Institute of Biomedical Engineering, Department of Electrical and Electronic Engineering, Imperial College London, London SW7 2AZ, UK
*email: [email protected] SUMMARY With biological systems it is often hard to adequately sample the entire input space. With sensory neural systems this can be a particularly acute problem, with very high dimensional natural inputs and typically sparse spiking outputs. Here we present an information theory based approach to analyse spiking data of an early sensory pathway, demonstrated on retinal ganglion cells (RGC) responding to natural visual scene stimuli (Katz et al., 2016). We used a non-parametric technique based on the concept of mutual information (MI), in particular, Quadratic Mutual Information (QMI). The QMI allowed us to very efficiently search the high dimensional space formed by the visual input for a much smaller dimensional subspace of Receptive Field Vectors (RFV). RFVs give the most information about the response of the cell to natural stimuli. This approach allows us to identify the RFVs far more efficiently using limited data as we can search the complete stimulus space for multiple vectors simultaneously. The RFVs were also used to predict the RGCs’ responses to any natural stimuli. Another suitable area of application of this algorithm is in diagnostic inference. Currently we are adapting the method to be used for identifying the cancer markers in the volatile organic compounds present in exhaled breath. Once the maximally informative features are established they can be used for diagnostic predictions on new breath samples. Preliminary results of the breathomics analysis will be discussed at the conference. There are several other potential applications such as multiclass categorisation for bacterial strains using ISFET arrays for DNA sequencing. This algorithm can be part of a rapid point-of-care device for identifying the specific infectious agents and recommending appropriate antibiotics. Here we will focus on presenting the algorithm using the example of RFVs of RGCs.
1. INTRODUCTION In the retina, signals from the photoreceptors are processed by “circuits” formed of different types of interconnected cells located within distinct retinal layers. These circuits have evolved to allow the retina to effectively break down the visual input into parallel channels that capture different spatio-temporal features of the visual scene and communicate these compressed representations to the visual cortex using the RGCs (Wassle, 2004). In order to identify which visual features the RGCs are sensitive to and determine their functional behaviour, we exposed the retinas to natural stimuli. Natural stimuli provide an extremely diverse range of possible visual inputs and should contain the features that the cells have evolved to become most sensitive to. To analyse the RGCs’ spikes we adopted an approach which is based on a non-parametric analysis of the system’s response to the stimuli proposed by (Torkkola, 2003). This form of biological “data-mining” can be advantageous as its fitting power depends only on the visual input that is used to stimulate the retina and so it can be employed for any type of stimuli and without requiring a model of the retina biology. Non-parametric models are “data dependent” with their complexity scaling to accommodate the available data, with those based on maximally informative features being of particular interest (Wu et al., 2006). This type of unsupervised approach is ideal for the purposes of finding unknown RFVs and identifying the functional behaviour of the RGCs. This technique involves searching the high dimensional space formed by the visual input (of the order ~500,000 dimensions, corresponding to approximately six frames of 320x240 resolution) for a much smaller dimensional subspace of RFVs that give the most information about the response of the cell. A similar method has
previously been developed that looks for these lower dimensional subspaces by sequentially optimising the MI across different RFVs (Sharpee et al., 2004). While promising, this method was extremely computationally expensive and used a large number of spike responses (typically >10,000) for characterisation of a lower dimensional visual stimulus (~10,000). In our case, we are considering a much higher dimensional stimulus space but have only a small number of responses (~500 spikes). Hence we adopted an approach based on a modified form of mutual information known as “Quadratic Mutual Information” (Torkkola, 2003, Kapur, 1994, Renyi, 1961). This allows us to optimise the RFVs far more efficiently as we can search the complete stimulus space for multiple vectors simultaneously. Our approach will also work well with the small number of recorded responses, since optimising the QMI is equivalent to optimising the lower bound of the full mutual information (Xu and Erdogmuns 2010), while preventing over-fitting of the extremely small sample size.
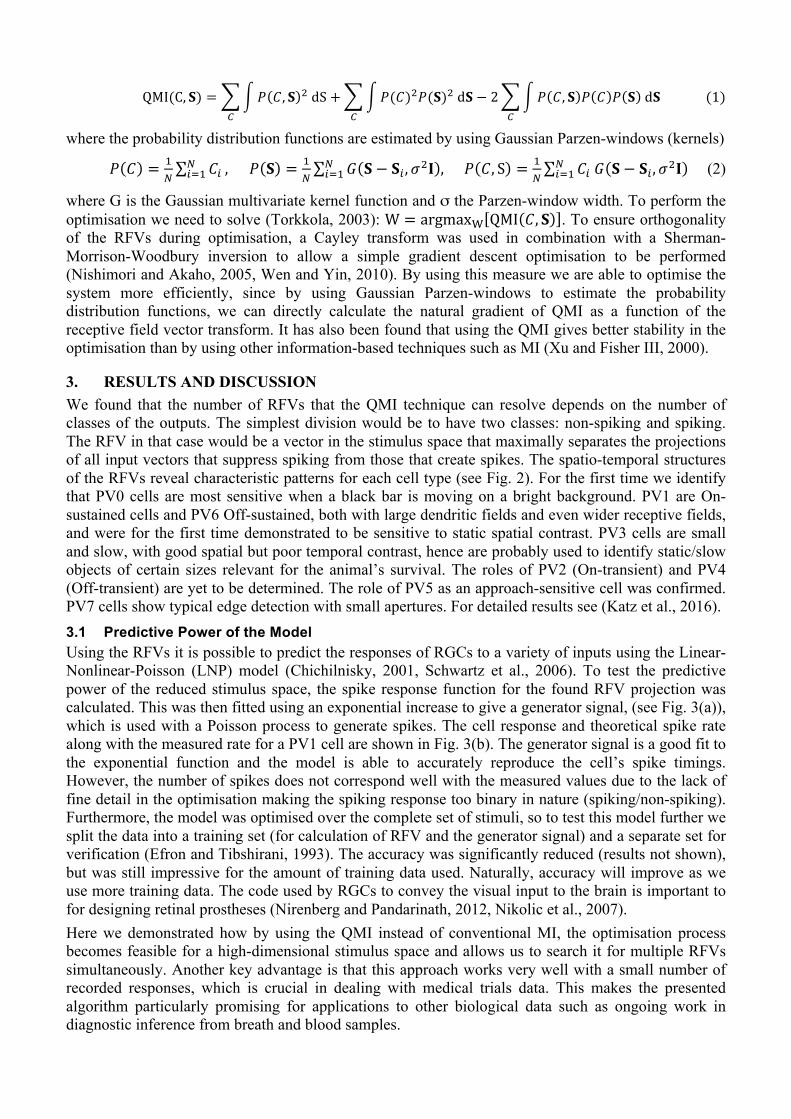
2. METHODS Natural Scene: video sequences recorded from a web-camera strapped to a cat’s head of it walking freely in a field, see Fig. 1. Three separate sequences were used catMovie1, catMovie2, and catMovie3 consisting of 141, 188, and 173 frames respectively. The projected video covered an area of 1200x900µm (width x height) on the retina and, normally, each frame was displayed for 40ms corresponding to a frame rate of 25fps. Spike recordings: The electrophysiological recordings have been made on 286 isolated PV cells to generate ~4,400 separate data files at 10kHz sampling rate.
Figure 1. (top) Visual stimulus: Natural scene, frames 320x240 pixels. (bottom) Raster plots for nine types of RGCs (named PV0, …, PV7 and PVX) response to Natural Stimulus (catMov2). For each cell type three individual recordings are shown. Each point represents a spike and red vertical lines represent the start (at 3s) and the end of the movies (10.6s). Before and after the movies, the retina is exposed to uniform gray light.
2.1 Modelling of the cell coding Input. The stimulus space is formed by the light intensity of the individual pixels in the movies (320x240=76,800 dimensions). The cells also have a temporal component to their responses so the history of these frames must be included, greatly increasing the dimensionality of the stimulus space. Detailed exploration of such a large space is experimentally unfeasible, so identifying the RFVs is vital in identifying the functional behaviour of the RGCs. Let us assume that we have a set of N input frames, i.e. input vectors 𝐱𝟏, 𝐱𝟐,… , 𝐱𝐍 and that an RGC is characterised by a set of NRFV receptive field vectors 𝐰𝟏, 𝐰𝟐,… ,𝐰𝐍𝐑𝐅𝐕 . By projecting the stimulus onto the RFVs a real valued signal is produced: 𝐒𝒊 = 𝐱𝒊 ∙𝐰𝟏, 𝐱𝒊 ∙𝐰𝟐,… , 𝐱𝒊 ∙𝐰𝐍𝐑𝐅𝐕 , 𝑖 = 1,… ,𝑁. Matrix 𝐒 represents the transform of the natural stimuli (𝐗) onto the subspace defined by the RFVs and is used as the input signal. Output. To analyse the spiking responses of the retinal ganglion cell types, the detected spikes were initially binned according to the frame rates of the presented natural stimuli. The spiking response y during stimuli presentation (average spiking response) represents the output for calculating the QMI. We separate the spiking responses (y) into C classes, for example: class C0 – non-spiking responses, C1 – less than 1 spike on average, class C2 – more than 1 spike. The QMI can be calculated as:
QMI(C, 𝐒) = 𝑃 𝐶, 𝐒 ! dS!
+ 𝑃(𝐶)!𝑃(𝐒)! d𝐒!
− 2 𝑃 𝐶, 𝐒 𝑃 𝐶 𝑃 𝐒 d𝐒 (1)!
where the probability distribution functions are estimated by using Gaussian Parzen-windows (kernels)
𝑃 𝐶 = !!
𝐶!!!!! , 𝑃 𝐒 = !
!𝐺 𝐒− 𝐒! ,𝜎!𝐈 , !
!!! 𝑃 𝐶, S = !!
𝐶! 𝐺 𝐒− 𝐒! ,𝜎!𝐈!!!! (2)
where G is the Gaussian multivariate kernel function and σ the Parzen-window width. To perform the optimisation we need to solve (Torkkola, 2003): W = argmax! QMI 𝐶, 𝐒 . To ensure orthogonality of the RFVs during optimisation, a Cayley transform was used in combination with a Sherman-Morrison-Woodbury inversion to allow a simple gradient descent optimisation to be performed (Nishimori and Akaho, 2005, Wen and Yin, 2010). By using this measure we are able to optimise the system more efficiently, since by using Gaussian Parzen-windows to estimate the probability distribution functions, we can directly calculate the natural gradient of QMI as a function of the receptive field vector transform. It has also been found that using the QMI gives better stability in the optimisation than by using other information-based techniques such as MI (Xu and Fisher III, 2000).
3. RESULTS AND DISCUSSION We found that the number of RFVs that the QMI technique can resolve depends on the number of classes of the outputs. The simplest division would be to have two classes: non-spiking and spiking. The RFV in that case would be a vector in the stimulus space that maximally separates the projections of all input vectors that suppress spiking from those that create spikes. The spatio-temporal structures of the RFVs reveal characteristic patterns for each cell type (see Fig. 2). For the first time we identify that PV0 cells are most sensitive when a black bar is moving on a bright background. PV1 are On-sustained cells and PV6 Off-sustained, both with large dendritic fields and even wider receptive fields, and were for the first time demonstrated to be sensitive to static spatial contrast. PV3 cells are small and slow, with good spatial but poor temporal contrast, hence are probably used to identify static/slow objects of certain sizes relevant for the animal’s survival. The roles of PV2 (On-transient) and PV4 (Off-transient) are yet to be determined. The role of PV5 as an approach-sensitive cell was confirmed. PV7 cells show typical edge detection with small apertures. For detailed results see (Katz et al., 2016). 3.1 Predictive Power of the Model Using the RFVs it is possible to predict the responses of RGCs to a variety of inputs using the Linear-Nonlinear-Poisson (LNP) model (Chichilnisky, 2001, Schwartz et al., 2006). To test the predictive power of the reduced stimulus space, the spike response function for the found RFV projection was calculated. This was then fitted using an exponential increase to give a generator signal, (see Fig. 3(a)), which is used with a Poisson process to generate spikes. The cell response and theoretical spike rate along with the measured rate for a PV1 cell are shown in Fig. 3(b). The generator signal is a good fit to the exponential function and the model is able to accurately reproduce the cell’s spike timings. However, the number of spikes does not correspond well with the measured values due to the lack of fine detail in the optimisation making the spiking response too binary in nature (spiking/non-spiking). Furthermore, the model was optimised over the complete set of stimuli, so to test this model further we split the data into a training set (for calculation of RFV and the generator signal) and a separate set for verification (Efron and Tibshirani, 1993). The accuracy was significantly reduced (results not shown), but was still impressive for the amount of training data used. Naturally, accuracy will improve as we use more training data. The code used by RGCs to convey the visual input to the brain is important to for designing retinal prostheses (Nirenberg and Pandarinath, 2012, Nikolic et al., 2007). Here we demonstrated how by using the QMI instead of conventional MI, the optimisation process becomes feasible for a high-dimensional stimulus space and allows us to search it for multiple RFVs simultaneously. Another key advantage is that this approach works very well with a small number of recorded responses, which is crucial in dealing with medical trials data. This makes the presented algorithm particularly promising for applications to other biological data such as ongoing work in diagnostic inference from breath and blood samples.
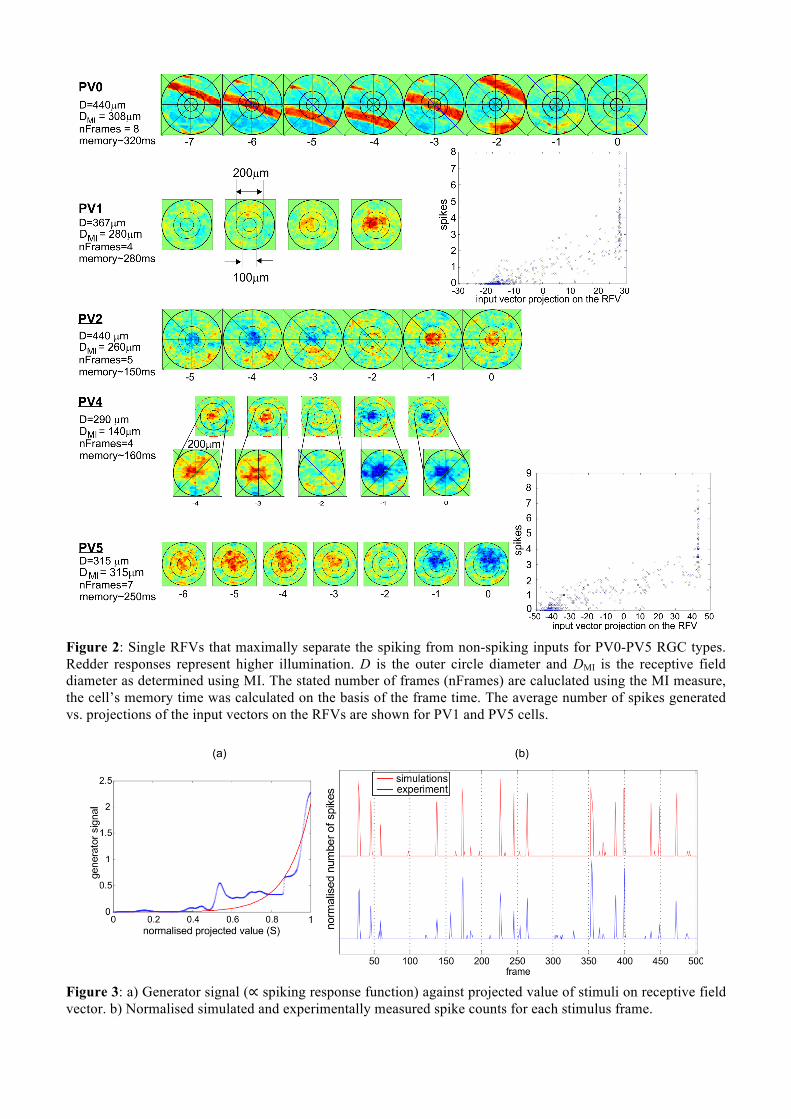
Figure 2: Single RFVs that maximally separate the spiking from non-spiking inputs for PV0-PV5 RGC types. Redder responses represent higher illumination. D is the outer circle diameter and DMI is the receptive field diameter as determined using MI. The stated number of frames (nFrames) are caluclated using the MI measure, the cell’s memory time was calculated on the basis of the frame time. The average number of spikes generated vs. projections of the input vectors on the RFVs are shown for PV1 and PV5 cells.
Figure 3: a) Generator signal (∝ spiking response function) against projected value of stimuli on receptive field vector. b) Normalised simulated and experimentally measured spike counts for each stimulus frame.

ACKNOWLEDGMENTS Authors thank the support of UK Engineering and Physical Sciences Research Council (EPSRC) grant number EP/N002474/1 and Wellcome Trust Institutional Strategic Support Award.
REFERENCES CHICHILNISKY, E. J. 2001. A simple white noise analysis of neuronal light responses. Network: Computation in Neural
Systems, 12, 199-213.
EFRON, B. & TIBSHIRANI, R. 1993. An Introduction to the Bootstrap, Chapman & Hall/CRC.
KAPUR, J. N. 1994. Measures of Information and Their Applications, Wiley, New Delhi, India.
KATZ, M. L., VINEY, T. J. & NIKOLIC, K. 2016. Receptive Field Vectors of Genetically-Identified Retinal Ganglion Cells Reveal Cell-Type-Dependent Visual Functions. PLoS ONE, 11, e0147738.
NIKOLIC, K., GROSSMAN, N., YAN, H., DRAKAKIS, E., TOUMAZOU, C. & DEGENAAR, P. A Non-Invasive Retinal Prosthesis - Testing the Concept. 2007 29th Annual International Conference of the IEEE Engineering in Medicine and Biology Society, 22-26 Aug. 2007 2007. 6364-6367.
NIRENBERG, S. & PANDARINATH, C. 2012. Retinal prosthetic strategy with the capacity to restore normal vision. Proceedings of the National Academy of Sciences, 109, 15012-15017.
NISHIMORI, Y. & AKAHO, S. 2005. Learning algorithms utilizing quasi-geodesic flows on the Stiefel manifold. Neurocomputing, 67, 106-135.
RENYI, A. On Measures of Entropy and Information. Proceedings of the Fourth Berkeley Symposium on Mathematical Statistics and Probability, Volume 1: Contributions to the Theory of Statistics, 1961 Berkeley, Calif.: University of California Press, 547-561.
SCHWARTZ, O., PILLOW, J. W., RUST, N. C. & SIMONCELLI, E. P. 2006. Spike-triggered neural characterization. Journal of Vision, 6.
SHARPEE, T., RUST, N. C. & BIALEK, W. 2004. Analyzing neural responses to natural signals: maximally informative dimensions. Neural Comput, 16, 223-50.
TORKKOLA, K. 2003. Feature extraction by non parametric mutual information maximization. J. Mach. Learn. Res., 3, 1415-1438.
WASSLE, H. 2004. Parallel processing in the mammalian retina. Nat Rev Neurosci, 5, 747-757.
WEN, Z. & YIN, W. 2010. A Feasible method for Optimization with Orthogonality Constraints. Rice University.
WU, M. C. K., DAVID, S. V. & GALLANT, J. L. 2006. Complete Functional Characterization of Sensory Neurons by System Identification. Annual Review of Neuroscience, 29, 477-505.
XU, D. & ERDOGMUNS , D. 2010. Renyi’s Entropy, Divergence and Their Nonparametric Estimators. In: PRINCIPE, J. C. (ed.) Information Theoretic Learning. Springer New York.
XU, D. & FISHER III, J. W. 2000. Information theoretic learning In: PRINCIPE, J. C. (ed.) Unsupervised adaptive filtering. Wiley, New York.