Embed Size (px)
Citation preview

I
Aida Andreia Pereira Pires Lima
Licenciada em Biologia
Identifying new regulators of the actin cytoskeleton in endothelial tip cells
Dissertação para obtenção do Grau de Mestre em Genética Molecular e Biomedicina
Orientador: Cláudio Areias Franco, PhD, iMM Lisboa
Júri:
Presidente: Prof. Doutora Paula Maria Theriaga Mendes Bernardo Gonçalves
Arguente: Doutora Maria Leonor Tavares Saúde
Vogal: Doutor Cláudio Areias Franco
Setembro 2015

II
III
Aida Andreia Pereira Pires Lima
Licenciada em Biologia
Identifying new regulators of the actin cytoskeleton in endothelial tip cells
Dissertação para obtenção do Grau de Mestre em Genética Molecular e Biomedicina
Orientador: Cláudio Areias Franco, PhD, iMM Lisboa
Júri:
Presidente: Prof. Doutora Paula Maria Theriaga Mendes Bernardo Gonçalves
Arguente: Doutora Maria Leonor Tavares Saúde
Vogal: Doutor Cláudio Areias Franco
Setembro 2015

IV

I
Identifying new regulators of the actin cytoskeleton in endothelial tip cells
Copyright © Aida Andreia Pereira Pires Lima, FCT/UNL, UNL
A Faculdade de Ciências e Tecnologia e a Universidade Nova de Lisboa têm o direito, perpétuo e
sem limites geográficos, de arquivar e publicar esta dissertação através de exemplares impressos
reproduzidos em papel ou de forma digital, ou por qualquer outro meio conhecido ou que venha a ser
inventado, e de a divulgar através de repositórios científicos e de admitir a sua cópia e distribuição
com objectivos educacionais ou de investigação, não comerciais, desde que seja dado crédito ao
autor e editor.

II

III
Para o meu pai,
Quando te sentires perdida, confusa, pensa nas árvores, lembra-te da
forma como crescem. Lembra-te de que uma árvore com muita ramagem e poucas raízes
é derrubada à primeira rajada de vento, e de que a linfa custa a correr numa árvore com muitas
raízes e pouca ramagem. As raízes e os ramos devem crescer de igual modo, deves estar nas
coisas e estar sobre as coisas, só assim poderás dar sombra e abrigo, só assim,
na estação apropriada, poderás cobrir-te de flores e de frutos.
(Susanna Tamaro)

IV

V
ACKNOWLEDGMENTS
Quero começar por agradecer ao meu orientador, Cláudio Areias Franco, por me ter aceite a
responsabilidade científica deste trabalho e pela dedicação e exigência com que sempre seguiu este
projecto. Obrigada por todos os desafios que me foi colocando ao longo do tempo, que possibilitaram
não só uma grande aprendizagem e espírito crítico ao longo do trabalho, mas também me ajudaram a
ser mais segura e persistente comigo própria, principalmente na questão do inglês . Por tudo isto,
espero ter estado à altura das oportunidades que me ofereceu. E claro, a esta grande instituição que
é o Instituto de Medicina Molecular, onde sem ela nada disto seria possível.
Aos meus colegas de trabalho, Joana Carvalho e Pedro Barbacena por todo o apoio e auxílio
prestado na revisão desta dissertação e principalmente amizade e companhia sempre concedidos.
Sim e não me esqueci, um agradecimento especial à minha colega Catarina que não só foi uma
óptima colega de trabalho, em todos os sentidos, mas também se tornou uma grande amiga que
espero manter para toda a vida
Um agradecimento especial a duas grandes amigas Ana Alves e Lucília Pereira. À Ana não só por ter
dado início a este projecto, mas também porque é uma amiga que muito antes já estava no meu
coração e que sempre me deu todo o apoio e carinho. À Lucília, que nem tenho palavras para
descrever todo o apoio e profunda amizade que me deu ao longo deste período tão importante, e
principalmente, por sempre acreditar em mim.
Às minhas amigas Raquel Nisa, Márcia Silva e Daniela Moreira pelo carinho e amizade dados ao
longo destes anos, não esquecendo deste tão importante na minha carreira de investigação.
À Sara Moreira que não só foi uma grande colega neste mestrado, como também se tornou uma
amiga que sempre me deu apoio, bastando apenas um SMS
Ao meu irmão pela confiança depositada em mim e por todo o amor concedido que me ajudou a
enfrentar esta etapa importante da minha vida.
Por último, mas na verdade o primeiro, AO MEU PAI a quem não só dedico esta tese, mas também a
quem agradeço do fundo do meu coração que mesmo não estando “presente” sempre me deu apoio
durante todos os momentos mais difíceis neste projecto e que muitas vezes me puseram a pensar em
desistir. OBRIGADA PAI <3
Em geral, a todas as outras pessoas que acompanharam o meu trajecto académico e/ou pessoal e
que de alguma forma estiveram envolvidos neste projecto, permitindo que este fosse possível.

VI
VII
ABSTRACT
Blood vessels form extensive vascular networks allowing an efficient transport of gases, fluids and
nutrients for all tissues. Sprouting angiogenesis generates new blood vessels during embryonic
development and adult. Dysfunctional, either excessive or insufficient, angiogenesis is a cause of
several vascular diseases, such as ischemia, arteriovenous malformations, tumor angiogenesis, and
diabetic retinopathy.
During sprouting angiogenesis, endothelial tip cells are highly migratory and guide the trailing
endothelial stalk cells in the nascent sprout towards the source of pro-angiogenic factors. However,
the mechanisms regulating the actin cytoskeleton contributing to the motility and invasive proprieties of
endothelial tip cells are poorly understood. Serum response factor (SRF) is a transcription factor that
regulates expression of genes encoding cytoskeletal proteins. SRF, together with its cofactors
[myocardin related transcription factors (MRTFs)], is essential for tip cell migration and invasion during
sprouting angiogenesis. But which genes downstream of SRF/MRTF signaling are central in this
process are completely not characterized.
Based on a microarray approach, we defined the MRTF/SRF-dependent transcriptome of endothelial
cells. Using a combination of multiple in silico and in vitro approaches, we identified the relevant genes
downstream of SRF signaling, and we characterize their function in cell migration and cytoarchitecture
of endothelial cells.
From our analysis, inhibition of MYH9, the gene coding for myosin IIA heavy chain (NMII-A),
reproduced alone the full spectrum of phenotypes presented in MRTF/SRF-deficient endothelium, and
regulates tip cell motility and invasion. Interestingly, we found a specialized localization of MYH9 in
endothelial tip cells, pointing towards an important and novel role in filopodia formation and/or stability.
Our research provides new insights on the biology of endothelial tip cells, which can be a first step
towards new therapeutic approaches targeting pathological vascularization.
Keywords: Angiogenesis; SRF signaling; MYH9; invasion; filopodia; tip cell

VIII

IX
RESUMO
Os vasos sanguíneos formam uma extensa rede vascular que permite o eficiente transporte de gases,
fluidos e nutrientes para todos os tecidos. A formação de novos vasos sanguíneos durante o
desenvolvimento embrionário e no adulto ocorre pelo processo de angiogénese por brotação. Uma
angiogénese disfuncional, excessiva ou insuficiente, é a causa de várias doenças, como isquemia,
malformações arteriovenosas, angiogénese tumoral ou retinopatia diabética.
Na angiogénese por brotação, as células de ponta são altamente migratórias, e orientam a invasão
do broto vascular. No entanto, os mecanismos de regulação do citoesqueleto de actina envolvidos na
motilidade e invasão das células de ponta são pouco compreendidos. O fator de resposta ao soro
(SRF) regula a expressão de proteínas do citoesqueleto. SRF, em conjunto com os seus co-fatores
[fatores de transcrição relacionados com miocardina (MRTFs)], é essencial para a migração e invasão
das células de ponta durante a angiogénese. Porém os genes regulados pela sinalização SRF/MRTF
que promovem estes efeitos ainda não foram caracterizados.
Usando microarray, definimos o transcriptoma das células endoteliais dependente da sinalização
MRTF/SRF. Através de abordagens in silico e in vivo, identificámos os genes mais relevantes na via
sinalização do SRF, e caracterizámos os seus efeitos no processo de migração e na citoarquitetura
das células endoteliais.
O nosso estudo identificou que a inibição do gene MYH9, que codifica para a cadeia pesada da
miosina IIA (NMII-A), leva a fenótipos similares à inibição da via MRTF/SRF, regulando a motilidade e
invasão das células de ponta. Curiosamente, observámos uma localização particular da MYH9 nas
células de ponta, apontando para um papel importante e novo da MYH9 na formação e/ou
estabilidade dos filopódes.
Os nossos resultados fornecem novas pistas sobre a biologia das células endoteliais de ponta,
constituindo um primeiro passo no sentido de desenvolver novas abordagens terapêuticas contra a
vascularização patológica.
Termos-chave: angiogénese; sinalização SRF/MRTF; MYH9; invasão; filopódes; célula de ponta

X

XI
TABLE OF CONTENTS
ACKNOWLEDGMENTS ........................................................................................................................ IV
ABSTRACT ........................................................................................................................................... VII
RESUMO ................................................................................................................................................ IX
I. INTRODUCTION ................................................................................................................................ 1
Blood Vessels ................................................................................................................................ 1 1.
1.1. Vascular Networks .................................................................................................................... 1
1.2. Vascular Diseases .................................................................................................................... 2
Sprouting angiogenesis ................................................................................................................. 2 2.
2.1.General concepts on angiogenesis ........................................................................................... 2
2.2. Hypoxia and VEGF signaling ................................................................................................... 3
2.3. VEGF and Notch signaling ....................................................................................................... 4
2.4. Tip and Stalk cell specification ................................................................................................. 4
2.5. Basement membrane degradation and mural cells detachment ............................................. 6
2.6. Lumen formation ...................................................................................................................... 7
2.7. Sprout anastomosis ................................................................................................................. 8
2.8. Vessel Maturation .................................................................................................................... 9
2.9. Endothelial cell motility ........................................................................................................... 10
Actin cytoskeleton in motile cells ................................................................................................. 10 3.
3.1. Cytoskeleton dynamics .......................................................................................................... 10
3.2. Filopodia and lamellipodia protrusions ................................................................................... 11
3.3. Actin/Myosin interactions ....................................................................................................... 13
Serum Response Factor (SRF) ................................................................................................... 15 4.
4.1. Molecular and biological functions of SRF ............................................................................. 15
4.2. Actin-MRTF-SRF signaling .................................................................................................... 16
4.3. SRF function in sprouting angiogenesis ................................................................................ 17
Working Models for studying vascular development ................................................................... 18 5.
5.1. Mouse retinal model ............................................................................................................... 18
5.2. Spheroid sprouting assay....................................................................................................... 19
Aims............................................................................................................................................. 19 6.
II. MATERIALS AND METHODS ......................................................................................................... 21
Mice breeding and genotyping .................................................................................................... 21 1.
Culture of Human Umbilical Vein Endothelial Cells (HUVECs) .................................................. 22 2.
VEGF induction in HUVECs ........................................................................................................ 22 3.
siRNA experiments ...................................................................................................................... 23 4.
Overexpression of MIIA-GFP in SRF depleted HUVECs ............................................................ 24 5.
Gene expression assays ............................................................................................................. 24 6.
XII
Protein extraction and Western Blotting ...................................................................................... 25 7.
7.1. Protein lysis and sample processing ...................................................................................... 25
7.2. Protein electrophoresis and membrane transference ............................................................ 26
Scratch-wound assay .................................................................................................................. 26 8.
Immunofluorescence staining of cultured HUVECs in coverslips ............................................... 26 9.
Eyes extraction and retina isolation for immunoflorescence ....................................................... 27 10.
10.1. Immunofluorescence staining in whole-mount retinas ........................................................ 28
Antibodies and other molecular probes....................................................................................... 29 11.
Spheroids sprouting assay .......................................................................................................... 30 12.
12.1. Methyl cellulose stock solution ............................................................................................ 30
12.2. Sprouting angiogenesis in vitro ........................................................................................... 30
12.3. Immunofluorescence staining of Spheroids ........................................................................ 32
Statistical analysis ....................................................................................................................... 32 13.
III. RESULTS ......................................................................................................................................... 33
Selection of candidate genes downstream of the MRTF/SRF pathway ..................................... 33 1.
1.1. Transcriptomic analysis of endothelial-specific MRTF/SRF-dependent genes...................... 33
1.2. Validation of MRTF/SRF-dependent candidate genes ........................................................... 35
Functional validation of positive candidate genes ....................................................................... 36 2.
2.1. Setting-up a siRNA-based functional screen ......................................................................... 36
2.2. Scratch-wound cell migration assay ...................................................................................... 38
2.3.Cell Cytoskeleton architecture ................................................................................................. 40
MYH9 is a major actin regulator downstream of the MRTF/SRF pathway ................................. 42 3.
3.1. MYH9 function is essential for efficient endothelial sprouting................................................ 42
3.2. Re-expression of MYH9 rescues SRF-deficient phenotype .................................................. 45
3.3. MYH9 is enriched in endothelial tip cells in vivo. ................................................................... 46
IV. DISCUSSION ................................................................................................................................... 47
V. REFERENCES ................................................................................................................................. 51
XIII
INDEX OF FIGURES
I. INTRODUCTION……………………………………………………………………………………………....1
Figure I.1 - Schematic representation of vascular network formation.. .................................................... 1
Figure I.2 - Mechanisms of sprouting and non-sprouting angiogenesis. ................................................. 3
Figure I.3 - Molecular mechanism regulating ECs selection into a tip and stalk cells during sprouting
angiogenesis.. .......................................................................................................................................... 6
Figure I.4. - Schematic representation of sprouting angiogenesis initiation, vessel branching, and
maturation.. ............................................................................................................................................... 7
Figure I.5 - Lumen formation during sprout outgrowth. ............................................................................ 8
Figure I.6 - Schematic illustration of anastomosis process, during tip cell fusion. ................................... 9
Figure I.7 - Schematic representation of the cell with the different architectures in the motile cell. ......11
Figure I.8 - Structural elements of a migrating cell.. ...............................................................................12
Figure I.9 - Working model for filopodia formation. ................................................................................13
Figure I.10 - Structure of non-muscle myosin II (NM II) and dynamics. .................................................14
Figure I.11 - Model illustrating the two main pathways regulating SRF activity. ....................................16
Figure I.12 - Schematic illustration of a growing sprout in mouse retina. ..............................................19
II. MATERIALS AND METHODS……………………………...…………………………………………......21
Figure II.1 - Tamoxifen injection, eye and retina dissection.. .................................................................28
Figure II.2 - Scheme of generation of spheroids.. ..................................................................................31
III. RESULTS…………………………………………………………………………………………33
Figure III.1 - Venn Diagram for downstream of the MRTF/SRF signaling.. ...........................................33
Figure III.2 - Gene Ontology analysis for the 113 selected genes. ........................................................33
Figure III.3 - qPCR analysis of selected candidate genes. ....................................................................35
Figure III.4 - Western Blot analysis of some the selected candidate genes.. ........................................36
Figure III.5 - Analyze of the efficiency of each siRNA by qPCR.............................................................37
Figure III.6 - Analysis of cell migration in the scratch-wound assay.. ....................................................38
Figure III.7 - Analysis of cell migration in the scratch wound assay.. .....................................................39
Figure III.8 - Analysis of cell migration in the scratch wound assay.. .....................................................41
Figure III.9 - Quantification of the fluorescence intensity of the different markers in HUVECs
transfected with selected siRNAs.. .........................................................................................................42
Figure III.10 - MYH9 staining in HUVECs transfected with selected siRNAs.. ......................................43
Figure III.11 - Relative protein levels in HUVECs transfected with different siRNAs.. ...........................43
Figure III.12 - HUVEC spheroid sprouting analysis. ...............................................................................44
Figure III.13 - Overexpression of MYH9-GFP compensates SRF-deficiency.. ......................................45
Figure III.14 - Retinal endothelial cells analysis.. ...................................................................................46
IV. DISCUSSION…………………………………………………………………………………………….....47
Figure IV.1 - Schematic representation of SRF signaling inducing NMII-A activity. ..............................49

XIV

XV
INDEX OF TABLES
II. MATERIALS AND METHODS…………………………………………….…………….…………………21
Table II.1 - Primers used for genotyping PCR........................................................................................21
Table II.2 - Genotyping PCR program ....................................................................................................22
Table II.3 - siRNA sequences used in siRNA experiments. ...................................................................23
Table II.4 - Lipofectamine®
LTX DNA Transfection Protocol. .................................................................24
Table II.5 - Primers used in qPCR. .........................................................................................................25
Table II.6 - Primary antibodies used and respective information ...........................................................29
Table II.7 - Secondary antibodies and Phalloidin used and respective information...............................30
Table II.8 - Collagen I solution for sprouting angiogenesis assay. .........................................................31
III. RESULTS……………………………………………………………………………………………………33
Table III.1 - Selected candidate genes. ..................................................................................................34
Table III.2 - Viability tests in cultured HUVECs.. ....................................................................................37

XVI

1
I. INTRODUCTION
Blood Vessels 1.
1.1. Vascular Networks
Blood vessels form extensive vascular networks, allowing an efficient and simultaneous transport
of gases, fluids, nutrients, signaling molecules and circulating cells between all the organs of the
vertebrate body (Herbert and Stainier, 2011; Adams and Alitalo, 2007). The vertebrate circulatory
system includes two highly branched, tree-like tubular networks: the blood vessels and the lymphatic
vessels. These two endothelial networks are interconnected, which allows the drainage of lymph into
the blood circulation (Adams and Alitalo, 2007; Carmeliet, 2005) (Figure I.1).
Early embryonic blood vessels form de novo via the assembly of mesoderm-derived endothelial
cell precursors, referred by angioblasts, which form from hemangioblasts (differentiated from
mesodermal cells). The hemangioblasts form aggregates in the yolk sac. The inner cells differentiate
into hematopoietic precursors, whereas the outer population into endothelial cells (angioblasts) that
migrate and form a primitive vascular network. This step of vascular development is named by
vasculogenesis (Potente et al., 2011; Carmeliet, 2005) (Figure I.1). Subsequently, the primitive
vascular plexus progressively expands and remodels, leading to the formation of a mature and
functional hierarchical vascular network, composed by arteries, veins and capillaries, a process
defined as angiogenesis (Herbert and Stainier, 2011; Carmeliet, 2005) (Figure I.1).
Figure I.1 - Schematic representation of vascular network formation. Once formed, in vasculogenesis,
hemangioblasts differentiate in endothelial cells (ECs) in order to form an immature and primitive vascular
network. Following their vasculogenic assembly this primary plexus expands, remodels and matures into a mature
and hierarchical vascular network consisting of arteries, veins and capillaries (angiogenesis and arteriogenesis).
Recruitment of mural cells [pericytes (PCs) and vascular smooth-muscle cells (vSMCs)] stabilizes nascent
vessels and promotes vessel maturation. In addition, the sprouting of lymphatic endothelial cells from venous
vessels (lymphangiogenesis) seeds the lymphatic system that interconnects with blood vessels. This vascular
network diversity is further augmented by tissue-specific specializations that alter key properties to generate
vascular networks with new molecular signatures. Figure adapted from Herbert and Stainier (2011), and
Carmeliet (2005).

2
1.2. Vascular Diseases
Blood vessels supply oxygen, nutrients and are also involved in immune surveillance. Thus, it is not
surprising that defective blood vessel formation, maintenance or growth contribute to the onset of
many diseases such as ischemia, myocardial infarction, stroke, ulcerative diseases,
neurodegenerative or obesity-associated disorders (Potente et al., 2011; Carmeliet and Jain, 2011;
Carmeliet, 2003). In contrast, when excessive vascular growth or abnormal remodeling is linked to
other diseases such as tumor growth and metastasis, inflammatory disorders, pulmonary
hypertension, and retinopathies (Potente et al., 2011; Carmeliet and Jain, 2011; Carmeliet, 2003).
Ischemia-related damages depend on several factors, such as the extent of the ischemic injury, the
duration of ischemia and the efficiency of reperfusion. Therefore, de novo formation of microvessels
by angiogenesis limits the consequences of ischemic myocardium, by reperfusing the hypoxic tissue
(Cochain et al., 2013). In ischemic retinopathies, including proliferative diabetic retinopathy (PDR) and
retinopathy of prematurity (ROP), an initial phase of retinal capillary obliteration is followed by hypoxia
that drives deregulated, excessive and pathological growth of new blood vessels, but without
ameliorating retinal ischemia. Sustained hypoxia further exacerbates pathological angiogenesis,
causing severe hemorrhages, retinal detachment and blindness. These eye-related vascular diseases
are managed using anti-angiogenic therapies, with great clinical outcomes (Fukushima et al., 2011).
Tumor growth and spread of tumor cells (metastasis) requires angiogenesis. Growth of tumors
depends on induction of formation of new blood vessels for adequate oxygen and nutrient supply. The
medical community has been using anti-angiogenic therapy to starve tumor cells, by cutting access to
supply of oxygen and nutriments. However, tumors rapidly become resistant to single-target anti-
angiogenic therapies, evolving new mechanisms promoting vessel growth. Thus, the scientific
community needs to discover new methods to improve the overall efficiency of anti-vascular strategies
to combat cancer (Potente et al., 2011).
Sprouting angiogenesis 2.
2.1. General concepts on angiogenesis
The term “angiogenesis” was first used to describe the formation of new blood vessels from pre-
existing ones but, recently, this term is used to generally denote the growth and remodeling process of
the primitive vascular network into a hierarchical and functional one (Potente et al., 2011; Carmeliet,
2000). There are two different mechanisms of angiogenesis: sprouting and intussusceptive
angiogenesis (non-sprouting). Intussusceptive angiogenesis defines the process of splitting pre-
existing vessels in two separate ones. This process involves the formation of transluminal tissue pillars
within capillaries, small arteries, and veins, which subsequently fuse. This invagination creates contact
of opposing endothelium walls and results in the formation of transluminal pillar accompanied by
vessel growth. Thus, new vascular entities or vessel remodeling can occur in non-sprouting
angiogenesis (Heinke et al., 2012; Potente et al., 2011; Makanya et al., 2009) (Figure I.2).
Sprouting angiogenesis refers to the formation of new vessels from pre-existing ones, in which
endothelial cells are activated and selected to sprout. The major difference between both mechanisms

3
is that sprouting angiogenesis is invasive to non-vascularized tissues, relatively slow and is highly
dependent on cell proliferation. In contrast, the process of intussusception allows the formation of new
blood vessels rapidly, and does not rely on cell proliferation to expand the existing capillary networks.
Nevertheless, sprouting angiogenesis is the process that accounts for the vast majority of vascular
growth and it will be explained in greater detail in the next section (Graupera and Potente, 2013;
Heinke et al., 2012).
Figure I.2 - Mechanisms of sprouting and non-sprouting angiogenesis. During angiogenesis, the primary
vascular plexus expands by two mechanisms of sprouting (left) and non-sprouting angiogenesis (right). Sprouting
of vessels from pre-existing ones in which endothelial cells proliferate behind the tip cell of growing branch, and
non-sprouting involved in transluminal pillar formation and growing of vessels. Figure adapted from Heinke et al.
(2012).
2.2. Hypoxia and VEGF signaling
Sprouting angiogenesis occur during embryonic development and in the adult and comprises
several steps. Biological signals such as hypoxia, ischemia, and/or blood vessel damage promote the
upregulation of pro-angiogenic growth factors that activate their corresponding receptors (Zimna and
Kurpisz, 2015). Thus, regulation of angiogenesis by hypoxia is an important component of
homeostatic mechanisms that link vascular oxygen supply to metabolic demand (Pugh and Ratcliffe,
2003). Hypoxia-inducible factor-1 (HIF-1) is a primary transcriptional mediator of the hypoxic response
and is the master regulator of oxygen homeostasis (Semenza, 2003). This is a heterodimer consisting
of HIF-1α and HIF-1β subunits. The HIF-1α subunit is stabilized by hypoxia, whereas the HIF-1β
subunit is a constitutive nuclear protein (Pugh and Ratcliffe, 2003).
Current studies have indicated that hypoxia and HIF-1 expression plays a critical role in stimulating
ECs and promoting angiogenesis by:
(1) Activating transcription of genes encoding angiogenic growth factors, including vascular
endothelial growth factor A (VEGF-A), angiopoietin 2 (ANGPT2), placental growth factor
(PLGF), and platelet-derived growth factor B (PDGFB);
(2) Regulating pro-angiogenic cytokines and receptors;
(3) Controlling the transcription of genes involved in endothelial cell proliferation and division
(Zimna and Kurpisz, 2015; Manalo et al., 2005).
4
Therefore, in hypoxic conditions, the vessel formation cascade is supported by HIF-1 that
participates directly on all the fundamental steps of angiogenesis. Direct binding of HIFs to specific
hypoxia-inducible elements (HRE), present in the promoter region of VEGF-A leads to a dramatic
upregulation of VEGF-A production. Thus, HIF-1 is a master regulator of VEGF levels, linking directly
hypoxia to angiogenesis, in a system regulated by the simple rule of demand and supply (Zimna and
Kurpisz, 2015; Olsson et al., 2006; Pugh and Ratcliffe, 2003).
2.3. VEGF and Notch signaling
The VEGF family of growth factors includes six secreted dimeric glycoproteins (VEGF-A, -B, -C, -D,
-E, and placental growth factor [PLGF]), which interact with distinct affinities with three different
tyrosine kinase receptors, VEGF receptor 1 (VEGFR1 or Flt1), receptor 2 (VEGFR2, KDR or Flk1),
and receptor 3 (VEGFR3 or Flt4). VEGFR1 and VEGFR2 are involved in the regulation of
vasculogenesis and angiogenesis, whereas VEGFR3 is involved in embryonic angiogenesis but later
becomes confined to lymphangiogenesis (Blanco and Gerhardt, 2013; Potente et al., 2011).
A key molecule for the initiation and direction of sprouting is VEGF-A (Eilken and Adams, 2010).
VEGF-A expression is induced by hypoxic conditions, cytokines, growth factors, hormones,
oncogenes, and tumor-suppressor genes (Blanco and Gerhardt, 2013). The tyrosine kinase activity of
VEGFR2 is the main mediator of VEGF-A signaling during angiogenesis. Contrary to VEGFR2,
VEGFR1 has a rather feeble kinase activity and acts as a decoy receptor, competitively reducing
VEGF-A binding to VEGFR2, and therefore limiting its activity of VEGF-A pathway in endothelial cells
(Blanco and Gerhardt, 2013). Extracellular gradients of VEGF-A activate quiescent endothelial cells
from blood vessels and induce their subsequent specialization into tip and stalk cells.
2.4. Tip and Stalk cell specification
As previously explained, hypoxic tissues secrete growth factors and chemokines that stimulate
endothelial cells to abandon their stable position in the vessel wall. Jointly, endothelial cells undergo
coordinate sprouting and branching. The sequence of the morphogenic events occurring during
sprouting angiogenesis requires the tight control and coordination of endothelial cell behavior that will
ensure not only the formation of new sprouts, but also the maintenance of a functional vascular
network. During the process of sprouting angiogenesis, there are two different endothelial cell
populations of upmost importance (Siekmann et al., 2013; Potente et al., 2011; Adams and Alitalo,
2007):
(1) The leading tip cells: specialized cells selected for sprouting that are highly motile and
invasive. Tip cells are able to sense both attractive and repulsive cues from the
environment and have characteristic dynamic long filopodia protrusions, which control the
guidance of newly formed vascular sprouts;
(2) The following stalk cells: these cells are in close contact to tip cells and constitute the
base of the sprout. Stalk cells proliferate while establishing firm adherent and tight
junctions in order to maintain the connection to the parental vessel.

5
Tip and stalk cells not only differ in their behavior and morphology, but also display remarkable
differences in their gene expression signature. Whereas tip cells highly express VEGFR2, VEGFR3,
PDGFB, ANG2, UNC5B, ESM1; CXCR4, and Nidogen-2, stalk cells express higher levels of Robo4,
Jagged1, and VEGFR1. These gene expression differences determine their specialized functions
during sprouting angiogenesis (Potente et al., 2011; Phng and Gerhardt, 2009).
The selection of endothelial cells into tip and stalk cells is controlled by delta-like 4 (Dll4)–Notch
signaling through a phenomenon known as lateral inhibition. Tip cells have higher levels of Dll4,
compared with stalk cells, which are subjected to higher levels of Notch signaling. Although
endothelial cells express several Notch receptors, Notch1 is critical for suppressing the tip cell
phenotype in stalk cells (Hellström et al., 2007). VEGFR activity affects expression of the Notch ligand
Dll4. It is also known that Notch signaling influences the level of VEGFRs, suggesting that relative
differences in VEGFR levels between adjacent cells may explain how Notch signaling controls
sprouting. Thus, these observations indicate that these two pathways interconnect in an intercellular
VEGF–VEGFR–Dll4–Notch–VEGFR feedback loop, that is necessary and sufficient to stably pattern
endothelial cells into tip and stalk cells under adequate VEGF-A stimulation. Dll4 ligand induces the
activation of Notch in neighboring endothelial cells, leading to the inhibition of the tip cell phenotype in
these cells by downregulating VEGFR2, VEGFR3, and NRP1, while upregulating VEGFR1. On the
contrary, cells with lower VEGFR1 expression start to compete for the tip cell position (Blanco and
Gerhardt, 2013; Potente et al., 2011; Jakobsson et al., 2010; Phng and Gerhardt, 2009) (Figure I.3).
Unlike Dll4 that is mainly expressed by tip cells the Notch ligand Jagged1 (JAG1) is expressed
primarily by stalk cells. This ligand is a pro-angiogenic regulator that antagonizes Dll4–Notch
signaling, and thereby positively controls the number of sprouts and tips. In addition, post-translational
modifications of Notch receptors mediated by Fringe-family enzymes favors the Dll4-mediated Notch
activation, but strongly decrease the signaling capability of Jagged1. Therefore, Fringe is critical for
the opposing roles of Jagged1 and Dll4 during tip and stalk cell selection (Potente et al., 2011; Eilken
and Adams, 2010) (Figure I.3).

6
Figure I.3 - Molecular mechanism regulating ECs selection into a tip and stalk cells during sprouting
angiogenesis. The specification of ECs into tip and stalk cells is controlled by VEGF and Notch signaling
pathways. VEGF-A interacts with VEGFR2. Nrp1 modulates the VEGF-A signaling output, enhancing the binding
activity and signaling of VEGF-A through VEGFR2. Under VEGF-A stimulation, Dll4 expression is up-regulated in
the tip cells, and Dll4 ligand activates Notch that, consequently, suppressing the tip cell phenotype. Notch
signaling activation reduces VEGFR2/3 expression and increases VEGFR1 levels. In contrast, the tip cell
receives low Notch signaling, allowing high expression of VEGFR2/3 and Nrp1, but low VEGFR1. Contrary to
Dll4, Jagged1 ligand is expressed by the stalk cells and antagonizes Dll4–Notch signaling in the sprouting front
when the Notch receptor is modified by the glycosyltransferase Fringe, thereby enhancing differential Notch
activity between tip and stalk cells. Figure created based in Blanco and Gerhardt (2010).
2.5. Basement membrane degradation and mural cells detachment
The first processes occurring during the generation of new sprouts in response to VEGF are the
degradation of basement membrane and mural cells detachment that support cells in quiescent blood
vessels. Endothelial and mural cells (vSMCs and pericytes) share a basement membrane composed
of extracellular matrix (ECM) proteins that wrap around endothelial tubules. This ECM and mural cells
are essential to prevent endothelial cells from leaving their positions (Potente et al., 2011).
At the beginning of the sprouting process, the basement membrane components are degraded by
proteolytic degradation. This controlled degradation is performed by matrix metalloproteases (MMPs),
which are enriched in endothelial tip cells. In the other hand, the detachment of mural cells is
stimulated by the release of ANGPT2 from endothelial cells, destabilizing the quiescent vasculature
and therefore promoting sprouting angiogenesis (Potente et al., 2011; Huang et al., 2010) (Figure I.4).

7
Figure I.4. - Schematic representation of sprouting angiogenesis initiation, vessel branching, and
maturation. Angiogenesis is activated in response to hypoxic tissue that releases VEGF-A. A, VEGF-A stimulate
the activation of quiescent ECs. B, At the cellular level, the angiogenic initiation requires the degradation of
basement membrane and detachment of mural cells. C, also the specification of the activated ECs into tip and
stalk cells is requires. D, ECs proliferate and collectively invade the hypoxic tissue while they remain connected to
the original vascular network. In the nascent sprout characterized by their migratory behavior and dynamic
filopodia, tip cells guide the sprout, followed by stalk cells, which proliferate and support the sprout elongation. E,
tip cells forms the new connection into a functional vessel loop, between different sprouts through tip cell fusion
(anastomosis). Formation of the vascular lumen allows the blood flow, increases tissue oxygenation, and reduces
the release of endothelial growth factors, supporting the establishment of quiescence blood vessel. F, vessel
maturation and stabilization proceed is initiated, with the recruitment of mural cells and the deposition of
basement membrane. Figure adapted from Blanco and Gerhardt (2010).
2.6. Lumen formation
Other important role of the stalk cells during angiogenesis is the establishment of a vascular lumen
in the newly formed blood vessel. This process can occur by different mechanisms depending on the
vascular plexus or type of vessel that forms. Three mechanisms, including budding, cord hollowing,
and cell hollowing can operate in vascular endothelial cells during development or post-natal
angiogenic events (Potente et al., 2011; Geudens and Gerhardt, 2011; Iruela-Arispe and Davis, 2009).
Studies in intersomitic vessels (ISVs) of zebrafish indicate that endothelial cells form a lumen by
coalescence of intracellular (pinocytic) vacuoles, which interconnect with vacuoles from neighboring
endothelial cells to form continuous multicellular lumenized tubule structures in a process known as
cell hollowing (Potent et al. 2011). According to Iruela-Arispe and Davis, budding and cord hollowing
may be essentially synonymous in angiogenic sprouting (Iruela-Arispe and Davis, 2009). In this case,
and contrary to cell hollowing, endothelial cells can adjust their shape and rearrange their junctions to
open up a lumen, with relocalization of junctional proteins and, consequently, cell shape modifications.

8
When undergoing cord hollowing, stalk cells, first, acquire an initial apical-basal polarity with VE-
cadherin that also promotes the relocalization of CD34-sialomucins to the cell-cell contact sites. After
this initial step, the negative charge of the sialomucins induces electrostatic repulsion signals in the
apical (lumenal) membrane, promoting the initial separation of the apical membranes. During cell
separation and extension of the lumen, endothelial cell adherents junctions are predominantly
maintained by VE-cadherin, while adherent vascular endothelial molecules VE-cadherin-expressing
junctions are relocalised to the lateral cell contact sites. Subsequent changes in endothelial cell shape
and further separation of the adjacent endothelial cells and lumen expansion, are driven by VEGF
that, in its turn, regulates the localization of non-muscle myosin II to the apically enriched F-actin
cytoskeleton (Potente et al., 2011; Geudens and Gerhardt, 2011; Iruela-Arispe and Davis, 2009)
(Figure I.5). These changes are essential for establishment of vascular lumen formation allowing the
initiation of new blood vessel formation.
Figure I.5 - Lumen formation during sprout
outgrowth. Left, cell hollowing, endothelial cells
can form a lumen by forming intracellular
vacuoles that coalesce and connect with each
other and with vacuoles in neighboring cells.
Right, cord hollowing, an intercellular lumen can
be created by apical membrane repulsion. VE-
cadherin establishes the initial apical-basal
polarity and localizes CD34-sialomucins to the
cell-cell contact sites. The negative charge of
the sialomucins induces electrostatic repulsion
and initial separation of the apical membranes,
allowing the relocalization of junctional proteins
to the lateral membranes (adapted from
Geudens and Gerhardt (2011).
2.7. Sprout anastomosis
To generate new blood vessels, tip cells need to contact with other tip cells and assemble new
lumen containing tubules in order to add new vessel circuits to the existing network through a process
known as sprout anastomosis. The formation of new vascular connections by sprout anastomosis also
requires that tip cells suppress their motile and explorative behavior, while maintaining strong
adhesive interactions. Upon encountering their targets, the tip cells of other sprouts or existing
capillaries, will establish new endothelial cell–endothelial cell junctional contacts, which are the first
step of anastomosis (Adams and Alitalo, 2007). Later on, when the contact between tip cells is
established, the adherent molecule VE-cadherin is recruited to the contact sites not only to consolidate
the connection between the sprouts, but also to contribute for the downregulation of pro-angiogenic
signaling and tip cell behavior at these sites (Potente et al., 2011; Eilken and Adams, 2010;
Vestweber, 2008) (Figure I.6). Besides VE-cadherin, macrophages are also known to support vessel
anastomosis at sites of vessel fusion by accumulating and interacting with filopodia of neighboring tip
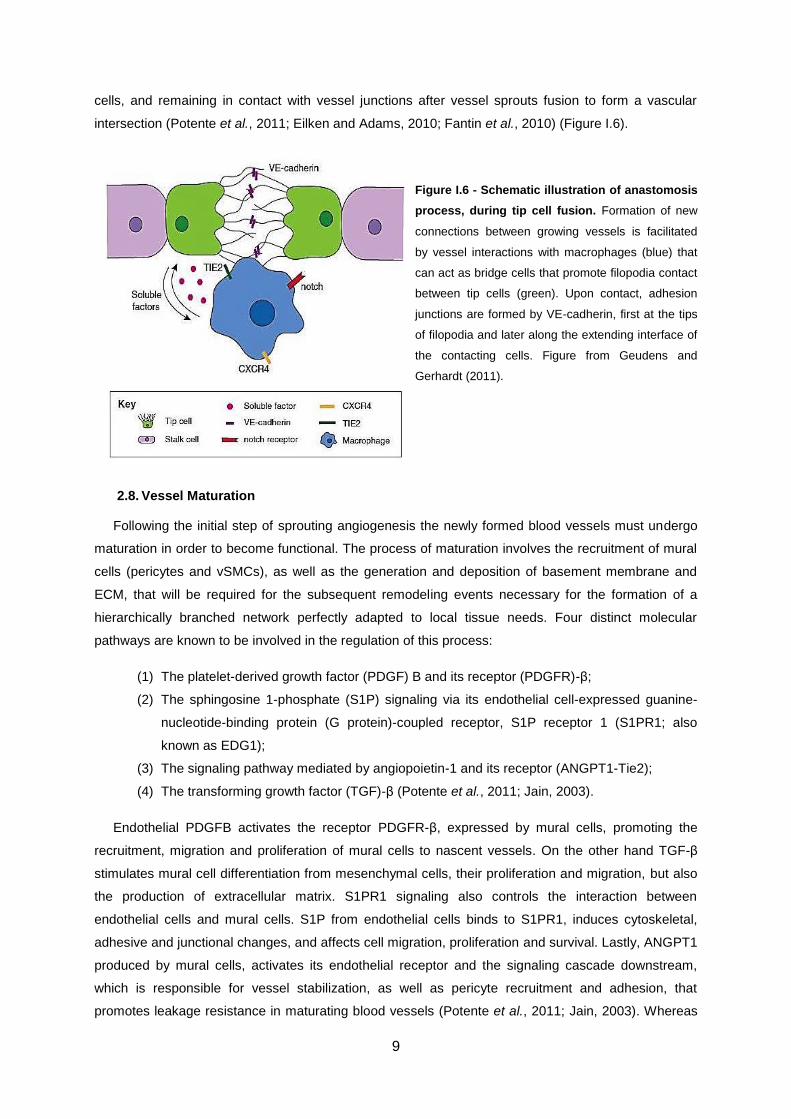
9
cells, and remaining in contact with vessel junctions after vessel sprouts fusion to form a vascular
intersection (Potente et al., 2011; Eilken and Adams, 2010; Fantin et al., 2010) (Figure I.6).
Figure I.6 - Schematic illustration of anastomosis
process, during tip cell fusion. Formation of new
connections between growing vessels is facilitated
by vessel interactions with macrophages (blue) that
can act as bridge cells that promote filopodia contact
between tip cells (green). Upon contact, adhesion
junctions are formed by VE-cadherin, first at the tips
of filopodia and later along the extending interface of
the contacting cells. Figure from Geudens and
Gerhardt (2011).
2.8. Vessel Maturation
Following the initial step of sprouting angiogenesis the newly formed blood vessels must undergo
maturation in order to become functional. The process of maturation involves the recruitment of mural
cells (pericytes and vSMCs), as well as the generation and deposition of basement membrane and
ECM, that will be required for the subsequent remodeling events necessary for the formation of a
hierarchically branched network perfectly adapted to local tissue needs. Four distinct molecular
pathways are known to be involved in the regulation of this process:
(1) The platelet-derived growth factor (PDGF) B and its receptor (PDGFR)-β;
(2) The sphingosine 1-phosphate (S1P) signaling via its endothelial cell-expressed guanine-
nucleotide-binding protein (G protein)-coupled receptor, S1P receptor 1 (S1PR1; also
known as EDG1);
(3) The signaling pathway mediated by angiopoietin-1 and its receptor (ANGPT1-Tie2);
(4) The transforming growth factor (TGF)-β (Potente et al., 2011; Jain, 2003).
Endothelial PDGFB activates the receptor PDGFR-β, expressed by mural cells, promoting the
recruitment, migration and proliferation of mural cells to nascent vessels. On the other hand TGF-β
stimulates mural cell differentiation from mesenchymal cells, their proliferation and migration, but also
the production of extracellular matrix. S1PR1 signaling also controls the interaction between
endothelial cells and mural cells. S1P from endothelial cells binds to S1PR1, induces cytoskeletal,
adhesive and junctional changes, and affects cell migration, proliferation and survival. Lastly, ANGPT1
produced by mural cells, activates its endothelial receptor and the signaling cascade downstream,
which is responsible for vessel stabilization, as well as pericyte recruitment and adhesion, that
promotes leakage resistance in maturating blood vessels (Potente et al., 2011; Jain, 2003). Whereas
10
immature capillaries are supported by pericytes, vSMCs are recruited mostly to larger diameter
vessels, such as arteries and veins, that are separated from the endothelium by a basement
membrane layer (Potente et al., 2011). Importantly, this process can be inverted in response to pro-
angiogenic signals, such as VEGF-A or ANGPT2, which promote mural cell detachment and vessel
destabilization, thus allowing further rounds of vascular remodeling (Herbert and Stainier, 2011).
2.9. Endothelial cell motility
Migration of endothelial cells is essential for the formation of new blood vessels in the context of
physiological and pathological angiogenesis. During angiogenesis, the formation of vascular network
from pre-existing blood vessels depends on the collectively migration that shows similar
characteristics to individually migration of cells. The biological process can be dependent on both
types of migration or one cell type can migrate in both ways depending on the context of migration. In
both cases of migration, cells must be polarized and their movement can be random or directional,
following a defined motility cycle with typical features (Michaelis, 2014). Thus, cells should acquire an
asymmetric morphology with a characteristic leading and trailing edge by actively remodeling their
cytoskeleton (Michaelis, 2014; Franco and Li, 2009). One of the main factors regulating endothelial
cell migration in sprouting angiogenesis is VEGFA. This morphogen has been shown to promote
endothelial migratory behavior and VEGFA gradients modulate tip cell filopodia formation (Gerhardt et
al., 2003; Lamalice et al., 2004; Ruhrberg et al., 2002). It is known that filopodia formation involves
complex and dynamic rearrangement of actin cytoskeleton networks, and it favors directed cell
migration (Mattila and Lappalainen, 2008). However, currently lack a good mechanistic understanding
of how VEGFA stimulation regulates endothelial tip cell filopodia formation and tip cell invasion (De
Smet et al., 2009; Lamalice et al., 2007).
Actin cytoskeleton in motile cells 3.
3.1. Cytoskeleton dynamics
Globular actin (G-actin) is the basic unit of actin filaments. Actin polymerization is controlled by
numerous actin binding proteins, which regulate the architecture of actin filaments, forming branched
and crosslinked networks (cortex and lamellipodium), parallel bundles (filopodium), or anti-parallel
contractile structures (stress fibers) (Blanchoin et al., 2014; Franco and Li, 2009) (Figure I.7). The
process of actin polymerization is directly influenced by local intracellular concentrations of ATP-bound
G-actin and also by the activity of many G-ABPs. Although actin microfilament turnover involves the
regeneration of depleted ATP–actin levels from ADP-actin pools, cell motility also requires the de novo
biosynthesis of G-actin. Thus, cell motility requires not only the tight temporal coupling of actin
dynamics, but also the transcriptional regulation of other structural and regulatory components of the
actin microfilament network (Olson and Nordheim, 2010).

11
The actin cytoskeleton is a highly dynamic structure that is able to respond rapidly to extracellular
stimuli through the activation of receptors transforming the received signal into a morphological and/or
behavioral change. The dynamic rearrangements of actin filaments generate the physical force
necessary for cells to produce filopodia or lamellipodia and to readjust their adhesive contacts to the
cellular environment, known as focal adhesions (Olson and Nordheim, 2010; Franco and Li, 2009). In
this context, there are a vast number of cellular motile functions triggered by extracellular stimuli that
are able to activate different members of the Rho GTPase family (Rho, Rac and Cdc42 subfamilies).
Rho GTPases can regulate effector proteins that modulate the polymerization equilibrium of G-actin
and F-actin. Enabling G-actin to form complexes with different ABPs, including the nucleating factors
profilin, formins and the actin related protein 2/3 complex (ARP2/3 complex) (Olson and Nordheim,
2010).
Figure I.7 - Schematic representation of the cell with the different architectures in the motile cell. i) the cell
cortex; ii) an example of a contractile fiber, the stress fiber; iii) the lamellpodium; and iv) the filopodia. The zoom
regions highlight architectural specificities of different regions of the cell. Figure adapted from Blanchoin et al.
(2014).
3.2. Filopodia and lamellipodia protrusions
Cell motility requires the formation of an actin filament that is nucleated by either formins or the
ARP2/3 complex. Following nucleation, cellular protrusions start to form directly via actin assembly or
indirectly through myosin contractility of the actin cortex followed by cytoskeleton disassembly
(Blanchoin et al., 2014). Thus, when cells initiate migration and acquire an asymmetric polarized
morphology, extensive protrusions of the cell membrane driven by the polymerization of actin
12
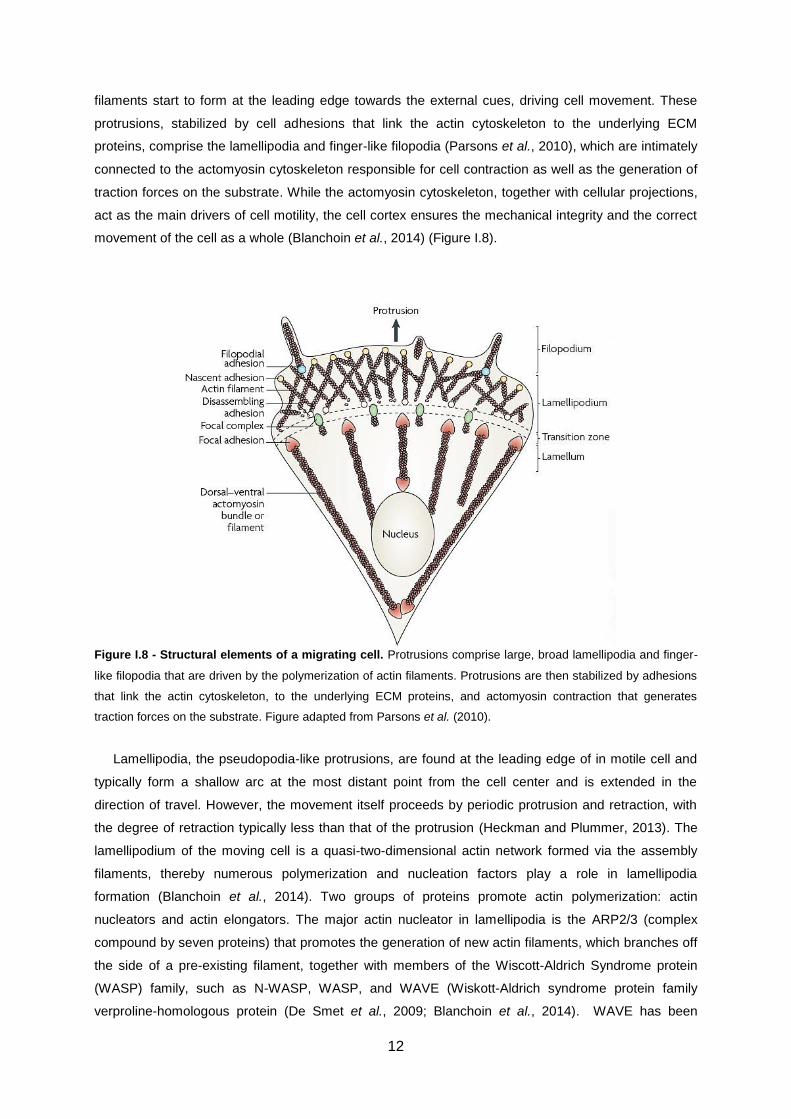
filaments start to form at the leading edge towards the external cues, driving cell movement. These
protrusions, stabilized by cell adhesions that link the actin cytoskeleton to the underlying ECM
proteins, comprise the lamellipodia and finger-like filopodia (Parsons et al., 2010), which are intimately
connected to the actomyosin cytoskeleton responsible for cell contraction as well as the generation of
traction forces on the substrate. While the actomyosin cytoskeleton, together with cellular projections,
act as the main drivers of cell motility, the cell cortex ensures the mechanical integrity and the correct
movement of the cell as a whole (Blanchoin et al., 2014) (Figure I.8).
Figure I.8 - Structural elements of a migrating cell. Protrusions comprise large, broad lamellipodia and finger-
like filopodia that are driven by the polymerization of actin filaments. Protrusions are then stabilized by adhesions
that link the actin cytoskeleton, to the underlying ECM proteins, and actomyosin contraction that generates
traction forces on the substrate. Figure adapted from Parsons et al. (2010).
Lamellipodia, the pseudopodia-like protrusions, are found at the leading edge of in motile cell and
typically form a shallow arc at the most distant point from the cell center and is extended in the
direction of travel. However, the movement itself proceeds by periodic protrusion and retraction, with
the degree of retraction typically less than that of the protrusion (Heckman and Plummer, 2013). The
lamellipodium of the moving cell is a quasi-two-dimensional actin network formed via the assembly
filaments, thereby numerous polymerization and nucleation factors play a role in lamellipodia
formation (Blanchoin et al., 2014). Two groups of proteins promote actin polymerization: actin
nucleators and actin elongators. The major actin nucleator in lamellipodia is the ARP2/3 (complex
compound by seven proteins) that promotes the generation of new actin filaments, which branches off
the side of a pre-existing filament, together with members of the Wiscott-Aldrich Syndrome protein
(WASP) family, such as N-WASP, WASP, and WAVE (Wiskott-Aldrich syndrome protein family
verproline-homologous protein (De Smet et al., 2009; Blanchoin et al., 2014). WAVE has been

13
implicated in lamellipodia and needs Rac1, a membrane-bound GTPase, and lipids to become
functional for activating the ARP2/3 complex. This activation results in tight control of ARP2/3
complex-based polymerization at the leading edge of the cell (Blanchoin et al., 2014).
Filopodia are found in many different cell types and display active protrusive, retractile and
sweeping motility. This is absolutely essential for their function as cellular sensors that are able to
detect soluble cues to define the direction of cell movement (Yang and Svitkina, 2011). These finger-
like projections composed of unbranched, bundled actin filaments oriented with their growing ends
towards the cell membrane are highly dynamic actin-rich membrane protrusions that extend out from
the cell edge (Jacquemet et al., 2015; Blanchoin et al., 2014). Their orientation is due to the presence,
in the filopodia tip complex, of formins, such as formin diaphanous-related formin-2 (Dia2) and
Ena/VASP proteins, both of which are capable of retaining the growing barbed ends at the cell
membrane and enhance filament growth (Blanchoin et al., 2014; Mattila and Lappalainen, 2008). In
addition to these regulators, the extension of filopodia driven by the incorporation of actin subunits at
the protrusion tips and subsequent release at the rear of the filopodia through a process named
treadmilling (Yang and Svitkina, 2011), is controlled by various small GTPases of the Rho family (i.e.
Rac1 and Cdc42), actin capping proteins, and I-Bar proteins (Insulin receptor substrate IRSp53)
(Jacquemet et al., 2015) (Figure I.9). In particular, Cdc42 is involved in the formation of filopodia
(Lamalice et al., 2007) and additional studies showed that GTPase Cdc42 is a key molecular player in
endothelial cell actin organization, where loss of Cdc42 in endothelial cells, both in vitro and in vivo,
lead to rapid loss of actin organization. Also, loss of Cdc42 during post-natal retinal stages suppresses
angiogenic remodeling, filopodia formation and sprouting. As the cytoskeleton anchors junctions, cell
adhesion is impaired both between cells and between endothelial cells and cell-extracellular matrix.
These findings support that Cdc42 as a key molecular player in sprouting angiogenesis (Barry et al.,
2015).
Figure I.9 - Working model for
filopodia formation. This model
describes functions localizations of
key proteins during filopodia
formation. Figure adapted from Mattila
and Lappalainen (2008).
3.3. Actin/Myosin interactions
Myosins constitute a superfamily of motor proteins that play important roles in several cellular
processes that require force and translocation. These molecules can walk along, propel the sliding or
produce tension on actin filaments. But for this to happen, energy obtained through the hydrolysis of
ATP is required, as well as the availability of myosin catalytic sites with ATPase activity. These

14
catalytic sites are located in the amino-terminal (head) region of the molecule, and are usually
activated when myosin binds to actin. The vast majority of myosins belong to class II. It is important to
refer that myosin II molecules resemble their muscle counterparts, with respect to both structure and
function, and are also present in all non-muscle eukaryotic cells. In this context, like muscle myosin II,
non-muscle myosin II (NMII) molecules are comprised of three pairs of peptides: two heavy chains
(MHCs), two regulatory light chains [RLCs, also known as myosin light chain (MLC)] that regulate NMII
activity and two light chains (ELCs) that stabilize the heavy chain structure (Vicente-Manzanares et al.,
2009) (Figure I.10). Each MHC contains an N-terminal globular motor domain that moves actin as it
hydrolyses ATP, as well as a C-terminal tail region that binds to the other MHC, whilst MLC
phosphorylation regulates the ATPase activity of MHC (Vicente-Manzanares et al., 2007). NMII can
use its actin cross-linking activity and contractile functions, which are regulated by phosphorylation
and the ability of NMII to form filaments to regulate the actin cytoskeleton (Vicente-Manzanares et al.,
2009).
Figure I.10 – Structure of non-muscle myosin II (NM II) and dynamics. a, the subunit and domain structure of
myosin, which forms a dimer through interactions between the α-helical coiled-coil rod domains. The globular
head domain contains the actin-binding regions and the enzymatic Mg2+
-ATPase motor domains. The essential
light chains (ELCs) and the regulatory light chains (RLCs) bind to the heavy chains at the lever arms that link the
head and rod domains. b, NM II molecules assemble into bipolar filaments through interactions between their rod
domains. These filaments bind to actin through their head domains and the ATPase activity of the head enables a
conformational change that moves actin filaments in an anti-parallel manner. Figure adapted from Vicente‑
Manzanares et al. (2009).
NMII molecules have a fundamental role in cellular reshaping and movement, such as cell
adhesion, cell migration, cell contractibility and cell division. Additionally, it is an important end point on
which many signaling pathways converge, largely through Rho GTPases. NMII itself is tightly
regulated at different levels, including at the level of folding, filament assembly and disassembly, actin
binding and ATPase and motor activity (Vicente-Manzanares et al., 2009). There are three different
genes in mammalian cells that encode the NMII heavy chain (NMHCII) proteins (NMHCII-A, NMHCII-B
and NMHCII-C), myosin heavy chain 9 (MYH9), MYH10 and MYH14. In contrast, the light chains are

15
encoded by a different set of genes, which can also undergo alternative splicing, and currently there is
no known specificity of light chains for particular NMHCIIs (Vicente-Manzanares et al., 2009).
Serum Response Factor (SRF) 4.
4.1. Molecular and biological functions of SRF
The serum response factor (SRF) is an ancient and evolutionarily conserved transcription factor of
the MADS-box family (MCM1, Agamous, Deficiens, SRF) and is known to be involved in a wide variety
of biological processes (e.g. gastrulation, heart, liver and brain development, immune system
homeostasis, etc.). It is present in most, if not all, species from the animal, plant, and fungi kingdoms
and it is expressed in many cell types. Its characteristic name comes from its ability to bind to a serum
response element (SRE) site located in the promotor of immediate early transcription factors (Miano et
al., 2007). Homodimeric SRF binds with high affinity and specificity to the core palindromic
CC(A/T)6GG DNA sequence of the SRE, called the CArG box, which is common to all SRF-target
genes and is responsible for promoting the transcription of numerous target genes involved on distinct
signaling cascades (Olson and Nordheim, 2010; Miano et al., 2007).
SRF binding motifs have been identified in the regulatory regions of multiple genes and are known
to regulate several processes, such as cell growth, migration, cytoskeletal organization/contractility,
energy metabolism and myogenesis (Sun et al., 2006). This transcription factor is seen as the master
regulator of genes encoding actin and other contractile proteins, important for the cell cytoskeleton. It
is also considered as the major regulator of cytoskeletal protein expression (Franco et al., 2008).
There are, nevertheless, functions of SRF that go beyond this transcriptional control of cytoskeletal
target genes. SRF can also regulate the transcription of genes involved in cell proliferation and
survival (Olson and Nordheim, 2010).
SRF activation occurs mainly through mitogen activated protein kinase (MAPK) or via Rho
GTPases/actin dynamics signaling pathways, both converging on the nucleus to induce the
transcription of SRF-target genes (Miano et al., 2007; Posern et al., 2002). Through its direct
association with the promoter region of target genes, SRF can control the recruitment of several
cofactors. Thus, depending on this two signaling inputs, two different cofactors can be recruited to the
transcriptional complex:
(1) The ternary complex factor (TCF) subclass of E twenty-six (Ets)-type cofactors (Elk-1, Net
and Sap-1);
(2) The myocardin family of coactivators (myocardin-related transcription factors; MRTF-A,
MRTF-B, and myocardin itself).
These two type of cofactors have mutually exclusive interactions with SRF and enable it to directly
regulate the expression of different sets of target genes (Olson and Nordheim, 2010; Buchwalter et al.,
2004). While MRTFs specifically bind to G-actin and respond to fluctuations in its concentration
induced by the activity of Rho GTPases, TCF activity is controlled by Ras-MAPK signaling (Ras-Raf-

16
MEK-ERK signaling) (Clark and Graves, 2014; Esnault et al., 2014) (Figure I.11). Studies performed
around the role of the SRF network in the fibroblast by serum response demonstrate a critical role for
MRTF signaling. The similarity of MRTF and SRF inactivation phenotypes highly suggest that MRTFs
act solely through SRF, in contrast to TCFs that can act redundantly with other Ets proteins,
independently of SRF (Esnault et al., 2014).
In addition to TCFs and MRTFs, several other transcription factors have been implicated in SRF
regulation, acting as positive and negative SRF cofactors. Although the identities of many proteins
involved in SRF regulation are not yet known, it is necessary to learn more about how different signals
and cofactors combine to enable the differential transcriptional activity of SRF in different cell types
(Posern and Treisman, 2006).
Figure I.11 - Model illustrating the two main pathways regulating SRF activity. Stimulation activates both
Rho GTPases-dependent (left) and Ras/MAPK-dependent (right) signaling. Activation of the MAP kinase pathway
(right) through Ras, Raf, MEK and ERK phosphorylates TCFs, which bind to their own Ets DNA recognition site
and activate SRF. Signaling through Rho family GTPases and the actin treadmilling cycle (left) results in the
dissociation of MAL from actin, which then binds and activates SRF. Figure adapted from Posern and Treisman
(2006).
4.2. Actin-MRTF-SRF signaling
While myocardin, the founding member of the MRTF family, is expressed specifically in cardiac
muscle and smooth muscle cells, the MRTF family members of SRF cofactors, MRTF-A (also called
MAL, MKL1 or BSAC) and MRTF-B (also called MKL2 or MAL16), have widespread expression
patterns (Olson and Nordheim, 2010; Posern and Treisman, 2006). Although MRTF-A and MRTF-B
have distinct functions and/or targets in specific cells, other authors proposed an alternative view
arguing that these two proteins are functionally redundant since the knockout of either MRTF-A or
MRTF-B reduces the total MRTF activity below a functional threshold (Posern and Treisman, 2006).
17
In general terms, cytoplasmic concentration of G-actin is reflected by the concentration of MRTFs.
When the rate of actin polymerization is reduced, MRTFs form a complex with G-actin (inactive state)
and remain in the cytoplasm. The amino termini of MRTFs contain three RPEL domains (conserved N-
terminal region containing three RPEL motifs), which form a stable complex with monomeric G-actin,
allowing the sequestration of MRTFs in the cytoplasm (Olson and Nordheim, 2010; Wang et al., 2003).
However, when cells receive extracellular stimuli stimulating F-actin polymerization, this leads to the
release of MRTFs from the G-actin-complex (active state), and to their nuclear import. In the nucleus
MRTFs binds to SRF, resulting in the activation of SRF-dependent transcription (Figure I.11). Notably,
nuclear G-actin also facilitates the nuclear export of MRTF and prevents activation of SRF target
genes. Through this mechanism, the actin–MRTF–SRF circuit links gene expression to actin assembly
and disassembly (Olson and Nordheim, 2010; Miralles et al., 2003). Although these regulatory
mechanisms have been thoroughly described in muscle cells and cultured fibroblasts, the processes
underlying the regulation of the actin–MRTF–SRF circuit in endothelial cells remain poorly understood
(Olson and Nordheim, 2010).
4.3. SRF function in sprouting angiogenesis
As previously described, angiogenesis is essential for organ development and function in both
physiological and disease contexts. Chai and his colleagues showed that SRF is a downstream
mediator of VEGF signaling in endothelial cells and that SRF is required for VEGF-induced endothelial
cell migration, proliferation, and actin cytoskeleton rearrangements (Chai et al., 2004). In addition,
other studies using a transgenic mouse line Tie1-Cre showed not only that SRF expression is
restricted to ECs resident in small vessels of the mouse embryo, but also that its presence is
particularly important for the expression of β-actin and VE-cadherin in these cells. Furthermore, SRF
inactivation in embryonic endothelial cells leads to a decrease in the number of branching points,
alterations in tip cell morphology and filopodia, and the disruption of endothelial cell junctions, leading
to embryonic death. Therefore, SRF has a crucial role in sprouting angiogenesis and in the
maintenance of small vessel integrity (Franco and Li, 2009; Franco et al., 2008). Induced endothelial
SRF deletion at different time points in post-natal mice showed dramatic growth retardation,
decreased viability, inducing systemic hypovascularization and severe retinal angiopathies (Franco et
al., 2013; Weinl et al., 2013).
During both embryonic and post-natal angiogenesis, SRF is strongly expressed by endothelial cells
at the sprouting front, both in tip and stalk cells. SRF is essential for filopodia formation and tip cell
invasion downstream of VEGF signaling (Franco and Li, 2009; Franco et al., 2008). Notably, Weinl
and colleagues also showed that double-KO mice with endothelial cell-specific MRTF-B deletion
(Mrtfa–/–
MrtfbiECKO
mice) and SrfiECKO
mice have a highly overlapping phenotypic characteristics
phenotype, suggesting that MRTFs are the relevant endothelial cell SRF cofactors in vivo ensuring
appropriate retinal angiogenesis (Weinl et al., 2013). Mechanistically, VEGF-A signaling activates G-
actin–dependent MRTF-A translocation from the cytoplasm to the nucleus and MRTF/SRF
transcriptional activity. MRTF/SRF signaling output in endothelial cells promotes cytoskeleton and
junctional reorganization for efficient endothelial sprouting (Franco et al., 2013; Weinl et al., 2013).

18
Interestingly, SRF expression is increased in human tumor endothelium, and, curiously SRF deletion
in mouse tumor models impairs tumor angiogenesis (Franco et al., 2013). MRTF/SRF signaling, in this
context, controls the expression of MYL9. Decreased expression of MYL9 is sufficient to impair
endothelial cell migration (Franco et al., 2013). Given the specific and central function the MRTF/SRF
is a potential target for pathological angiogenesis.
Working Models for studying vascular development 5.
Several different in vitro models and techniques are predominantly used to characterize the
signaling pathways controlling angiogenesis and to identify new therapeutic targets. These
approaches include wound healing/scratch wound cell migration assays, EC proliferation assays,
network formation assays in Matrigel and three-dimensional angiogenesis assays, such as the aortic
ring assay and assays of capillary-like structures formation in fibrin or collagen. However, these
techniques have some limitations, most they focus on isolated steps of angiogenesis and are affected
by artificial experimental settings, such as lack of blood flow, different origins of ECs and different cell
culture media (Pitulescu et al., 2010). In this context, most of angiogenic studies are also performed
through in vivo assays, such as zebrafish embryos, post-natal mouse retinas and various tumors
models.
5.1. Mouse retinal model
The post-natal retinal model has contributed significantly to understanding the mechanisms of
angiogenic sprouting (Geudens and Gerhardt, 2011). As in other tissues, retina blood vessels undergo
extensive changes during development. Efficient analyses may be performed in a single system, the
retina, at various stages of post-natal life. Also, the retina is an excellent system for certain models of
pathological angiogenesis. Using the mouse retinal model allows the analysis of angiogenesis in
newborn, young and adult mutant mice, drug-treated animals or disease models with pathological
vascularization (Pitulescu et al., 2010). In addition, retinas are ideal structures to visualize using
whole-mount immunostaining and in-situ hybridization techniques, coupled with high resolution three-
dimensional imaging by confocal laser scanning microscopy (Gerhardt et al., 2003). Thus, with this
developmental model of angiogenesis the stereotypical vascular pattern of the early postnatal mouse
retina may be studied in a well-defined sequence of events. Before birth, the hyaloid vasculature
supplies the inner eye and lens with nutrients and oxygen. In contrast, after birth, these hyaloid
vessels start to regress and a new vascular plexus forms rapidly. In the first days, a primitive vascular
plexus will be formed by sprouting, endothelial cell proliferation and migration, following later by
remodeling and maturation into a hierarchical vascular tree of arteries, veins and interconnecting
capillaries (Pitulescu et al., 2010). Therefore, from birth until postnatal day 7 (P7), the endothelial
network extends gradually from the center of the retina towards the periphery. After this initial two-
dimensional vascular growth period, sprouting into the deeper retinal layers begins, and within the
next 1–2 weeks, depending on the mouse strain, deep and intermediate vascular plexuses are
completely formed (Pitulescu et al., 2010; Gerhardt et al., 2003) (Figure I.12).

19
Figure I.12 - Schematic illustration of a growing sprout in mouse
retina. Vessel networks and sprouts in mouse retinal model system at
post-natal day (P) 5. Inset shows higher magnification of sprouting front
showing tip cells with filopodia and stalk cells. Red shows the endothelial
nuclei (Erg), green shows the Isolectin-B4 that labeled the endothelial cells.
Figure adapted from Geudens and Gerhardt (2011).
5.2. Spheroid sprouting assay
Between classical angiogenesis models, the spheroid sprouting assay consists of the self-
aggregation of endothelial cells embedded in a 3D matrix leading to endothelial cell sprouting and
invasion into the surrounding matrix. This approached in later situation perfectly reproduces the
formation of capillaries from pre-existing vessels and has numerous advantages. As a result, this 3D-
gel-embedded EC spheroid model has gained broad acceptance. This technique provides a better
mimic of the in vivo environment than classical 2D-cultures, is rapid and easy to use, takes into
account different cell properties involved in angiogenesis (e.g., cell proliferation, migration, invasion
and survival), lacks inflammatory complications and thus facilitates the investigation of cellular and
molecular mechanisms underlying angiogenesis. Furthermore, defined experimental conditions can
easily be achieved to facilitate screens for pro- or anti-angiogenic agents and to evaluate the impact of
biochemical and/or physical barriers on cell invasion (Blacher et al., 2014).
Aims 6.
As previously described, SRF is important for post-natal angiogenesis. SRF deletion affects new
blood vessel formation (Franco et al., 2013). Also, endothelial tip cells lacking SRF have fewer
filopodia and drastically decreased propensity to invade and migrate towards VEGF-A gradient
(Franco et al., 2013; Weinl et al., 2013). In this context, the main goal of this master thesis project was
to find cytoskeletal proteins involved in the regulation of endothelial tip cells downstream of SRF
signaling during sprouting angiogenesis. Achieving this aim will be important for improving and
implementing new and more effective therapeutic approaches targeting to inhibit pathological
vascularization.
Claudios Franco’s Lab defined a core of endothelium SRF-target genes using Affimetrix microarray
sequencing. These genes are likely involved in the regulation of actin dynamics, filopodia formation
and endothelial cell migration during angiogenesis. Thus, my specific goal was to identify which genes
downstream of SRF transcriptional regulation are required for efficient cell migration. Towards this
goal, I had a specific approach involving the specific tasks:
- Validation of expression levels in candidate genes
- Functional validation of positive candidates genes
- Rescue of SRF-Knockdown phenotype

20
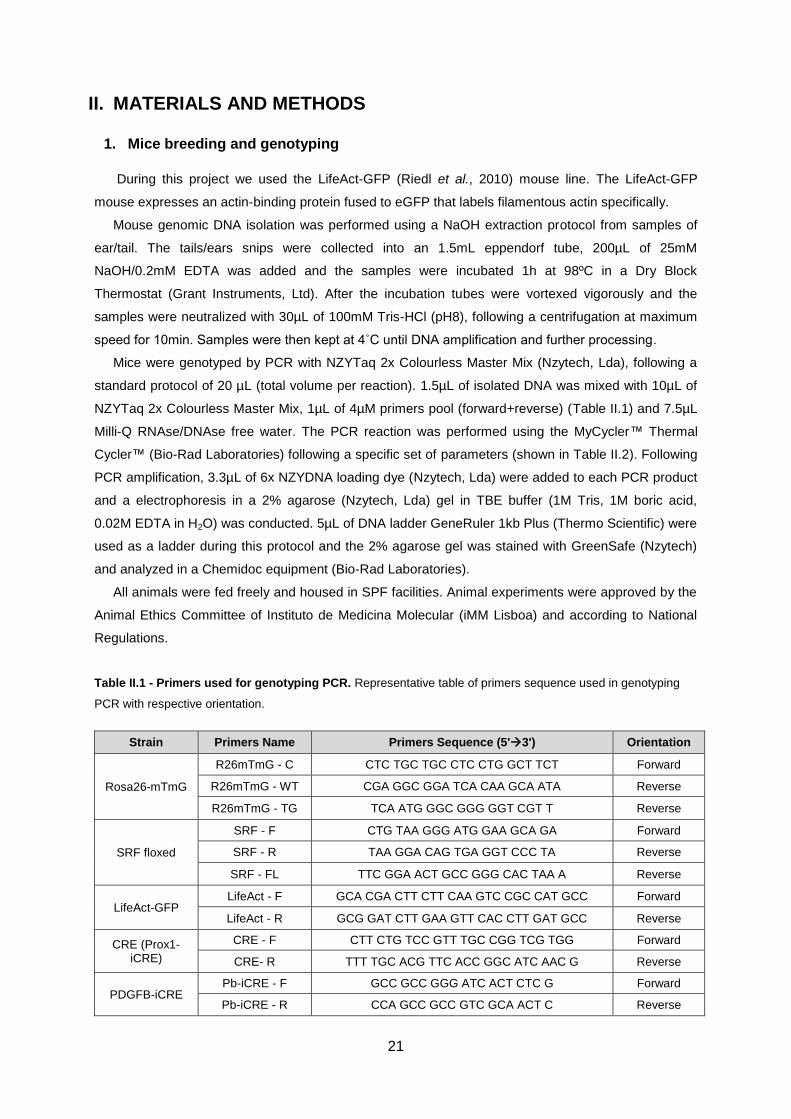
21
II. MATERIALS AND METHODS
Mice breeding and genotyping 1.
During this project we used the LifeAct-GFP (Riedl et al., 2010) mouse line. The LifeAct-GFP
mouse expresses an actin-binding protein fused to eGFP that labels filamentous actin specifically.
Mouse genomic DNA isolation was performed using a NaOH extraction protocol from samples of
ear/tail. The tails/ears snips were collected into an 1.5mL eppendorf tube, 200µL of 25mM
NaOH/0.2mM EDTA was added and the samples were incubated 1h at 98ºC in a Dry Block
Thermostat (Grant Instruments, Ltd). After the incubation tubes were vortexed vigorously and the
samples were neutralized with 30µL of 100mM Tris-HCl (pH8), following a centrifugation at maximum
speed for 10min. Samples were then kept at 4˚C until DNA amplification and further processing.
Mice were genotyped by PCR with NZYTaq 2x Colourless Master Mix (Nzytech, Lda), following a
standard protocol of 20 µL (total volume per reaction). 1.5µL of isolated DNA was mixed with 10µL of
NZYTaq 2x Colourless Master Mix, 1µL of 4µM primers pool (forward+reverse) (Table II.1) and 7.5µL
Milli-Q RNAse/DNAse free water. The PCR reaction was performed using the MyCycler™ Thermal
Cycler™ (Bio-Rad Laboratories) following a specific set of parameters (shown in Table II.2). Following
PCR amplification, 3.3µL of 6x NZYDNA loading dye (Nzytech, Lda) were added to each PCR product
and a electrophoresis in a 2% agarose (Nzytech, Lda) gel in TBE buffer (1M Tris, 1M boric acid,
0.02M EDTA in H2O) was conducted. 5µL of DNA ladder GeneRuler 1kb Plus (Thermo Scientific) were
used as a ladder during this protocol and the 2% agarose gel was stained with GreenSafe (Nzytech)
and analyzed in a Chemidoc equipment (Bio-Rad Laboratories).
All animals were fed freely and housed in SPF facilities. Animal experiments were approved by the
Animal Ethics Committee of Instituto de Medicina Molecular (iMM Lisboa) and according to National
Regulations.
Table II.1 - Primers used for genotyping PCR. Representative table of primers sequence used in genotyping
PCR with respective orientation.
Strain Primers Name Primers Sequence (5'3') Orientation
Rosa26-mTmG
R26mTmG - C CTC TGC TGC CTC CTG GCT TCT Forward
R26mTmG - WT CGA GGC GGA TCA CAA GCA ATA Reverse
R26mTmG - TG TCA ATG GGC GGG GGT CGT T Reverse
SRF floxed
SRF - F CTG TAA GGG ATG GAA GCA GA Forward
SRF - R TAA GGA CAG TGA GGT CCC TA Reverse
SRF - FL TTC GGA ACT GCC GGG CAC TAA A Reverse
LifeAct-GFP LifeAct - F GCA CGA CTT CTT CAA GTC CGC CAT GCC Forward
LifeAct - R GCG GAT CTT GAA GTT CAC CTT GAT GCC Reverse
CRE (Prox1-iCRE)
CRE - F CTT CTG TCC GTT TGC CGG TCG TGG Forward
CRE- R TTT TGC ACG TTC ACC GGC ATC AAC G Reverse
PDGFB-iCRE Pb-iCRE - F GCC GCC GGG ATC ACT CTC G Forward
Pb-iCRE - R CCA GCC GCC GTC GCA ACT C Reverse

22
Table II.2 - Genotyping PCR program. Representative table of PCR conditions (temperature, time and cycles)
for genotyping.
Cycle step Temperature Time Cycles
Initial denaturation 95˚C 120sec 1
Denaturation 95˚C 30sec
30 Annealing 60˚C 30sec
Extension 72˚C 60sec
Final Extension 72˚C 10min 1
Culture of Human Umbilical Vein Endothelial Cells (HUVECs) 2.
HUVECs (C2519A, Lonza) were routinely cultured, following the manufacturer’s manual, in filter-
cap T75 flasks Nunclon™Δ surface treatment (VWR international, LLC) with complete culture medium
EGM™-2 BulletKit™ (CC-3162, Lonza) without gentamicin sulfate amphotericin-B antibiotic (GA) and
were incubated at 37˚C and 5% CO2 to ensure a stable environment for optimal cell growth. All
experiments were done with HUVECs between passages 2 to 6.
Normal passaging of cells was performed from 1 flask at 80-90% of confluence splitted into 4-5
flasks. Cells were washed twice with sterile 6mL of PBS (For 500mL of PBS 10x: 40g NaCl,1 g KCl,
7.2g Na2HPO4, 1.2g KH2PO4, pH7.4). After washes, 3mL of trypsin/EDTA was added and the cells
were incubated for 2-3min at 37ºC (cell detachment was monitored using a microscope, Leica DMIL
LED Fluo). When 95% of cells detached, 3mL of medium was added to each flask in order to inhibit
the activity of trypsin/EDTA and the medium with the detached cells was collected into a falcon tube.
To maximize the amount of cells collected, 3mL of medium was used to wash all flasks and the
volume was combined to the previously used falcon tube. Cells were then collected and centrifuged at
700rpm for 5min. When passing HUVECs for experiments, cells were re-suspended in 5mL of medium
and the cell concentration counted with a Neubauer Chamber Cell Counting (Hirschmann®
EM
Techcolor) for 150 000 cells/mL. Half of the total volume was distributed per each well that previously
had the other half of warm medium. The flasks or plates were then mixed and placed in the incubator.
VEGF induction in HUVECs 3.
VEGF induction was performed for gene and protein expressions assays after siRNA experiments
(described in II.4). For this induction, the culture medium was replaced with serum free medium
(SFM), EBM™-2-growth factor-free medium (CC-3156, Lonza), supplemented with 0.2% Fetal Bovine
Serum (FBS, gibco® by life techonologies) and incubated overnight (ON) at 37ºC. In the next day, cells
were then left untreated or stimulated with VEGFA165 (50 ng/ml; PeproTech) and after 30min (in the
case of RNA extraction) or 2h (in the case of protein), the medium was removed and the RNA or
protein was extracted according to standard procedures.

23
siRNA experiments 4.
In order to silence the expression of target genes, a set of ON-TARGET siRNAs against human
SRF, MKL1, MKL2, MYH9, FLNA, TPM2, TAGLN2, TPM1, LIMA1, TPM4, ACTR3, MICAL2 and a
control siRNA was used. All siRNAs were purchased from Dharmacon™ (siRNA sequences catalog
number in Table II.3). HUVECs were seeded the day before in order to reach a 60-70% confluence
before transfection. Cells were then transfected with a 25nM specific siRNA using the DharmaFECT 1
transfection reagent (Dharmacon™, GE Healthcare) following the Dharmacon™ siRNA Transfection
Protocol. 24h after transfection, the culture medium was replaced for fresh complete culturing medium.
For protein extraction and immunostaining, cells were cultured 92h post-transfection, and for RNA
extraction cells stayed in culture at least 48h until reaching maximal confluence.
Table II.3 - siRNA sequences used in siRNA experiments. Representative table ON-TARGET siRNA target
sequences catalog number (-1, -2 and - 3 represents the 3 siRNA for each candidate gene)
siRNA name siRNA target sequences catalog number
siControl D-001810-01
siSRF J-009800-08-0002
siMKL1 L-015434-00-0005
siMKL2 L-019279-00-0005
siMYH9-1 J-007668-05
siMYH9-2 J-007668-06
siMYH9-3 J-007668-07
siFLNA-1 J-012579-05
siFLNA-2 J-012579-06
siFLNA-3 J-012579-07
siTPM1-1 J-017837-05
siTPM1-2 J-017837-06
siTPM1-3 J-017837-07
siTPM2-1 J-012657-05
siTPM2-2 J-012657-06
siTPM2-3 J-012657-07
siTPM4-1 J-019753-05
siTPM4-2 J-019753-06
siTPM4-3 J-019753-07
siTAGLN2-1 J-011468-05
siTAGLN2-2 J-011468-06
siTAGLN2-3 J-011468-07
siLIMA1-1 J-010663-09
siLIMA1-2 J-010663-17
siLIMA1-3 J-010663-18
siACTR3-1 J-012077-06
siACTR3-1 J-012077-07
siACTR3-1 J-012077-08
siMICAL2-1 J-010189-05
siMICAL2-2 J-010189-06
siMICAL2-3 J-010189-07

24
Overexpression of MIIA-GFP in SRF depleted HUVECs 5.
To assess whether the overexpression of MIIA-GFP was able to rescue the phenotype of SRF
depleted HUVECs, we transfected HUVECs with CMV-GFP-NMHC II-A (MYH9 human) plasmid
(Addgene plasmid #11347), carried out by Lipofectamine® LTX & PLUS™ reagent (Invitrogen™ by
Life Technologies™), after 24h of siRNA transfection (described in II.4). This experiment was
performed only in 24-well plates, with a few modifications of the manufacturer’s protocol and the
volumes were adjusted to avoid pipetting errors. First, mix 1 and mix 2 were prepared as described in
Table II.2. Then, mix 3 (Table II.3) was done and incubated for 15min at room temperature (RT). After
that, in order to form DNA-Lipofectamine® LTX complexes, a final mix, mix 4, was made (Table II.2)
and incubated 25min at RT. Finally, we added 400µL of warm complete culture medium. We removed
the medium of plate and the transfection mixture was then added to the well-plate and 24h later, the
medium was replaced for complete culture medium.
Table II.4 - Lipofectamine
® LTX DNA Transfection Protocol. Representative table of the DNA and reagents per
well used in 24-well plate.
Mixes per well
PLUS™ reagent Lipofectamine
® LTX
reagent Plasmid DNA
(100ng/µL) SFM
Mix 1 2.5µL - - 250µL
Mix 2 - 1.5µL - 250µL
Mix 3 30µL from mix1 - 3µL 70µL
Mix 4 25µL from mix 3 25µL from mix 2 - -
Gene expression assays 6.
RNA extraction from 6 and 12-well plates from seeded HUVECs was performed using the RNeasy®
Mini Kit (Qiagen) as described by the manufacturer’s protocol. RNA was eluted in a final volume of
30µL, quantified using NanoDrop 1000 (Thermo Scientific) and adjusted equally, followed by DNase
digestion and reverse transcription. DNase I digestion that digests a single- and double-stranded DNA
was performed using the DNase I, RNase-free (Thermo Scientific) with 1µg of RNA, following the
manufacturer’s protocol. cDNA synthesis from RNA was performed using High Capacity RNA-to-cDNA
Kit (Applied Biosystems®) with 1µg of RNA according to the manufacturer protocol using the
MyCycler™ Thermal Cycler™ (Bio-Rad Laboratories). The cDNA samples were diluted 25x for the
subsequent quantitative real-time PCR (qPCR) reactions.
Quantitative real-time PCR was performed using a 7500 Fast Real-Time PCR System (7500
software v2.0.6) (Applied Biosystems®) with Power SYBR
® Green PCR Master Mix (Applied
Biosystems®) following the standard program of this Real-Time PCR System. In this experiment, 5µL
of cDNA sample was combined with 15µL qRT-PCR mixture [10µL of Power SYBR® Green PCR
Master Mix, 0.5µL of 4µM primers pool (forward+reverse) (Table II.5); and 4.5µL Milli-Q
RNAse/DNAse free water] in MicroAmp® Fast Optical 96-well Reaction Plate (Applied Biosystems
®).
The expression levels were normalized to GAPDH (a housekeeping gene) and 2-ΔΔT
method was used
to analyze relative changes in gene expression.

25
Table II.5 - Primers used in qPCR. Representative table of primers sequence used in qPCR
Primer Name Forward Sequence (5'3') Reverse Sequence (5'3')
SRF GCC GCG TGA AGA TCA AGA TG GTC AGC GTG GAC AGC TCA TA
MKL1 CAG AAC AGC ACC TCA CTG ACT G CAG GCA GTG ATC GCA ACT TCA G
MKL2 CAG AGT GTC GTC TCG CAG TT GTC TGA GGT ACA GTT GGG GC
FLNA CAA CAA GTT CAC TGT GGA GAC CA TGT AGG TGC CAG CCT CAT AAG G
ACTR3 CTG TAG ATG CCC GGC TGA AA TAT CGC TGC ATG TGG TGT GT
TPM1 ATGCCATTCTTGCCCAGGAG GGTGCGCCTATGACACTTCT
TPM2 CCA GGC GGA CAA GTA TTC CA ACT TTG CCA CAG ACC TCT CG
TPM4 GGG CCA TGA AGG ATG AGG AG AGG ATG ACC AGC TTA CGA GC
FILIP1 CAC CGA GAT GCC ATT CTT GC GCG CCG GTA GGT TTC TTT CT
LIMA1 AAA CAC AGA TGC TTC GGG CA CCA CTT GCA CTT CGG CTT TG
MICAL2 AAC AAA CGG AGA CGG AAG GG AGC TGA TTC GCC ATG GAC TT
MYH9 GGA GTA TGA TGC AAG ACC GA CGT ACG CCA GAT ACT GGA TG
MYL9 ACA TGA TTG ACC AGA ACC GTG A CCC TCC AGG TAT TCG TCT GTG
TAGLN2 ATG GGC TCT TCT CTG GGG AT TTG GTG CCC ATC TGT AAC CC
PALLD GCT AGG TGC TGA CAG TGC AA ACC ATC CAG AGG ACT CCC TAC
NEXN GAG GAG GAA CGA AAA CGC AG TGA TGC TGA TTC AGT TCC CGT A
GAPDH GTC AAG GCT GAG AAC GGG AA TGG ACT CCA CGA CGT ACT CA
Protein extraction and Western Blotting 7.
7.1. Protein lysis and sample processing
For Western blot analysis, HUVECs in 6-well plates were lysed with 100uL of RIPA buffer (50mM
Tris/HCl pH7.5, 1% NP-40,150mM NaCl, 0.5% Sodium Deoxycholate, 0.1% SDS, in H2O)
supplemented with Phosphatase and protease inhibitors cocktail (PIs) and EDTA (1:100, 10085973
Fisher Scientific). Then, using a cell scrapper, the adherent cells of the dish were detached and the
cell lysates were transferred into an ice-cold 1.5mL eppendorf tube. All steps were performed in ice.
Then, these cell lysates were centrifuged for 10min at maximum speed (4˚C) and the supernatants
were transferred into a new ice-cold 1.5mL eppendorf tube. The protein concentration of the samples
was quantified using the BCA protein assay kit (Pierce) following the instructions recommended by the
manufacturer. The Multimode microplate reader, Infinite M200 (Tecan), was used for
spectrophotometric measurement of protein with i-control™ software. Protein extract samples were
adjusted equally until 25µL and diluted in 1:10 of 2-Mercaptoethanol (M6250, Sigma-Aldrich), 1:4 of 4x
Laemmli Sample Buffer (161-0747, Bio-Rad Laboratories) and H2O until the final volume (35µL).
Samples were incubated at 70ºC in a Dry Block Thermostat (Grant Instruments, Ltd) for 10min and
spinned for 30sec to recover all the volume.

26
7.2. Protein electrophoresis and membrane transference
Equal amounts of protein were separated on a 4–15% Mini-PROTEAN® TGX™ Gels (456-1084,
BioRad) along with 5µL PageRuler Plus Prestained Protein Ladder (Thermo Scientific). Samples were
runned first for 5min at 50V and then for 1-2h at 150V, until the end of running, with 1x SDS-PAGE
running buffer (10x SDS-PAGE: 250mM Tris, 1.92M glycine, 1%SDS, pH8.3). When electrophoresis
was finished, a pretreatment of the gels in 20% ethanol (prepared in deionized water) for 10min before
membrane transference in order to improve the transfer of proteins >150 kDa. Then, the gel was
transferred to a nitrocellulose membrane (iBlot™ Transfer Stack regular/mini size, IB3010-01/-02,
Invitrogen™) with iBlot™ Dry Blotting System (Invitrogen™), program 3 for 8min. After transfer, blotted
membranes were incubated at RT during 1h in blocking buffer containing 3% BSA in Tris buffered
saline/ 0.1% Tween 20 (referred as TBS-T); TBS 10x buffer was done with 30.5g Tris (0.5M) and 45g
NaCl (1.55M) at pH7.6 in H2O. After that, membranes were incubated ON at 4ºC with primary
antibodies diluted in the blocking buffer (described in II.11, Table II.6). In the following day,
membranes were washed 3x (10min each) with TBS-T and incubated for 1h at RT with blocking buffer
containing the secondary antibodies horseradish peroxidase (HRP) Conjugated (described in II.11,
Table II.7). Upon incubation with secondary antibodies, membranes were washed 3x (10min each)
with TBS-T and protein detection was performed by enhanced chemiluminescense (ECL) with
ECL™ Western Blotting Detection Reagent (RPN2209, GE Healthcare) following the manufacturer´s
protocol. Bands were visualized in a Chemidoc equipment and relative intensities of protein bands
were analyzed using the Image Lab 5.1 software, both from Bio-Rad Laboratories. All the results were
normalized to Tubulin levels.
Scratch-wound assay 8.
The Scratch-wound assay was used during this project in order to study the morphology, as well as
the functional migration of in vitro cultured HUVECs. The wound was created by scratching a well-
plate containing a monolayer of HUVECs, using a 200uL pipette cone, followed by 30min incubation at
37˚C. Then, the culture medium was removed and replaced by fresh complete medium and HUVECs
were allowed to migrate. For immunofluorescence staining (described below in section II.9), HUVECs
were allowed to migrate during 5h, while through live imaging, the wounded area was monitored using
a Spinning Disk Confocal Microscope, Zeiss Cell Observer SD (Carl Zeiss) equipped with the ZEN 2
edition software, for 16h with photos taken every 10min. Results were analyzed using the Fiji software.
Immunofluorescence staining of cultured HUVECs in coverslips 9.
For immunostaining of cultured HUVECs, cells at passage 4 were seeded in 24-well plates with
coverslips. Coated treatment of coverslips was performed on the day of cell seeding. For coating
300µL of poly-L-lysine 0.01% solution (Sigma-Aldrich) was added to each coverslip following by 15min
incubation at 37˚C. After this, the coverslips were rinsed twice in PBS and once in sterile H2O. Finally,

27
300µL of gelatin solution 0.2% (Sigma-Aldrich) dissolved in sterile H2O were added followed by 30min
incubation at 37˚C.
After the scratch-wound assay (described in II.8), HUVECs were fixed with 300µL per well of 1%
paraformaldehyde (PFA) supplemented with equal concentration of 1M MgCl2 and 1M CaCl2
(1µL:2mL) in PBS for 30min at RT with gentle agitation. Cells were then washed with PBS to remove
any remaining PFA and the immunostaining protocol was conducted.
All steps of immunostaining were performed at RT with gentle agitation. First, PBS was removed
and HUVECs were blocked and permeabilized 30min with 200µL per well with blocking solution (3%
Bovine Serum Albumin (BSA, Nzytech, Lda) in PBS-T (PBS/0.1% Triton™ X-100 (Sigma-Aldrich)).
Afterwards cells were incubated with the primary antibodies diluted in blocking solution (described in
II.11, Table II.6) for 2h, followed by 3 washes of 15min with PBS-T. After the washes, cells were
incubated with the secondary antibodies (described in II.11, Table II.7) for 1h and then washed again
as before. After this, 4',6-Diamidino-2-Phenylindole, Dihydrochloride (DAPI, D1306, Molecular
Probes™ by life technology) treatment (1:1000, diluted in PBS-T) was performed (200 µL per well ) for
5min.
Whole mount of coverslips was performed using Mowiol/DABCO (Sigma-Aldrich). High-resolution
three-dimensional rendering of coverslips was acquired with two microscopes, the confocal Laser
Point-Scanning Microscope 710 (Zeiss) equipped with the ZEN black 2012 edition software and the
motorized inverted widefield fluorescence microscope, Zeiss Axiovert 200M (Carl Zeiss), equipped
with the Metamorph software v7.8.0.0. Results were analyzed using the Fiji and Imaris 8.0 software.
Eyes extraction and retina isolation for immunoflorescence 10.
Pups were sacrificed by decapitation and eyes were quickly collected using forceps and scissors.
Eyes were fixed in a 2% PFA solution diluted in PBS for 5h at 4°C. After fixation, the eyes were
washed with PBS to remove any remaining PFA and the retinal dissection protocol was performed.
Retinal dissection was done in a culture glass dish with PBS using a binocular dissecting
microscope (Carl Zeiss). Using the forceps, an incision between the cornea and the iris was done and
the cornea, iris, sclera, optic nerve, the lens, the vitreous humor and the pigmented retina layer were
separated and removed. Finally, the hyaloid vessels were carefully detached using rotating fine
movements. We then performed the 4 cuts using micro-scissors in order to separate the retina into
four quadrants (Figure II.1).
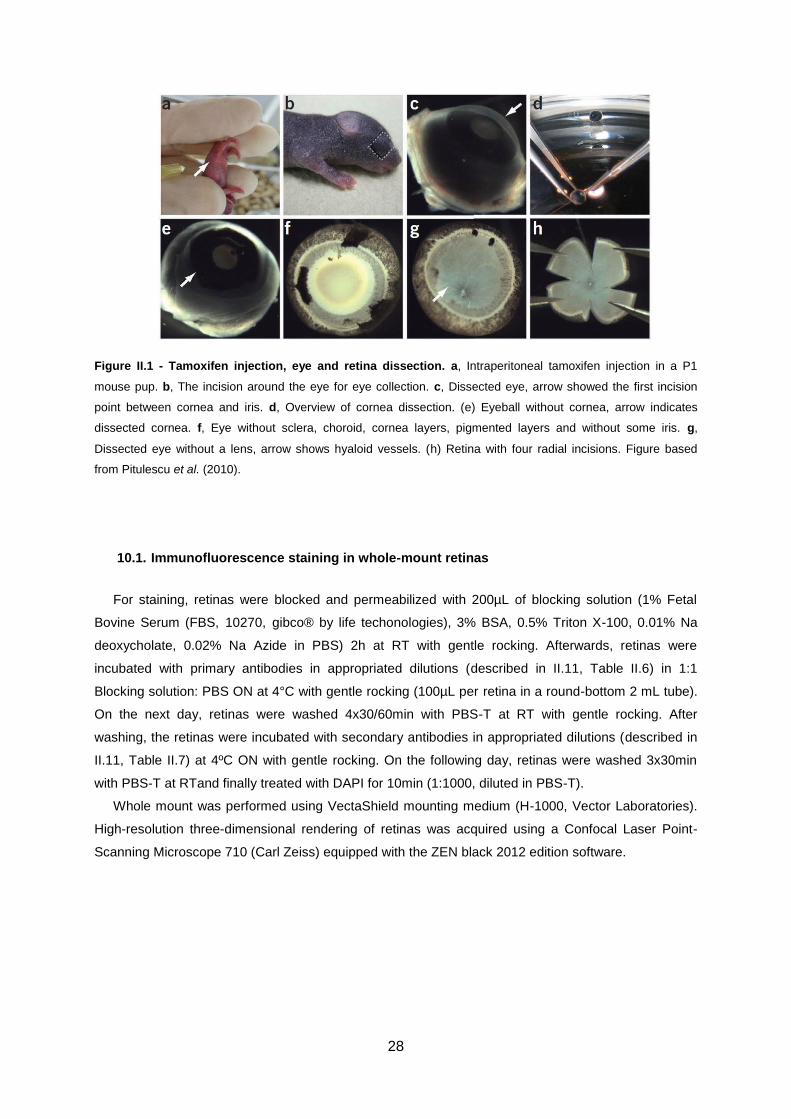
28
Figure II.1 - Tamoxifen injection, eye and retina dissection. a, Intraperitoneal tamoxifen injection in a P1
mouse pup. b, The incision around the eye for eye collection. c, Dissected eye, arrow showed the first incision
point between cornea and iris. d, Overview of cornea dissection. (e) Eyeball without cornea, arrow indicates
dissected cornea. f, Eye without sclera, choroid, cornea layers, pigmented layers and without some iris. g,
Dissected eye without a lens, arrow shows hyaloid vessels. (h) Retina with four radial incisions. Figure based
from Pitulescu et al. (2010).
10.1. Immunofluorescence staining in whole-mount retinas
For staining, retinas were blocked and permeabilized with 200µL of blocking solution (1% Fetal
Bovine Serum (FBS, 10270, gibco® by life techonologies), 3% BSA, 0.5% Triton X-100, 0.01% Na
deoxycholate, 0.02% Na Azide in PBS) 2h at RT with gentle rocking. Afterwards, retinas were
incubated with primary antibodies in appropriated dilutions (described in II.11, Table II.6) in 1:1
Blocking solution: PBS ON at 4°C with gentle rocking (100µL per retina in a round-bottom 2 mL tube).
On the next day, retinas were washed 4x30/60min with PBS-T at RT with gentle rocking. After
washing, the retinas were incubated with secondary antibodies in appropriated dilutions (described in
II.11, Table II.7) at 4ºC ON with gentle rocking. On the following day, retinas were washed 3x30min
with PBS-T at RTand finally treated with DAPI for 10min (1:1000, diluted in PBS-T).
Whole mount was performed using VectaShield mounting medium (H-1000, Vector Laboratories).
High-resolution three-dimensional rendering of retinas was acquired using a Confocal Laser Point-
Scanning Microscope 710 (Carl Zeiss) equipped with the ZEN black 2012 edition software.
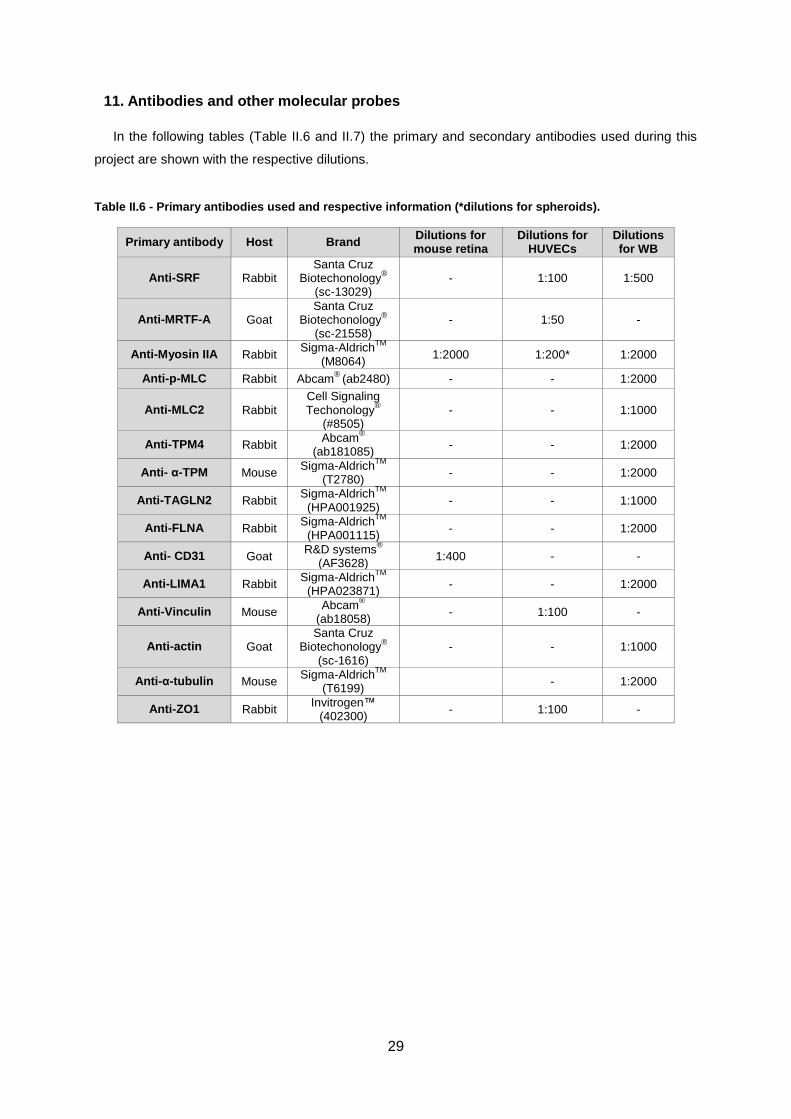
29
Antibodies and other molecular probes 11.
In the following tables (Table II.6 and II.7) the primary and secondary antibodies used during this
project are shown with the respective dilutions.
Table II.6 - Primary antibodies used and respective information (*dilutions for spheroids).
Primary antibody Host Brand Dilutions for mouse retina
Dilutions for HUVECs
Dilutions for WB
Anti-SRF Rabbit Santa Cruz
Biotechonology®
(sc-13029) - 1:100 1:500
Anti-MRTF-A Goat Santa Cruz
Biotechonology®
(sc-21558) - 1:50 -
Anti-Myosin IIA Rabbit Sigma-Aldrich
TM
(M8064) 1:2000 1:200* 1:2000
Anti-p-MLC Rabbit Abcam®
(ab2480) - - 1:2000
Anti-MLC2 Rabbit Cell Signaling Techonology
®
(#8505) - - 1:1000
Anti-TPM4 Rabbit Abcam
®
(ab181085) - - 1:2000
Anti- α-TPM Mouse Sigma-Aldrich
TM
(T2780) - - 1:2000
Anti-TAGLN2 Rabbit Sigma-Aldrich
TM
(HPA001925) - - 1:1000
Anti-FLNA Rabbit Sigma-Aldrich
TM
(HPA001115) - - 1:2000
Anti- CD31 Goat R&D systems
®
(AF3628) 1:400 - -
Anti-LIMA1 Rabbit Sigma-Aldrich
TM
(HPA023871) - - 1:2000
Anti-Vinculin Mouse Abcam
®
(ab18058) - 1:100 -
Anti-actin Goat Santa Cruz
Biotechonology®
(sc-1616) - - 1:1000
Anti-α-tubulin Mouse Sigma-Aldrich
TM
(T6199) - 1:2000
Anti-ZO1 Rabbit Invitrogen™
(402300) - 1:100 -

30
Table II.7 - Secondary antibodies and Phalloidin used and respective information (*dilutions for spheroids).
Secondary antibody
Host Brand Dilutions for mouse retina
Dilutions for HUVECs
Dilutions for WB
Alexa Fluor 488 Phalloidin
- Life
TechnologiesTM
(A12379)
- 1:200* -
Alexa Fluor 647 Phalloidin
- Life
TechnologiesTM
(A22287)
- 1:50 -
Anti-Mouse HRP Conjugate
Goat Life
TechnologiesTM
(A24524)
- - 1:5000
Anti-Goat HRP Conjugate
Donkey Life
TechnologiesTM
(A15999)
- - 1:5000
Anti-Rabbit HRP Conjugate
Goat Life
TechnologiesTM
(G-21234)
- - 1:5000
Alexa Fluor 647 Anti-Goat
Donkey Life
TechnologiesTM
(A21447) 1:400 - -
Alexa Fluor 647 Anti-Rabbit
Donkey Life
TechnologiesTM
(A31573) - 1:400* -
Alexa Fluor 488 Anti-Rabbit
Donkey Life
TechnologiesTM
(A21206)
- 1:400 -
Alexa Fluor 555 Anti-Rabbit
Donkey Life
TechnologiesTM
(A31572) 1:400 - -
Alexa Fluor 568 Anti-Mouse
Goat Life
TechnologiesTM
(A21124) - 1:400 -
Spheroids sprouting assay 12.
12.1. Methyl cellulose stock solution
To prepare the methyl cellulose stock (methocell), we used the Methyl cellulose, viscosity 15cp
[BioReagent, suitable for cell culture (M7027, Sigma-AldrichTM
)]. Methocell must be prepared with
caution in order to avoid methyl cellulose debris and, consequently, its low concentration. 1.2g of pure
powder was autoclaved in a 500-ml flask containing a clean magnetic stirrer. After, the powder was
dissolved in 50mL DMEM 1x medium (61965-026, gibco® by Life Tecnologies, compound with 10%
FBS and 1.48% Sodium pyruvate 100mM (11360-039, gibco® by Life Tecnologies)) at 60 °C for 20
min (using the magnetic stirrer). Then, 50 ml DMEM 1x medium (RT) was added to a final volume of
100mL. The solution was mixed and aliquoted and methocell was cleared by centrifugation (5,000xg,
2 h, RT) and the supernatant used for the spheroid culture.
12.2. Sprouting angiogenesis in vitro
In order to evaluate cell migration and invasion, the collagen matrix-embedded HUVEC spheroid
model (3D model) was implemented in the lab, based in the work of Augustin (Augustin, 2004). At day
0, siRNA transfected confluent monolayers of HUVECs were trypsinized and counted for 150 000

31
cell/mL. These cells were ressuspended in the corresponding complete culture medium containing
20% methyl cellulose stock solution (see II.12.1), in order to generate size-defined EC spheroids.
Spheroids were obtained by spontaneous cell aggregation in hanging drops (20 μL), incubated ON at
37˚C and 5% CO2. At day 1, spheroids were collected with DMEM 1x and centrifuged at 500xg during
3min. Then, the pellet of aggregates was ressuspended in collagen I, Rat Tail 3mg/mL (A10483-01,
gibco® by Life Tecnologies) mixed with some components: NaOH 0.1M; MEM 10x, no glutamine
(11430-030, gibco® by Life Tecnologies); HEPES buffer solution 1M (15630-056, gibco
® by Life
Tecnologies); Sodium Bicarbonate solution 7.5% (25080-060, gibco® by Life Tecnologies); and SFM
(described in Table II.8), to obtain a 2mg/mL of final concentration of collagen I. These components
ensure the neutralization and the right consistence of this solution, creating an optimal environment for
EC spheroids. This solution was equilibrated with 1M NaOH until pH7.4. The ressupended spheroids
were placed in a 24 well-plate, where the wells around were filled with H2O to avoid dehydration. For
collagen solution solidification we incubated the plate at 37˚C and 5% CO2 during 1h. Afterwards
600uL of complete culture medium was added. 24-48h after spheroids were fixed with 4% PFA
solution diluted in PBS during 30min with gentle agitation.
Table II.8 - Collagen I solution for sprouting angiogenesis assay. Representative table of components and
volumes used in collagen I solution preparation. The represented volumes in table are related with each well (24
well-plate) and condition.
Components Volume per condition
NaOH 0.1M 41.7µL MEM 10x 41.7µL HEPES 8.3µL
Sodium Bicarbonate 7.5% 6.5µL SFM 68.5µL
Collagen I (3mg/mL) 333.3µL
Total volume 500µL/per well
Figure II.2 - Scheme of generation of spheroids. Hanging droplets of transfected HUVECs were performed and
then cultured for 24-48h in 3D collagen I Matrix. Figure based from Jakobsson et al. (2010).

32
12.3. Immunofluorescence staining of Spheroids
In order to immunostaining the spheroids, they were removed from the collagen I matrix using the
bistoury and spatula and placed in a culture glass dish with PBS. Then, in a binocular dissecting
microscope (Carl Zeiss), using forceps and scissors the excess of collagen matrix around the spheroid
was carefully removed. Finally, the immunofluorescence staining was performed as in whole-mount
retinas (see details in section II.10.1), but with double volumes.
Statistical analysis 13.
The statistical analysis was done by one-way Analysis of Variance (ANOVA) using GraphPad Prism 6.
We considered values below p<0.05 as statistically significant (*, p<0.05; **, p<0.01; ***, p<0.001, ****,
p<0.0001).

33
III. RESULTS
Selection of candidate genes downstream of the MRTF/SRF pathway 1.
1.1. Transcriptomic analysis of endothelial-specific MRTF/SRF-dependent genes
The MRTF-SRF pathway has been characterized as having an important role during sprouting
angiogenesis. Claudio Franco’s lab performed previously an unbiased Affymetrix microarray-based
characterization of the MRTF/SRF-transcriptome in HUVECs. The aim was to discover which genes
downstream of SRF are important for tip cell function. This approach was performed using specific
siRNAs to knockdown separately SRF and MRTFs in HUVECs. Moreover, cells in each condition were
either unstimulated or stimulated for 30min with 50ng/mL of VEGF-A. The Venn diagram (Figure III.1)
highlights the genes downregulated when compared to control samples for each specific category.
This approach identified a core of genes (113) significantly downregulated in the four different
conditions. Gene Ontology analysis demonstrated that the selected genes are closely linked to actin
cytoskeleton processes (Figure III.2).
Figure III.1 - Venn Diagram for downstream of the MRTF/SRF signaling. Downregulated genes in different
conditions when compared to the transcriptome profile of HUVEC treated with siRNA against SRF or MRTFs and
control siRNA under equivalent treatments. Selected genes correspond to genes downregulated in 4 conditions.
Figure III.2 - Gene Ontology analysis for the 113 selected genes. The most representative processes in which
selected genes are involved relate to regulation of actin cytoskeleton dynamics and cell migration processes.
In this context, the first goal of my project was to identify specific genes of interest downstream of
SRF from the 113 core of candidate genes previously identified. In order to restrict our candidate gene
pool, we selected the most important genes following the specific criteria (at least 3 out of 4):
(1) The germline knockout (KO) of the gene of interest should be lethal or not reported; and
endothelial-specific KO was not yet reported.

34
(2) Genes should have been previously linked to cell migration or actin cytoskeleton
regulation;
(3) The promoter region of the gene of interest should contain SRF-binding sites identified in
the ENCODE project (ENCyclopedia Of DNA Elements);
(4) The RNA or protein of the gene of interest should be expressed in endothelial cells and
previously described at the Euroexpress (a transcriptome atlas database for the mouse
embryo) and Protein Atlas Database.
As a result, we selected a subset of 13 downstream target genes (described in Table III.1).
Table III.1 - Selected candidate genes. Representative table of candidate genes selected in this study and their
main functions.
Name/Gene ID (from NCBI)
Official Full Name (from NCBI)
Main functions of encoded protein
ACTR3
(Gene ID: 10096)
ARP3 actin-related protein 3 homolog
(yeast)
Specific function has not yet been determined. However, the protein is known to be a major constituent of the ARP2/3 complex (from NCBI).
FLNA
(Gene ID: 2316) filamin A, alpha
Actin-binding protein involved in cytoskeleton remodeling affecting cell shape and migration (from NCBI).
LIMA1
(Gene ID: 51474) LIM domain and actin
binding 1
Cytoskeleton-associated protein that inhibits actin filament depolymerization and cross-links filaments in bundles (from NCBI).
MICAL2
(Gene ID: 9645)
microtubule associated monooxygenase, calponin and LIM
domain containing 2
Nuclear monooxygenase that promotes depolymerization of F-actin regulating of the SRF signalling pathway (SRF:MKL1/MRTF-A-dependent gene transcription) (from UniProtKB/Swiss-Prot)
MYH9
(Gene ID: 4627) myosin, heavy chain 9,
non-muscle Conventional non-muscle myosin involved in cytokinesis, cell motility and maintenance of cell shape (from NCBI).
MYL9
(Gene ID: 10398) myosin, light chain 9,
regulatory
Myosin light chain regulates muscle contraction by modulating the ATPase activity of myosin heavy chain heads (from NCBI).
TAGLN2
(Gene ID: 8407) transgelin 2
The specific function has not yet been determined, although it is thought to be a tumor suppressor (from NCBI).
TPM1
(Gene ID: 7168) tropomyosin 1 (alpha)
Binds to actin filaments in muscle and non-muscle cells. In non-muscle cells is implicated in stabilizing cytoskeleton actin filaments (from UniProtKB/Swiss-Prot).
TPM2
(Gene ID: 7169) tropomyosin 2 (beta)
This gene encodes beta-tropomyosin, a member of the actin filament binding protein family and have the same main functions of TPM1 (From NCBI)
TPM4
(Gene ID: 7171) tropomyosin 4
This protein have the same main functions of TPM1 (From NCBI)
FILIP1
(Gene ID: 27145) filamin A interacting
protein 1
This protein acts through a filamin-A/F-actin axis. Controls the start of neocortical cell migration. (from UniProtKB/Swiss-Prot).
NEXN
(Gene ID: 91624) nexilin (F actin binding
protein) Filamentous actin-binding protein that is involved in cell adhesion and migration (from NCBI).
PALLD
(Gene ID: 23022) palladin, cytoskeletal
associated protein
Cytoskeletal protein that is required for cytoskeleton organization and it is involved in the control of cell shape, adhesion, and contraction (from NCBI).

35
1.2. Validation of MRTF/SRF-dependent candidate genes
To confirm if the selected genes were indeed downstream of the SRF pathway, we extracted RNA
and protein from HUVECs knocked down for SRF or MRTF-A/B (MRTFs) and analyzed the expression
of the selected candidates by qPCR (Figure III.3) and by WB (Figure III.4). The combined knockdown
of both MRTF-A and MRTF-B in HUVECs led to decreased expression of ACTR3, FLNA, LIMA1,
MICAL2, MYH9, MYL9, TAGLN2, TPM1, TPM2, and TPM4 (Figure III.3). Similar to the results
observed in SRF knockdown experiments. However, no significant change in FILIP1, NEXN and
PALLD was observed in both settings. This analysis allowed us to exclude these 3 genes and
confirmed the specific downregulation of the other 10 candidates (Figures III.3 and III.4). So, from this
initial analysis we were able to select a core of 10 genes that filled all the chosen criteria. We were not
able to perform WB analysis for some of the genes because the purchased antibodies did not give
consistent results.
AC
TR
3
FIL
IP1
FL
NA
LIM
A1
MIC
AL
2
MY
H9
MY
L9
NE
XN
PA
LL
D
TA
GL
N2
TP
M1
TP
M2
TP
M4
0
5 0
1 0 0
1 5 0
2 0 0
2 5 0
No
rm
ali
ze
d m
RN
A e
xp
re
ss
ion
le
ve
ls t
o s
ico
ntr
ol
sa
mp
les
s iC o n tr o l le v e l
s iS R F
s iM R T F s
Figure III.3 - qPCR analysis of selected candidate genes. Analysis of the expression levels of the selected
genes confirming a significant downregulation of 10 out of 13 genes (FILIP1, NEXN and PALLD did not showed a
significant downregulation). Line points show the control levels of siControl samples. GAPDH was used as
housekeeping gene for control.

36
Figure III.4 - Western Blot analysis of some the selected candidate genes. Analysis of the protein expression
levels of some candidates [FLNA, LIMA1, Tropomyosin-α (Tropo-α, also known TPM1), TAGLN2, MYH9 and
TPM4] confirming a downregulation. Tubulin (Tub) was used as loading control in WB.
Functional validation of positive candidate genes 2.
2.1. Setting-up a siRNA-based functional screen
SRF regulates the expression of several proteins, including actin regulatory proteins involved in EC
migration and invasion (Franco et al., 2013), thus we were expecting that some of the selected
candidate genes would affect endothelial cell behavior. In order to validate the functionality of
candidate genes in in vitro cell migration assays, we purchased 3 specific siRNAs for each selected
SRF-target gene. MYL9 was previously demonstrated that is a MRTF/SRF-dependent target gene and
that it was involved in endothelial cell migration. However, it did not phenocopy SRF-dependent tip cell
filopodia deficiency (Franco et al., 2013). Thus, we decided to focus our attention in the study of the 9
remaining candidate genes.
We then confirmed the efficiency of each single siRNA by qPCR together with cell viability tests.
According to these two analyses and for each candidate gene, one effective siRNA was carefully
selected (siMYH9-3, siFLNA-3, siTPM1-2, siTPM2-2, siTPM4-1, siTAGLN2-3, siLIMA1-2, siACTR3-1,
siMICAL2-1) taking into account the knockdown efficiency (Figure III.5) and also the cell viability after
HUVEC transfection (evaluation of dead cells vs. viable cells) (Table III.2).

37
Table III.2 - Viability tests in cultured HUVECs. Representative table of HUVECs mortality, after transfection
(24-48h), with different siRNA [3 for each candidate gene (siRNA-1, -2 and -3)]. The symbol (-) represents few cell
death events; other degrees of cell death are represented, from + to ++++ (a lot of cell death events).
siRNAs for candidate
genes
siM
YH
9-1
siM
YH
9-2
siM
YH
9-3
siF
LN
A-1
siF
LN
A-2
siF
LN
A-3
siT
PM
1-1
siT
PM
1-2
siT
PM
1-3
siT
PM
2-1
siT
PM
2-2
siT
PM
2-3
siT
PM
4-1
siT
PM
4-2
siT
PM
4-3
siT
AG
LN
2-1
siT
AG
LN
2-2
siT
AG
LN
2-3
siL
IMA
1-1
siL
IMA
1-2
siL
IMA
1-3
siA
CT
R3
-1
siA
CT
R3
-2
siA
CT
R3
-3
siM
ICA
L2
-1
siM
ICA
L2
-2
siM
ICA
L2
-3
Mortality
+
+
+ - +
+ - + - - -
++
+
++
++
- + - - - +
++
++
+
- +
+
+
++
+
No
rm
ali
ze
d m
RN
A e
xp
re
ss
ion
le
ve
ls t
o s
ico
ntr
ol
sa
mp
les
siM
YH
9-1
siM
YH
9-2
siM
YH
9-3
siF
LN
A-1
siF
LN
A-2
siF
LN
A-3
siT
PM
1-1
siT
PM
1-2
siT
PM
1-3
siT
PM
2-1
siT
PM
2-2
siT
PM
2-3
siT
PM
4-1
siT
PM
4-2
siT
PM
4-3
siT
AG
LN
2-1
siT
AG
LN
2-2
siT
AG
LN
2-3
siL
IMA
1-1
siL
IMA
1-2
siL
IMA
1-3
siA
CT
R3-1
siA
CT
R3-2
siA
CT
R3-3
siM
ICA
L2-1
siM
ICA
L2-2
siM
ICA
L2-3
0
1 0 0
2 0 0
3 0 0
s iC o n tro l le v e l
Figure III.5 - Analyze of the efficiency of each siRNA by qPCR. Analysis of the expression levels of selected
genes after transfection with each siRNA for each candidate gene. We managed to confirm the downregulation
for all genes with at least one siRNA. Line points show the control levels of siControl samples. GAPDH was used
as housekeeping gene for control.
Our analysis led to the exclusion of LIMA1 and TPM4 because of the low cell viability after siRNA
transfection in each of the 3 different siRNAs. MICAL2 was also excluded because of a recent study
from Lundquist and collegues showing that MICAL2 regulates SRF/MRTF-A-dependent gene
transcription, with a redox modification of nuclear actin (Lundquist et al., 2014), thus affecting
SRF/MRTF output rather than regulating actin dynamics directly. Therefore, we selected 6 genes
(ACTR3, FLNA, MYH9, TAGLN2, TPM1, and TPM2) for further analysis using different in vitro assays.

38
2.2. Scratch-wound cell migration assay
To evaluate the impact of each gene in cell migration, we used the in vitro scratch-wound assay. In
this assay, a wound is made in a confluent HUVEC monolayer and the closure is measured over time.
Scratch-wound assay allowed us to measure cell migration speed, invasion capacity and actin
cytoskeleton structure content.
First, we performed the scratch-wound assay and capture images at the beginning and at the end
of cell migration (16h), just before the endothelial cells closed the wound. By quantification the total
migration length in bulk endothelial cell surfaces, we determined a rough measure for endothelial cell
migration. These results are shown in Figure III.6, where we observed that when knocked down,
several genes significantly affect the capacity of endothelial cells to close the wound (decrease of
migration capacity). MYH9, ACTR3 and TAGLN2 knockdowns caused a significant strong reduction in
overall closure of wound. The impairment in cell migration was similar in magnitude to the observed
effect of SRF or MRTF-A/B knockdown (Figure III.6). TPM1 knockdown also affected endothelial cell
migration, but with less intensity than the previously mentioned genes. TPM2 and FLNA knockdowns
did not significantly affect endothelial migration (Figure III.6).
Figure III.6 - Analysis of cell migration in the scratch-wound assay. The scratch was performed after
overnight starvation. Closured of the wound was measured 16 hours after. *, p<0.05; **, p<0.01; ***, p<0.001.
In order to get further insights on the migratory behavior of HUVECs, we performed live-imaging
during 16h (every 10min) and quantified total distance, average and maximum speeds and
straightness of the migratory path (Figure III.7 and data not shown). Together, these results showed
that MYH9 and ACTR3 knockdowns lead to decrease of endothelial cell migration and speed (with a
significant p-value <0.01 or p-value <0.001). Therefore, MYH9 and ACTR3 appear to be the most
likely genes downstream of SRF signaling that regulates endothelial cell migration.
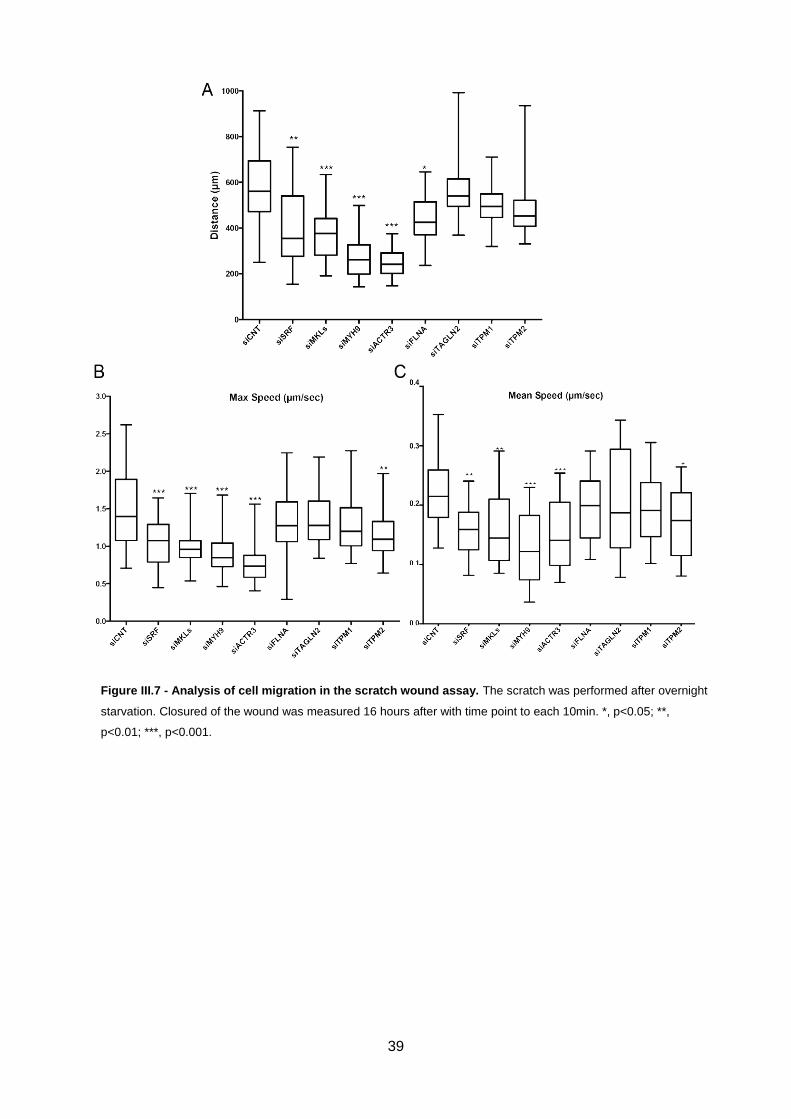
39
Figure III.7 - Analysis of cell migration in the scratch wound assay. The scratch was performed after overnight
starvation. Closured of the wound was measured 16 hours after with time point to each 10min. *, p<0.05; **,
p<0.01; ***, p<0.001.

40
2.3. Cell Cytoskeleton architecture
MRTF/SRF pathway is a main regulator of the cellular actin cytoskeleton. We therefore next
analyzed the cytoarchitecture of endothelial cells when depleted for each of 6 specific candidate
genes and compared to control and SRF or MRTFs-depleted HUVECs. We quantified the levels of
actin filaments, focal adhesions and cellular junctions. To do so, we labeled HUVECs in vitro with
antibodies against vinculin - a focal adhesion molecule; zona occludens protein 1 (ZO1) - a tight
junctional molecule; together with phalloidin – a probe that binds to filamentous actin (F-actin). We
quantified the total intensity for each staining and analyzed some morphological parameters, such as
the morphology of actin filaments, the shape of cells and the filamentous actin content in HUVECs
treated with different siRNAs (Figure III.8 and Figure III.9). In MYH9 depleted cells we observed a
decrease in immunofluorescence intensities of vinculin and phalloidin (p<0.01 and p<0.001,
respectively), which means that MYH9 is not only regulating the F-actin content, but also the focal
adhesions (Figure III.9). We also observed a similar decrease in the content of actin filaments and in
the intensity of vinculin staining in ACTR3 depleted cells (p<0.001) (Figure III.8 and Figure III.9).
Decreased expression of the remaining genes didn’t affect significantly the levels of F-actin content
and organization, and vinculin intensity.
In the case of MYH9-depleted cells, we could see that cells presented a rounded shape and an
altered organization of actin filaments, i.e., absence of transversal actin cables (Figure III.8). siACTR3
treated cells showed a more spindle shape, looking more siControl than MRTF or SRF-depleted cells.
The other genes didn’t significant affected cell shape when compared to siControl-transfected cells.
Thus, phenotypically, MYH9 depleted cells resemble SRF or MRTFs knocked down cells,
morphologically and structurally. Therefore, we decided to focus our attention in MYH9 as the main
candidate gene, since its absence resulted in a phenotype more closely related to SRF deficient
HUVECs.

41
A
B
Figure III.8 - Analysis of cell migration in the scratch wound assay. A-B, Cells were stained for phalloidin (A,
green; B, grey), vinculin (red), ZO1 (blue) and DAPI (upper panel). siMYH9 siACTR3 conditions exhibit defects in
actin polymerization rate.
B
A
20µm
20µm
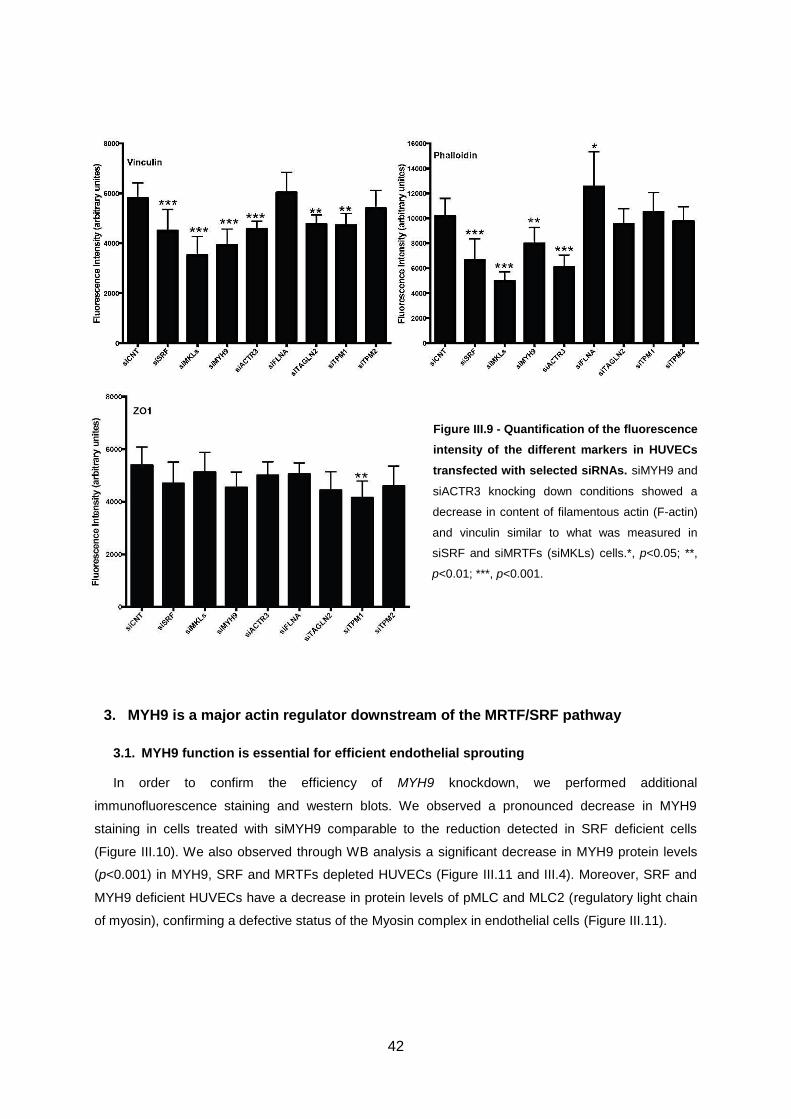
42
Figure III.9 - Quantification of the fluorescence
intensity of the different markers in HUVECs
transfected with selected siRNAs. siMYH9 and
siACTR3 knocking down conditions showed a
decrease in content of filamentous actin (F-actin)
and vinculin similar to what was measured in
siSRF and siMRTFs (siMKLs) cells.*, p<0.05; **,
p<0.01; ***, p<0.001.
MYH9 is a major actin regulator downstream of the MRTF/SRF pathway 3.
3.1. MYH9 function is essential for efficient endothelial sprouting
In order to confirm the efficiency of MYH9 knockdown, we performed additional
immunofluorescence staining and western blots. We observed a pronounced decrease in MYH9
staining in cells treated with siMYH9 comparable to the reduction detected in SRF deficient cells
(Figure III.10). We also observed through WB analysis a significant decrease in MYH9 protein levels
(p<0.001) in MYH9, SRF and MRTFs depleted HUVECs (Figure III.11 and III.4). Moreover, SRF and
MYH9 deficient HUVECs have a decrease in protein levels of pMLC and MLC2 (regulatory light chain
of myosin), confirming a defective status of the Myosin complex in endothelial cells (Figure III.11).
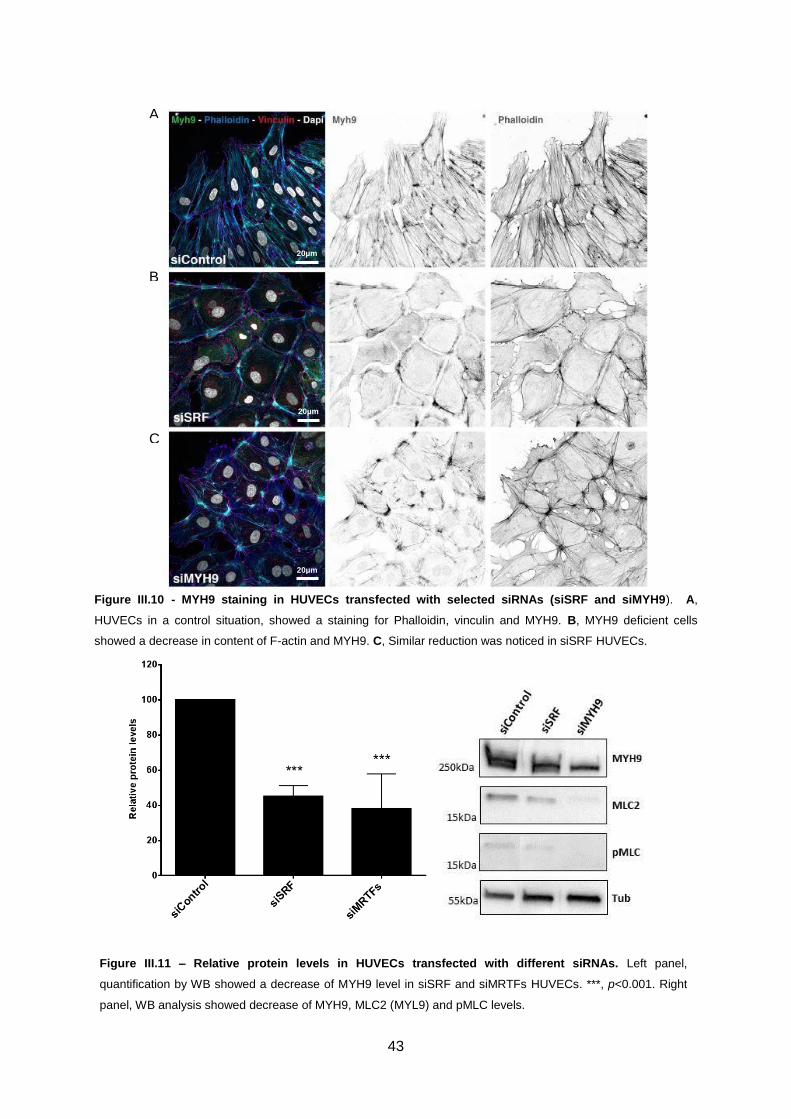
43
C
B
A
Figure III.10 - MYH9 staining in HUVECs transfected with selected siRNAs (siSRF and siMYH9). A,
HUVECs in a control situation, showed a staining for Phalloidin, vinculin and MYH9. B, MYH9 deficient cells
showed a decrease in content of F-actin and MYH9. C, Similar reduction was noticed in siSRF HUVECs.
Figure III.11 – Relative protein levels in HUVECs transfected with different siRNAs. Left panel,
quantification by WB showed a decrease of MYH9 level in siSRF and siMRTFs HUVECs. ***, p<0.001. Right
panel, WB analysis showed decrease of MYH9, MLC2 (MYL9) and pMLC levels.
20µm
20µm
20µm
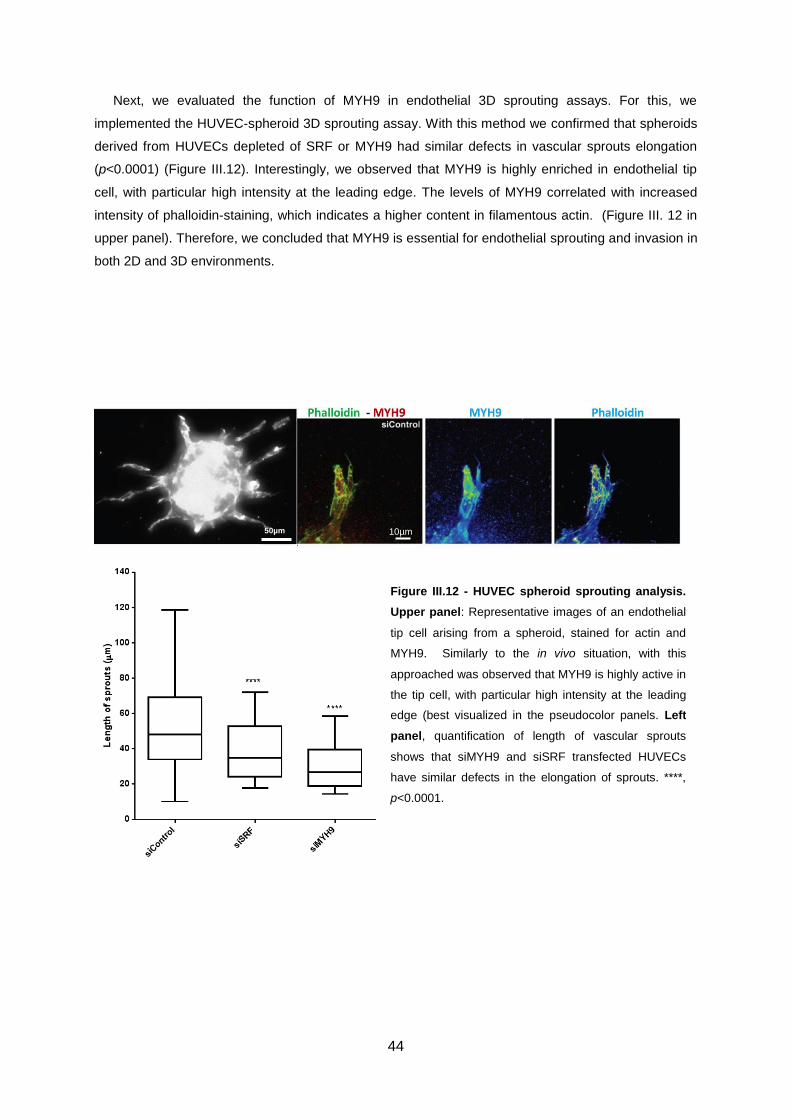
44
Next, we evaluated the function of MYH9 in endothelial 3D sprouting assays. For this, we
implemented the HUVEC-spheroid 3D sprouting assay. With this method we confirmed that spheroids
derived from HUVECs depleted of SRF or MYH9 had similar defects in vascular sprouts elongation
(p<0.0001) (Figure III.12). Interestingly, we observed that MYH9 is highly enriched in endothelial tip
cell, with particular high intensity at the leading edge. The levels of MYH9 correlated with increased
intensity of phalloidin-staining, which indicates a higher content in filamentous actin. (Figure III. 12 in
upper panel). Therefore, we concluded that MYH9 is essential for endothelial sprouting and invasion in
both 2D and 3D environments.
Figure III.12 - HUVEC spheroid sprouting analysis.
Upper panel: Representative images of an endothelial
tip cell arising from a spheroid, stained for actin and
MYH9. Similarly to the in vivo situation, with this
approached was observed that MYH9 is highly active in
the tip cell, with particular high intensity at the leading
edge (best visualized in the pseudocolor panels. Left
panel, quantification of length of vascular sprouts
shows that siMYH9 and siSRF transfected HUVECs
have similar defects in the elongation of sprouts. ****,
p<0.0001.
50µm 10µm

45
3.2. Re-expression of MYH9 rescues SRF-deficient phenotype
To further validate that MYH9 plays an essential function downstream of SRF signaling, we sought
to rescue the phenotype in SRF-depleted HUVECs by forced expression of MYH9. We overexpressed
a full-length version of MYH9 tagged with GFP in the N-terminal (MYH9-GFP) in SRF depleted
HUVECs to assess whether MYH9 could be sufficient to rescue the effects induced by the absence of
SRF. Through immunofluorescence analysis we demonstrate that MYH9 rescued partially the actin
polymerization defects induced by the absence of SRF (p<0.05). Thus, this result reinforces the idea
that MYH9 plays a central role in SRF-dependent transcriptome (Figure III.13).
Figure III.13 - Overexpression of MYH9-GFP compensates SRF-deficiency. HUVECs overexpressing MYH9-
GFP (green cells) and then labelled for phalloidin (red cells) and dapi (nuclei), left panel. Right panel shows the
quantification of the level of phalloidin staining in cells targeted for siControl, siSRF with or without transfection
with p-CAG-GFP-MYH9 plasmid. *, p<0.05; **, p<0.01.
Phalloidin - MYH9.GFP - DAPI
20µm

46
3.3. MYH9 is enriched in endothelial tip cells in vivo.
Finally, we analyzed by immunofluorescence the location of MYH9 in the retinal vasculature of
LifeAct-GFP mouse lines. It is important to note that the LifeAct-GFP transgene is highly expressed in
retinal ECs, allowing visualization of the actin cytoskeleton specifically in the vasculature (Fraccaroli et
al., 2012). Interestingly in this analysis, we observed that MYH9 is highly expressed by endothelial tip
cells and that its expression is specifically located at the base of endothelial filopodia in these cells
(Figure III.14). These results suggest a novel feature for MYH9.
Thus, all data suggest that MYH9 has an important role in SRF signaling, in cell migration,
invasion, cytoskeleton dynamics and has probably an important link to tip cell filopodia.
Figure III.14 - Retinal endothelial cells analysis. Representative image of an endothelial tip cell from a LifeAct-
GFP mouse line stained for the endothelial cell marker CD31 (blue or grey), labeling the endothelial cells and
MYH9 (red, grey or pseudocolored). Actin filaments can be visualized in green or grey. Strongly intensity was
observed in MYH9 label at the base of endothelial filopodia (arrows).
10µm

47
IV. DISCUSSION
During angiogenesis, endothelial cells need to become motile in order to invade avascular tissues.
These processes require the presence of SRF in endothelial cells, a transcription factor highly
expressed in endothelial cells at the sprouting front, that has been previously showed to be involved in
tip cell invasion towards VEGF-A gradient (Franco et al., 2013). SRF has been suggested as a
regulator of many features of actin cytoskeleton biology related to cell migration, together with MRTFs
cofactors (Franco et al., 2013; Miano et al., 2007). In this sense, it is important to understand which
cytoskeletal proteins are involved in the regulation of endothelial tip cell invasion, downstream of SRF
signaling. As such, in the present work, we used siRNA technology in order to identify and
characterize the function of specific SRF-downstream genes involved in endothelial cell migration and
invasion. Our approach was focused on the evaluation of candidate genes shortlisted from a pool of
candidates previously obtained by an unbiased microarray analysis.
Our results showed that knockdown of MYH9 and ACTR3 lead to a decrease in cell migration
similar to the one observed in SRF and MRTFs depleted HUVECs. Endothelial cell migration is
essential to angiogenesis in the context of physiological and pathological angiogenesis (Michaelis,
2014; Lamalice et al., 2007), these results strongly suggest that these two genes might be important
for sprouting angiogenesis. ACTR3 (also known as ARP3) encodes actin-related protein 3 that is
known to be a component of the ARP2/3 complex (Nürnberg et al., 2011), an actin nucleator that has
been implicated in de novo actin polymerization and branching of the actin network (Blanchoin et al.,
2014; Pollard and Cooper, 2009). MYH9 (non-muscle myosin heavy chain IIA – NMHCII-A) is one out
of three different genes that encode the non-muscle II heavy chain proteins of non-muscle myosin II
(Vicente-Manzanares et al., 2009). Myosin motor proteins, such as NMII-A, are also implicated in cell
migration and in the control of cell adhesion and contractility (Vicente-Manzanares et al., 2009).
Myosins are able to generate force between actin filaments, promoting the contraction of cell
structures (Lecuit et al., 2011; Pollard and Cooper, 2009). Physical changes in appearance, shape,
position and contact with extracellular structures including other cells, require the proper cellular motile
functions. In fact, it has been shown that during cell migration there is a constant remodeling of the
actin cytoskeleton in order to form different actin-based structures at the front and rear of the cell
(such as filopodia, lamellipodia, or stress fibers). In this sense, motile functions need many dynamic
cell behaviors, such as cell migration, guided movement, adhesion and contraction (Olson and
Nordheim, 2010). So it makes sense that the knocked down of these two genes not only affected the
normal cytoskeleton organization but also influenced the migratory capacity of endothelial cells.
Interestingly, morphological analysis showed that MYH9 depleted cells exhibit a phenotype more
similar to SRF depleted HUVECs than ACTR3 depleted cells. In fact, is known that F-actin interacts
with non-muscle myosin II (NMII) to induce cell shape change in endothelial cells (Strilić et al., 2009).
So, it makes sense that MYH9 depleted HUVECs have impaired cell morphology. Confirming the
important relevance of MYH9 downstream of MRTF/SRF signaling, we demonstrated that MYH9 is
able to partially rescue the actin polymerization defects in SRF depleted cells. Thus, our results
48
revealed that MYH9, a core protein of the myosin complex, could be essential for cytoskeleton
dynamics downstream SRF/MRTF signaling and we decided to focus our attention in this protein in
particular. However, we do not exclude the possibility for an important role of ACTR3 in endothelial tip
cells in vivo, downstream of SRF transcriptional activity.
The analysis of cell migration and invasion by HUVEC-spheroid sprouting assay showed that SRF
and MYH9 depleted HUVECs had similar defects in vascular sprout elongation, supporting the idea
that MYH9 is an important protein involved in sprouting angiogenesis. Interestingly, with this approach
that mimics the in vivo situation, we observed that MYH9 is highly active in the tip cell, with particular
high intensity at the leading edge. In accordance, a recent report showed that MYH9 assembles at the
leading edge, where it promotes contractile actin arcs (Pasapera et al., 2015), therefore supporting the
idea that NMII-A is not only essential for cell rear contraction and retraction, but also a key at the
leading edge.
Curiously, in our in vivo mouse retina model, we observed that MYH9 is highly expressed by
endothelial tip cells, specifically at the base of endothelial filopodia in these cells. These results
suggest a novel feature for MYH9 in endothelial cells. MYH9 has been seen at the front of the cell in
the leading-edge, promoting actin bundling, maturation and turnover of adhesions behind the
lamellipodia (Juanes-Garcia et al., 2015; Vicente-Manzanares et al., 2007) that contrast with our
results in the rear of filopodia. In this sense we suggest that the localization of MYH9 in the base of
filopodia could be necessary for its stabilization in order to tip cells migration and invasion behavior
during angiogenesis. However, further experiments must be conducted in order to validate this
hypothesis.
Under VEGF stimulation, effective elongation of the sprout appears to be driven by the velocity,
orientation and directionality of endothelial cell migration (Iruela-Arispe and Davis, 2009). Endothelial
tip cells play a central role in sprouting angiogenesis. During new sprout formation, tip cells have high
demands for a robust and active cytoskeleton for appropriate cell invasion and migration.
In this context, our results show that SRF/MRTF signaling regulate tip cell behavior, including cell
migration and invasion, through regulation of MYH9 levels. Elevated MYH9 expression levels foster
functional cytoskeleton dynamics and stabilization of tip cell filopodia protrusions (Figure IV.1). It is
known that VEGF plays a major role in the regulation of key events required for several functions of
endothelial cells, as a potent angiogenic agent, such as endothelial cell proliferation and migration
(Lamalice et al., 2007). In this context, VEGF induces the activation of VEGFR2 in tip cells, which
promotes in its turn the activation of RhoGTPases, including Rac1, Cdc42 and RhoA. This signaling
axis promotes polymerization of actin filaments and, consequently, decreases the cytosolic pool of G-
actin, leading to the nuclear translocation of MRTFs and transcription of SRF-target genes, such as
genes encoding cytoskeletal and contractile proteins (Franco and Li, 2009; Miano et al., 2007). Thus,
our work suggests that MYH9 is the main SRF-target that promotes the motile and invasive behavior
of endothelial tip cells, regulating cytoskeleton organization and stabilization of tip cell filopodia (Figure
IV.1). How these events are related to MYH9 function during sprouting angiogenesis remains yet to be
uncovered.

49
Figure IV.1 - Schematic representation of SRF signaling inducing NMII-A activity. This signaling pathway is
initiated by VEGF-A stimulation that can modulate Rho GTPases activity. Rho GTPases activity stimulates the F-
actin polymerization, leading to the liberation of MRTFs from G-actin and subsequent the nuclear import of
MRTFs. SRF-MRTF complex subsequently induces the activation of SRF-dependent transcription of MYH9, and
consequently the NMII-A complex. MYH9 could induce the stabilization of tip cell filopodia in order their migration
and invasion for new blood formation.
Previously, Franco and colleagues reported a strong regulation of MYL9 (also known as MLC2)
expression by SRF and MRTFs. MYL9 depleted cells showed significant defects in endothelial cell
migratory behavior (Franco et al., 2013). MYL9 is a regulatory light chain (RLC) of myosin complex
(NMII) with several regulatory sites, which enhances the ATPase activity of the non-muscle heavy
chain (NMHC), and also promotes an assembly-competent form of non-muscle myosin II (NMII)
(Aguilar-Cuenca et al., 2014; Vicente-Manzanares et al., 2009). The activity of NMII is mainly
regulated by phosphorylation events of RLCs or NMHCs. Regulation of NMII by RLC phosphorylation
depends, fundamentally, on the reversible phosphorylation of the RLC on two highly conserved
residues (serine 19 and threonine 18 in vertebrates NMII), increasing the Mg2+
-ATPase activity of
myosin in the presence of actin. Numerous kinases were described to phosphorylate these residues in
diverse regulatory pathways, responding a specific stimulation (including integrin activation by
extracellular matrix and cellular ligands, growth factors, cytokines and chemokines). These kinases
includes myosin light chain kinase (MLCK; activated by Ca2+/calmodulin), coiled coil-containing
kinase (ROCK) citron kinase (both activated by RhoA) and myotonia dystrophyrelated Cdc42-binding
kinase (MRCK; activated by Cdc42), among others (Aguilar-Cuenca et al., 2014; Lecuit et al., 2011).
Another mode of regulation of NMII involves direct phosphorylation of the NMHC, which destabilizes
existing mini-filaments and/or prevents their de novo assembly. These events are mediated by
proteins of the PKC family as well as stretch-activated calcium channels (TRPMs) that decrease
filament formation and alter the subcellular localization of NMII-A (Vicente-Manzanares et al., 2009).

50
Also, PKC phosphorylation of RLC in Serine 1 and 2 inhibit NMII function, likely by preventing its
normal assembly (Aguilar-Cuenca et al., 2014). In our results we observed that the protein levels of
pMLC and MLC2 are decreased in SRF and MYH9 deficient HUVECs, suggesting that the Myosin
complex is playing a key role in endothelial cells during angiogenesis. However, the molecular
mechanisms underlying the control of MYH9 function downstream of VEGF signaling needs to be
addressed in the future.
Recently studies, associated NMII-A with cancer cell migration, invasion, and metastasis. High
levels of MYH9 is an indicator of a poorer survival, and increased risk of metastasis (Katono et al.,
2015; Betapudi et al., 2006). Our study also suggests that MYH9 is an important regulator of sprouting
angiogenesis. Therefore, therapeutic strategies targeting MYH9 function could provide a dual
beneficial role, preventing both tumor angiogenesis and tumor metastasis.
Future Perspectives
Our study provides a link between SRF-MYH9 in endothelial tip cell function and a novel feature for
MYH9 in tip cells filopodia that could be important for sprouting angiogenesis. However, further
investigation aiming to define the role of MYH9 (NM-MIIA) during sprouting angiogenesis is needed.
We will continue studying the link between SRF and MYH9 in SRF EC-specific KO mouse compared
with SRFWT
mouse. Additionally, we will use in vivo genetic approaches to explore the signaling
networks regulating MYH9 function and confirm the importance of MYH9 in vivo physiological and
pathological angiogenic assays. Thus, in the future our work will focus on:
(1) Study MYH9 EC-specific KO mouse;
(2) Live-imaging of fluorescently-labeled MYH9 spatial and temporal localization in endothelial
cells during sprouting angiogenesis using zebrafish embryos;
(3) Investigate the role of myosin contraction in tip cell invasion and also the role of MYH9 in
endothelial filopodia formation/stability;
(4) Understand the mechanistic control of MYH9 function by VEGF signaling

51
V. REFERENCES
Adams, R.H., Alitalo, K. 2007. Molecular regulation of angiogenesis and lymphangiogenesis. Nat. Rev. Mol. Cell Biol. 8: 464–478.
Aguilar-Cuenca, R., Juanes-García, A., Vicente-Manzanares, M. 2014. Myosin II in mechanotransduction: master and commander of cell migration, morphogenesis, and cancer. Cell. Mol. Life Sci. 71: 479–92.
Augustin, H. 2004. Methods in Endothelial Cell Biology. Springer-Verlag Berlin Heidelberg, New York.
Barry, D.M., Xu, K., Meadows, S.M., Zheng, Y., Norden, P.R., Davis, G.E., Cleaver, O. 2015. Cdc42 is required for cytoskeletal support of endothelial cell adhesion during blood vessel formation. Development 142: 3058–3070.
Betapudi, V., Licate, L.S., Egelhoff, T.T. 2006. Distinct roles of nonmuscle myosin II isoforms in the regulation of MDA-MB-231 breast cancer cell spreading and migration. Cancer Res. 66: 4725–4733.
Blacher, S., Erpicum, C., Lenoir, B., Paupert, J., Moraes, G., Ormenese, S., Bullinger, E., Noel, A. 2014. Cell invasion in the spheroid sprouting assay: A spatial organisation analysis adaptable to cell behaviour. PLoS One 9: 1–10.
Blanchoin, L., Boujemaa-Paterski, R., Sykes, C., Plastino, J. 2014. Actin dynamics, architecture, and mechanics in cell motility. Physiol. Rev. 94: 235–63.
Blanco, R., Gerhardt, H. 2013. VEGF and Notch in tip and stalk cell selection. Cold Spring Harb. Perspect. Med. 3: 1–19.
Buchwalter, G., Gross, C., Wasylyk, B. 2004. Ets ternary complex transcription factors. Gene 324: 1–14.
Carmeliet, P. 2003. Angiogenesis in health and disease. Nat. Med. 9: 653–60.
Carmeliet, P. 2005. Angiogenesis in life, disease and medicine. Nature 438: 932–936.
Carmeliet, P. 2000. Mechanisms of angiogenesis and arteriogenesis. Nat. Med. 6: 389–395.
Carmeliet, P., Jain, R.K. 2011. Molecular mechanisms and clinical applications of angiogenesis. Nature 473: 298–307.
Chai, J., Jones, M.K., Tarnawski, A.S. 2004. Serum response factor is a critical requirement for VEGF signaling in endothelial cells and VEGF-induced angiogenesis. FASEB J. 18: 1264–1266.
Clark, K. A., Graves, B.J. 2014. Dual views of SRF: A genomic exposure. Genes Dev. 28: 926–928.
Cochain, C., Channon, K.M., Silvestre, J.S. 2013. Angiogenesis in the Infarcted Myocardium. Antioxid. Redox Signal. 18: 1100-1113.
Eilken, H.M., Adams, R.H. 2010. Dynamics of endothelial cell behavior in sprouting angiogenesis. Curr. Opin. Cell Biol. 22: 617–625.
Esnault, C., Stewart, A., Gualdrini, F., East, P., Horswell, S., Matthews, N., Treisman, R. 2014. Rho-actin signaling to the MRTF coactivators dominates the immediate transcriptional response to serum in fibroblasts. Genes Dev. 28: 943–958.
Fantin, A., Vieira, J.M., Gestri, G., Denti, L., Schwarz, Q., Prykhozhij, S., Peri, F., Wilson, S.W., Ruhrberg, C. 2010. Tissue macrophages act as cellular chaperones for vascular anastomosis downstream of VEGF-mediated endothelial tip cell induction. Blood 116: 829–840.

52
Fraccaroli, A., Franco, C. A., Rognoni, E., Neto, F., Rehberg, M., Aszodi, A., Wedlich-Söldner, R., Pohl, U., Gerhardt, H., Montanez, E. 2012. Visualization of Endothelial Actin Cytoskeleton in the Mouse Retina. PLoS One 7: 1–9.
Franco, C. A., Blanc, J., Parlakian, A., Blanco, R., Aspalter, I.M., Kazakova, N., Diguet, N., Mylonas, E., Gao-Li, J., Vaahtokari, A., Penard-Lacronique, V., Fruttiger, M., Rosewell, I., Mericskay, M., Gerhardt, H., Li, Z. 2013. SRF selectively controls tip cell invasive behavior in angiogenesis. Development 140: 2321–33.
Franco, C. A., Li, Z. 2009. SRF in angiogenesis: Branching the vascular system. Cell Adhes. Migr. 3: 264–267.
Franco, C.A., Mericskay, M., Parlakian, A., Gary-Bobo, G., Gao-Li, J., Paulin, D., Gustafsson, E., Li, Z. 2008. Serum Response Factor Is Required for Sprouting Angiogenesis and Vascular Integrity. Dev. Cell 15: 448–461.
Fukushima, Y., Okada, M., Kataoka, H., Hirashima, M., Yoshida, Y., Mann, F., Gomi, F., Nishida, K., Nishikawa, S.I., Uemura, A. 2011. Sema3E-PlexinD1 signaling selectively suppresses disoriented angiogenesis in ischemic retinopathy in mice. J. Clin. Invest. 121: 1974–1985.
Gerhardt, H., Golding, M., Fruttiger, M., Ruhrberg, C., Lundkvist, A., Abramsson, A., Jeltsch, M., Mitchell, C., Alitalo, K., Shima, D., Betsholtz, C. 2003. VEGF guides angiogenic sprouting utilizing endothelial tip cell filopodia. J. Cell Biol. 161: 1163–1177.
Geudens, I., Gerhardt, H. 2011. Coordinating cell behaviour during blood vessel formation. Development 138: 4569–4583.
Graupera, M., Potente, M. 2013. Regulation of angiogenesis by PI3K signaling networks. Exp. Cell Res. 319: 1348–1355.
Heckman, C. A., Plummer, H.K. 2013. Filopodia as sensors. Cell. Signal. 25: 2298–2311.
Heinke, J., Patterson, C., Moser, M. 2012. Life is a pattern: vascular assembly within the embryo. Front. Biosci. (Elite Ed). 4: 2269–88.
Hellström, M., Phng, L-K., Hofmann, J.J., Wallgard, E., Coultas, L., Lindblom, P., Alva, J., Nilsson, A-K., Karlsson, L., Gaiano, N., Yoon, K., Rossant, J., Iruela-Arispe, M.L., Kalén, M., Gerhardt, H., Betsholtz, C. 2007. Dll4 signalling through Notch1 regulates formation of tip cells during angiogenesis. Nature 445: 776–80.
Herbert, S.P., Stainier, D.Y.R. 2011. Molecular control of endothelial cell behaviour during blood vessel morphogenesis. Nat. Rev. Mol. Cell Biol. 12: 551–564.
Huang, H., Bhat, A., Woodnutt, G., Lappe, R. 2010. Targeting the ANGPT-TIE2 pathway in malignancy. Nat. Rev. Cancer 10: 575–585.
Iruela-Arispe, M.L., Davis, G.E. 2009. Cellular and Molecular Mechanisms of Vascular Lumen Formation. Dev. Cell 16: 222–231.
Jacquemet, G., Hamidi, H., Ivaska, J. 2015. Filopodia in cell adhesion, 3D migration and cancer cell invasion. Curr. Opin. Cell Biol. 36: 23–31.
Jain, R.K. 2003. Molecular regulation of vessel maturation. Nat. Med. 9: 685–693.
Jakobsson, L., Franco, C. A., Bentley, K., Collins, R.T., Ponsioen, B., Aspalter, I.M., Rosewell, I., Busse, M., Thurston, G., Medvinsky, A., Schulte-Merker, S., Gerhardt, H. 2010. Endothelial cells dynamically compete for the tip cell position during angiogenic sprouting. Nat. Cell Biol. 12: 943–953.
Juanes-Garcia, A., Chapman, J.R., Aguilar-Cuenca, R., Delgado-Arevalo, C., Hodges, J., Whitmore, L. A., Shabanowitz, J., Hunt, D.F., Horwitz, A. R., Vicente-Manzanares, M. 2015. A regulatory motif in nonmuscle myosin II-B regulates its role in migratory front-back polarity. J. Cell Biol. 209: 23–32.
53
Katono, K., Sato, Y., Jiang, S-X., Kobayashi, M., Nagashio, R., Ryuge, S., Fukuda, E., Goshima, N., Satoh, Y., Saegusa, M., Masuda, N. 2015. Prognostic significance of MYH9 expression in resected non-small cell lung cancer. PLoS One 10: e0121460.
Lamalice, L., Le Boeuf, F., Huot, J. 2007. Endothelial cell migration during angiogenesis. Circ. Res. 100: 782–794.
Lamalice, L., Houle, F., Jourdan, G., Huot, J. 2004. Phosphorylation of tyrosine 1214 on VEGFR2 is required for VEGF-induced activation of Cdc42 upstream of SAPK2/p38. Oncogene 23: 434–45.
Lecuit, T., Lenne, P-F., Munro, E. 2011. Force Generation, Transmission, and Integration during Cell and Tissue Morphogenesis. Annu. Rev. Cell Dev. Biol. 27: 157–184.
Lundquist, M.R., Storaska, A.J., Liu, T.C., Larsen, S.D., Evans, T., Neubig, R.R., Jaffrey, S.R. 2014. Redox modification of nuclear actin by MICAL-2 regulates SRF signaling. Cell 156: 563–576.
Makanya, A.N., Hlushchuk, R., Djonov, V.G.. 2009. Intussusceptive angiogenesis and its role in vascular morphogenesis, patterning, and remodeling. Angiogenesis 12: 113–123.
Manalo, D.J., Rowan, A., Lavoie, T., Natarajan, L., Kelly, B.D., Ye, S.Q., Garcia, J.G.N., Semenza, G.L., Hif-, H. 2005. Transcriptional regulation of vascular endothelial cell responses to hypoxia by HIF-1. Regulation 105: 659–669.
Mattila, P.K., Lappalainen, P. 2008. Filopodia: molecular architecture and cellular functions. Nat. Rev. Mol. Cell Biol. 9: 446–454.
Miano, J.M., Long, X., Fujiwara, K. 2007. Serum response factor: master regulator of the actin cytoskeleton and contractile apparatus. 70-81.
Michaelis, U.R. 2014. Mechanisms of endothelial cell migration. Cell. Mol. Life Sci.: 4131–4148.
Miralles, F., Posern, G., Zaromytidou, A.I., Treisman, R. 2003. Actin dynamics control SRF activity by regulation of its coactivator MAL. Cell 113: 329–342.
Nürnberg, A., Kitzing, T., Grosse, R. 2011. Nucleating actin for invasion. Nat. Rev. Cancer 11: 177–187.
Olson, E.N., Nordheim, A. 2010. Linking actin dynamics and gene transcription to drive cellular motile functions. Nat. Rev. Mol. Cell Biol. 11: 353–365.
Olsson, A-K., Dimberg, A, Kreuger, J, Claesson-Welsh, L. 2006. VEGF receptor signalling - in control of vascular function. Nat. Rev. Mol. Cell Biol. 7: 359–371.
Parsons, JT, Horwitz, A.R., Schwartz, M.A. 2010. Cell adhesion: integrating cytoskeletal dynamics and cellular tension. Nat. Rev. Mol. Cell Biol. 11: 633–643.
Pasapera, A.M., Plotnikov, S.V., Fischer, R.S., Case, L.B., Egelhoff, T.T., Waterman, C.M. 2015. Rac1-Dependent Phosphorylation and Focal Adhesion Recruitment of Myosin IIA Regulates Migration and Mechanosensing. Curr. Biol. 25: 175–186.
Phng, L.K., Gerhardt, H. 2009. Angiogenesis: A Team Effort Coordinated by Notch. Dev. Cell 16: 196–208.
Pitulescu, M.E., Schmidt, I., Benedito, R., Adams, R.H. 2010. Inducible gene targeting in the neonatal vasculature and analysis of retinal angiogenesis in mice. Nat. Protoc. 5: 1518–1534.
Pollard, T.D., Cooper, J.A. 2009. Actin, a central player in cell shape and movement. Science 326: 1208–12.
Posern, G., Sotiropoulos, A., Treisman, R. 2002. Mutant actins demonstrate a role for unpolymerized actin in control of transcription by serum response factor. Mol. Biol. Cell 13: 4167–4178.
54
Posern, G., Treisman, R. 2006. Actin’ together: serum response factor, its cofactors and the link to signal transduction. Trends Cell Biol. 16: 588–596.
Potente, M., Gerhardt, H., Carmeliet, P. 2011. Basic and therapeutic aspects of angiogenesis. Cell 146: 873–887.
Pugh, C.W., Ratcliffe, P.J. 2003. Regulation of angiogenesis by hypoxia: role of the HIF system. Nat. Med. 9: 677–684.
Riedl, J., Flynn, K.C., Raducanu, A., Gärtner, F., Beck, G., Bösl, M., Bradke, F., Massberg, S., Aszodi, A., Sixt, M., Wedlich-Söldner, R. 2010. Lifeact mice for studying F-actin dynamics. Nat. Methods 7: 168–9.
Ruhrberg, C., Gerhardt, H., Golding, M., Watson, R., Ioannidou, S., Fujisawa, H., Betsholtz, C., Shima, D.T. 2002. Spatially restricted patterning cues provided by heparin-binding VEGF-A control blood vessel branching morphogenesis. Genes Dev. 16: 2684–98.
Semenza, G.L. 2003. Angiogenesis in ischemic and neoplastic disorders. Annu. Rev. Med. 54: 17–28.
Siekmann, A.F., Affolter, M., Belting, H.G. 2013. The tip cell concept 10 years after: New players tune in for a common theme. Exp. Cell Res. 319: 1255–1263.
De Smet, F, Segura, I, De Bock, K, Hohensinner, PJ, Carmeliet, P. 2009. Mechanisms of vessel branching: Filopodia on endothelial tip cells lead the way. Arterioscler. Thromb. Vasc. Biol. 29: 639–649.
Strilić, B., Kucera, T., Eglinger, J., Hughes, M.R, McNagny, K.M., Tsukita, S., Dejana, E., Ferrara, N., Lammert, E. 2009. The molecular basis of vascular lumen formation in the developing mouse aorta. Dev. Cell 17: 505–15.
Sun, Q., Chen, G., Streb, J.W., Long, X., Yang, Y., Stoeckert, C.J., Miano, J.M. 2006. Defining the mammalian CArGome. Genome Res. 16: 197–207.
Vestweber, D. 2008. VE-cadherin: The major endothelial adhesion molecule controlling cellular junctions and blood vessel formation. Arterioscler. Thromb. Vasc. Biol. 28: 223–232.
Vicente-Manzanares, M., Ma, X., Adelstein, R.S., Horwitz, A.R. 2009. Non-muscle myosin II takes centre stage in cell adhesion and migration. Nat. Rev. Mol. Cell Biol. 10: 778–790.
Vicente-Manzanares, M., Zareno, J., Whitmore, L., Choi, C.K., Horwitz, A.F. 2007. Regulation of protrusion, adhesion dynamics, and polarity by myosins IIA and IIB in migrating cells. J. Cell Biol. 176: 573–580.
Wang, Z., Wang, D-Z., Pipes, G.C.T., Olson, E.N. 2003. Myocardin is a master regulator of smooth muscle gene expression. Proc. Natl. Acad. Sci. U. S. A. 100: 7129–7134.
Weinl, C., Riehle, H., Park, D., Stritt, C., Beck, S., Huber, G., Wolburg, H., Olson, E.N., Seeliger, M.W., Adams, R.H., Nordheim, A. 2013. Endothelial SRF/MRTF ablation causes vascular disease phenotypes in murine retinae. J. Clin. Invest. 123: 2193–2206.
Yang, C., Svitkina, T. 2011. Filopodia initiation: focus on the Arp2/3 complex and formins. Cell Adh. Migr. 5: 402–408.
Zimna, A., Kurpisz, M. 2015. Hypoxia-Inducible Factor-1 in Physiological and Pathophysiological Angiogenesis: Applications and Therapies. Biomed Res. Int. 2015: 1–13.