Embed Size (px)
Citation preview
University of Arkansas, FayettevilleScholarWorks@UARK
Food Science Undergraduate Honors Theses Food Science
8-2019
Identifying Consumer Perceptions of Fresh-marketBlackberriesAubrey Dunteman
Follow this and additional works at: https://scholarworks.uark.edu/fdscuht
Part of the Food Chemistry Commons, Fruit Science Commons, and the HorticultureCommons
This Thesis is brought to you for free and open access by the Food Science at ScholarWorks@UARK. It has been accepted for inclusion in Food ScienceUndergraduate Honors Theses by an authorized administrator of ScholarWorks@UARK. For more information, please contact [email protected].
Recommended CitationDunteman, Aubrey, "Identifying Consumer Perceptions of Fresh-market Blackberries" (2019). Food Science Undergraduate HonorsTheses. 7.https://scholarworks.uark.edu/fdscuht/7
Perceptions of Fresh-Market Blackberries 1
Identifying Consumer Perceptions of Fresh-market Blackberries
Aubrey N. Dunteman
University of Arkansas
Department of Food Science

Perceptions of Fresh-Market Blackberries 2
Table of Contents
1. Abstract pg. 3
2. Introduction and Literature Review pg. 4
3. Materials and Methods pg. 7
4. Results and Discussion pg. 13
5. Conclusion and Implications pg. 20
6. References pg. 22
7. Tables and Figures pg. 24
Perceptions of Fresh-Market Blackberries 3
Abstract
Blackberries are grown worldwide for commercial fresh markets, but there is limited
information on consumer perceptions of this fruit. In this study, physiochemical and consumer
sensory attributes of three Arkansas-grown fresh-market blackberry genotypes were evaluated
and consumer perceptions of fresh-market blackberries were also investigated though an online
survey. Two cultivars (Natchez and Ouachita) and one advanced selection (A-2418) were
evaluated for compositional and nutraceutical analysis and consumer sensory analysis. Natchez
had the highest berry weight, length, drupelets and pyrenes/berry, and pyrene weight/berry.
Ouachita had the highest soluble solids content (11.9%), pH (3.18) and soluble solids/titratable
acidity ratio (10.92). There were no significant differences between genotypes for titratable
acidity, organic acids, sugars, and most of the nutraceuticals. In a sensory panel (n = 80) of these
genotypes, consumers rated Natchez highest in overall impression, overall flavor, and sweetness,
and Natchez was ranked as the most liked blackberry more often than Ouachita or A-2418 on a
9-point verbal hedonic liking scale and 5-point Just About Right scale. An online consumer
survey (n = 879) was done to gain information on consumers’ opinions and habits relating to
fresh-market blackberries. Results indicated the most important factors to influence blackberry
purchases are the freshness of the berries, the type and size of package, the uniformity of berry
color, and the price. Results also suggested consumers prefer larger sized blackberries and
blackberries with an oblong shape. Identifying marketability attributes of fresh-market
blackberries helps provide information to advance breeding efforts for fruit with commercial
potential.
Keywords: Rubus, Marketability, Blackberry, Physiochemical, Nutraceutical, Sensory
Perceptions of Fresh-Market Blackberries 4
Introduction and Literature Review
Blackberry plants (Rubus L. hybrids) are grown around the world, and the fruit is used in
both fresh and processing markets. Blackberry cultivars produce berries with variations in traits
such as size, shape, color, and flavor, along with many other new and unique attributes. Fruit
with high antioxidant capacity, including blackberries, have gained consumer interest due to
health-conferring qualities such as the potential to prevent illness and reduce the effects of aging
(Lewers et al., 2010). With the growing demand for healthy foods, the significance of identifying
consumers’ perceptions of fresh-market blackberries has increased as their impression impacts
the commercial marketability of the fruit. According to the United States Department of
Agriculture (2017), 1,620 ha of blackberries were harvested in the United States with ~2,740,000
kg for fresh market with a value at $5 million, though these data are primarily from Oregon.
Fresh-market blackberry production in the top three caneberry producing counties in California
was valued at $78.7 million in 2016 (Monterey County, California Agricultural Commissioner,
2017).
There are major differences among fresh-market blackberry cultivars for traits that may
affect consumer perception and acceptance which vary by genotype. These variations between
genotypes are due to blackberry genetics. Blackberry breeding programs have been enhancing
desirable traits and reducing undesirable traits in plants and fruit. Current traits of interest for
blackberry breeders include enhanced fruit quality, enhanced flavors, improved shipping
capabilities, plant thornlessness, increased productivity, adaptation/habit, and disease/pest
resistance (Clark, 2008; Clark and Finn, 2008; Clark and Perkins-Veazie, 2011; Clark, 2005;
Finn and Clark, 2012; Lewers et al., 2010). Specific desirable fruit attributes include large fruit
size, berries with smaller seeds (pyrenes), and sweeter berries (Clark, 2005). Blackberry breeding
Perceptions of Fresh-Market Blackberries 5
programs have also contributed to the increase in the world’s blackberry plant production area
from 20,035 in 2005 ha to a projected count of over 27,000 ha for 2015 (Strik et al., 2007). Over
60 blackberry cultivars have been released since 1985 from breeding programs in the United
States. One of the largest public blackberry breeding programs is conducted at the University of
Arkansas System Division of Agriculture (Clark, 1999; Clark and Finn, 2008). As new
blackberry cultivars are developed in breeding programs, the need to identify their marketing
potential is important as it can influence whether or not the genotypes will be released. Attributes
of blackberries that may affect marketability include sweetness, tartness, flavor, color, firmness,
and seediness, as they are important to consumers (Clark et al., 2007; Clark and Finn, 2008; Hall
et al., 2002). Sweetness, in particular, has been shown to affect marketability and sales of fresh-
market blackberries in the United Kingdom (Barnett, 2007).
The marketability of food is driven by consumers’ acceptance, and one of the key factors
determining acceptability is the sensory characteristics a food imparts (Laaksonen et al., 2016).
Sensory analysis can be used to identify various qualities of fruit that may be difficult to quantify
and analyze. There are typically four types of sensory analysis panels: highly trained experts,
trained laboratory panels, laboratory acceptance panels, and large consumer panels (Poste et al.,
1991). The type of sensory panel used is dependent on the information researchers need about
the product. Large consumer panels (typically more than 75 people for statistical validity) can be
used to determine the consumer’s reaction to the product evaluated (Poste et al., 1991).
Sensory analysis can be implemented to gain consumers’ opinions on the five basic taste
attributes (sweetness, sourness, saltiness, bitterness, and umami) of a food. An important sensory
evaluation focus in fruit is how the flavor is affected by the sweetness (percent sugar measured
by soluble solids) and sourness (percent acid measured by titratable acidity), and the sweetness
Perceptions of Fresh-Market Blackberries 6
and sourness relationship (soluble solids/titratable acidity ratio) (Crisosto et al., 2005;
Laaksonen, 2016; Poll, 1981; Sandell et al., 2008). Blackberries tend to have a lower soluble
solids/titratable acidity ratio when compared to other fruits. Previous research has shown an
average ratio of 6.7 for blackberries (de Souza et al., 2014), which is low compared to muscadine
grapes (Vitis rotundifolia Michx.) with an optimal ratio of 30 (Flora, 1979). The large difference
in optimal ratios seen between the fruits can be attributed to a much smaller soluble solids
content and larger titratable acidity content in blackberries than in muscadine grapes. Low ratios
can mean the desirable attributes of large fruit size and sweeter berries may be difficult to
achieve in one blackberry genotype as in a study conducted by Threlfall et al. (2016), where a
relationship was found between larger berries having lower pH and higher titratable acidity. The
aforementioned relationship may not be the case for all current and future blackberry genotypes
as the study only looked at five cultivars and six advanced breeding selections from the
University of Arkansas. Since different fruits have different levels of soluble solids/titratable
acidity ratios, determining the levels which consumers prefer in blackberries helps identify
which blackberry genotypes may succeed commercially.
While currently there is a lack of information relating to the effect of sensory attributes of
blackberries and those attributes’ effects on blackberry fruit marketability, the state of Arkansas’
capability to produce fresh-market blackberries makes for a logical choice in deciding where to
conduct physiochemical analysis and consumer studies. By investigating consumers’ perception
of fresh-market blackberries, we can determine if consumers prefer blackberries with high
sourness/low sweetness, low sourness/high sweetness, or a balance of sourness and sweetness.
In order to determine potential of various fresh-market blackberry genotypes, the
following objectives allow for the identification of specific attributes which may impact
Perceptions of Fresh-Market Blackberries 7
marketability. The objective for this research was to identify consumer-driven attributes of fresh-
market blackberries. In doing so, key characteristics of fresh-market blackberries were
determined through analyzing data gathered from physiochemical and consumer sensory
attributes and an online consumer perception survey. As a result, this study communicates to the
blackberry industry what attributes drive fresh-market blackberries’ marketability in today’s
society. Overall, this study sought to maximize Arkansas’s blackberry potential and evaluate the
numerous uses for the growing production of fresh-market blackberries.
Materials and Methods
Fruit
The blackberries were harvested prior to 10:00 am on 29 June, 2017 at the shiny-black
stage of ripeness. The advanced breeding selection, A-2418, was harvested from the University
of Arkansas Fruit Research Station in Clarksville, AR, and the blackberry cultivars, Natchez and
Ouachita, were harvested from a commercial grower in Fayetteville, AR. These genotypes were
selected because they had a wide range of sourness and sweetness levels. Blackberries were
hand-harvested directly into 240-g clamshells and placed into chilled coolers. After harvest was
complete, the blackberries were transported to the Department of Food Science in Fayetteville,
AR. Fruit was then randomly sorted into new clamshells for the physiochemical and sensory
analysis.
Physiochemical Analysis
The physiochemical analysis of blackberries was done at the Department of Food
Science, University of Arkansas, in Fayetteville. Blackberries were placed in a plastic zip-type
freezer bag in triplicate for each genotype and stored at -20 oC until analysis. Five blackberries
Perceptions of Fresh-Market Blackberries 8
per replication were used for berry and pyrene attributes and three blackberries per genotype
were used for the composition and nutraceutical analysis.
Berry and Pyrene Attributes. The berry attributes (individual weight, length, width, and
drupelets/berry) and pyrene attributes (number/berry and weight/berry) were evaluated. The
samples composed of five berries were weighed on a digital scale (Explorer, Ohaus Corporation,
Parsippany, NJ) and the height and width at the longest and widest sections of each berry was
measured using a digital caliper. To determine the pyrene attributes, Pec5L enzyme (Scott
Laboratories, Petaluma, CA) was used to break down berry skin and pulp. Approximately 0.1
mL of the enzyme was added to bags containing three frozen berries. After the berries had
thawed, they were hand-mashed in the bag. After 15 minutes at 21 oC, distilled water was added
to each bag and then samples were poured into a strainer. To separate the pyrenes from the pulp,
the pulp was mashed against the strainer under running water until only pyrenes were left. The
pyrenes were placed evenly onto paper towels to dry at 21 oC for 1.5 h. Pyrenes were then further
dried at 55 °C for 24 h in a laboratory oven (Fischer Scientific, Pittsburg, PA Isotemp®, Model
655F) and then removed and weighed to obtain a final weight.
Basic Compositional Analysis. Juice was extracted from each three-berry sample by
thawing and squeezing the juice of the berries through cheesecloth. The composition attributes of
the juice included soluble solids, pH, titratable acidity, and the soluble solids/titratable acidity
ratio. Composition analysis of the juice was done at room temperature (24 oC). The soluble
solids percent (%) was measured using a Bausch & Lomb Abbe Mark II refractometer (Scientific
Instrument, Keene, NH). The pH and titratable acidity were measured using an 877 Titrino Plus
(Metrohm AG, Herisau, Switzerland) standardized to pH 2.0, 4.0, 7.0, and 10.0 buffers prior to
analysis. The titratable acidity (%) was determined by diluting ~6 g of juice with 50 mL of
Perceptions of Fresh-Market Blackberries 9
deionized, degassed water, and titrating with 0.1 N sodium hydroxide to an endpoint of pH 8.2.
The results of the titration were expressed as percent citric acid.
Organic Acid and Sugar Analysis. Individual acids and sugars were analyzed using juice
extracted from the thawed blackberries. Glucose, fructose, and isocitric, isocitric lactone and
malic acids of blackberries were measured using High Pressure Liquid Chomatography (HPLC)
procedures described in Walker et al. (2003). The HPLC was equipped with a Bio-Rad HPLC
Organic Acid Analysis Aminex HPX-87H ion exclusion column (300 x 7.8 mm) and a Bio-Rad
HPLC column for fermentation monitoring (150 x 7.8 mm) in series. A Bio-Rad Micro-Guard
Cation-H refill cartridge (30 x 4.5 mm) was used for a guard column. Columns were maintained
at 65 °C by a temperature control unit. Mobile phase consisted of a pH 2.28 solution of sulfuric
acid and water with a resistivity of 18 M obtained from a Millipore Milli-Q reagent water
system, with 0.65 mL/min flow rate. The solvent delivery system was a Waters 515 HPLC pump
equipped with a Waters 717 plus autosampler. Samples were diluted using 1 mL of blackberry
juice in 5 mL of distilled water and then mixed. Samples were passed through a 0.45 μm
polytetrafluoroethylene (PTFE) filter, transferred into a vial, and 20 μL of the sample was used
for analysis. A Waters 410 differential refractometer detector to measure refractive index
connected in series with a Waters 996 photodiode array detector (PDAD) monitored the eluting
compounds. Acids were detected by PDAD at 210 nm and sugars were detected by a differential
refractometer. The peaks were quantified using external standard calibration based on peak
height estimation with baseline integration. The acids and sugars measurements were expressed
as g/100 g).
Nutraceutical Analysis. Nutraceutical analysis was done in triplicate on each of the three
blackberry genotypes. Each of the sample extracts was obtained by homogenizing three berries
Perceptions of Fresh-Market Blackberries 10
with approximately 40 mL of methanol/water/formic acid (60:37:3 v/v/v) using a Euro Turrax
T18 Tissuemizer (Tekmar-Dohrman Corp., Mason, OH). Samples were then centrifuged for 5
minutes at 10,000 rpm, decanted to isolate the solid pellet, and then the extraction process was
repeated with acetone/water/acetic (70:29.5:0.5 v/v/v). Each repetition alternated the solvent
used for extraction. Once the sample decant appeared clear, the extraction process was
considered complete and the filtrates were adjusted to a final volume of 500 mL with either of
the two extraction solvents to assure complete extraction of the nutraceutical compounds.
Ellagitannins and Flavonols. A Speed Vac concentrator (ThermoSavant, Holbrook, NY)
was used to dry 3 mL of each blackberry genotype’s extract and dried extract was re-suspended
in 0.5 mL of extraction solvent. Prior to HPLC analysis, the reconstituted samples were passed
through 0.45 μm PTFE syringe filters (Varian, Inc., Palo Alto, CA). The HPLC analysis was
conducted using a Waters Alliance HPLC system (Milford, MA) with a Waters model 996
photodiode array detector and Millennium version 3.2 software (Waters Corp., Milford, MA) to
analyze each of the blackberry genotype samples’ ellagitannin and flavonol contents. A
Phenomenex Aqua 5 μm C18 (250 x 4.6 mm) column (Torrance, CA) was implemented to
perform separation. Mobile phase A consisted of a binary gradient of 2% acetic acid, and mobile
phase B consisted of a 0.5% acetic acid in water/acetonitrile (1:1 v/v) at a flow rate of 1.0
mL/minute. A linear gradient was then run from 10%-50% B during the first 50 minutes, from
55%-100% B from 50-60 minutes, and lastly from 100%-10% B from 60-65 minutes.
Identification of the ellagitannins and flavonols were determined by comparing HPLC retention
times to previous HPLC results that had been obtained using identical conditions (Hager et al.
2008a; 2010). Using external ellagic acid calibration curves, the ellagitannin peaks were
quantified as ellagic acid equivalents at 225 nm with results expressed as milligrams of ellagic
Perceptions of Fresh-Market Blackberries 11
acid equivalents per 100 g of original berry weight. The flavonol peaks were quantified as rutin
at 360 nm with results expressed as rutin equivalents per 100 g of original berry weight.
Anthocyanins and Hydroxycinnamic Acids. A Speed Vac concentrator (ThermoSavant,
Holbrook, NY) was used to dry 3 mL of each blackberry genotype’s extract. The dried extracts
were re-suspended in 2 mL of 3% formic acid. Prior to HPLC analysis, the reconstituted samples
were passed through 0.45 μm PTFE syringe filters (Varian, Inc., Palo Alto, CA). The HPLC
analysis for anthocyanin and hydroxycinnamic acid content was conducted on a basis of previous
methods (Cho et al., 2004; Hager et. al. 2008b) by using a 250 x 4.6 mm Symmetry C18 column
(Water Corp., Milford, MA). A 5% formic acid (A) and 100% methanol (B) binary gradient was
used for the mobile phase at a flow rate of 1.0 mL per minute with a linear gradient run from
2%-60% B over an hour. A photodiode array detector quantified the anthocyanin peaks at 510
nm and the individual peaks were quantified as cyanidin 3-glucoside (acy) equivalents. The
resulting total anthocyanins were expressed as milligrams per 100 g of original berry weight. The
hydroxycinnamic acid peaks were monitored at 320 nm with results expressed as mg of
chlorogenic acid equivalents per 100 g of original berry weight.
Sensory Analysis
Consumer sensory attributes of three Arkansas-grown fresh-market blackberry genotypes
were evaluated and consumer perceptions of fresh-market blackberries were also investigated
though an online survey.
Consumer Sensory Analysis. Consumer sensory analysis was performed at the
Department of Food Science at the University of Arkansas, Fayetteville on the day following
harvest. Blackberries for consumer sensory analysis were stored at 2 oC overnight. Prior to
serving, the blackberries were rinsed and allowed to air dry until they reached room temperature
Perceptions of Fresh-Market Blackberries 12
(24 oC). Eighty consumers were recruited to participate in the study. Consumer responses were
collected via hard-copy ballots. The consumer panel was comprised of 44 males and 36 females
ages 18 to over 70 years from a range of incomes from less than $15,000 to more than $90,000.
Three berries per genotype were placed on a plate labeled with a random three-digit code. Each
sample was served sequentially, monodically (one at a time) with a random serving order.
Consumers were instructed to cleanse their palates between samples with water and unsalted
crackers. Consumers evaluated the blackberries using a 9-point hedonic scale (1=dislike
extremely; 2=dislike very much; 3=dislike moderately; 4=dislike slightly; 5=neither like nor
dislike; 6=like slightly; 7=like moderately; 8=like very much; 9=like extremely) for overall
impression, overall flavor, sweetness, and sourness and a 5-point Just-about-Right (JAR) scale
(1=not nearly enough; 3=just about right; 5=much too much) for sweetness and sourness.
Blackberry genotypes were then ranked for overall liking from most to least (1=most liked, 3=
least liked).
Online Consumer Perception Survey. An online consumer survey was done to gain
information on consumers’ opinions and habits relating to fresh-market blackberries. The online
survey was designed and conducted through SurveyMonkey®. Participants (n = 1,179) were
recruited from a database (n ≈ 5,500) based off of consumption, purchasing habits, and liking of
fresh blackberries. Of the 1,179 participants who had initiated the survey, only 879 completed
the survey in full and were used in the survey analysis.
Statistical Design and Analyses
After harvest, the fruit from each genotype was randomized for sensory and composition
analysis. Statistical analysis was conducted with JMP® (version 12.0; SAS Institute, Cary, NC).
A univariate analysis of variance (ANOVA) was used to determine the significance of main
Perceptions of Fresh-Market Blackberries 13
factors. Tukey’s Honest Significant Difference (HSD) test was used for mean separation (P ≤
0.05) of composition data, while Least Significant Difference (LSD) was used for mean
separation (P ≤ 0.05) of sensory data. Physiochemical attributes were evaluated in triplicate. The
online consumer data was not analyzed statistically but presented as percent of respondents.
Results and Discussion
In this study, physiochemical and consumer sensory attributes of three Arkansas-grown
fresh-market blackberry genotypes were evaluated and consumer perceptions of fresh-market
blackberries were also investigated though an online survey.
Physiochemical and Consumer Sensory of Arkansas-grown Fresh-market Blackberries
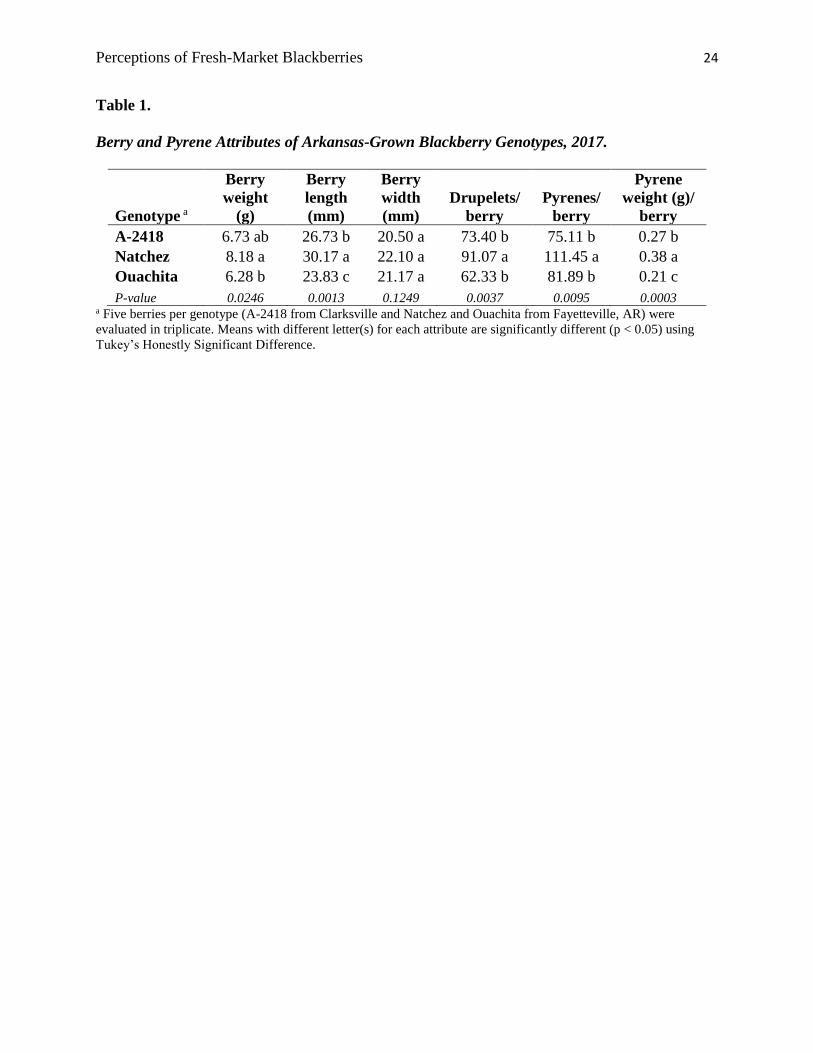
Berry and Pyrene Attributes. The blackberry genotypes had measurements taken on berry
weight, berry length, berry width, drupelets/berry, pyrenes/berry, and pyrene weight/berry (Table
1). The berry and pyrene attributes of the three blackberries genotypes varied significantly from
each other, particularly the berry length and the pyrene weight/berry. The blackberries had berry
weights ranging from 6.28 to 8.18 g, berry lengths from 23.83 to 30.17 mm, berry widths from
20.50 to 22.10 mm, drupelets/berry from 62.33 to 91.07, pyrenes/berry from 75.11 to 111.45,
and pyrene weight/berry from 0.21 to 0.38 g. Natchez had the highest values for all berry and
pyrene attributes though not significantly for berry width. Ouachita had the smallest values for
berry weight, length, drupelets/berry, and pyrenes weight/berry, and A-2418 had the smallest
values for berry width and pyrenes/berry.
Significant differences between all genotypes were found between berry length and
pyrene weight/berry, while no significant differences were found between any genotypes for
berry width. The berry weight of Natchez was significantly higher than the berry weight of
Ouachita, while A-2418 was not significantly different from either Natchez or Ouachita. There
Perceptions of Fresh-Market Blackberries 14
was no significant difference for the number of drupelets/berry and pyrenes/berry between A-
2418 and Ouachita, yet Natchez was significantly higher than the other two genotypes for those
attributes.
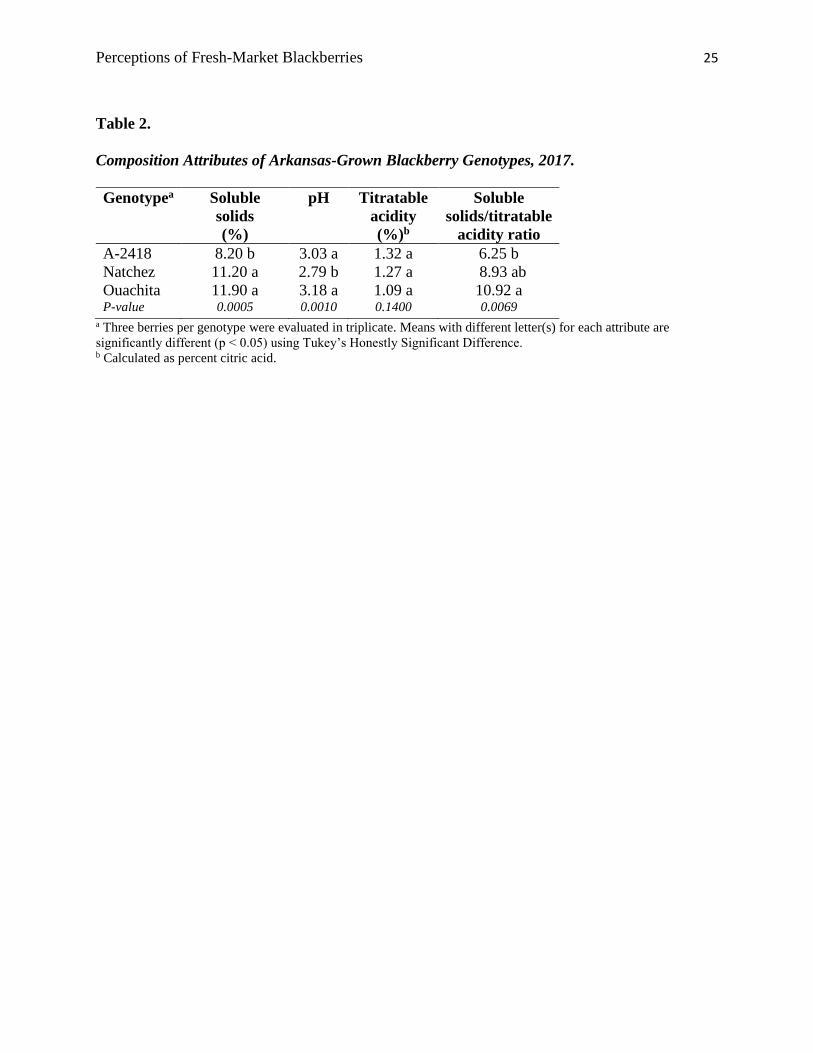
Basic Compositional Attributes. The composition analysis consisted of measuring the pH,
titratable acidity, and soluble solids of the blackberry genotypes, as well as calculating the
soluble solids/titratable acidity ratio (Table 2). The soluble solids ranged from 8.20% to 11.90%,
the pH values ranged from 2.79 to 3.18, and the titratable acidity ranged from 1.09% to 1.32%
(Table 2). Ranges similar to these have been shown in other blackberry research where pH
ranged from 2.5 to 4.1, titratable acidity ranged from 1.26% to 1.54%, and soluble solids ranged
from 6.19% to 11.11% (de Souza et al., 2014). The soluble solids content of A-2418 (8.20%)
was significantly lower than Natchez (11.20%) and Ouachita (11.90%), but Natchez and
Ouachita soluble solids levels were not significantly different. Natchez had the lowest pH at 2.79
and was significantly lower than the other genotypes. Ouachita with a pH of 3.18 was not
significantly different from A-2418 with a pH of 3.03. There were no significant differences
found among the genotypes for titratable acidity. In general, the goal of the University of
Arkansas’ blackberry breeding program is to release blackberries with a titratable acidity not
greater than 1% (J.R. Clark, personal comm.); however, all three genotypes had an average
titratable acidity over 1%. In an evaluation of blackberry genotypes in Mexico and the United
States, Reyes-Carmona et al. (2005) found the pH of their tested blackberries ranged from 2.3 to
4.3%, soluble solids from 7.5 to 16.1%, and titratable acidity, from 1.0 to 4.2% and had
concluded that the composition of blackberries was highly dependent on the genotype of berry
rather than climate or season in which the blackberry plant was grown, thus supporting the
Perceptions of Fresh-Market Blackberries 15
finding in this research that the genotypes have significant differences despite being grown and
harvested in the same region and climate.
As noted earlier, the soluble solids/titratable acidity ratio plays a large part in the
consumer acceptance of certain fruits (Crisosto et al., 2005; Laaksonen, 2016; Poll, 1981;
Sandell et al., 2008). The ratio is the balance between the two attributes that helps determine
perceived sweetness and sourness of the fruit (Poll, 1981; Threlfall et al., 2016). Ouachita
(10.92) had the highest ratio, indicating a higher perceived sweetness and was significantly
higher than A-2418 (6.25), which had the lowest ratio, indicating a lower perceived sweetness.
Natchez had a ratio of 8.93 and was not significantly different from either Ouachita or A-2418
(Table 2). These results were consistent with other research where Natchez had a similar soluble
solids/titratable acidity ratio of 9.0, though inconsistent for Ouachita, which had a lower ratio
than Natchez at 7.3 (Segantini et al., 2017). In previous research in Arkansas, Ouachita had the
highest soluble solids/titratable acidity ratio, followed by Natchez, and then A-2418 (15.4, 11.8,
and 6.9, respectively) (Segantini et al., 2017), possibly indicating the fruit harvested for our
study was less ripe.
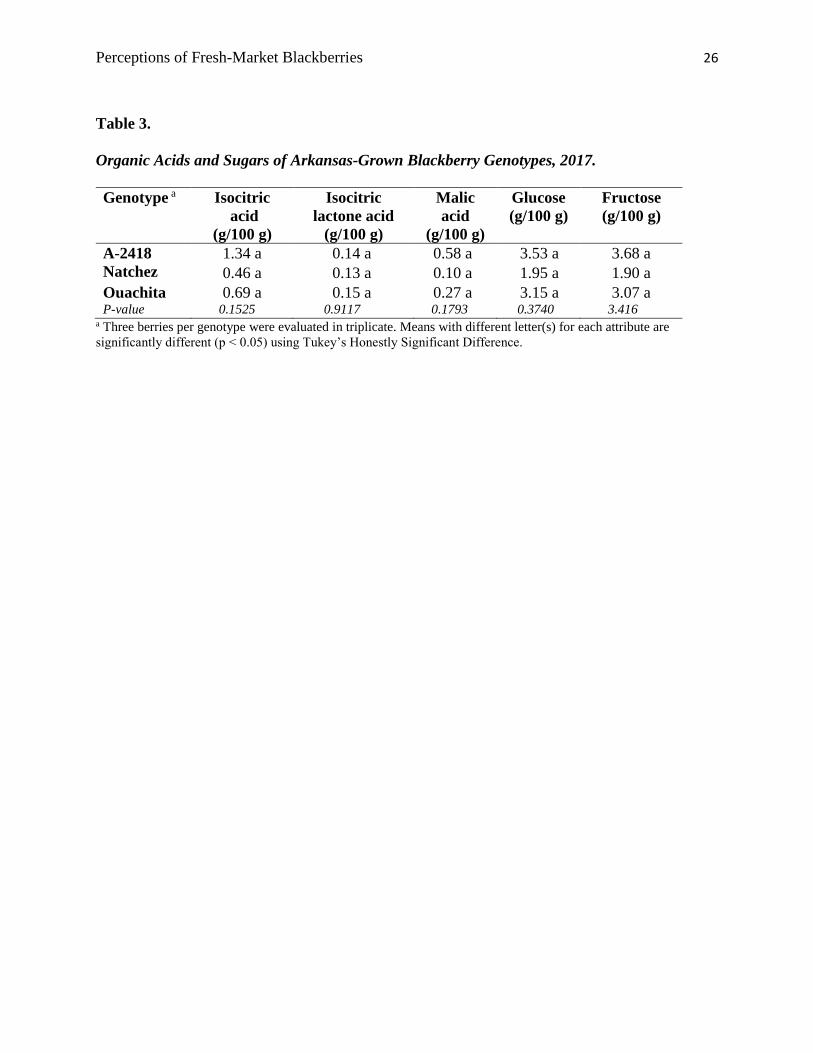
Organic Acid and Sugar Attributes. There were no significant differences among
genotypes for any of the measured organic acids and sugars (Table 3). While insignificant, A-
2418 contained the highest content of malic acid (0.58 g/100 g) and isocitric acid (1.34 g/100 g),
as well as for glucose and fructose (3.53, and 3.68 g/100 g, respectively). Natchez was
consistently found to contain the lowest values for all of the organic acids and sugars tested,
though still at an insignificant difference level.
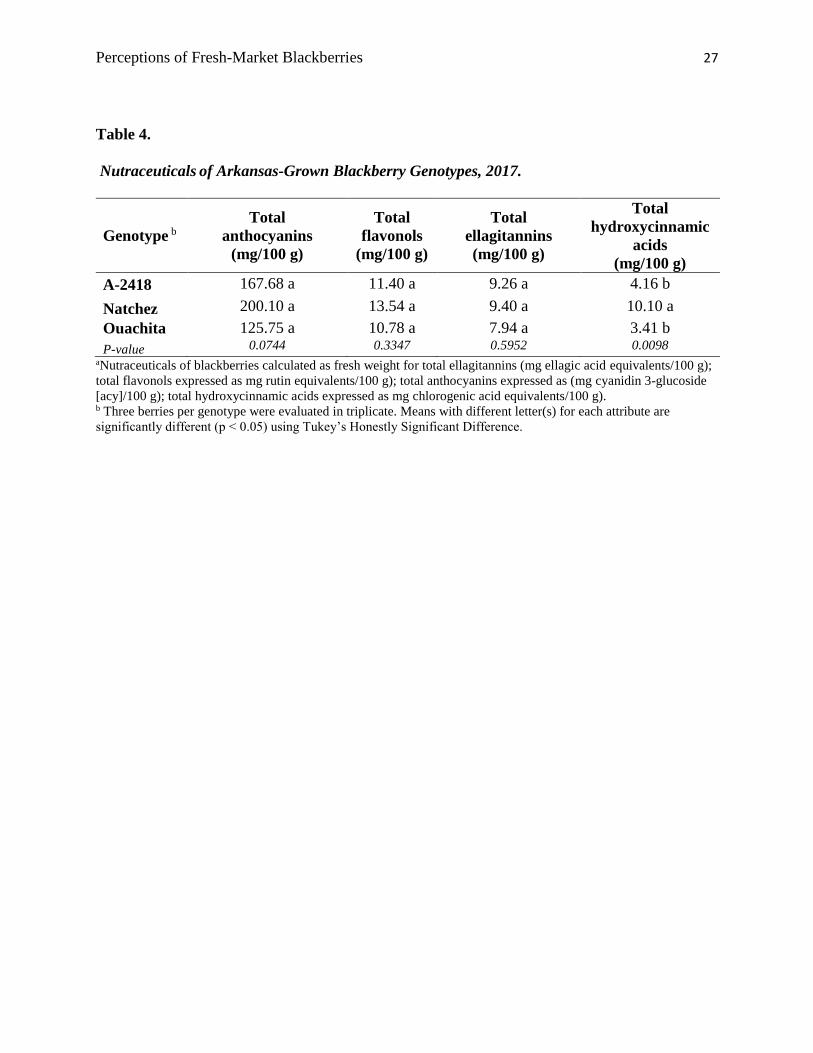
Nutraceutical Attributes. There were no significant differences among genotypes for total
anthocyanins, total flavonols, and total ellagitannins content (Table 4). Natchez had the largest
Perceptions of Fresh-Market Blackberries 16
total hydroxycinnamic acid content at 10.10 mg/100 g and was significantly higher than the other
genotypes. Ouachita with a hydroxycinnamic acid content of 3.41 mg/100 g was not significantly
different from A-2418 with a total hydroxycinnamic acid content of 4.16 mg/100 g.
Consumer Sensory Analysis. A total of 80 consumers (55% female and 45% male)
participated in the consumer sensory analysis of fresh-market blackberries. Ages of participants
ranged from 21 years to above 61 with 67.5% between the ages of 21 and 40, 23.8% between 41
and 60, and 8.7% were above age 61. The annual incomes of participants ranged from below
$29,999 to above $70,000. About 42.5% of consumers had an annual income below $29,999,
26.3% had an annual income between $30,000-69,999, and 31.2% had an annual income above
$70,000.
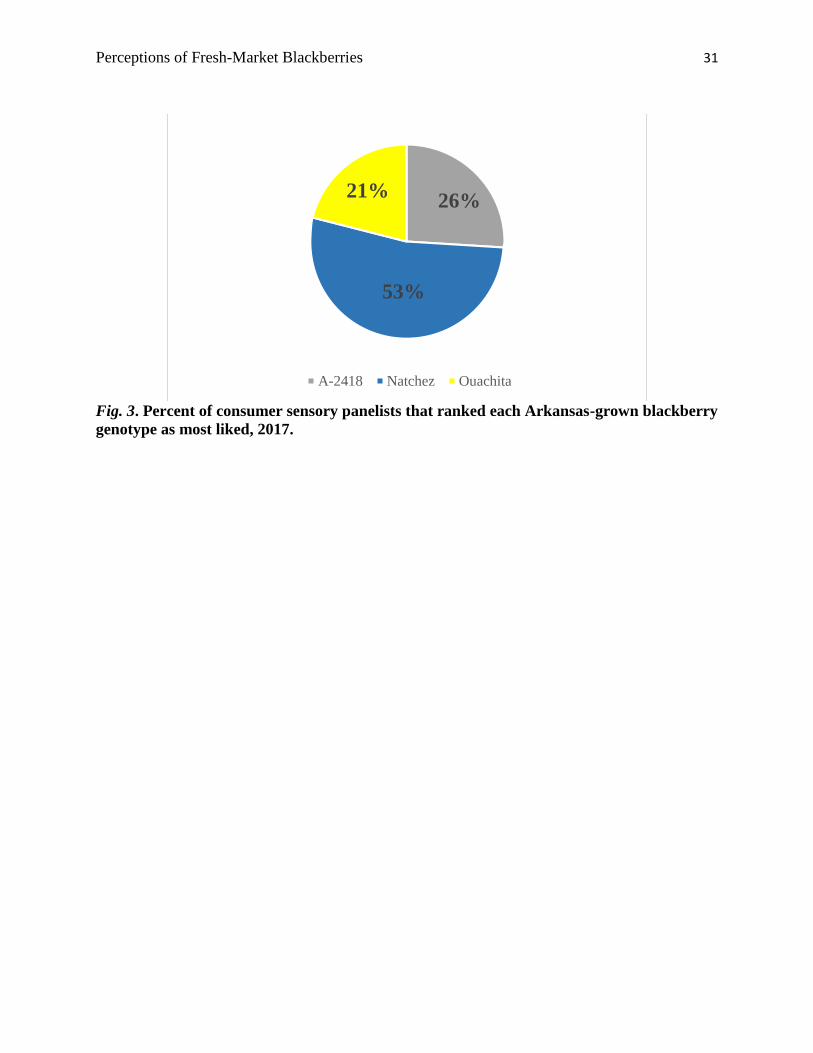
All of the sensory attributes evaluated were scored an average between 5 and
8, where 5 is “neither like nor dislike” and 8 is “like very much” (Table 5). Natchez was liked
significantly more than the other genotypes for overall impression, overall flavor, and sweetness.
The panelists did not detect differences in sourness in the genotypes. Overall impression, overall
flavor, and overall sweetness were not significantly different between A-2418 and Ouachita.
Since there were no differences among genotypes for sourness-liking or between titratable
acidity content levels, it is possible that few, if any, other factors influence consumers’ sourness
perception and that titratable acidity may be the most related factor to the attribute.
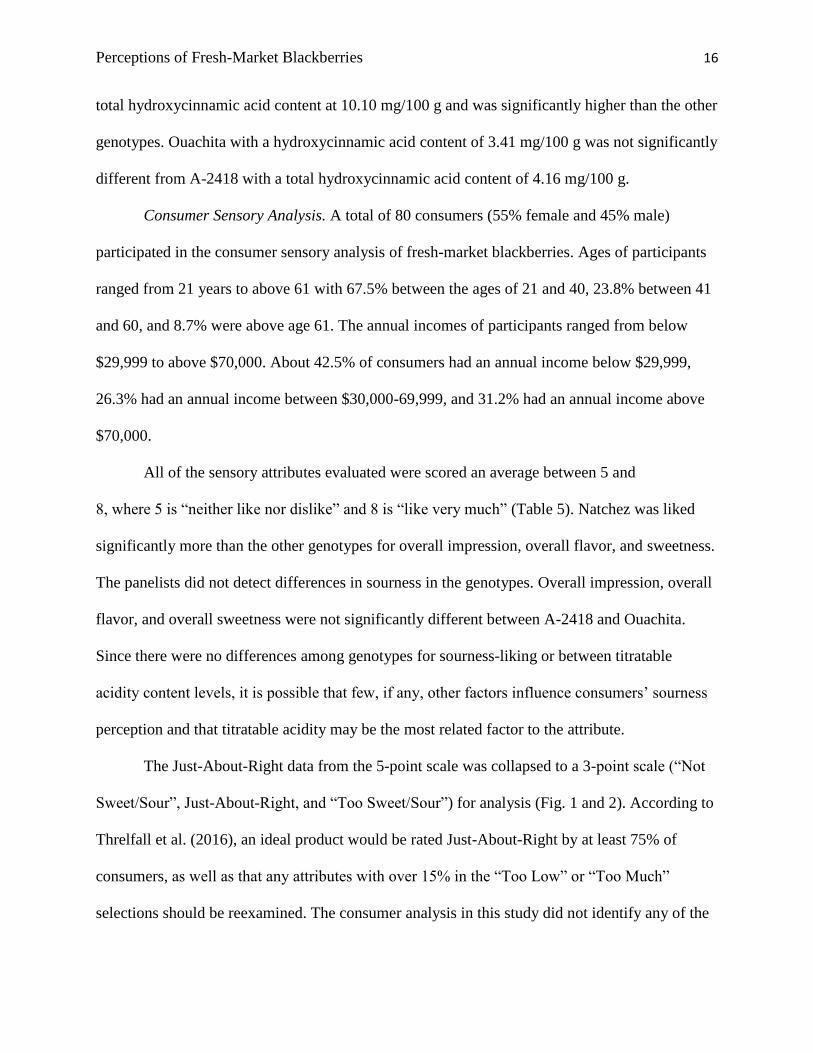
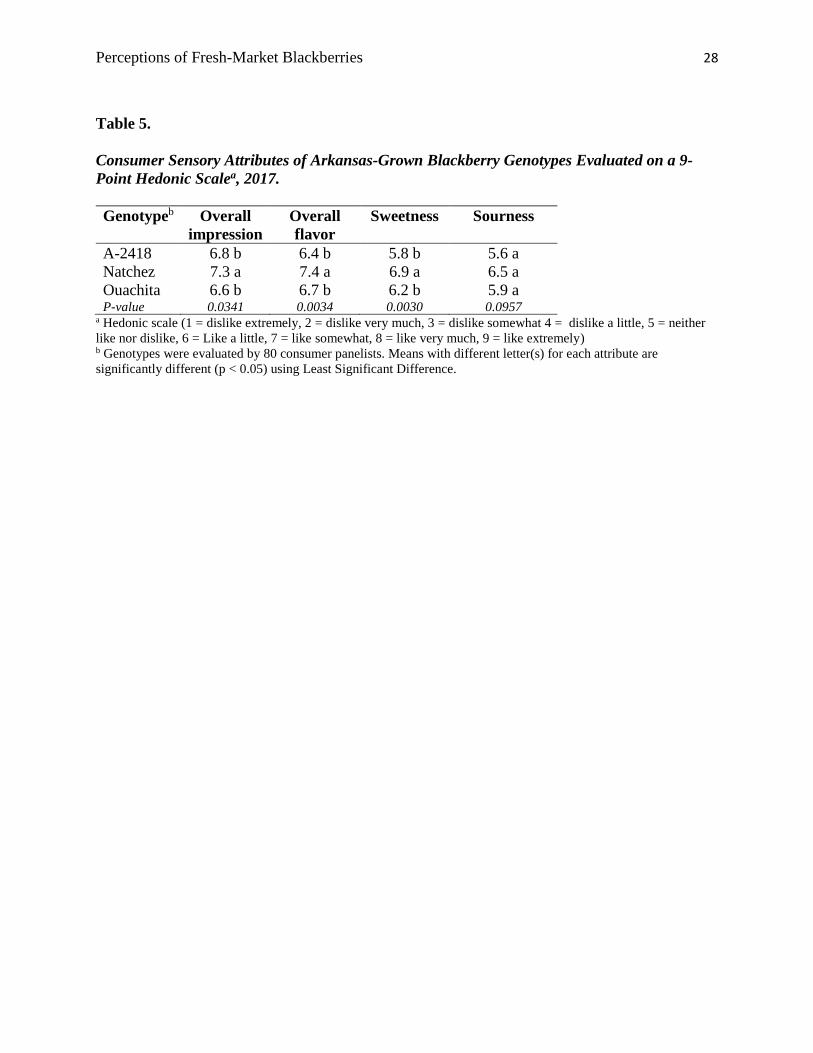
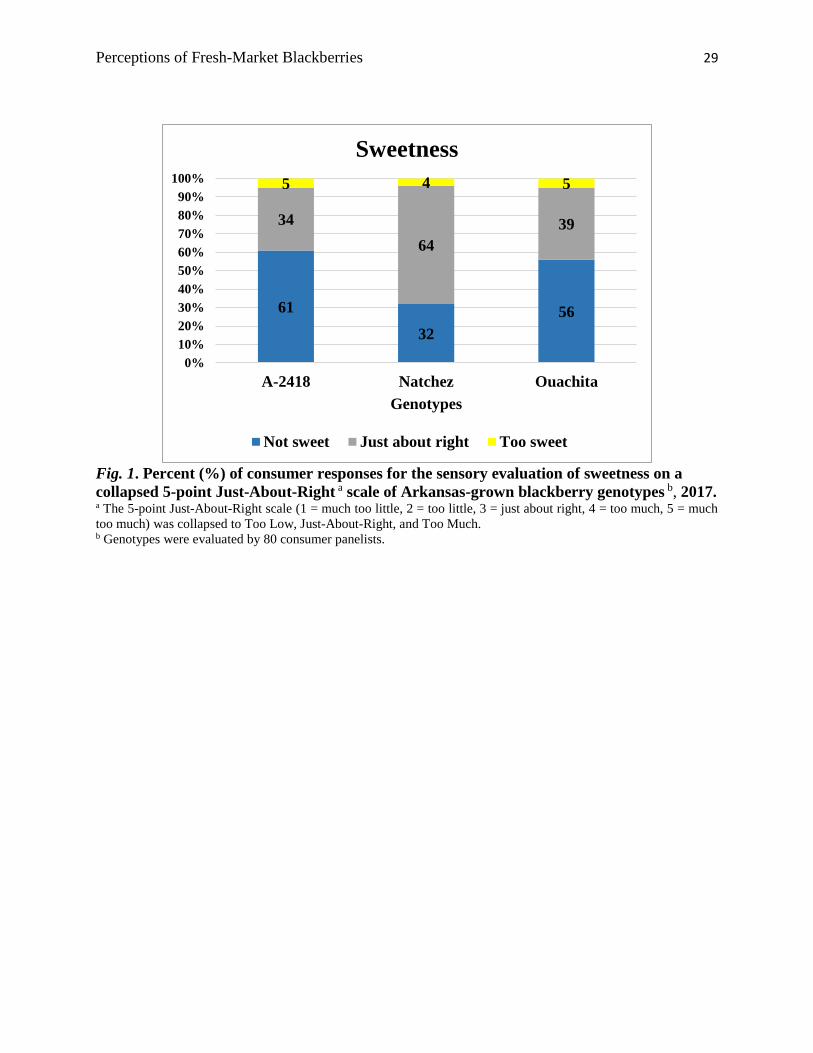
The Just-About-Right data from the 5-point scale was collapsed to a 3-point scale (“Not
Sweet/Sour”, Just-About-Right, and “Too Sweet/Sour”) for analysis (Fig. 1 and 2). According to
Threlfall et al. (2016), an ideal product would be rated Just-About-Right by at least 75% of
consumers, as well as that any attributes with over 15% in the “Too Low” or “Too Much”
selections should be reexamined. The consumer analysis in this study did not identify any of the
Perceptions of Fresh-Market Blackberries 17
genotypes as ideal with 75% for Just-About-Right, but Natchez had Just-About-Right values in
the mid-sixties for both sweetness and sourness. In terms of the sweetness attribute, 64% of
consumers scored Natchez Just-About-Right, followed by Ouachita and A-2418, rated 39% and
34%, respectively (Fig. 1). Only 4–5% of the consumers identified the genotypes in this study as
“Too Sweet”. About 56% and 61% of the consumers found Ouachita and A-2418 “Not Sweet”,
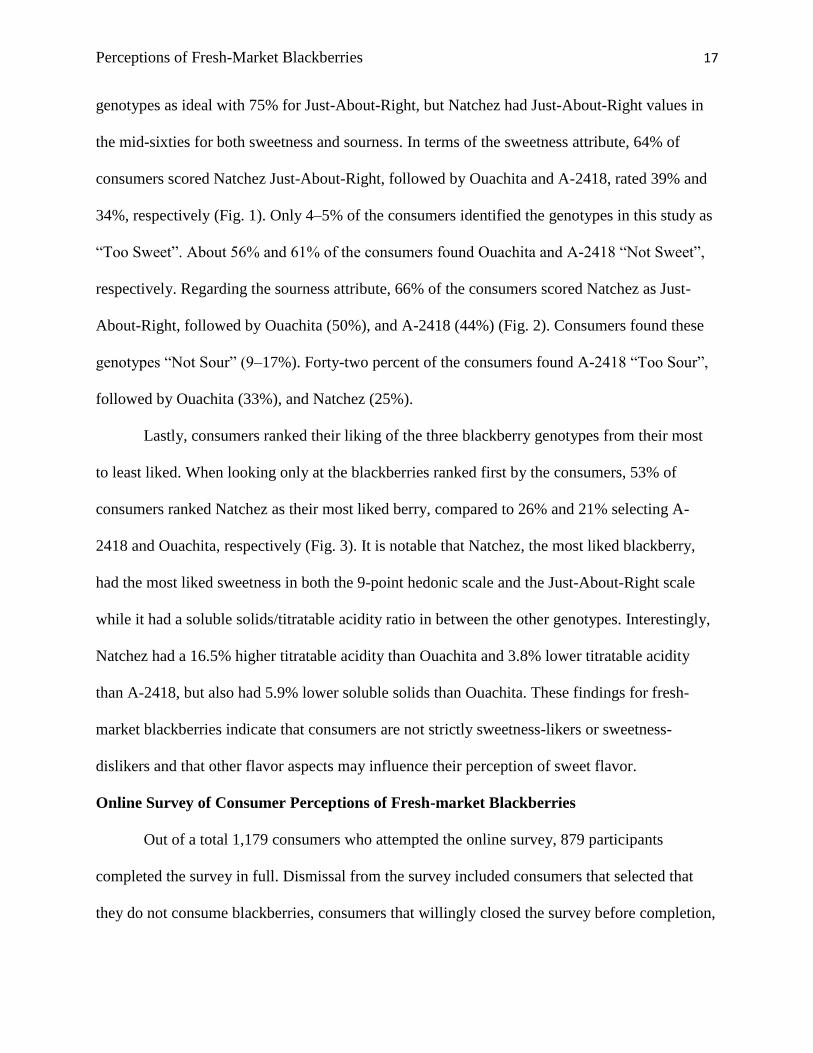
respectively. Regarding the sourness attribute, 66% of the consumers scored Natchez as Just-
About-Right, followed by Ouachita (50%), and A-2418 (44%) (Fig. 2). Consumers found these
genotypes “Not Sour” (9–17%). Forty-two percent of the consumers found A-2418 “Too Sour”,
followed by Ouachita (33%), and Natchez (25%).
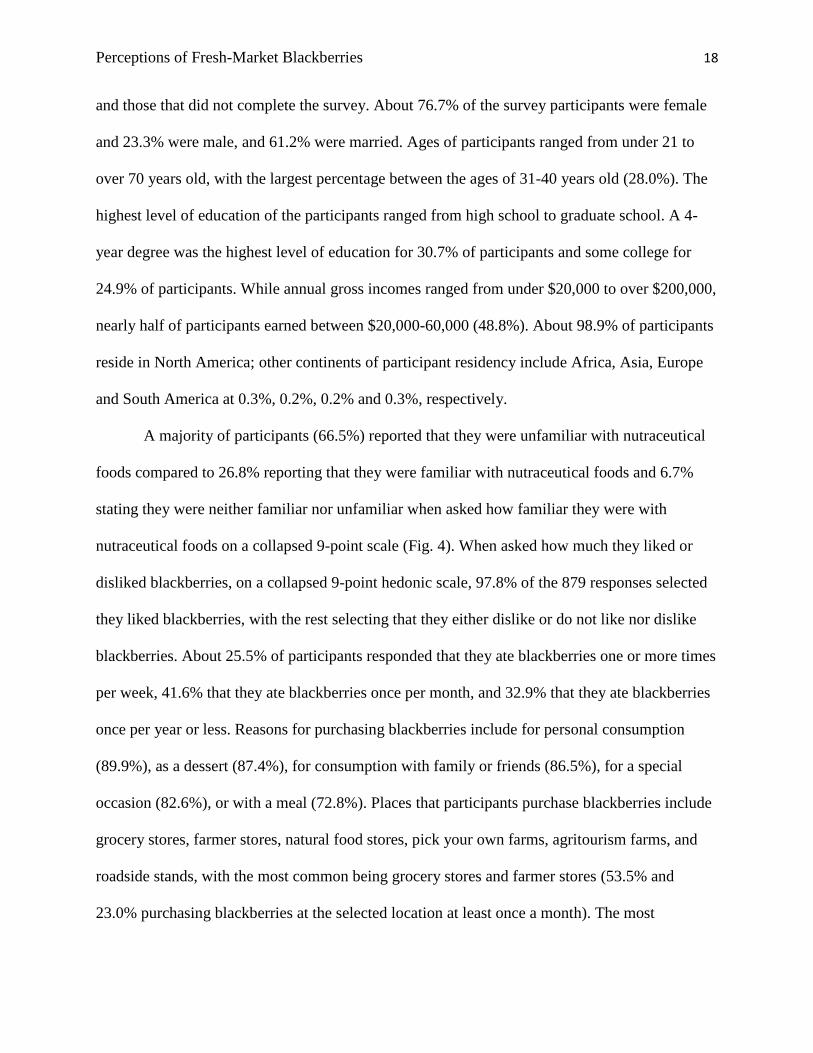
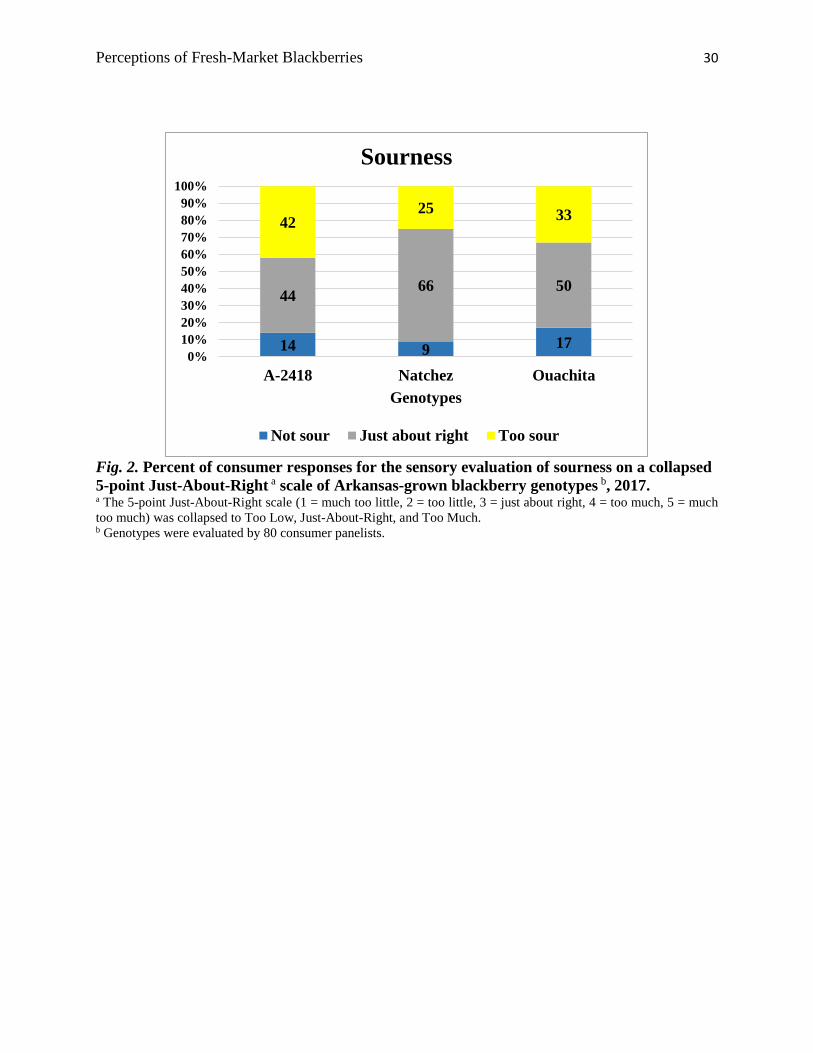
Lastly, consumers ranked their liking of the three blackberry genotypes from their most
to least liked. When looking only at the blackberries ranked first by the consumers, 53% of
consumers ranked Natchez as their most liked berry, compared to 26% and 21% selecting A-
2418 and Ouachita, respectively (Fig. 3). It is notable that Natchez, the most liked blackberry,
had the most liked sweetness in both the 9-point hedonic scale and the Just-About-Right scale
while it had a soluble solids/titratable acidity ratio in between the other genotypes. Interestingly,
Natchez had a 16.5% higher titratable acidity than Ouachita and 3.8% lower titratable acidity
than A-2418, but also had 5.9% lower soluble solids than Ouachita. These findings for fresh-
market blackberries indicate that consumers are not strictly sweetness-likers or sweetness-
dislikers and that other flavor aspects may influence their perception of sweet flavor.
Online Survey of Consumer Perceptions of Fresh-market Blackberries
Out of a total 1,179 consumers who attempted the online survey, 879 participants
completed the survey in full. Dismissal from the survey included consumers that selected that
they do not consume blackberries, consumers that willingly closed the survey before completion,
Perceptions of Fresh-Market Blackberries 18
and those that did not complete the survey. About 76.7% of the survey participants were female
and 23.3% were male, and 61.2% were married. Ages of participants ranged from under 21 to
over 70 years old, with the largest percentage between the ages of 31-40 years old (28.0%). The
highest level of education of the participants ranged from high school to graduate school. A 4-
year degree was the highest level of education for 30.7% of participants and some college for
24.9% of participants. While annual gross incomes ranged from under $20,000 to over $200,000,
nearly half of participants earned between $20,000-60,000 (48.8%). About 98.9% of participants
reside in North America; other continents of participant residency include Africa, Asia, Europe
and South America at 0.3%, 0.2%, 0.2% and 0.3%, respectively.
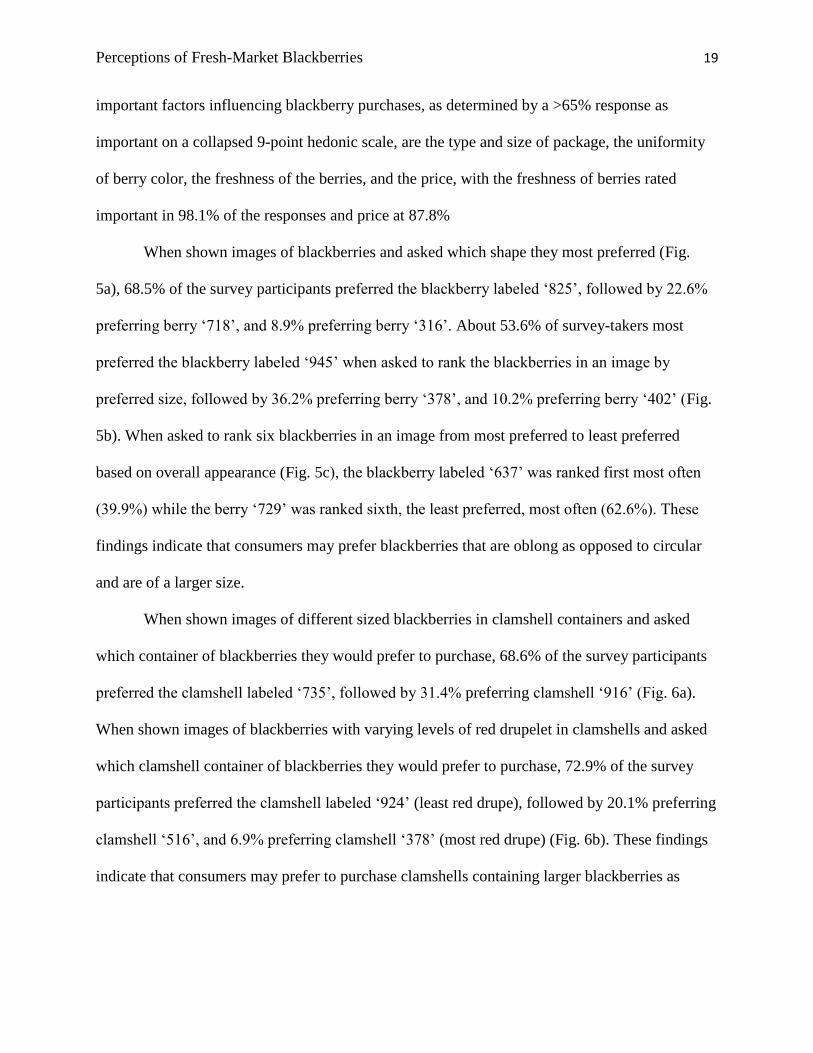
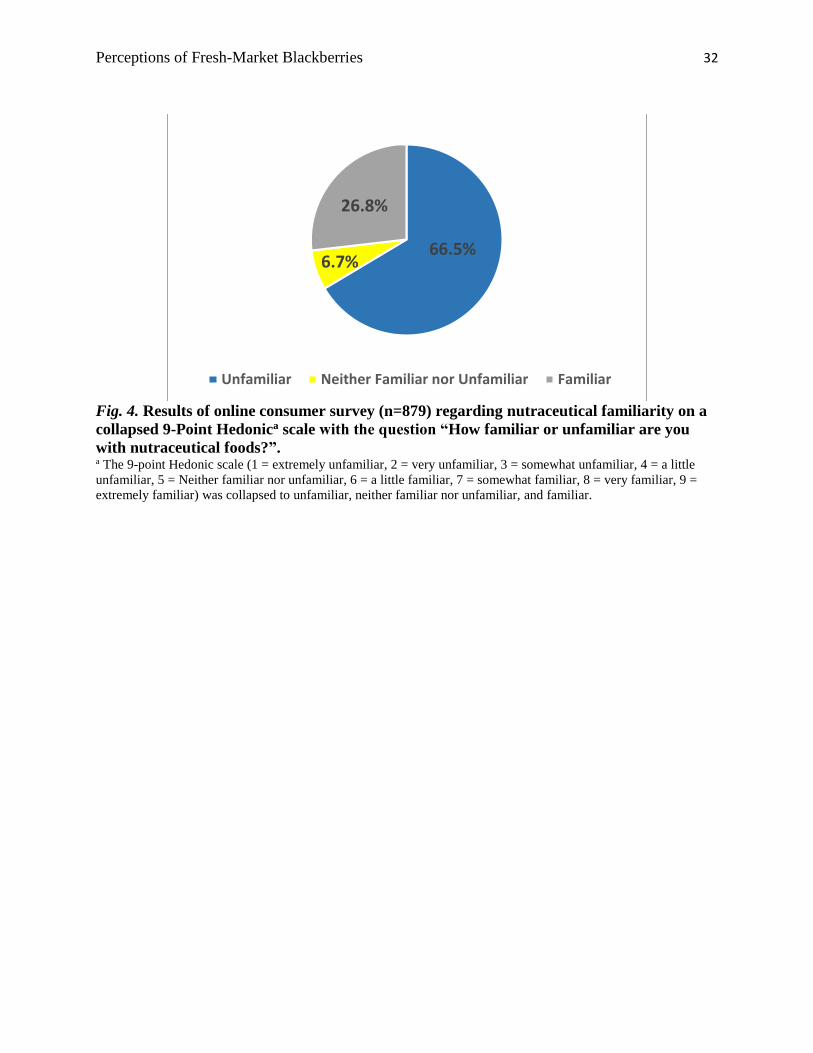
A majority of participants (66.5%) reported that they were unfamiliar with nutraceutical
foods compared to 26.8% reporting that they were familiar with nutraceutical foods and 6.7%
stating they were neither familiar nor unfamiliar when asked how familiar they were with
nutraceutical foods on a collapsed 9-point scale (Fig. 4). When asked how much they liked or
disliked blackberries, on a collapsed 9-point hedonic scale, 97.8% of the 879 responses selected
they liked blackberries, with the rest selecting that they either dislike or do not like nor dislike
blackberries. About 25.5% of participants responded that they ate blackberries one or more times
per week, 41.6% that they ate blackberries once per month, and 32.9% that they ate blackberries
once per year or less. Reasons for purchasing blackberries include for personal consumption
(89.9%), as a dessert (87.4%), for consumption with family or friends (86.5%), for a special
occasion (82.6%), or with a meal (72.8%). Places that participants purchase blackberries include
grocery stores, farmer stores, natural food stores, pick your own farms, agritourism farms, and
roadside stands, with the most common being grocery stores and farmer stores (53.5% and
23.0% purchasing blackberries at the selected location at least once a month). The most
Perceptions of Fresh-Market Blackberries 19
important factors influencing blackberry purchases, as determined by a >65% response as
important on a collapsed 9-point hedonic scale, are the type and size of package, the uniformity
of berry color, the freshness of the berries, and the price, with the freshness of berries rated
important in 98.1% of the responses and price at 87.8%
When shown images of blackberries and asked which shape they most preferred (Fig.
5a), 68.5% of the survey participants preferred the blackberry labeled ‘825’, followed by 22.6%
preferring berry ‘718’, and 8.9% preferring berry ‘316’. About 53.6% of survey-takers most
preferred the blackberry labeled ‘945’ when asked to rank the blackberries in an image by
preferred size, followed by 36.2% preferring berry ‘378’, and 10.2% preferring berry ‘402’ (Fig.
5b). When asked to rank six blackberries in an image from most preferred to least preferred
based on overall appearance (Fig. 5c), the blackberry labeled ‘637’ was ranked first most often
(39.9%) while the berry ‘729’ was ranked sixth, the least preferred, most often (62.6%). These
findings indicate that consumers may prefer blackberries that are oblong as opposed to circular
and are of a larger size.
When shown images of different sized blackberries in clamshell containers and asked
which container of blackberries they would prefer to purchase, 68.6% of the survey participants
preferred the clamshell labeled ‘735’, followed by 31.4% preferring clamshell ‘916’ (Fig. 6a).
When shown images of blackberries with varying levels of red drupelet in clamshells and asked
which clamshell container of blackberries they would prefer to purchase, 72.9% of the survey
participants preferred the clamshell labeled ‘924’ (least red drupe), followed by 20.1% preferring
clamshell ‘516’, and 6.9% preferring clamshell ‘378’ (most red drupe) (Fig. 6b). These findings
indicate that consumers may prefer to purchase clamshells containing larger blackberries as
Perceptions of Fresh-Market Blackberries 20
opposed to clamshells containing smaller blackberries even when the weight of fruit is the same
and that they may prefer blackberries with little to no red drupelets.
Conclusions and Implications
The primary goal of this research was to identify consumer-driven attributes of fresh-
market blackberries and to maximize the potential of Arkansas blackberries by disseminating
findings to various fruit industries. The attributes of sweetness and sourness in blackberries are
important to consumers as they play a large role in consumer acceptability and therefore in
marketability. Natchez was the most liked blackberry and had a medium level of soluble
solids/titratable acidity ratio (medium level of perceived sweetness). Significant differences were
found among blackberry genotypes for sweetness-liking, overall impression, overall flavor, and
ranking. Other factors likely influence the sweetness perception of blackberries as the genotype
with the most Just-About-Right evaluations for sweetness, Natchez, was not significantly
different from the other genotypes and had a soluble solids content that was not different than
Ouachita. The titratable acidity of the genotypes were not significantly different nor were the
sourness evaluations indicating a possible relationship between titratable acidity and consumers’
liking of sourness. These observations introduce the importance of how other factors influence
consumers’ perceptions of sweetness and sourness in fresh-market blackberries. Based upon the
results of this study, it can be said that consumers prefer blackberries with a medium-level
balance of sweetness and sourness over blackberries with high or low sweet/sour ratios, though
due to personal preference and other flavor aspects, there can be consumers that prefer the more
extreme ratios.
Findings from this study demonstrated how many different factors influence consumers’
perception of fresh-market blackberries. Consumers tend to prefer large, oblong blackberries
Perceptions of Fresh-Market Blackberries 21
with a medium-level ratio of sweetness-to-sourness over blackberries that are smaller, are more
spherical in shape or have a markedly high or low level of perceived sweetness, though due to
personal preference and other aspects that influence flavor, some consumers may prefer other
sizes, shapes, and the more extreme ratios. Two of the most important factors influencing
blackberry purchases were the freshness of the berries and the price, both of which can be
adjusted if necessary, to increase the marketability of fresh-market blackberries.
This research has helped strengthen the idea that sweetness and sourness attributes have a
strong impact on consumer acceptability of fresh-market blackberries and provided more
information on what factors are important to consumers. In order to have a more complete idea
of what characteristics influence blackberry marketability, further studies would be necessary.
Identifying marketability attributes of fresh-market blackberries helps provide information to
advance breeding efforts for fruit with commercial potential.
Perceptions of Fresh-Market Blackberries 22
References
Barnett, S. (2007). Blackberry sales up 44% as part of UK soft fruit boom, Haymarket Business
Publications Ltd, Teddington.
California Office of the Agricultural Commissioner (2017). Monterey County Crop Report.
Retrieved from www.co.monterey.ca.us/
Cho, M. J., Howard, L. R., Prior, R. L., and Clark, J. R. (2004). Flavonoid glycosides and
antioxidant capacity of various blackberry, blueberry, and red grape genotypes
determined by high-performance liquid chromatography/mass spectrometry. Journal of
the Science of Food and Agriculture 84, 1771-1782.
Clark, J. R. (2008). Primocane-fruiting blackberry breeding. HortScience 43, 1637-1639.
Clark, J. R. (2005). Changing times for eastern United States blackberries. HortTechnology 15,
491-494.
Clark, J. R. (1999). The blackberry breeding program at the University of Arkansas: thirty-plus
years of progress and developments for the future. Acta Horticulturae 505, 73-77.
Clark, J. R. and Finn, C. E. (2008). New trends in blackberry breeding. Acta Horticulturae 777,
41-48.
Clark, J. R. and Perkins-Veazie, P. (2011). Prime-Ark® 45 primocane-fruiting blackberry.
HortScience 46, 670-673.
Clark, J. R., Stafne, E. T., Hall, H. K., and Finn, C. E. (2007). Blackberry breeding and genetics.
Plant Breeding Reviews 29, 19-144.
Crisosto, H. C. and Crisosto, M. G. (2005). Relationship between ripe soluble solids
concentration (RSSC) and consumer acceptance of high and low acid melting flesh
peach and nectarine [Prunus persica (L.) Batsch] cultivars. Postharvest Biology and
Technology 38, 239-246.
de Souza, V. R., Pereira, P. A. P., de Silva, T. L. T, de Oliveira Lima, L. C., Pio, R., and
Queiroz, F. (2014). Determination of the bioactive compounds, antioxidant activity and
chemical composition of Brazilian blackberry, red raspberry, strawberry, blueberry and
sweet cherry fruits. Food Chemistry 156, 362-368.
Finn, C. E. and Clark, J. R. (2012). Blackberry, p. 151–190. In: M.L. Badenes and D.H. Byrne
(eds.). Handbook of plant breeding, Vol. 8: Fruit breeding. Springer, New York, NY
Flora, L. F. (1979). Optimum quality parameters of muscadine grape juices, beverages, and
blends. Journal of Food Quality 2, 219-229.
Hager, T. J., Howard, L. R., Liyanage, R., Lay, J. O., and Prior, L. R. (2008). Ellagitannin
composition of blackberry as determined by HPLC-ESI-MS and MALDI-TOF-MS.
Journal of Agricultural and Food Chemistry 56, 661-669.
Hager, T., Prior, R., and Howard, L. (2008). Processing and storage effects on monomeric
anthocyanins, percent polymeric color, and antioxidant capacity of processed blackberry
products. Journal of Agricultural and Food Chemistry 56, 689-695.
Hager T., Prior, R., and Howard, L. (2010). Processing and storage effects on the ellagitannin
composition of processed blackberry products. Journal of Agricultural and Food
Chemistry 58, 11749-11754.
Hall, H. K., Stephens, M. J., Stanley, C. J., Finn, C. E., and Yorgey, B. (2002). Breeding new
‘Boysen’ and ‘Marion’ cultivars. Acta Horticulturae 585, 91-95.
Perceptions of Fresh-Market Blackberries 23
Laaksonen, O., Knaapila, A., Niva, T., Deegan, K. C., & Sandell, M. (2016). Sensory properties
and consumer characteristics contributing to liking of berries. Food Quality and
Preference 53, 117-126.
Lewers, K. S., Wang, S. Y., and Vinyard, B. T. (2010). Evaluation of blackberry cultivars and
breeding selections for fruit quality traits and flowering and fruiting dates. Crop Science
50, 2475–2491.
Poll, L. (1981). Evaluation of 18 apple varieties for their suitability for juice production. Journal
of the Science of Food and Agriculture 32, 1081-1090.
Poste, L. M., Mackie, D. A., Butler, G., and Larmond, E. (1991). Laboratory methods for
sensory analysis of food. Research Branch Agriculture Canada Publication, 1864/E.
Reyes‐Carmona, J., Yousef, G. G., Martínez‐Peniche, R. A., and Lila, M. A. (2005). Antioxidant
capacity of fruit extracts of blackberry (Rubus sp.) produced in different climatic regions.
Journal of Food Science 70(7), 497-503.
Sandell, M. A., Tiitinen, K. M., Pohjanheimo, T. A., Kallio, H. P., and Breslin, P. A. S. (2008).
Why naturally healthy berries may be seen as unpleasant and non-appetitive? Food
Flavor 998(19), 219-228.
Segantini, D. M., Threlfall, R., Clark, J. R., Brownmiller, C. R., Howard, L. R., and Lawless, L.
R. (2017). Changes in fresh-market and sensory attributes of blackberry genotypes after
postharvest storage. Journal of Berry Research 7(2), 129-145.
Strik, B. C., Clark, J. R., Finn, C. E., and Bañados, M. P. (2007). Worldwide blackberry
production. HortTechnology 17, 205–213.
Threlfall, R. T., Hines, O. S., Clark, J. R., Howard, L. R., Brownmiller, C. R., Segantini, D. M.,
and Lawless, L. J. R. (2016). Physiochemical and sensory attributes of fresh
blackberries grown in the southeastern united states. Hortscience, 51(11), 1351-1362.
Walker, T., Morris, J., Threlfall, R., and Main, G. (2003). Analysis of wine components in
Cynthiana and Syrah wines. J. Agri. Food Chem. 51, 1543-1547.
U.S. Department of Agriculture (USDA). (2017). National agricultural statistics service,
blackberry statistics.
https://www.nass.usda.gov/Statistics_by_Subject/index.php?sector=CROPS
Perceptions of Fresh-Market Blackberries 24
Table 1.
Berry and Pyrene Attributes of Arkansas-Grown Blackberry Genotypes, 2017.
Genotype a
Berry
weight
(g)
Berry
length
(mm)
Berry
width
(mm)
Drupelets/
berry
Pyrenes/
berry
Pyrene
weight (g)/
berry
A-2418 6.73 ab 26.73 b 20.50 a 73.40 b 75.11 b 0.27 b
Natchez 8.18 a 30.17 a 22.10 a 91.07 a 111.45 a 0.38 a
Ouachita 6.28 b 23.83 c 21.17 a 62.33 b 81.89 b 0.21 c
P-value 0.0246 0.0013 0.1249 0.0037 0.0095 0.0003 a Five berries per genotype (A-2418 from Clarksville and Natchez and Ouachita from Fayetteville, AR) were
evaluated in triplicate. Means with different letter(s) for each attribute are significantly different (p < 0.05) using
Tukey’s Honestly Significant Difference.
Perceptions of Fresh-Market Blackberries 25
Table 2.
Composition Attributes of Arkansas-Grown Blackberry Genotypes, 2017.
a Three berries per genotype were evaluated in triplicate. Means with different letter(s) for each attribute are
significantly different (p < 0.05) using Tukey’s Honestly Significant Difference. b Calculated as percent citric acid.
Genotypea Soluble
solids
(%)
pH Titratable
acidity
(%)b
Soluble
solids/titratable
acidity ratio
A-2418 8.20 b 3.03 a 1.32 a 6.25 b
Natchez 11.20 a 2.79 b 1.27 a 8.93 ab
Ouachita 11.90 a 3.18 a 1.09 a 10.92 a P-value 0.0005 0.0010 0.1400 0.0069
Perceptions of Fresh-Market Blackberries 26
Table 3.
Organic Acids and Sugars of Arkansas-Grown Blackberry Genotypes, 2017.
Genotype a Isocitric
acid
(g/100 g)
Isocitric
lactone acid
(g/100 g)
Malic
acid
(g/100 g)
Glucose
(g/100 g)
Fructose
(g/100 g)
A-2418 1.34 a 0.14 a 0.58 a 3.53 a 3.68 a
Natchez 0.46 a 0.13 a 0.10 a 1.95 a 1.90 a
Ouachita 0.69 a 0.15 a 0.27 a 3.15 a 3.07 a P-value 0.1525 0.9117 0.1793 0.3740 3.416
a Three berries per genotype were evaluated in triplicate. Means with different letter(s) for each attribute are
significantly different (p < 0.05) using Tukey’s Honestly Significant Difference.
Perceptions of Fresh-Market Blackberries 27
Table 4.
Nutraceuticals of Arkansas-Grown Blackberry Genotypes, 2017.
Genotype b
Total
anthocyanins
(mg/100 g)
Total
flavonols
(mg/100 g)
Total
ellagitannins
(mg/100 g)
Total
hydroxycinnamic
acids
(mg/100 g)
A-2418 167.68 a 11.40 a 9.26 a 4.16 b
Natchez 200.10 a 13.54 a 9.40 a 10.10 a
Ouachita 125.75 a 10.78 a 7.94 a 3.41 b
P-value 0.0744 0.3347 0.5952 0.0098
aNutraceuticals of blackberries calculated as fresh weight for total ellagitannins (mg ellagic acid equivalents/100 g);
total flavonols expressed as mg rutin equivalents/100 g); total anthocyanins expressed as (mg cyanidin 3-glucoside
[acy]/100 g); total hydroxycinnamic acids expressed as mg chlorogenic acid equivalents/100 g). b Three berries per genotype were evaluated in triplicate. Means with different letter(s) for each attribute are
significantly different (p < 0.05) using Tukey’s Honestly Significant Difference.
Perceptions of Fresh-Market Blackberries 28
Table 5.
Consumer Sensory Attributes of Arkansas-Grown Blackberry Genotypes Evaluated on a 9-
Point Hedonic Scalea, 2017.
Genotypeb Overall
impression
Overall
flavor
Sweetness Sourness
A-2418 6.8 b 6.4 b 5.8 b 5.6 a
Natchez 7.3 a 7.4 a 6.9 a 6.5 a
Ouachita 6.6 b 6.7 b 6.2 b 5.9 a P-value 0.0341 0.0034 0.0030 0.0957
a Hedonic scale (1 = dislike extremely, 2 = dislike very much, 3 = dislike somewhat 4 = dislike a little, 5 = neither
like nor dislike, 6 = Like a little, 7 = like somewhat, 8 = like very much, 9 = like extremely) b Genotypes were evaluated by 80 consumer panelists. Means with different letter(s) for each attribute are
significantly different (p < 0.05) using Least Significant Difference.
Perceptions of Fresh-Market Blackberries 29
Fig. 1. Percent (%) of consumer responses for the sensory evaluation of sweetness on a
collapsed 5-point Just-About-Right a scale of Arkansas-grown blackberry genotypes b, 2017. a The 5-point Just-About-Right scale (1 = much too little, 2 = too little, 3 = just about right, 4 = too much, 5 = much
too much) was collapsed to Too Low, Just-About-Right, and Too Much. b Genotypes were evaluated by 80 consumer panelists.
61
32
56
34
64
39
5 4 5
0%
10%
20%
30%
40%
50%
60%
70%
80%
90%
100%
A-2418 Natchez Ouachita
Genotypes
Sweetness
Not sweet Just about right Too sweet
Perceptions of Fresh-Market Blackberries 30
Fig. 2. Percent of consumer responses for the sensory evaluation of sourness on a collapsed
5-point Just-About-Right a scale of Arkansas-grown blackberry genotypes b, 2017. a The 5-point Just-About-Right scale (1 = much too little, 2 = too little, 3 = just about right, 4 = too much, 5 = much
too much) was collapsed to Too Low, Just-About-Right, and Too Much. b Genotypes were evaluated by 80 consumer panelists.
14 9 17
4466 50
4225 33
0%
10%
20%
30%
40%
50%
60%
70%
80%
90%
100%
A-2418 Natchez Ouachita
Genotypes
Sourness
Not sour Just about right Too sour
Perceptions of Fresh-Market Blackberries 31
Fig. 3. Percent of consumer sensory panelists that ranked each Arkansas-grown blackberry
genotype as most liked, 2017.
26%
53%
21%
A-2418 Natchez Ouachita
Perceptions of Fresh-Market Blackberries 32
Fig. 4. Results of online consumer survey (n=879) regarding nutraceutical familiarity on a
collapsed 9-Point Hedonica scale with the question “How familiar or unfamiliar are you
with nutraceutical foods?”. a The 9-point Hedonic scale (1 = extremely unfamiliar, 2 = very unfamiliar, 3 = somewhat unfamiliar, 4 = a little
unfamiliar, 5 = Neither familiar nor unfamiliar, 6 = a little familiar, 7 = somewhat familiar, 8 = very familiar, 9 =
extremely familiar) was collapsed to unfamiliar, neither familiar nor unfamiliar, and familiar.
66.5%6.7%
26.8%
Unfamiliar Neither Familiar nor Unfamiliar Familiar
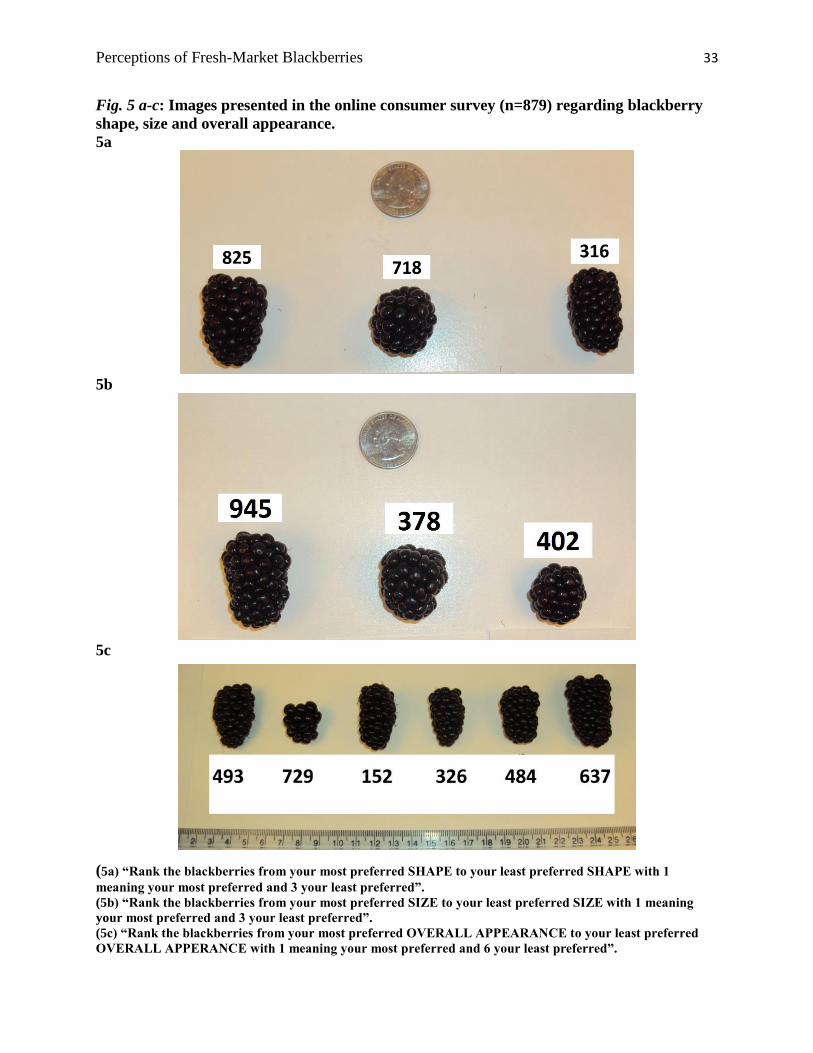
Perceptions of Fresh-Market Blackberries 33
Fig. 5 a-c: Images presented in the online consumer survey (n=879) regarding blackberry
shape, size and overall appearance.
5a
5b
5c
(5a) “Rank the blackberries from your most preferred SHAPE to your least preferred SHAPE with 1
meaning your most preferred and 3 your least preferred”.
(5b) “Rank the blackberries from your most preferred SIZE to your least preferred SIZE with 1 meaning
your most preferred and 3 your least preferred”.
(5c) “Rank the blackberries from your most preferred OVERALL APPEARANCE to your least preferred
OVERALL APPERANCE with 1 meaning your most preferred and 6 your least preferred”.
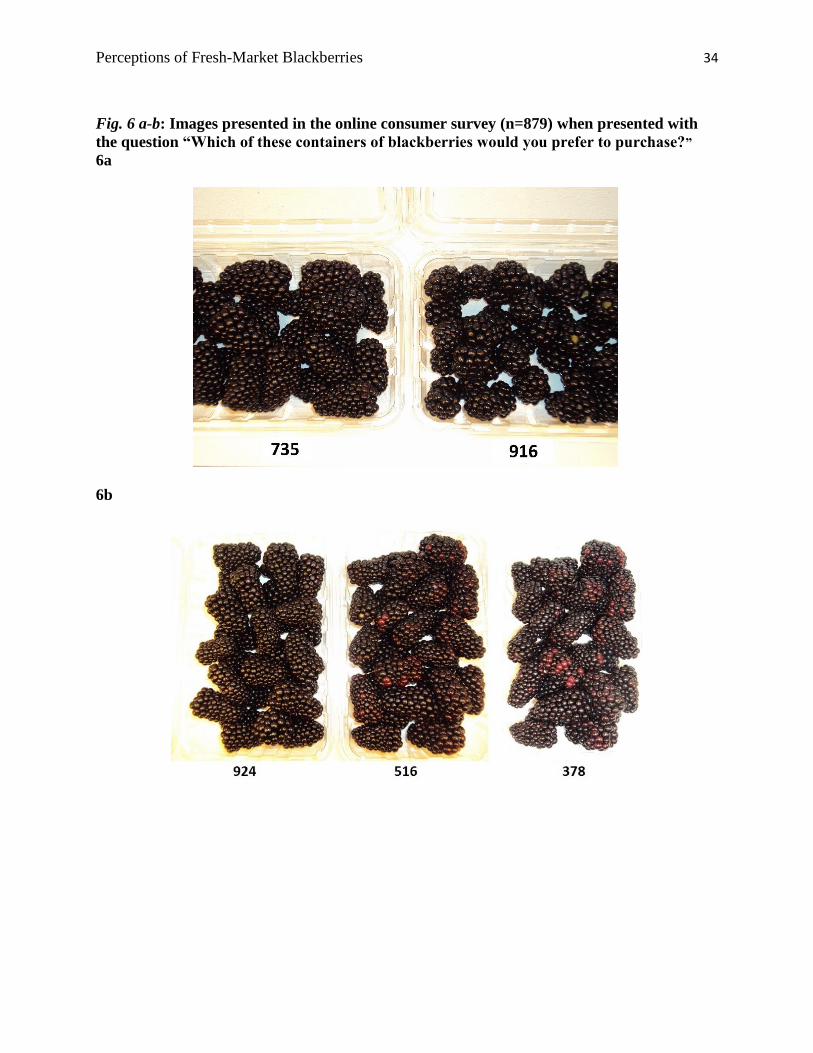
Perceptions of Fresh-Market Blackberries 34
Fig. 6 a-b: Images presented in the online consumer survey (n=879) when presented with
the question “Which of these containers of blackberries would you prefer to purchase?”
6a
6b