Embed Size (px)
Citation preview

PolymerChemistry
COMMUNICATION
Cite this: Polym. Chem., 2021, 12,177
Received 27th August 2020,Accepted 14th December 2020
DOI: 10.1039/d0py01220c
rsc.li/polymers
Identifying and mapping chemical bonding withinphenolic resin using secondary electronhyperspectral imaging†
Nicholas T. H. Farr, *a,b Sameer F. Hamad,a Euan Gray,a
Christopher M. Magazzeni,c Fodio Longman,a David E. J. Armstrong,c
Joel P. Foreman,a Frederik Claeyssens,a Nicola H. Green a,b andCornelia Rodenburg a
The distributions of methylene and ether bridges have been shown
to impact the mechanical properties of phenolic resin. This work
demonstrates the ability of the novel SEM based technique, sec-
ondary electron hyperspectral imaging (SEHI), to characterise and
map methylene and ether bridges within phenolic resin at the
nanoscale.
Phenolic resins are a group of the most versatile polymers everformulated. Although they were first produced around 1907and were consequently one of the first polymers commerciallyavailable, they have been in constant development and useever since and are widely used in various applications.1 Arecent review article highlighted the deployment prospects ofphenolic resin and evaluated where future research shouldfocus to further increase and improve the potential of phenolicresins for future industrial applications.2 The article high-lighted that improving phenolic resin’s heat resistance andreducing brittleness are key enablers to future deploymentopportunities. Demands from the aerospace industry andother industries with challenging environmental conditionsraise the requirement to improve the long-term high-tempera-ture oxidation resistance of phenolic resin.3 Historical studieshave long establishing how novel synthesis interventions canaugment the material’s properties by altering the macromol-ecular structure of phenolic resin.4,5
Research focused on increasing phenolic resin’s thermalstability with the aim of producing ‘tougher’ forms of phenolicresin has shown success by optimising the distribution ofvoids in the resins.6 Alternative approaches to addressingknown ‘brittleness issues’ within phenolic resin,7,8 have also
shown success through the inclusion of substances such as,rubber, glass fibres and thermoplastic resins.9–11
Further work towards delivering ‘tougher’ phenolic resinshas investigated altering the polymer network of the resin bychanging the bonding ratios of methylene and etherbridges.12,13 This work has identified improvements to theefficiency of the resin’s production process which also mitigateenvironmental concerns of current practice. It has beenobserved that the quantity of ether bridges forming within theresin increases when the F : P (formaldehyde : phenol) ratioincreases and, depending on processing conditions, highnumbers of ether linkages14 reduce the strength of the curedresin.15
Despite the improved functionality of such resin moreefficient and potentially greener ways of improving toughnessof phenolic resin have come from studies targeted at alteringthe polymer network of phenolic resin by changing thebonding ratios of methylene and ether bridges have also deli-vered tougher materials.12,13 The proportion of ether bridgesrises with increases in the F : P (formaldehyde : phenol) ratio,with an excessive amount of ether linkages14 reducing thestrength of the cured resin.15 It is important to note that pro-cessing conditions are also influential on the final strength ofthe cured resin.
Fast acting catalysts reduce the resin’s curing time andimpart “void like” structures.6 This is in contrast to phenolicresins that are required to be produced free from voids whichtypically require intensive curing processes using multipleheating cycles.
Such processes carry the disadvantage of slower curingcycles that create extra formaldehyde emissions. Future optimi-sation of phenolic resin properties requires an understandingof how these processes affect the material’s structure at thenanoscale. The ability to map chemical bonding changes atthe nanoscale would enable polymer scientists to better con-struct and optimise processes’ designed to alter the bondingratios of methylene and ether bridges observed in phenolicresin.
†Electronic supplementary information (ESI) available. See DOI: 10.1039/d0py01220c
aDepartment of Materials Science and Engineering, Sir Robert Hadfield Building,
Mappin Street, University of Sheffield, UK. E-mail: [email protected] Institute for in Silico Medicine, The Pam Liversidge Building, Sir Robert
Hadfield Building, Mappin Street, Sheffield, UKcDepartment of Materials, University of Oxford, Parks Road, Oxford, UK
This journal is © The Royal Society of Chemistry 2021 Polym. Chem., 2021, 12, 177–182 | 177
Ope
n A
cces
s A
rtic
le. P
ublis
hed
on 1
5 D
ecem
ber
2020
. Dow
nloa
ded
on 3
/14/
2022
7:4
8:29
AM
. T
his
artic
le is
lice
nsed
und
er a
Cre
ativ
e C
omm
ons
Attr
ibut
ion
3.0
Unp
orte
d L
icen
ce.
View Article OnlineView Journal | View Issue
Secondary electron hyperspectral imaging (SEHI) is a noveltechnique built on SE spectroscopy and has been used for char-acterising the surface chemistry of innovative polymeric bioma-terials.16 A scanning electron microscope’s (SEM) ability todetect secondary electrons (SEs) emissions from a materialsample is the basis for SEHI. A series of images collected fromselected SE energy bands is constructed to form the SEHIimages stacks. This is in contrast to a standard SEM whichassembles a single image with SEs of all energies contributingto it. SEHI delivers novel characterisation insights by creating awide-ranging SE spectral representation of the sample material.A number of research studies have demonstrated SEHI’s effec-tiveness including; molecular orientation of organic electronicdevices,17 semi-crystalline polymer mapping and naturalmaterials nanostructure variations18 but has not yet beenapplied to the mapping of ether or methylene bridges.
This study focuses on analysing the chemical bondingstructure of a form of phenolic resin, PR382. PR382 hasrecently been produced6 with the design aim of minimisinglosses in desirable mechanical properties which occur as aconsequence of using typical current resin production pro-cesses. This is achieved by substituting a new faster curing,more cost effective and environmentally friendlier fast curingcycle based production process. Analysis of phenolic resinrequires the ability to map the chemical bonding distributionwithin the resin through the application of the SEHI tech-nique. The emphasis of this study is mapping and showingsensitivity to specific bonding mechanisms that are presentwithin the phenolic resin sample post synthetic intervention,as an example of how the SEHI technique can provide anenhanced understanding of micron – nano scale structures.This work establishes that the voids created as the phenolicresin cures in response to a slow acting acid catalyst, are afocus for a high level of CO bonding attributable to etherbridge formation around the voids sites.
Materials and methodsMaterials
In this study, the resole commercial phenolic resin CellobondJ2027X pre-polymer was used (supplied by Caleb TechnicalProducts Ltd, UK). This kind of resin is usually available as awater-based controlled-viscosity resin, which can be curedeither with the application of heat only using long cure cycle(3–4 days) or with the use of a strong acid catalyst, short curecycle (3 h) at low temperature (∼60 °C). It is suitable for thefabrication of fibre composites by hand layup and resin trans-fer molding. Catalyst (Cellobond Phencat 382), supplied by thesame company (Caleb Technical Products Ltd, UK), was usedin this study. Phencat 382 is a relatively slow action acid cata-lyst (working life ∼4 h), which is activated at low temperature,typically 60–80 °C. It is an acid-based catalyst consisting of,C3–9-alkyl esters (75–90%) and phosphoric acid (10–25%) byweight. A short cure cycle was selected where the resole pheno-lic resin was initially mixed with slow action acid catalyst
(Phencat 382) then decanted into the PTFE mold to be placedin an autoclave for polymerisation. The catalyst ratio was5 wt% of the resin. Phenolic resin samples were fractured toallow for analysis of the cross-section of the material.
Methods
Imaging. Phenolic resin samples were fractured and placedon a carbon tab on an aluminium stub ready for SEM imaging.Observation of the fracture surface morphology of the flexuralstrength samples (PR382) was performed using a ScanningElectron Microscope (FEI Nova Nano 450 SEM). The PR382samples were not subject to deposition of conductive coating,in contrast to usual polymers SEM analysis practice. To avoidsurface charging and consequent damage to the sample a lowaccelerating voltage (1 kV) with typical vacuum pressure of10−5 mbar at a working distance of 3 mm was applied. AnEverhart–Thornley Detector (ETD) for low magnificationimages and a Through Lens Detector (TLD) for high magnifi-cation images were used for the collection of SE images.
SEHI acquisition and image processing. The FEI Nova Nano450 SEM is provided with a through lens detector whichincludes a voltage controlled deflector electrode. The deflectorelectrode channels the signal into the SE detector. The deflec-tor electrode is set to a predetermined deflector voltages andan image is generated for each deflector voltage (more detailedinformation provided in ESI†). Spectra and hyperspectralimages are acquired through post-processing of such imageseries. Stage bias experiments have been performed to allowenergy calibration of this process through experiments.17,19
Fiji software was utilised to perform image processing.20
Histogram and spectral off-set normalisation21 has beenapplied retrospectively to optimise all images for brightnessand contrast, and to limit the effects of differing sample workfunctions. The work function of a material is the minimumenergy required to remove an electron from the solid tooutside the solids surface within a vacuum. Once S-curves havethen been obtained they are differentiated to produce the SEcurves. Component analysis was then preformed to imagestacks utilising non negative matrix factorization (nnmf) toisolate components of interest.
Theoretical grounds of secondary electron spectroscopy(SES). A typical SE spectra is a plot of the number of electronsdetected within a specific energy range. Each chemical func-tional group produces a set of characteristic peaks in the SEspectra (SES).16 Based on knowledge of functional groups,material properties can also be inferred from the measurementof the kinetic energy and the number of the emitted SEs insome circumstances. SEHI can be summarised as a techniquethat is responsive to surfaces and is capable of imaging beamsensitive materials by resolving chemical, compositional andstructural properties at the nanoscale level – depending on theenergy range used for imaging. SEHI is proposed as aneffective microanalysis tool for nanostructured polymers withthe ability of mapping chemical functional groups of particu-lar interest. More information on the theoretical grounds forprobe-sample analysis and SES are given in the ESI.†
Communication Polymer Chemistry
178 | Polym. Chem., 2021, 12, 177–182 This journal is © The Royal Society of Chemistry 2021
Ope
n A
cces
s A
rtic
le. P
ublis
hed
on 1
5 D
ecem
ber
2020
. Dow
nloa
ded
on 3
/14/
2022
7:4
8:29
AM
. T
his
artic
le is
lice
nsed
und
er a
Cre
ativ
e C
omm
ons
Attr
ibut
ion
3.0
Unp
orte
d L
icen
ce.
View Article Online

Results and discussion
To illustrate the chemical bonding variations within PR382, SEspectra given in Fig. 1 represent spectra captured from threedifferent areas (1, 2 and 3) across the cross-sectioned material.Each area’s SEM field of view is included to show the exactregion of analysis. Area 3 differs by virtue of its increased mag-nification which allows analysis of a single void site of interest.
Previous studies have isolated the energy range of 1.4–2.3 eVto the molecular order of polymers.22 An increase in peakintensity in this range indicates an increased molecular order,indicative of the material being more crystalline. Areas 1 & 2show a higher intensity level when compared to area 3. Area 3is therefore disordered, as we do not observe any sharp peakswithin 1.4–2.3 eV range. These observed differences are due toareas 1 and 2 both encompassing a greater density of curedcross-linked networks than that of area 3 which focuses on asingular void site.
SE spectra analysis can provide for comparisons to bedrawn regarding crosslinking networks. The SE emission cap-tured in this study for areas 1 and 2 exhibited a greater SEemission in the energy range associated with CH vibrationsand –OH groups16,23,24 when compared to that of area 3. The
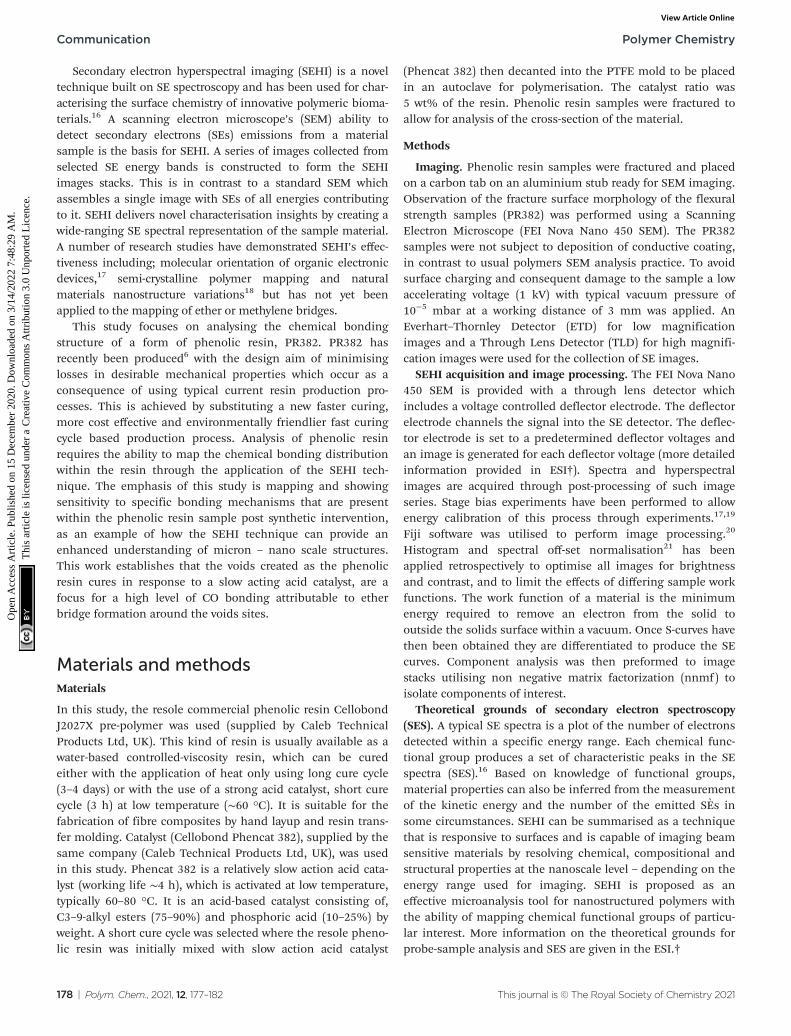
increase of CH2 and –OH formation in this polymer systemindicates the presence of methylene bridges. Results obtainedfrom the raw SE spectra display an increase in CH vibrations.The data given in Fig. 2A, shows an increase in –OH groups(when all areas are normalised to CH peak emission). Thesetwo results provide evidence to support the conclusion thatareas 1 and 2 contain a greater density of methylene bridgesthan area 3.
All three areas show emissions within the SE emissionregion associated with C–O bonding. C–O bonding in area 3displays the strongest emission ratios (when all areas are nor-malised to their respective CH emissions peak) compared toareas 1 and 2. As C–O bonding in phenolics is related to etherbridges (see Fig. 2B), area 3 possesses a large density of etherbridges compared to area 1 and 2. Fig. 2B shows the chemicalbond formation of the two common types of crosslinkspresent within phenolic resin. Fig. 2B(1) depicts the variousexample structures of methylene bridges formation which isthe most common form of crosslink with phenolic resin net-works.15 Fig. 2B(2) depicts the formation of ether bridgeswhich are less commonly found within phenolic resin.
From the SE spectra results it can be assumed that this isconsistent with areas 1 & 2 having a greater matrix (areas away
Fig. 1 Secondary electron spectra with accompanying SEM images for PR382 area 1, 2 and 3 highlighting SE regions identified as associated withfunctional group emissions. Area 1 & 2 HFW = 30 μm whereas area 3 HFW = 25 μm.
Polymer Chemistry Communication
This journal is © The Royal Society of Chemistry 2021 Polym. Chem., 2021, 12, 177–182 | 179
Ope
n A
cces
s A
rtic
le. P
ublis
hed
on 1
5 D
ecem
ber
2020
. Dow
nloa
ded
on 3
/14/
2022
7:4
8:29
AM
. T
his
artic
le is
lice
nsed
und
er a
Cre
ativ
e C
omm
ons
Attr
ibut
ion
3.0
Unp
orte
d L
icen
ce.
View Article Online
from voids) concentration in the analysed field of view whichwill consequently have more (CH2, –OH) linked methylenebridges. Thus the SE spectra results show that areas 1 and 2contain a higher density of methylene bridges than area 3 andalso display a greater molecular order SE peak than area 3compared to area 3. Methylene bridges possess a shorter brid-ging length when compared to that of ether bridges, whichhas a greater number of atoms between its phenyl rings.Therefore, phenolic resin with a greater ratio of methylenebridges to ether bridges would present a more ordered struc-ture by virtue of ether bridges having a higher number ofrotational degrees of freedom and being inherently flexible(see Fig. 3). The difference in chain length could also explainwhy there is a higher concentration of –OH detected as thephenyl rings appear more densely packed.
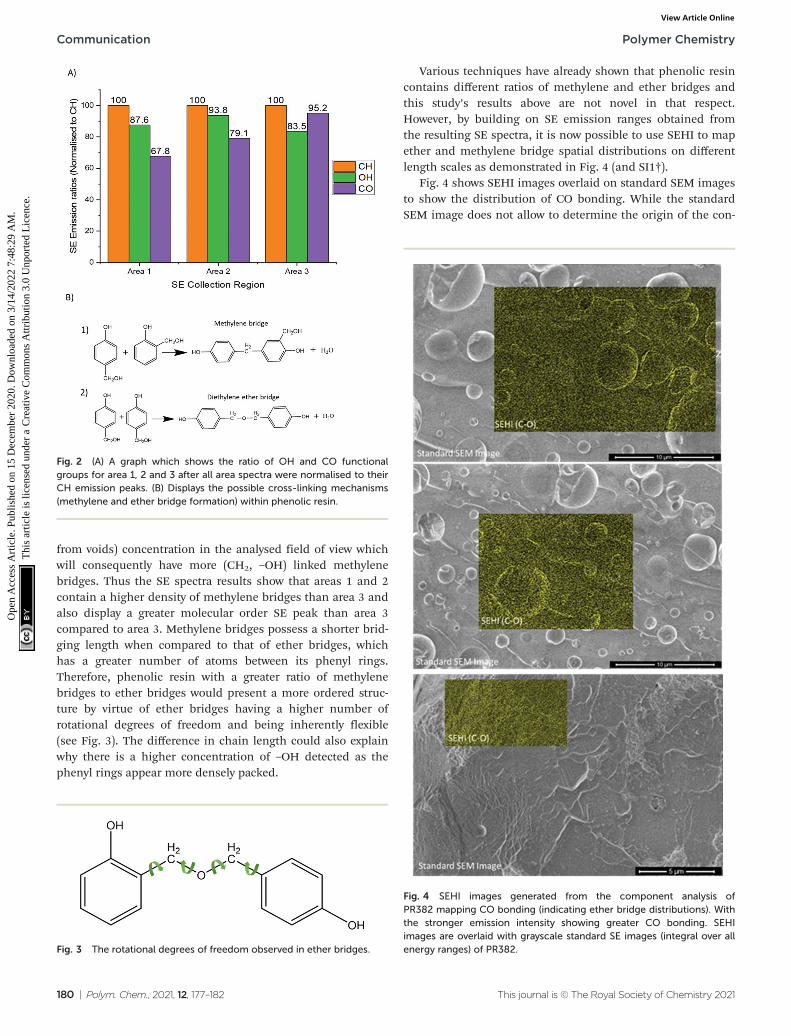
Various techniques have already shown that phenolic resincontains different ratios of methylene and ether bridges andthis study’s results above are not novel in that respect.However, by building on SE emission ranges obtained fromthe resulting SE spectra, it is now possible to use SEHI to mapether and methylene bridge spatial distributions on differentlength scales as demonstrated in Fig. 4 (and SI1†).
Fig. 4 shows SEHI images overlaid on standard SEM imagesto show the distribution of CO bonding. While the standardSEM image does not allow to determine the origin of the con-
Fig. 2 (A) A graph which shows the ratio of OH and CO functionalgroups for area 1, 2 and 3 after all area spectra were normalised to theirCH emission peaks. (B) Displays the possible cross-linking mechanisms(methylene and ether bridge formation) within phenolic resin.
Fig. 3 The rotational degrees of freedom observed in ether bridges.
Fig. 4 SEHI images generated from the component analysis ofPR382 mapping CO bonding (indicating ether bridge distributions). Withthe stronger emission intensity showing greater CO bonding. SEHIimages are overlaid with grayscale standard SE images (integral over allenergy ranges) of PR382.
Communication Polymer Chemistry
180 | Polym. Chem., 2021, 12, 177–182 This journal is © The Royal Society of Chemistry 2021
Ope
n A
cces
s A
rtic
le. P
ublis
hed
on 1
5 D
ecem
ber
2020
. Dow
nloa
ded
on 3
/14/
2022
7:4
8:29
AM
. T
his
artic
le is
lice
nsed
und
er a
Cre
ativ
e C
omm
ons
Attr
ibut
ion
3.0
Unp
orte
d L
icen
ce.
View Article Online
trast associate with the voids, SEHI data enable componentanalysis to be performed on image stacks utilising non-nega-tive matrix factorization (nnmf) to isolate components of inter-est (see ESI 1, 2 & 3†). The nnmf process gives a number ofcomponents which are derived in relation to the SE emissionpeaks of interest. Of particular importance to phenolic resin,nnmf isolated a region around 5–5.5 eV which has previouslybeen shown to be a response to CO bonding.16,24 Therefore,this technique provides SEHI with the ability to map whereether bridges exist within the resin. SEHI images observes CObonding emission to be most prominent around the edges ofvoid sites. The mechanism of how ether bridges form aroundthese voids is a subject for debate. The authors in this instancepropose two potential mechanisms to be involved, but futurework is required to fully understand this reaction.
One mechanism is based on the curing reaction of theresin itself: the structural inhomogeneity of “water/formal-dehyde bubbles” is associated with density fluctuation that isrelated to crosslink density distributions that have beenreported to exist within phenolic resin.25 In this case wepropose that the inhomogeneous distribution of crosslinkscan cause void trapping. As the water/formaldehyde bubblesform and migrate within the autoclave to the surface of thematerial, it is postulated that they become trapped by etherbridges developing around the edges of the voids. It has beenlong established that increasing the F : P molar ratios favoursthe production of ether bridges.14 As the voids sites predomi-nantly contain water and formaldehyde, both by-products ofprevious crosslink reactions, it is suggested that voids siteshave an increased localised F : P ratio. This relationship wouldexplain the ether bridge configuration around void sites astheir formation is the preferred crosslink route.15
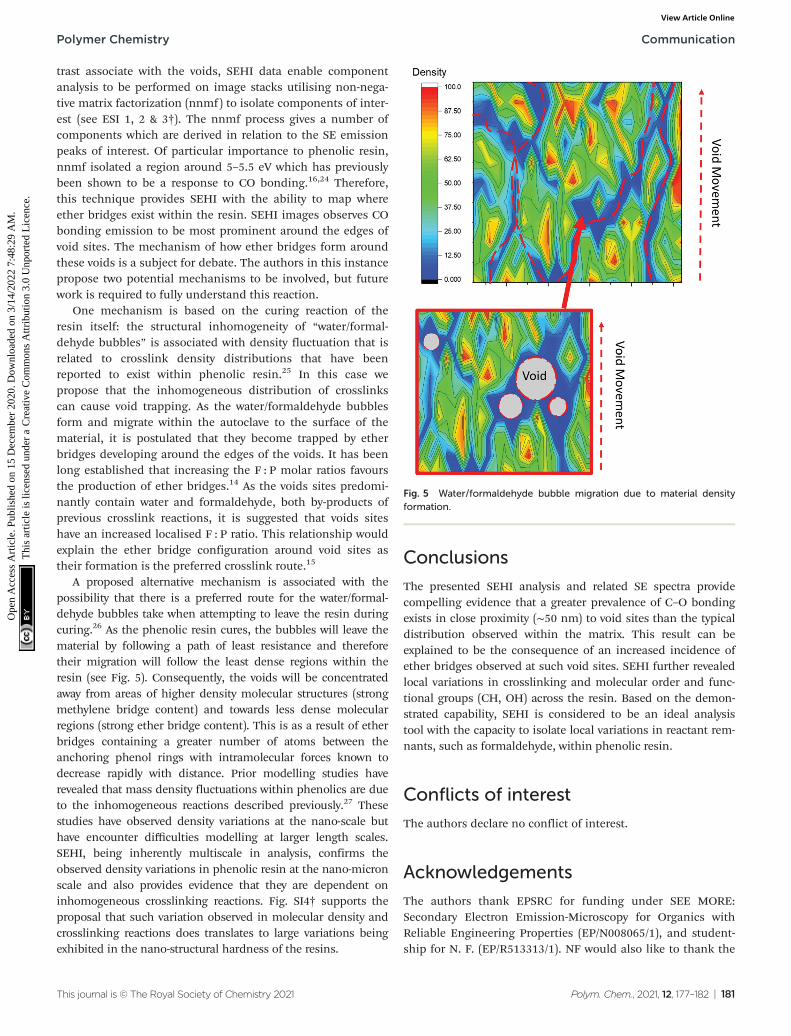
A proposed alternative mechanism is associated with thepossibility that there is a preferred route for the water/formal-dehyde bubbles take when attempting to leave the resin duringcuring.26 As the phenolic resin cures, the bubbles will leave thematerial by following a path of least resistance and thereforetheir migration will follow the least dense regions within theresin (see Fig. 5). Consequently, the voids will be concentratedaway from areas of higher density molecular structures (strongmethylene bridge content) and towards less dense molecularregions (strong ether bridge content). This is as a result of etherbridges containing a greater number of atoms between theanchoring phenol rings with intramolecular forces known todecrease rapidly with distance. Prior modelling studies haverevealed that mass density fluctuations within phenolics are dueto the inhomogeneous reactions described previously.27 Thesestudies have observed density variations at the nano-scale buthave encounter difficulties modelling at larger length scales.SEHI, being inherently multiscale in analysis, confirms theobserved density variations in phenolic resin at the nano-micronscale and also provides evidence that they are dependent oninhomogeneous crosslinking reactions. Fig. SI4† supports theproposal that such variation observed in molecular density andcrosslinking reactions does translates to large variations beingexhibited in the nano-structural hardness of the resins.
Conclusions
The presented SEHI analysis and related SE spectra providecompelling evidence that a greater prevalence of C–O bondingexists in close proximity (∼50 nm) to void sites than the typicaldistribution observed within the matrix. This result can beexplained to be the consequence of an increased incidence ofether bridges observed at such void sites. SEHI further revealedlocal variations in crosslinking and molecular order and func-tional groups (CH, OH) across the resin. Based on the demon-strated capability, SEHI is considered to be an ideal analysistool with the capacity to isolate local variations in reactant rem-nants, such as formaldehyde, within phenolic resin.
Conflicts of interest
The authors declare no conflict of interest.
Acknowledgements
The authors thank EPSRC for funding under SEE MORE:Secondary Electron Emission-Microscopy for Organics withReliable Engineering Properties (EP/N008065/1), and student-ship for N. F. (EP/R513313/1). NF would also like to thank the
Fig. 5 Water/formaldehyde bubble migration due to material densityformation.
Polymer Chemistry Communication
This journal is © The Royal Society of Chemistry 2021 Polym. Chem., 2021, 12, 177–182 | 181
Ope
n A
cces
s A
rtic
le. P
ublis
hed
on 1
5 D
ecem
ber
2020
. Dow
nloa
ded
on 3
/14/
2022
7:4
8:29
AM
. T
his
artic
le is
lice
nsed
und
er a
Cre
ativ
e C
omm
ons
Attr
ibut
ion
3.0
Unp
orte
d L
icen
ce.
View Article Online

Pico-FIB network for travel and collaboration funding.Electron microscopy and analysis was performed in the SorbyCentre for Electron Microscopy at the University of Sheffield.
References
1 K. Hirano and M. Asami, Phenolic resins—100years of pro-gress and their future, React. Funct. Polym., 2013, 73(2), 256.
2 Y. Xu, L. Guo, H. Zhang, H. Zhaiab and H. Ren, Researchstatus, industrial application demand and prospects ofphenolic resin, RSC Adv., 2019, 50(9), 28924.
3 S. Rapheepraew and E. Vuthichai, Synthesis of poly (silox-ane/double-decker silsesquioxane) via dehydrocarbonativecondensation reaction and its functionalization, Polymer,2016, 86, 113.
4 T. Holopainen, L. Alvila, J. Rainio and T. Pakkanen, Phenol–Formaldehyde Resol Resins Studied by 13C-NMRSpectroscopy,Gel Permeation Chromatography, and Differential ScanningCalorimetry, J. Appl. Polym. Sci., 1997, 66, 1183.
5 N. Gabilondo, M. López, J. A. Ramos, J. M. Echeverría andI. Mondragon, Curing kinetics of amine and sodiumhydroxide catalyzed phenol-formaldehyde resins, J. Therm.Anal. Calorim., 2007, 90(1), 229.
6 S. Hamad, N. Farr, T. Fei, N. Shukor, J. Dean, S. Hayes,J. Foreman and C. Rodenburg, Optimizing size and distri-bution of voids in phenolic resins through the choice ofcatalyst types, J. Appl. Polym. Sci., 2019, 136, 48249.
7 S. Hamad, N. Stehling, S. Hayes, J. Foreman andC. Rodenburg, Exploiting Plasma Exposed, Natural SurfaceNanostructures in Ramie Fibers for Polymer CompositeApplications, Materials, 2019, 12(10), 1631.
8 S. Q. Liu, P. C. Ning and Z. M. Ding, Research progress ofmodifed phenolic resin, Thermosetting Resin, 2016, 31, 64–70.
9 Z. Li, W. Zhou, L. Yang, P. Chen, C. Yan, C. Cai, H. Li, L. Liand Y. Shi, Glass Fiber-Reinforced Phenol FormaldehydeResin-Based Electrical Insulating Composites Fabricated bySelective Laser Sintering, Polymers, 2019, 11, 135.
10 X. M. Nie, Z. P. Gao and F. Q. Yi, Development of PhenolicResin/Fiberglass Cloth Composite Prepreg Modified byNitrile-Butadiene Rubber, Eng. Plast. Appl., 2019, 47, 42.
11 W. Solyman, H. Naguib, N. Alian, N. Shaker and U. Kandil,Synthesis and characterization of phenol/formaldehydenanocomposites: Studying the effect of incorporating reac-tive rubber nanoparticles or Cloisite-30B nanoclay on themechanical properties, morphology and thermal stability,J. Radiat. Res. Appl. Sci., 2016, 10(1), 72–79.
12 J. Bouajila, G. Raffin, H. Waton, C. Sanglar andS. Alamercery, M.F Grenier-Loustalot, Phenolic Resins (II) –Influence of the Chemical Structure of High MolecularWeight Molecules on the Mechanisms of Cross-linking andon the Final Structure of the Resins, Polym. Polym.Compos., 2003, 11(4), 233–262.
13 D. X. Wang, Z. M. Chen, G. X. Zhang, X. C. Liang, B. H. Li,X. Q. Cao and C. Wang, Study on Fast-Curing Phenol-Formaldehyde Resin Adhesive, Chem. Adhes., 2016, 38, 447.
14 P. W. King, R. H. Mitchell and A. R. Westwood, Structuralanalysis of phenolic resole resins, J. Appl. Polym. Sci., 1974,18(4), 1117.
15 P. S. Parameswaran and E. T. Thachil, Int. J. Polym. Mater.Polym. Biomater., 2007, 56, 177.
16 N. Farr, S. Pashneh-Tala, N. Stehling, F. Claeyssens,N. Green and C. Rodenburg, Characterizing Cross–LinkingWithin Polymeric Biomaterials in the SEM by SecondaryElectron Hyperspectral Imaging, Macromol. RapidCommun., 2020, 41, 1900484.
17 Q. Wan, K. J. Abrams, R. C. Masters, A. C. S. Talari,I. U. Rehman, F. Claeyssens, C. Holland and C. Rodenburg,Adv. Mater., 2017, 29, 1703510.
18 R. C. Masters, A. J. Pearson, T. S. Glen, F.-C. M. Sasam,L. Dapor, Li. A. M. Donald, D. G. Lidzey and C. Rodenburg,Sub-nanometre resolution imaging of polymer–fullerenephotovoltaic blends using energy-filtered scanning electronmicroscopy, Nat. Commun., 2015, 6, 6928.
19 P. S. Kazemian, A. M. Mentink, C. Rodenburg andC. J. Humphreys, Quantitative secondary electron energy fil-tering in a scanning electron microscope and its appli-cations, Ultramicroscopy, 2007, 107, 140.
20 J. Schindelin, I. Arganda-Carreras, E. Frise, V. Kaynig,M. Longair, T. Pietzsch, S. Preibisch, C. Rueden, S. Saalfeld,B. Schmid, J. Y. Tinevez, D. J. White, V. Hartenstein, K. Eliceiri,P. Tomancak and A. Cardona, Fiji: an open-source platformfor biological-image analysis, Nat. Methods, 2012, 9, 676.
21 N. A. Stehling, R. Masters, Y. Zhou, R. O’Connell,C. Holland, H. Zhang and C. Rodenburg, New perspectiveson nano-engineering by secondary electron spectroscopy inthe helium ion and scanning electron microscope, MRSCommun., 2018, 8, 226.
22 R. C. Masters, N. Stehling, K. Abrams, V. Kumar,A. Schäfer, D. Lidzey and C. Rodenburg, Mapping PolymerMolecular Order in the SEM with Secondary ElectronHyperspectral Imaging, Adv. Sci., 2019, 6, 5.
23 K. J. Abrams, M. Dapor, N. Stehling, M. Azzolini, S. J. Kyle,J. S. Schäfer, A. Quade, F. Mika, S. Kratky, Z. Pokorna,I. Konvalina, D. Mehta, K. Black and C. Rodenburg, MakingSense of Complex Carbon and Metal/Carbon Systems bySecondary Electron Hyperspectral Imaging, Adv. Sci., 2019, 6, 19.
24 N. Farr, J. Thanarak, J. Schäfer, A. Quade, F. Claeyssens,N. Green and C. Rodenburg, Understanding surface modi-fications induced via Argon Plasma sterilisation throughSecondary Electron Hyperspectral Imaging, Adv. Sci., 2020,2003762.
25 Y. Shudo, A. Izumi, K. Hagita, T. Nakao and M. Shibayama,Large-scale molecular dynamics simulation of crosslinkedphenolic resins using pseudo-reaction model, Polymer,2016, 103, 261.
26 A. C. Loos and G. S. Springer, Curing of epoxy matrix com-posites, J. Compos. Mater., 1983, 17, 135.
27 Y. Shudo, A. Izumi, K. Hagita, T. Nakao and M. Shibayama,Structure-mechanical property relationships in crosslinkedphenolic resin investigated by molecular dynamics simu-lation, Polymer, 2017, 116, 506.
Communication Polymer Chemistry
182 | Polym. Chem., 2021, 12, 177–182 This journal is © The Royal Society of Chemistry 2021
Ope
n A
cces
s A
rtic
le. P
ublis
hed
on 1
5 D
ecem
ber
2020
. Dow
nloa
ded
on 3
/14/
2022
7:4
8:29
AM
. T
his
artic
le is
lice
nsed
und
er a
Cre
ativ
e C
omm
ons
Attr
ibut
ion
3.0
Unp
orte
d L
icen
ce.
View Article Online