Embed Size (px)
Citation preview

Indian Joun1;:J1 ofChcmical Technology Vol. 15, July2008, pp. 388-396
Identification of various chemical phenomena in concrete using thermal analysis
R Vedalakshmi", A Sundara Rajb & N Pataniswamy"
'Corrosion Protection Division, bCharactcrization and Measurcment Division,
Centr;:J1 Electrochemical Research Institute, Karaikudi 630 (l06, India
Email: [email protected]
Received /8 April 2007; revised 9 April 2008
Chemic~,1 changcs th,lt occur in concrctc at the microstrtrcture level due to environmental effects al-e normally identilied bv Sb'vl, XRD, thcnn;i1 alwly,;is and by chemical analysis_ In the [1rescnt investigation, the cbemical compounds fonned in various ehcmic<ll reactions ;:Jre quantified using thermal analysis_ The concrctc having characteristic compressivc strcngth or 20 Mr,l w;-rs subjeetcd to uncler-go various chemical reactions for;:J specified period. Three types of cements were uscd I(lr
casting the conercte specimens Thc thermal an<llyses (DTA and TG) werc carricd out on [1owclercd concrete S<lInplcs p",:sing throu~h 75 pm sic\e dr-C\wn I.-r-oln the concrete specimens which wcrc subJccted to various ehcmieal phcnomenon. Chcmical compounds such ;:JS Ca(OIIh, gypsum, cllringite, calcium chloroaluminatc are estimatcd quantitatively. The type of Ily ;:Jsh blcnded with cement and complex aminc salt in Migr<lting Corrosion Inhibitor- (MCI) treated coneretc arc ahJ idcntilicd. Each chemical cOI11[1ound is identified by a distinct cndotherm present in the DTA (DiITerenti;d Tlrcl"llwl Analysis) plot ~lIlJ quantitative estirmtion has been Jone using the TG (Thermo-gravimetric) curve_
Kcywords: Chcmical changes, Thermal analysis, Pozzolanic rcaction, Sulph;:Jtc attack, FI-ieclel's salt, Migrating corTosiorl inhibitor
Concrete is a widely used construction material and it quanti[icatlon of different phases. It is important to undergoes chemicClI changes with time whcn exposed note that the high resolution of the thermal analysi:; to various environments_ It attains strength only after experiment allows quantification of cven very minor completion of sufficient hydration reaction of cement components and cloes not need any expensive sur!ace with water. Similarly it deteriorates due to ingress of preparation. various aggressive speCIes . such as sulphates, In the prcscnt study, using: thcrmClI analysis, chlorides and carbon-di-oxide. Each of these species vanous chemica1 compounds f()rt11ccl during reacts with either hydrated cement compounds (i) pOZlolanic rcaction or blended ccments, (alcium hydroxide, C-S-I-I) or with ceme:nt (ii) hydrated cement products reacted with chlorides
lcompounds (C3A) Clnd fonns insoluble compounds '". and sulphates (iii) CaO contcnt of fly ash blended All these chemical changes occur at the with PPC (iv) prescnce of migrZilll1g corrosIOn microstructure level and are identified by Scanning inhibitor in concrete were estimated. electron microscope (SEM) with EDAX, X-ray diffractomctry (XRD) and thermal analysis l .5-
9 SEM, Experimental Procedure X-ray imaging and other optical methods nee:d expensive surfacc preparation; by XRD method i\latcr'ials
quantities of matcrial less than 2 or 3% of the: totClI 20 MPa concrete was used throughout the ·d· (- dlll,l')can be rare y I 1 e:ntl Ie -. investigation. The mix propol1ions uscd lor CilSltllg
Thermal analysis is widely used in studics on the concrete specimens arc given 111 Table I. Three concre:te to determine the hydration reaction of types of ccment such as Ordl1lary POIili1nd cement cemcnt/blended cement accurately by estimating (OPC) conforming to 1.S.8119, Portland poaolana calcium hydrates and Ca(Ol-I)2 content iJ 'I5 The ccment (PPC) confonnillg 10 J.S. 2340, Portland slag
application is extended to identify the various cement (PSC) conforming to I.S. 450 were used. In
deterJoralton.. phenomena O'f concrete'·I 5 6 _ -l··'J1e pozzoJana and slag cements, Portland cement was respective weight-losses can be obtained from the replaced with 25% fly ash and 50% slag rcspectively corresponding TG curve, which in tum allows the Chemical composition of cements uscd is given a
TYr cen
o r
Com
Silic
Alul
FelT
Ca\(
Ta cll.
ag co d,-Sp pI ra C(
w sl
p
c c S c

VI:::DALAKSHMI cl af.: IDENTIFICATION OF VARIOUS CHEMICAL PHENOMENA IN CONCRETE 389
Table I Details of mix proportion Typc of W/C ratio Cement Watcr finc aggn:gate Coarse aggregate 28 day comprcssive strcngth Slump ccment (kghn3
) (kg/m3) (kg/m3
) (kg/m3) (MPa) (mm)
OPC 0.67 284 190 770 1026 27 50
PPC 0.67 284 190 770 1026 23 60
PSC 067 284 190 770 1026 28 10
Table 2 - Chemical composition of three cements
Compound Typcs of cement
Ordinary Portland Portland Portland Pozzolana slag cement, CClllcnt) cement,
(%) (%) (%)
Silicon -di-oxide(::i02) 20-2 i 28-32 26-30
Aluminium oxide (AI 20 3) 5.2-5.6 70-100 90-11.0
Ferric oxide (1"ceO;) 4.4-4.8 49-6.0 25-30
Calcium oxide (CaO) 62-63 41-43 44-46
Magnc,;iurn oxide (.\1!-(O) 0.5-0.7 1.0-2.0 3.5-4.0
Sulphur - tri-oxide (SO}) 2.4-2.8 2.4-2.8 24-28
Lo;:; on ignition 1.5-2.5 3.0-35 15-25
Table 2. Well-graded river sand and good quality crushed hlue granite were used as fine and coarse aggregates respectIvely. The different size fractions of cuar.iC aggregate (20 mm down graded and l2.5 mm down graded) were taken and recombined to a specifieci g.rading as shown in Table 3. In mix proportion, cement content and water/cement (w/c) ratio were kept constant for ·both blended cement concrete and POliland cement concrete. Potable water was used for casting the concrete. Cubical concrete specimens of size 100 nun' were cast
POlzolanic reaction of blended cements
To determine the pozzolanic reaction of blended cements, cubical concrete specimens of the three cement::: were kept immersed in potable water for 28, 90 and 365 days At the end of each curing period, the cubes were broken and samples were collected for thermal analysis. After perfonning the DTA analysis, the Ca(( )1-1)2 content and additional calcium hydrates content fonned during the pozzolanic reaction were quantitatively estimated.
The reduction of permeability due to the formation of additional hydrates in PPC and PSC concretes is ensured by determining the co-efficient of water absorption and chloride penetration. Co-efficient of water absorption was determined as per procedure given 111 STM C642 by oven drying method l6 The
Table 3 - Grading of coarse al1l] linc aggregate
Coarse aggr'egate
Sieve size Cumulative Sieve size umulative (mm) % retained (mm) % retained
20 0 4.75 0
16 25 2.36 12
12.5 52 0600 49
10 72 0.300 85
475 100 o 150 97
<0.150 100
experiment was conducted using 100 mrn size cubical concrete specimens at three curing periods namely 7, 28 and 90 days.
For determining the chloride penetration, the concrete specimens of size 450x250x 150 mm (LxBxD) were cast using tru-ee cements. Arter 28 days of curing, 3% I aCI solution was ponded on the top of the each specimens for 4 days and allowed to Jry [or 3 days. This alternate welting 'll1d drying cycle was continued for 30 months and aLter that the specimen was broken and sliced to different depths irom the top to bottom. The samples collected from the diiTerent depths were powdered and sieveu through 150 ~lln
sieve and the water soluble chloride was determined by Mohr's method '7
Estimation of calcium oxide content of fly ash in blended cement
According to the chemical composition of t1y ash, the type of fly ash is divided into low calcium fly ash and high calcium fly ash. In low calcium fly ash, the CaO content is less than 10% whereas in high calcium fly ash, it is more than 10%. In factory produced Portland pozzolana cement, the type of ny ash blended is not known. This can be identified using thermal analysis by estimating Ca(OH)2 content. Three pozzolana cements from three different factories (sample B, C, D) were used. Cubical concrete specimens (100 mm size) were cast using each cement sample and cured in potable water for 28
'
390 INDIAN J. CHEM. TECHNOL., JULY 2008
days. At the end of 28 days, the compressive strength was determined. After this, the samples were collected from the concrete cubes for thermal analysis.
fllect of sulphate attack
The hydrated ccment products react with sulphate and form two major expansive products such as gypsum and ellringitc. For quantifying these products, \00 mm size cubical concrete specimens were cast using thm.: cements ZlI1d cured for 28 days. After curin!!, the specimens were kept immersed in 10% MgS04 solution. At the end of 9 and 15 months, the samples were collected from the top surface of the cube i.e up to 3 mm, and thermal analysis was carried out. The extent of deterioration was also determined periodically by measuring the decrease in compre..sive strength.
Friedel's salt formation
When concrete is exposed to chloride enviroml1ent, the C1A phase jn the concrete reacts with chloride and forms Friedel's salt. In concrete this may be in the fonn of either bound chloride or water-soluble free chloride. For determining the bound chloride, 1% chloride was added at the time of casting. After 28 days of curing, the specimens were exposed in the exposure yard and salt solution was sprayed periodically. After exposure of 24 months, the cubes were broken and samples were collected from the center of the specimen. The results were compared with the concrete in which neither chloride was added nor exposed to salty enviromnent.
Presence of migrating corrosion inhibitor (Mel)
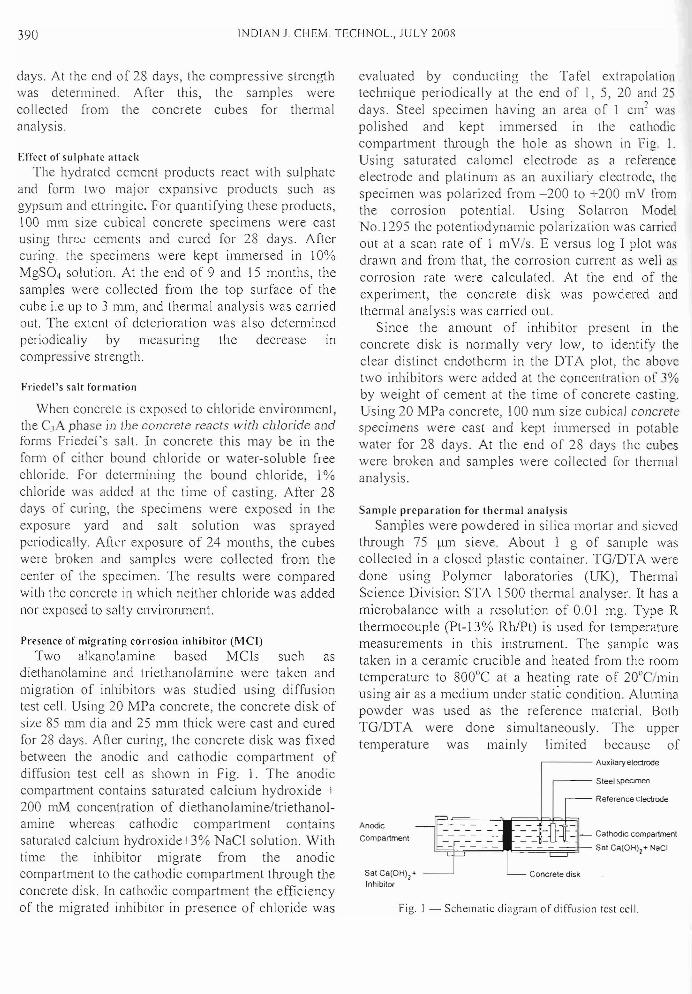
Two alkanolamine based MCls such as diethanolamine and triethanolamine were taken and migration of inhibitors was studied using diffusion test cell. Using 20 MPa concrete, the concrete disk of si/.e 85 mm dia and 25 mm thick were cast and cured for 28 days. After curing, the concrete disk was fixed between the anodic and cathodic compal1ment of diffusion test cell as shown in Fig. 1. The anodic compartment contains saturated calcium hydroxide + 200 mM concentration of diethanolamine/triethanolamine whereas cathodic compartment contains saturated calcium hydroxide+3% NaCI solution. With time the inhibitor migrate from the anodic compartment to the cathodic compartment through the concrete disk. In cathodic compartment the efficiency of the migrated inhibitor in presence of chloride was
evaluated by conducting the Tafel extrapolC1tion technique periodically at the end of I, 5, 20 and 2days. Steel specimen having an area of 1 cm2 was polished and kept immersed in the cathodic compartment through the hole as shown In Fig. I. Using saturated calomel electrode as C1 reference electrode and platinum as an auxiliary electrode, the specimen was polarized from -200 to +200 mY Crom the corrosion potential. Using Solan'on Model No.1295 the potentiodynamic polarization was carried out at a scan rate of 1 mY Is. E versus log I plot W3S
drawn and from that, the corrosion current as well LI~
corrosion rate were calculated. At the end of the experiment, the concrete disk was powdered and thermal analysis was carried out.
Since the amount of inhibitor present in the concrete disk is normally very low, to identify the clear distinct endotherm in the DTA plot, the above two inhibitors were added at the concentration of 3% by weight of cement at the time of concrete casting. Using 20 MPa concrete, 100 mm size cubic<JJ concrete specimens were cast and kept immersed in potable water for 28 days. At the end of 28 dC1ys the cubes were broken and samples were co] lected for thermal analysis.
Sample preparation for thermal analysis
Samples were powdered in silica -mortar and sieved through 75 ~Lm sieve. About 1 g of sample was collected in a closed plastic container. TG/DTA were done using Polymer laboratories (UK), Thermal Science Division STA 1500 thermal anC1lyser. It has a microbalance with a resolution of 0.0\ mg. Type R thermocouple (Pt-13% RhlPt) is used for temperature measurements in this instrument. The sample was taken in a ceramic crucible and heated from the room temperature to 800°C at a heating rate of 20Ge/min using air as a medium under static condition. Alumina powder was used as the reference material. Both TG/DTA were done simultaneously. The upper temperature was mainly limited because of
,..----- Auxila ry electrode
Steel speamen
Reference ~Iedrode
Anodic Cathodic compartment Compartment
~~~~~~~~F?- Sat Ca(OH)l+ NaCI
Sat Ca(OH)l + Concrete disk Inhibitor
Fig 1 - Schematic diagram of diffusion test cell_
crystalli tempera concretl temperc present compOI particu endoth quanti
Resul
Quanti
1y collee giver seen betw deh) tem! C(lm
SiO obs'
e21
the hye chI aLlI Int co 70 ca
391 VEDALAI(SHMI 21 (1/. IDENTIFICATION OF VARIOUS CHEMICAL PHENOMENA IN CONCRETE
crystallization of hydrated compounds at higher tempera lure. In the case of sulphate deteriorated concrete sample and inhibitor added sample the upper temperature was limited to 600°C. The data are presented in the fOlm of TG/DTA plot. The chemical compound which undergoes dehydration reaction at a particular temperature has been identified by a distinct endothenn in the DTA plot. Using TG curve, the quantity of compound has been estimated.
Results and Discussion
Quantification of poaolanic reaction of blended cements
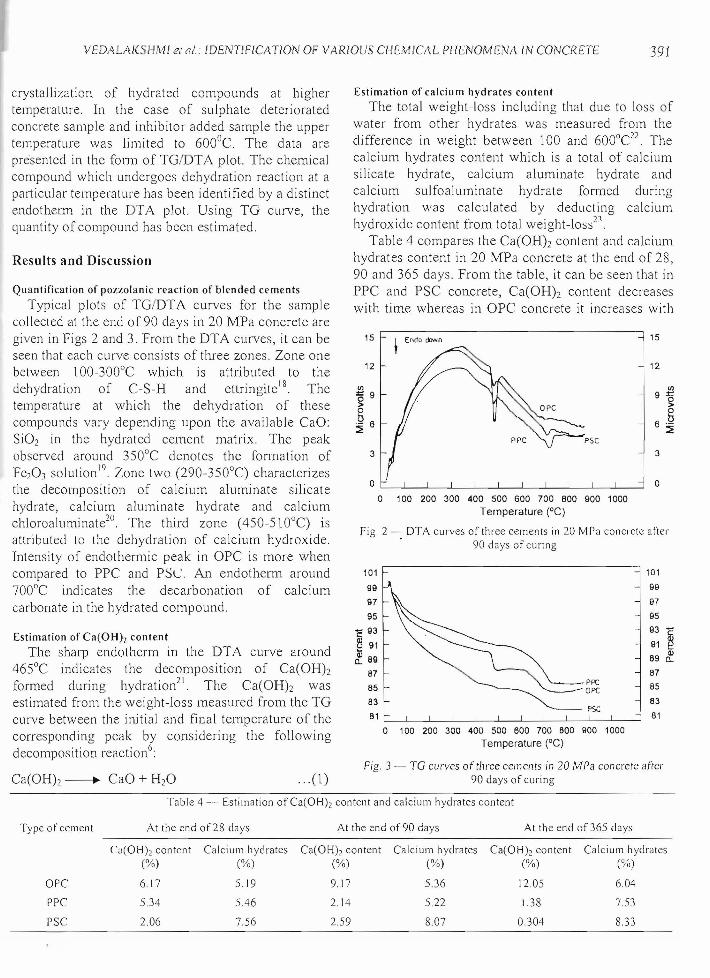
Typical plots of TGIDTA curves for the sample collected at the end of 90 days in 20 MPa concrete are given in Figs 2 and 3. From the DTA curves, it can be seen that each curve consists of three zones. Zone one between 100-300°C which is attributed to the dehydration of C-S-H and ettringite l8
. The temperature at which the dehydration of these compounds vary depending upon the available CaO: Si02 in the hydrated cement matrix. The peak observed around 350°C denotes the formation of Fe20J solution l9 Zone two (290-350 DC) characterizes the decomposition of calcium aluminate silicate hydrate, calcium aluminate hydrate and calcium chloroaluminate2o
. The third zone (450-51 ODC) is attributed to the dehydration of calcium hydroxide. Intensity of endothermic peak in OPC is more when compared to PPC and PSL:. An endothenn around 700DC indicates the decarbonation of calcium carbonate in the hydrated compound.
Estimation of Ca(OH)z content
The sharp endotherm in the DTA curve around 465°C indicates the decomposition of Ca(OH)2 formed during hydration21 . The Ca(OH)2 was estimated from the weight-loss measured from the TO curve between the initial and final temperature of the corresponding peak by considering the following decomposition reaction6
:
. " (1)
Estimation of calciu m hydrates content
The total weight-loss including that due to loss of water from other hydrates was measured from the difference in weight between 100 and 600DC22 The calcium hydrates content which is a total of calcium silicate hydrate, calcium aluminate hydrate and calcium sulfoaluminate hydrate formed during hydration was calculated by deducting calcium hydroxide content from total weight-lo~~2'.
Table 4 compares the Ca(OH)2 content and calcium hydrates content in 20 MPa concrete at the end of 28, 90 and 365 days. From the table, it can be seen that in PPC and PSC concrete, Ca(OH)2 content decreases with time whereas in OPC concrete it increases with
1515 ~ Endo cDwn
1212
9 %:'" -a'" 9 o > >o
~ 6 6 ~ psc
33
a a a 100 200 300 400 500 600 700 800 900 1000
Temperature (Oe)
Fig. 2 - OTA curves ofthl'ee cements in 20 MPa concrete after . 90 days of curing
101101
9999
9797
95
C 93
95
93 a; ~ 91 91 ~
69 ~~ 69
87 PPC
87
8565 opc 8383
psc 8161 L---"--_.L---L_-'----'_--'------JL--L_L--'-__
a 100 200 300 400 500 BOO 700 800 900 1000
Temperature (0C)
Fig. 3 - TO curves of three cements in 20 MPa concrete after 90 days of curing
Table 4 - Estimation of Ca(OHh content and calcium hydrates content
Type of cement At the end of28 days At the end of 90 days At the end of 365 days
C;J(OH)z content Calcium hydrates Ca(OH)z content Calcium hydrates Ca(OH)2 content Calcium hydrates (%) (%) (%) (%) (%) (%)
OPC 617 519 9.17 5.36 12.05 604
PPC 5.34 546 2.14 5.22 138 7.53
PSC 206 7.56 2.59 8,07 0304 833

INDIAN J CHEM. TECHNOL., JULY 2008392
time. The reduction in Ca(OH)2 content in blended cement concrete indicates its consumption during pozzolanic reaction. The data emphasis that in PPC and PSC concretes, lime is consumed whereas in OPC concrete, lime is produced.
It is also observed that the calcium hydrates content is more in PPC and PSC concrete than OPC concrete and it increases with time up to 365 days. For example in PPC concrete it is 5.46% at the end of 28 days and increased to 7.53% at the end of 365 days. Similarly in PSC concrete, the value is 7.56% and 8.38% at the end of 28 and 365 days respectively. This clearly shows that in blended cement concrete in the presence of water both fly ash and slag react ~ith Ca(OH)2 and form secondary calcium hydrates (both aluminate hydrate and silicate hydrate). The reactions are called as 'pozzolanic reaction' and given below:
3Ca(OH)2+Fly ash+H20 --'3CaO.2Si02.3H20 ... (2) (Secondary C-S-H)
3Ca(OH)2+Slag + H20 -------. 3CaO.2Si02.3H20 + 4 CaO.AI20dH20 ... (3)
(C-S-H) (C-A-H) (Secondary C-S-H and C-A-H)
These additional secondary hydration products are not formed in OPC concrete as indicated by the lower value. When compared to PPC concrete, PSC concrete has more hydrates because of higher alumina and calcium oxide content of slag in Portland slag cement.
Water and chloride penetration
From Table 5 it can be seen that in all the three curing periods, the co-efficient of water absorption in blended cement concrete is less than in OPC concrete. Similarly from the Table 6, it can be seen that when compared to OPC concrete, the chloride content is less in all depths in PPC and PSC concrete. The above results confirm that the additional secondary calcium hydrates densify the pore structure in PPC and PSC concretes and cause the reduction of permeation of chloride and water.
Table 5 - Comparison of co-efficient of water absorption 01'20 MPa concrete
Typc of cemcnt Co-efficient of water' absorption, (x 10- 1°) (m2/s)
7 days 28 days 90 days
orc 16.6 15.10 7.64
prc 9.86 7.71 4.94
P 827 5.80 332
Identification of type of fly ash blended with Portland POlzolana cement
In Portland pozzolana cement, the Ca(OH)2 content depends upon the CaO content of the fly ash blended. Figures 4 and 5 compare the DTA and TG plot of three pozzolana cements (B,C,D) at the end of 28 days of curing respectively. From the DTA curve (Fig. 4), it can be seen that the intensity of peak is more in sample C than in sample Band D. from the TG curve (Fig. 5), the % of Ca(OHh content is 1.07, 2.14 and 0.82% for sample B, C and D respectively. The values indicate that when compared to sample B and D, the sample C contains 2 to 2.6 times more Ca(OH)2 content, which implies that either the fly ash
j 21tEndo down o 19"~ . ~~ 17
15 15
2l 13 13 ~ ~ o 11 11 ~ >o 9 9 2b o 7 7 ~ 5
~ 5
3 3
1 1 -1-1 '-----'-_'--'-_'--....L_L.......L_L.......L_L...-:l
o 80 160 240 320 400 480 560 640 720 800
Temperature (OC)
Fig. 4 - DTA curves of three pozzolana cemcnt samples (B. C, D) 01'20 MPa eoncl'ete after 28 cbys of curing
101 101
100 100
C
~ Q)
Cl.
99
98
B
99 ~ c
~ 98 ~
97 0
c 97
96 96
o 100 200 300 400 500 600 700 800 Temperalure (0C)
Fig. 5 - TG curves of three pOlzolana cemcnt samples (B, C, D) of 20 M Pa concrete after 28 days of curing
Table 6 - Comparison of water soluble chloride at diflcrcnt depths
Type of Water soluble chlor-idc (ppm) cement
30-60 mm depth 60-90 mm depth 90-120 mm dcpth
orc 8307 7455 7029
PPC 575t 5751 4899
PSC 4686 4899 5,38
blende is me sampl compi samp\ it is 3 it is strenj conel wher stren cone
Quar VI
enVl the ettri Thi' Slgt
as f
M',
M
m c(
rr f(
h [I
1 c-c i

VEDALAKSHMI el al.: IDENTIFICATION OF VARIOUS CHEMICAL PHENOMENA IN CONCRETE 393
blended is high calcium fly ash or its calcium content is margina Ily more than the other two cement samples. This is confirmed by determining compressive strength at the end of 28 days. For sample C it is 45.2 MPa whereas for sample Band D it is 38.3 and 39.2 MPa respectively. In OPC concrete it is 47.37 MPa. It has been reported2
4.2S that the strength development of high calcium fly ash added concrete is comparable to that of OPC concrete whereas in low calcium fly ash added concrete, the strength developme:nt is lower than that of OPC concrete.
Quantillcation of gypsum and cttringite formation When concrete is exposed to sulphate bearing
environme:nt, the pcrmeation of sulphate ions causes the formation of sulphate bearing phases such as etlringite and gypsum in the internal microstructure. This causes cracking and subsequently leads to significant reduction in slrength26-28 The reactions are as follows:
MgS04 + Ca(OHh + 2I-hO ----.. CaS04.2H20+ Mg(OHh ... (4)
MgS04 CaO.Si02.3H20 + I-hO ---.. CaS04.2H20+ Mg(OH)2+ Si02.H20 (5)
Mg(OH)2+Si02.H20 ~ MgO.Si02.H20 + H20 (6)
When compared to sodium sulphate attack, magnesium sulphate attack is more severe on concrete. From Eqs (4)-(6), it can be seen that magnesium ions directly react with C-S-H and thus reduces the binding property of the concrete matrix. It has been reported that gypsum exists in crystalline +" d'" h ~ 129 . tlorm an ettnnglle In amorp ous lorm' In concre e. These, expansive products are quantified by XRD, SEM with EDAX and thermal analysis9Jo
. Wee et a/30 reported that since the ettringite is in amorphous form and could not be detected through XRD but detected by thermal analysis. The dehydration of ettringite and gypsum formation was indicated by endothermic peaks at 80-100°C and I 1a-130°C
. l 5 9 30 31respectIve y ., . . Figures 6 and 7 compare the DTA curves of three
cements in 20 MPa concrete after 9 and 15 months of exposure in 10% MgS04 solution. From Fig. 6 (after 9 months of exposure) it can be seen that, OPC concrete shows only ettringite peak whereas PPC and PSC concretes show both ettringite and gypsum peaks. In OPC concrete, because of higher C3A
content all the gypsum formed is converted into ettringite and this is evident from the large intensity of the peak. In the case of blended cements because of reduction of C3A content (dilution effect) the intensity of the ettringite peak is weak when compared to OPC concrete but gypsum peak is strong.
As shown in Fig. 7, in all the three cements, only gypsum peak is observed after 15 months of exposure. The intensity of the peak is more than that after 9 months of exposure. This indicates that with exposure secondary ettringite is not formed and gypsum formation is the only expansive product.
Using TG curve, the gypsum and ettringite were estimated quantitatively and the results are given in Table 7. From the data it can be inferred that the gypsum formation increases with exposure period irrespective of type of cement. It is more in PSC concrete than in PPC and OPC concretes. This is also confirmed by observing the reduction in compressive strength in PSC concrete (Table 8) whereas increase in compressive strength in other two concretes at the end of 15 months of exposure. Table 8 compares the change in compressive strength of three cements up lo
B
7
6
5
'15'" 4
§> 3
~ 2 1
o -1
Bt Eodo down 7 6
PPC 5
$'. 4 0
>3 0
OPe U 2 ~ 1
0
-1
-2-2 '--_'__--'_...L-~_...l.._---"-_-L....__'___L-_'__--' _ __'
o 50 100 150 200 250 300 350 400 450 500 550
Temperature (oG)
Fig. 6 - DTA curves of three cements in 20 MPa concrete after 9 months of exposure in 10% MgS04 solution.
10 10 9 IEnda dawn PPC 9
B B
7 7 6 6
~ 5 PSC 5 ~ ~ 4 4 ~ b 3 §3 ~ 2 2 ~
1 1 o 0
-1 -1
-2 L--L----l_...L----"-_.L----L_l--.....L_'---'----'_---' -2 o 50 100 150 200 250 300 350 400 450 500 550
Temperature (Oe)
Fig. 7 - DTA curves of three cements in 20 MPa connetc after 15 months of exposure in 10% MgS04 solution
--------------------------------
INDIAN 1. CHEM. TECHNOL, JULY 2008394
Table 7 - Estimation of gypsum and ettringitc
Typc 0 f cClncn t After 9 months of expOSUI'e Aftcr 15 months of Cxposul·e
Gypsum Ettringitc Compl'cssive strength, MPa Gypsum Comprcssivc strength, MPa
Water 10% MgS04 watcr 10% MgS04
OPC 390 36 39 533 37 43
PPC 119 1.79 33 38 3.53 38 41
PSC 3.87 4.42 30 33 7.21 :n 31
36 months. From this it can be seen that both PPC and PSC concrete sho'vv more reduction in compressive strength than OPC concrete at the end of 36 months. The magnesium ions attack directly C-S-H gel because of reduction of Ca(OH)2 in blended cements and thus get deteriorated more.
Estimation of bound chlorides (Friedel's salt) present in the chloride contaminated concrete
In chloride-induced corrosion, the dissolvable chloride concentration that actually resides in the pore solution and is permanently in contact with the steel surface determines the initiation and rate of corrosion of rebar. The tricalcium aluminate phase (C.lA) of cement has the 3bility to complex the dissolvable chloride resulting in the fonnation of calcium chloroaluminate hydrate (3 CaO.AbO.l.CaCI2.10H20) and possibly ferrite analogue (3CaO.Fc20.l.CaC121 OH20), according to the following reaction:
3CaOAI20, + 2NaCI + Ca(OH)2 + 1OH20---.
3CaO.AI20, CaC12.10 H20 + 2NaOH ... (7)
The formation of this bound chlorides results in the reduction of cOITosion inducing dissolvable chlorides in the pore solution and hence lowering the corrosion risk. The amount of C,A content present in the cement influences the amount of bound chlorides 111
concretc'2,J.1.
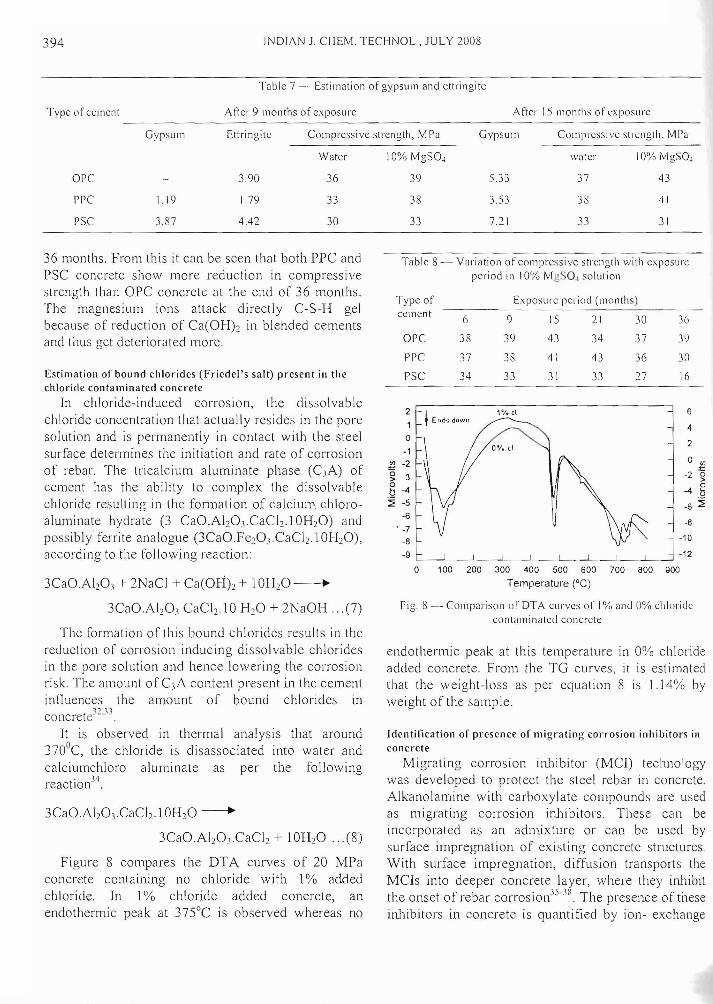
It is observed in thermal analysis that around 370°C, the chloride is disassociated into water and calciumchloro aluminate as per the following
J4reaction .
3CaO.Ab03·CaCb·10H20 -------+
3CaO.AI20,.CaCb + lOB20 ... (8)
Figure 8 compares the DTA curves of 20 MPa concrete containing no chloride with 1% added chloride. In 1% chloride added concrete, an endothermic peak at 37SoC is observed whereas no
Table 8 - Variation of compressive strength with exposure period in loryo MgS04 solul ion
Type of Exposure period (months) cement
6 9 15 21 30 3(,
OPC 38 39 43 34 37 3')
PPC 37 38 41 43 36 30
PSC 34 33 31 33 27 16
2 6 ~ Endo down
1 4 a
2 -1
~ -2 a :! ~ -3 -2 g § --4 --4 b ~~ ~~
~ ~ • -7
-8 -10
-9 '--_'-------"~----"_~_~_~_~_~_~ -12
a 100 200 300 400 500 600 700 800 900
Temperature (OC)
Fig. 8 - Comparison 0[' DTA curves or I% and 0% chloride contillninatcd connete
endothermic peak at this temperature in 0% chloride added concrete. From the TG curves, it is estimated that the weight-loss as per equation 8 is 1.14% by weight of the sample.
Identification of presence of migrating corrosion inhibitors in concrete
Migrating corrosion inhibitor (MCl) technology was developed to protect the steel rebar in concrete. Alkanolamine with carboxylate compounds are used as migrating corrosion inhibitors. These can be incorporated as an admixture or can be used by surface impregnation of existing concrete structures. With surface impregnation, diffusion transports the MCls into deeper concrete layer, where they inhibit the onset of rebar corrosionJ5
-,g The presence of these inhibitors in concrete is quantified by ion- exchange

VEDAL KSHMlel({!.:ID~ TIFICATIO OFVARIO SCHE. I ALPHE OME AINCO CRETE 39.'i
4
3
V) 2 ~ o 1'; 1 b ~ 0
-1
-2
4
\ Endo down 3c
A
B
-1
-2
-3 L.-_L.----l_---l_---l_---'_---'_---''--_'----' -3
o 50 100 150 200 250 300 350 400
Temperature (OCi
Fig. 9'- COll1p,lrison of DTi\ curves diethanolJmine (DE) and (l'ielhanoIJllline (TI':) addedidi I"(used ill cOllcn:re A. DielhJJlola1l1i,le (Jddcd) 13. Trithcnol,lminc (added) C. Aminc (di[fused)
Table 9 - COll1p,lrison of corrosion ralt: of sled in dil"(usion Icst usin;! J',lkl cxtrapolmion technique
Duration S;n, Ca(OI-lh + 200 111M Sur Ca(OH)~ I 200 111M (Days) DEA TEA
III Corrnsioll rate 10 Corrosion rate (/\ 'm2
) (mlllpy) (A/111 2 ) (Illmpy)
I I.OS8 1.2621 0.7622 0.8908
5 ().4597 U.~'~:2 06145 0.712lJ
20 IU~16 03150 03004 0.3485
25 0.1] 16 o 1527 0.1044 0.1211
chromatograph 1<1. Because of complex salt formation volumetric mcthod can not be used and it has been Idenli fied usin<f the -mal <lI1alysis
11 Fi.l!. lJ, curves 1\ and B reprcseol II ) e~el1l.(; of diethanolamine (DEA) and triethanolamIne (TE ) which were added in concrete whereas eurve C represents the presence 0[' inhibitors in concrete disk through diffusion (under diffusior test). All the three curves show an endothermic peak at 140()C, which may be due to the complex salts formed by inhibitors with cement om ounds. T ,e amount of i lor prc'ent I th a cd t~mn IS mor' han l!ln , 11 e diffused through the concrete disk and thiS is clearly indicated by the strong intensity of the peak in curve A and B than in curve C.
From Table 9, it can be seen that tbe initial corrosion rate of 1.2621 mmpy of steel specimen gets reduced with time and attains a value of 0.1527 mmpy at the end of 25 days. This indicates that the DEA in the anodic compartment diffuses through the concrete disk with limt: and causes the reduction of corrosion rate of steel spccImen kept in the cathodic compartment. The corrosion rate at the end of 25 dClys
is 8.3 timcs 1 s than the corrosion rate at the end of 1 day. Similarly studies conducte on Tabu show that it diffuses through the concrete disl-. and causc~~
7.3 times reduction of corrosion rClte at the end or 2';
day,. E1 ctrochelllical data confirms the diffusion or b th inhibitors through the concrete disk
Conclusions Based on the results of the study the foI/olVing
conclusions can be drawn:
(i) The chemical cbanges occurring ill eoncrele clue to the intrusion of chlorides, sulphates can be quantitatively estimated by thermal 8nalys'is'
(ii) Presence of migrating COITOSIOt1 inhibitors, p02201anic reaction of blended cements, high and low calcium Oy ash cao be also identified by this method.
References I Brown r w & DoelT A, Celli Crillcr Res. ,0 _oorn I I.
2 Glass G K, I'agc C L & Short R. Corros SCI. 2 \ 1)<)1) 1283.
3 Lawrcncc C D, Mag Crmcr Res. 42 (1990) 249
4 RJsheeduzzafar, ACt Maler), 89 (1992 574.
5 DongXu L I, Yilllin Chen, Ji:lOhuJ Su & Xucquanug, Celli COllcr Res. 30 (2000) 8~ I.
6 Dwcek J, Buehlcr r M, Coelho A C V & Cartledge r K, Tltel'lllOc:/lilll Aua. 346 (2000) 105.
7 Dhir R K, Jhones M R & Ahll1ed H H, Celli lOller Res, I)
(1990) 57lJ.
'i T lli ~'. c'n '·r. '1011 01 ,·Ie..:! ill ollcrde ( '\Vedlsh CClllcnt ,Hid COllcrctl: I c,corch nstIlute, loekhllllll), 19,2,46.
9 Manu SanthJllalll, Cohen C D & Olek J, Cem Caller lies. :n (2003) 325.
10 Stutzman r E, Applicatioll 0/ scallnillg eleclroll /IIier ill cemelll alld cOllcrele pell'O:;rnpln' In A TM STI'-, _. _, PerrogrJphy of Cel11entitious MUlerials, edited by S Dehaycs & D Stark, 1993, 74.
I I Struble L. & StutzmJn r E,.1 Maler S 'i Leu. l:: (1989) 632.
1_ ,u'm 11 P [, & ClIfton J R Pith. 1/ I 1,( t' ,H' (~"I/I(/!I
IfICIU.lcl1PI' La.; g.' c ada Il)'» I
l3 Sianika T, Madt:j T . Jakubd.ov D, TIIelwochim 11 CIa. lJ3 (1985)601
14 Vedalakshmi R, SundJra Raj A, Srinivasan S & C;~lI1esh
BJbu K, Therl110chim IIctn, 2003,4"
15 BhJtly J I, Dollimon: D, Gal11lcn (j A, MJngabhai R .I & Olmez H, TIIennochim IIC/o. 106 (1986) 115.
16 ASTM C642-80. Standard I~sl method 101' specific grJVily. Jbsorption and voids in hardened eoncrele. ASTM siandords, 1995, V.04.0'" 111-31 Il.
17 Jngatl'S' 011 BT, Cem COliC' ",21 1(96)'1
18 Lea F M, The ChemislJ:v of Cell1el11 ({n.! ('11/1cr,'Il'. 4'1> cdn (Lo ldon ~dwJ'd Arnold), 19; t 1~ ..

INDIAN J. CHEM. TECHNOL., JULY 2008 396
19 Monzo J Paya, BOIT~lchero .I M V, Peris-Mora E & Velazqucz P, 7/1• CAN.HETIACI III/ Can! on Jill ash. silica
28 Merchand.l, Smnson E, MaltisY & Beaudoin J J, Ccm COlier Res, 24 (2002) 317.
JiIlIlC. s!n:; alld IInl/lra! poz::n!alls in cOllcrc/c. SP-199, 29 RI LEM technical Committee ()8-NM H. ivllltcria!s (/I/(! Supplementary volume, ACT Detroit, 200 1,241. COlls/mctiolls. 19 (1986) 137.
20
21
22
23
Ubhriaco P & Calabrese D, TherJllochim 'leta, 321 (1998) 14.\. Hubbcrt Wickcr W & Heidemann 0, 1" CANMETIAC! In/ COllI all Jill ash. silica jillllc. s!ag alld na/llra! pozzo!al/s in cOl/ere/c. SP-199, Vol. I, ACI, Detmit, 2001, 83. Singh S P, Natiollll! Con/i;rellce 011 Therma! Allo!ysis. Vol. I BAR . Mumb,'\i, Imlia, 2002, 69. Taylor II T W, Ccmellt Chemistry, 2nd cdn (Thomas Telford, London), 1Cll)7, 102.
30
31
32
33
34
Wee T H, Suryavanshi A I( & Wang S r, AC! iv!uter J. 97 (2000) 536
Huachang, Pei Jane Huang & Hou S C, Mmcr ChclII Phy. ~X
(1999) 12.
Rasheeduu;lL\r, Hussain C H & AI-Saadolln S S, COli ('uller Rcs, 21 (5) (1991 )779,
Rasheeduw1far, A C! !vIa/er J. 89(6) (1992) 574.
Hubbard F H, Cem Caner Res, 15 (1985) 185
24 Yuan R L & Cook .I E, /'<1 In/ Can! on the lise o!Jly ash. 35 Dhir R K, EJ-Mohr Mak & Dyc\' T D, Con COlier Res, 2()
si!icli /ill!lc ((1If! other lIIille/'{/1 by- products ill concrete. SP (19%) 1767 79, AeI, Dwiot, 1983,307. 36 Morris W & Vazquez M, Cem Caller Res. 32 (2002) 259.
25 Lamond.l F, !I'/ III/ Con!011 the use ofJly as!I. si!ica/illne I1l7d 37 Batis G, RoutoulilS A & Rakanta E, CCIII Caller Comp, 25 other mlilera! hy- products ill COllcre/e, SP-79, ACI, Detriot, (2003) 109
26 1983,47. Rive\'a.l Sanchez de Rops M I &. Frias M, 7'" CAN/'vfETIAC!
38 Biegovic 0, Miksic B A & Stchly R D, (2000) 444.
Moter Corms. 51
27
!nt COllfon/ly US!I. silica jill11e. s!ag lind lIatum! pOZZO!OIlS ill concrete. SP-199, Supplementary volume, ACI Detroit, 200 1,357. Mangat P S & Khatib J M, A CI !vIa/er J. 92 (1995) 542
39 SHRP Report No.SHRY-87C-102C. SHRP I~epon on Feasibility studies on tbe injection of syncrgistic corrosion inhibitors for protection (\1' concrete bridgc componcnts SHRP, USA, 1987, I.
Indial Vol.


![LIFE AND MICRO GRAVITY [OLMSA] SSTTAATTIIOO International ...€¦ · How do various transport phenomena affect the formation and quality of selected materials?* How can containerless](https://img.dokumen.tips/doc/110x75/5f490b3bcd385c12f3642bb1/life-and-micro-gravity-olmsa-ssttaattiioo-international-how-do-various-transport.jpg)


