Embed Size (px)
Citation preview

Identification of Residual Oil Zones (ROZs) in the Williston
and Powder River Basins DE-FE0024453
Charles Gorecki Energy & Environmental Research Center
(EERC)
U.S. Department of Energy ((DOE) National Energy Technology Laboratory (NETL)
DE-FOA0001110 Kickoff Meeting December 4, 2014

2
Presentation Outline • Benefit to the program • Project overview • Methodology • Expected outcomes • Organizational chart • Communication plan • Task breakdown • Deliverables–milestones–decision points • Risk • Proposed schedule • Summary

3
Benefit to the Program
• Second and fourth goals of Carbon Storage Program: – Improve reservoir storage efficiency while ensuring
containment effectiveness. – Develop best practices manuals (BPM).
• Potential ROZs will be identified and evaluated for oil recovery and CO2 storage potential.
• Repeatable methodology will allow others to perform similar assessments in sedimentary basins.

4
Project Overview: Goals and Objectives
Objectives: • Identify and characterize the presence and extent of
potential ROZs in the Williston Basin (WB) and Powder River Basin (PRB).
• Estimate residual oil in place and CO2 storage potential (Goal 2).
• Determine feasibility of CO2 enhanced oil recovery (EOR) in identified ROZs (Goal 2).
• Develop repeatable methodology for sedimentary basins to be included in a BPM (Goal 4).

5
Project Overview: Goals and Objectives, cont.
Success criteria: • Validated petroleum system models of the WB and PRB
complete.
• Milestone 6 – ROZ fairway mapping complete.
• Milestone 7 – Oil and CO2 storage resource assessments complete.
• Deliverable 4 – Final report, including BPM, complete.

Methodology – Overview
6
1. Build petroleum system models to integrate all physical aspects (source, trap, seal, reservoir) and time (charge) to identify and quantify hydrocarbon generation, migration, and placement.
2. Use field tools such as pulsed-neutron logs (PNLs) to validate models and presence of ROZs.
3. Build probabilistic fairway maps of each basin.

7
Methodology – Basin Modeling
Provide a complete record of the evolution of a petroleum system, including: • Deposition and erosion. • Pressure and compaction. • Heat flow analysis. • Petroleum generation. • Fluid pressure, volume,
temperature analysis. • Reservoir volumetrics. • Structural evolution. • Generation, migration, and
accumulation.

8
Methodology – Literature Review
Goals: • Understand ROZs and previous work in
basin modeling. • Translate geologic history of basins as
an input for modeling. • Gather data required for model
construction.

9
Methodology – 1-D and 2-D Modeling
1-D Models: 2-D Models: • Point location
examination of: – Burial history – Temperatures – Boundary
conditions
• Rapid cross-sectional analysis to investigate lateral migration
10
Methodology – Pulsed-Neutron Logging
• Up to 20 wells (total for both basins) chosen based on 2-D modeling results.
• Wireline logging measurement: – Sigma (rate of capture of
thermal neutrons). • Means of model validation:
– Provides gas and fluid saturations, pressure and temperature profiles, and formation lithology.
11
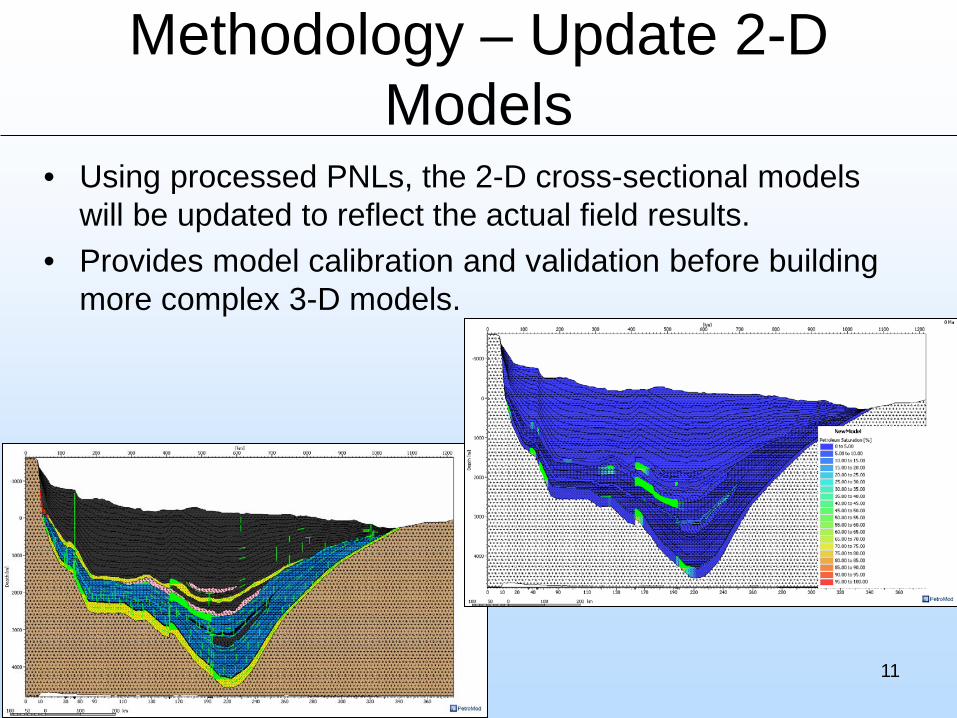
Methodology – Update 2-D Models
• Using processed PNLs, the 2-D cross-sectional models will be updated to reflect the actual field results.
• Provides model calibration and validation before building more complex 3-D models.

12
Methodology – 3-D Models
• Robust basin analysis that provides more detail than a simplified 2-D model.
Energy.usgs.gov
www.brgm.eu

13
Methodology – Select Submodels
• Select regions of interest will be further examined to investigate: – Salt movement. – Hydrogen sulfide existence. – Free sulfide migration.
Expulsion Cracks
Free Sulfur
Noncontinuous Oil Staining

14
Methodology – Risk Analysis • Uncertainty analysis using Monte Carlo simulations will be performed to
better understand the impact of key variables. • Range of data for each variable will come from literature review database. • Probabilities, confidence intervals, error bars, correlations, and calibration
will be considered to find the best model fit. • High-, mid-, and low-probability models will be used in fairway mapping.
http://www.brighton-webs.co.uk/montecarlo/simulation.aspx
Analyze
• Histograms • Tornado plots • Cross plots • Distributions

15
Methodology – ROZ Fairway Mapping
• Create play fairway maps showing discovered brownfield and greenfield ROZs.
• Display high, mid, and low probabilities.

16
• Analyze potential ROZs to determine feasibility for enhanced recovery using CO2.
• Use published ranges for recovery and utilization factors for conventional CO2 EOR projects.
• Make high, mid, and low estimates.
16 www.aogr.com
Methodology – CO2 EOR Feasibility Study

Expected Outcomes • Petroleum system models for the WB and PRB. • Oil in place and CO2 storage recourse estimates
for identified potential ROZs. • ROZ play fairway maps. • A repeatable methodology that could be applied to
other sedimentary basins around the United States presented in BPM.
17

18
Organization Chart/ Communication Plan

19
Communication Plan
• Regular update meetings with project team. • Communication with partners/consultants via
conference call, e-mail, Webinar, and in-person meetings.
• Quarterly reports and annual briefings to DOE. • Major decisions affecting scope, budget, or time line
will be discussed with DOE project manager.

Task 1: Project Management and Planning
20
Includes management and reporting on the project, NEPA compliance, and submission of data to the Energy Data Exchange (EDX): • Subtask 1.1 – Perform Project Management
– Subtask 1.1.1 – Project Management Plan – Subtask 1.1.2 – Provide Briefings and Ensure NEPA
Compliance
• Subtask 1.2 – Project Reporting – Subtask 1.2.1 – Project Reporting – Subtask 1.2.2 – Data Submission to NETL EDX

Task 2: Literature Review, Data Collection, and Simulation of 1-D and 2-D PetroMod Models
21
• Subtask 2.1 – Literature Review and Data Collection – Literature review will be performed to understand existing
work on ROZs and to collect various data on the WB and PRB. Wells will be selected for the field work in Task 3.
• Subtask 2.2 – Build Dynamic1-D PetroMod Models – 1-D models will be constructed and simulated using the
data and wells found in Subtask 2.1.

22
Task 2: Literature Review, Data Collection, and Simulation of 1-D and 2-D PetroMod Models, cont.
• Subtask 2.3 – Build Dynamic 2-D PetroMod Models – The 1-D models will be used to build 2-D models in order
to reconstruct hydrocarbon generation and migration.
• Subtask 2.4 – Recalibrate, History-Match, and Simulate 2-D PetroMod Models Based on Field Logging Interpretation – Selected 2-D models will be updated based on PNL
interpretations. This Subtask will be iterative until field work is complete.

Task 3: Pulsed-Neutron Logging, Processing, and Interpretation
23
• Subtask 3.1 – Planning and Preparation – Six to 20 wells will be selected based on Task 2.
Operators will contacted for well access.
• Subtask 3.2 – Pulsed-Neutron and Temperature Logging Operations – PNLs will be collected in wells within potential ROZs
identified in Task 2. Processing and interpretation will provide fluid saturations, neutron porosity, and temperature.

Task 4: Build 3-D PetroMod Models
24
• Subtask 4.1 – Build, Calibrate, History-Match, and Simulate 3-D PetroMod Models – 3-D models will be built and simulated to better understand
oil generation and migration in the WB and PRB.
• Subtask 4.2 – Select Submodels for Evaluation of Salt Movement, Hydrogen Sulfide Existence, and Free Sulfide Migration – Regions of interest determined from Tasks 2 and 3 will be
examined through a comprehensive hydrogeology, structural, and geochemical history to help predict potential ROZ extents and hydrocarbon volumes.

Task 4: Build 3-D PetroMod Models, cont.
25
• Subtask 4.3 – Perform Risk Analysis – An uncertainty analysis using Monte Carlo simulations will
be performed to examine the influence of each key variable used in the simulation of 3-D PetroMod models. This analysis will enhance the probabilistic ranking of economic ROZs.

Task 5: ROZ Fairway Mapping, Volumetric Resource Estimates, and Preparation of Methodology to Be Used in Other Basins
26
• Subtask 5.1 – Build, Calibrate, History-Match, and Simulate 3-D PetroMod Models – Greenfield ROZ fairway extent and saturation maps will be
created. Varying levels of confidence and high, mid, and low oil in place values will be incorporated.
• Subtask 5.2 – CO2 EOR Feasibility Study – CO2 EOR feasibility will be assessed for each ROZ based
on residual oil saturations and oil properties. CO2 storage resource potential will also be estimated for the identified ROZs.

Deliverables – Milestones – Decision Points
27
Task/ Subtask Milestone Title
Planned Completion
Date Verification Method 1.2 D1 – Updated Project Management Plan (PMP) 12/31/14 PMP file 1.1 M1 – Project Kickoff Meeting Held 1/31/15 Presentation file 1.2 D2 – Project Fact Sheet 2/28/15 Data for project fact sheet 2.2 M2 – First Cross Section of 1-D Model
Completed 2/28/15 Reported in subsequent quarterly report
2.3 M3 – Potential ROZ Identified 6/30/15 Reported in subsequent quarterly report 3.2 M4 – First PNL Interpretation Completed 9/30/15 Reported in subsequent quarterly report 1.2 D3 – Data Submission to EDX 4/30/16
10/31/17 Data uploaded to EDX
3.2 M5 – First PNL Collection Completed 4/30/16 Reported in subsequent quarterly report 4.3 M6 – Risk Analysis Completed 1/31/17 Reported in subsequent quarterly report 5.2 M7 – Resource Assessment Completed 6/30/17 Reported in subsequent quarterly report 1.1 M8 – Debriefing Meeting with Operators Held 8/31/17 Reported in subsequent quarterly report 1.2 D4 – Final Report (including a BPM) 10/31/17 Final Report submitted
D = Deliverable M = Milestone

Deliverables – Milestones – Decision Points, cont.
28
• Sufficient data to construct 1-D and 2-D models • 2-D models required for selection of wells for field
work • Go/No-Go Decision Point:
– Before the collection of PNLs (Task 3), operator’s permission to access the field site, NEPA clearance, and written authorization from the DOE project officer will be obtained.
• Sufficient data to construct 3-D models

Risk
29
Category Potential Risk Mitigation Resource/Site Availability
• Insufficient computing capability
• Multiple existing computer stations. • High-performance computing cluster.
• Field equipment unavailable
• Contingency plans for backup equipment. • Experienced service provider.
• Site access not granted • Staff and consultants with field work experience and relationships in WB and PRB.
• Lack of personnel
• Cross-training and redundancy in skill sets. • Senior management overseeing personnel and resource availability.
Technical Difficulties
• Insufficient data or loss of data
• Large in-house geological database. Large amount of public data easily available.
• Workstations and servers backed up.
• Inability to model target basins with sufficient detail
• Prior training and experience with required software. • Large in-house geological database. Large amount of public data easily
available.
• Problems collecting field data
• Experienced EERC staff on-site to oversee field work. • Existing relationship with service provider who has demonstrated success in
PNLs. • Consultants with decades of experience in oil and gas industry.

Risk, cont.
30
Category Potential Risk Mitigation Environmental, Health, and Safety (EHS)
• Personal injury • EERC personnel will complete safety training prior to and on-site for field work.
• Personal protective equipment will be used. • Existing regulatory guidelines, safety protocols, and reporting
requirements for commercial oil and gas operations.
• Environmental damage • NEPA compliance. • Existing regulatory guidelines, safety protocols, and reporting
requirements for commercial oil and gas operations.
Management Issues • Inability to manage large-scale project
• Majority of work conducted at the EERC facility allowing regular interaction and communication with project team members.
• Planning meetings held before field work. • Proven working relationship with consultants and project partner. • Existing standardized workflow processes, communication protocols,
and contractual procedures. • Working knowledge of managing similar-scale resource assessment
and oil and gas-related projects.

31
Proposed Schedule Nov Dec Jan Feb Mar Apr May Jun Jul Aug Sep Oct Nov Dec Jan Feb Mar Apr May Jun Jul Aug Sep Oct Nov Dec Jan Feb Mar Apr May Jun Jul Aug Sep Oct
11/1/2014 10/31/2017
M1 M8
1.1 – Perform Project Management 11/1/2014 10/31/2017
D1 D2 D3
1.2 – Project Reporting 11/1/2014 10/31/2017
11/1/2014 12/31/2016
2.1 – Literature Review and Data Collection 11/1/2014 4/30/2015M2
2.2 – Build Dynamic 1-D PetroMod Models 12/1/2014 9/30/2015M3
2.3 – Build Dynamic 2-D PetroMod Models 3/1/2015 9/30/2015
10/1/2015 12/31/2016
1/1/2015 12/31/2016
3.1 – Planning and Preparation 1/1/2015 10/31/2016 M4 M5
3.2 – Pulsed-Neutron and Temperature Logging 8/1/2015 12/31/2016
5/1/2016 1/31/2017
5/1/2016 1/31/2017
7/1/2016 1/31/2017
M6
4.3 – Perform Risk Analysis 12/1/2016 1/31/2017
2/1/2017 8/31/2017
5.1 – ROZ Fairway Mapping 2/1/2017 4/30/2017M7
5.2 – CO2 EOR Feasibility Study 2/1/2017 6/30/2017
7/1/2017 8/31/2017
Summary Task Activity Bar M1 – Project Kickoff Meeting Held M7 – Resource Assessment Completed D1 – Updated PMP
Milestone (M) M2 – First Cross Section of 1-D Model Completed D2 – Project Fact Sheet
Deliverable (D) M3 – Potential ROZ Indentified D3 – Data Submission to EDX
Critical Path M4 – First PNL Interpretation Completed D4 – Final Report
M5 – First Round of PNL Collection Completed
M6 – Risk Analysis Completed
4.1 – Build, Calibrate, and Simulate 3-D PetroMod Models
4.2 – Select Submodels for Evaluation of Salt Movement, Hydrogen Sulfide Existence, and Free Sulfide Migration
Task 5 – ROZ Fairway Mapping, Volumetric Resource Estimates, and Preparation of Methodology to Be Used in Other Basins
5.3 – Propose Methodology for Others to Identify and Assess ROZs in Sedimentary Basins
Task 4 – Build 3-D PetroMod Models
Task 3 – Pulsed-Neutron Logging, Processing, and Interpretation
Task 1 – Project Management and Planning
2014
2.4 – Recalibrate, History Match, and Simulate 2-D PetroMod Models Based on Field Logging Interpretations
Task 2 – Literature Review, Data Collection, Compilation and Simulation of 1-D and 2-D PetroMod Models
Start Date
End Date
M8 – Debriefing Meeting with Operators Held
Budget Period 2
Key for Deliverables (D)
201720162015Budget Period 1
D3 & D4
Key for Milestones (M)

Summary
32
• A novel approach combining basin evolution modeling and field work to identify and evaluate the presence and extent of ROZs will result in: – Petroleum system models for the WB and PRB. – Oil in place and CO2 storage recourse estimates for
identified potential ROZs. – ROZ play fairway maps. – A repeatable methodology that could be applied to other
sedimentary basins around the United States.