Embed Size (px)
Citation preview

Abstract
Automated data extraction and analysis techniques were applied to open-file 3D seismic volumes from the North West Shelf creating visual databases of virtually all peak and trough surfaces. Examples from the Gorgon, Glencoe and Bonaventure 3D seismic datasets reveal compelling evidence of upward fluid flow from the Triassic through the shallow subsurface to the seafloor. Further analysis of surfaces using new differential geometry techniques, provides quantitative object detection and insights into fluid flow related geomorphological processes.
A variety of fluid flow features are shown throughout the subsurface, including conical-shaped depressions (e.g. pockmarks), polygonal faulting and sediment remobilization features (e.g. injectite/intrusions), which form along fluid migration pathways. The creation of a model for fluid flow allows informed assessments of whether potential prospects received charge and if later stages of upward fluid flow are evidence of charge breach and/or present potential geohazards for drilling and field operations. However, modeling the process is an extremely complex problem requiring many simplifying assumptions with respect to variations in fluid density, temperatures, and pressures all of which dramatically impact upon the properties of the rock and the behaviour of the fluids within them. The complexity of this process in turn complicates estimations of velocities and directions of fluid movement. Therefore, any insights or guidance gleaned from morphometric features observed in the seismic data
volume undoubtedly help validate or improve existing fluid flow models. The use of global algorithms to automatically and simultaneously examine entire 3D data volumes in a timely and objective manner provides an effective platform for mining objects embedded in extracted surfaces for inclusion in the model of the subsurface.
Introduction
As oil and gas exploration expands on the North West Shelf (NWS) of Australia, there is an increasing amount of 3D seismic data being acquired, adding to the 550,000 km2 already collected in Australia. Examples of fluid1 flow features taken from a selection of open-file 3D seismic surveys (Gorgon, Glencoe & Bonaventure) from the NWS are presented (Fig.1). The three surveys together provide about 10,000 km2 of coverage across the Northern Carnarvon Basin. The surveys were designed to target play types that include tilted Triassic fault blocks and associated drape structures, intra-formational stratigraphic or cross-fault structures, as well as Lower Cretaceous basin floor fans and Oxfordian shoreface sandstone stratigraphic traps (DRET, 2013). The post-stack versions of the 3D surveys were processed using an automated genetic algorithm inspired by the Human Genome Project (Seisnetics™), which delivers an objective pre-interpretation database containing virtually all surfaces within the 3D seismic volumes (Dirstein & Fallon, 2011). The extracted surfaces and their associated attribute maps provide evidence
Identification of Fluid Flow Features in the Seafloor and Subsurface and their Implications
for Prospect and Geohazard Assessment: Examples from the Australian Northwest Shelf
J.K. Dirstein1, J.V. Hengesh2 & A.J. Stanley1
Keywords: Polygonal Faulting, Pockmarks, Fluid-Flow, Automated Interpretation, Surface Analysis
1 TotalDepth, Pty Ltd, 21 Churchill Ave, Subiaco, WA, 6008, Australia Email: [email protected]
2 Centre for Offshore Foundation Systems, The University of Western Australia, M053, 35 Stirling Highway, Crawley, WA, Australia 6009
Perth, WA, 18–21 August 2013 West Australian Basins Symposium 2013 1
1 The term “fluid” includes gas, water, oil and molten rock that migrate under the influence of a pressure gradient (Djunin & Korzun, 2005).

J.K. DIrStEIN, J.V. HENGESH & A.J. StANlEy
2 West Australian Basins Symposium 2013 Perth, WA, 18–21 August 2013
a
b
x-se
ctio
n Lo
catio
n
Fig
ure
1.
Map
of
the
No
rth
Wes
t Sh
elf
sho
win
g t
he
loca
tio
n o
f th
e Ex
mo
uth
Pla
teau
wit
hin
th
e N
ort
her
n C
arn
arvo
n B
asin
. Th
e o
pen
-file
3D
su
rvey
s (G
org
on
, Gle
nco
e an
d B
on
aven
ture
)
are
sho
wn
alo
ng
wit
h k
ey w
ells
. Th
e lo
cati
on
s o
f tw
o r
egio
nal
lin
es f
rom
Fig
ure
2 a
re a
lso
hig
hlig
hte
d.
Perth, WA, 18–21 August 2013 West Australian Basins Symposium 2013 3
this study demonstrate the efficacy of automatic detection of objects and their geometrically quantifiable parameters.
Geological and Regional Setting
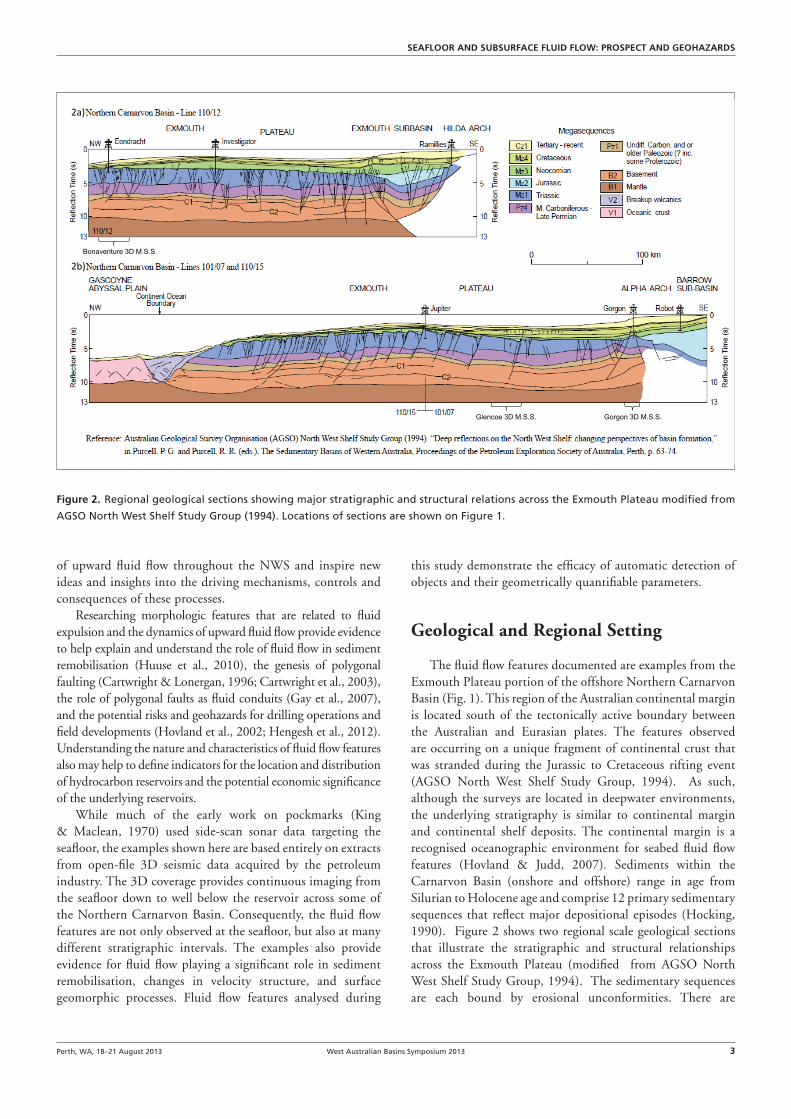
The fluid flow features documented are examples from the Exmouth Plateau portion of the offshore Northern Carnarvon Basin (Fig. 1). This region of the Australian continental margin is located south of the tectonically active boundary between the Australian and Eurasian plates. The features observed are occurring on a unique fragment of continental crust that was stranded during the Jurassic to Cretaceous rifting event (AGSO North West Shelf Study Group, 1994). As such, although the surveys are located in deepwater environments, the underlying stratigraphy is similar to continental margin and continental shelf deposits. The continental margin is a recognised oceanographic environment for seabed fluid flow features (Hovland & Judd, 2007). Sediments within the Carnarvon Basin (onshore and offshore) range in age from Silurian to Holocene age and comprise 12 primary sedimentary sequences that reflect major depositional episodes (Hocking, 1990). Figure 2 shows two regional scale geological sections that illustrate the stratigraphic and structural relationships across the Exmouth Plateau (modified from AGSO North West Shelf Study Group, 1994). The sedimentary sequences are each bound by erosional unconformities. There are
of upward fluid flow throughout the NWS and inspire new ideas and insights into the driving mechanisms, controls and consequences of these processes.
Researching morphologic features that are related to fluid expulsion and the dynamics of upward fluid flow provide evidence to help explain and understand the role of fluid flow in sediment remobilisation (Huuse et al., 2010), the genesis of polygonal faulting (Cartwright & Lonergan, 1996; Cartwright et al., 2003), the role of polygonal faults as fluid conduits (Gay et al., 2007), and the potential risks and geohazards for drilling operations and field developments (Hovland et al., 2002; Hengesh et al., 2012). Understanding the nature and characteristics of fluid flow features also may help to define indicators for the location and distribution of hydrocarbon reservoirs and the potential economic significance of the underlying reservoirs.
While much of the early work on pockmarks (King & Maclean, 1970) used side-scan sonar data targeting the seafloor, the examples shown here are based entirely on extracts from open-file 3D seismic data acquired by the petroleum industry. The 3D coverage provides continuous imaging from the seafloor down to well below the reservoir across some of the Northern Carnarvon Basin. Consequently, the fluid flow features are not only observed at the seafloor, but also at many different stratigraphic intervals. The examples also provide evidence for fluid flow playing a significant role in sediment remobilisation, changes in velocity structure, and surface geomorphic processes. Fluid flow features analysed during
2a)
2b)
Gorgon 3D M.S.S. Glencoe 3D M.S.S.
Bonaventure 3D M.S.S.
Figure 2. Regional geological sections showing major stratigraphic and structural relations across the Exmouth Plateau modified from
AGSO North West Shelf Study Group (1994). Locations of sections are shown on Figure 1.
SEAFloor AND SubSurFAcE FluID Flow: ProSPEct AND GEoHAzArDS

4 West Australian Basins Symposium 2013 Perth, WA, 18–21 August 2013
Inver
sion s
tructu
re re
lated
to
reve
rse re
activ
ation
of
forme
r nor
mal fa
ult.
Bon
aven
ture
3D
M.S
.S.
Fig
ure
3.
AG
SO s
eism
ic li
ne
110/
12 s
ho
win
g m
ajo
r su
rfac
es, i
nve
rsio
n s
tru
ctu
res
and
loca
tio
n o
f B
on
aven
ture
3D
M.S
.S. (
mo
difi
ed f
rom
DR
ET, 2
013)
.
J.K. DIrStEIN, J.V. HENGESH & A.J. StANlEy

Perth, WA, 18–21 August 2013 West Australian Basins Symposium 2013 5
Methodology
While the objective of acquiring seismic data is to help build a more reliable geological model, the practice of 3D seismic interpretation is often highly focused on a primary zone of interest and perhaps a primary area of interest, as both time and economic constraints prohibit the interpreter from examining an entire seismic 3D volume (with equal focus). To analyse and investigate multiple 3D volumes from the NWS in a timely manner the datasets were processed using a global patented pre-interpretation method, Seisnetics, which delivers “an unbiased extraction of virtually all surfaces from 3D seismic volumes” (Dirstein & Fallon, 2011). The analysis system uses an evolutionary process in the form of genetic algorithms that have been inspired by the Human Genome Project. The genetic analogy considers a seismic trace similar to a chromosome and a waveform segment of the seismic trace a gene. Therefore, a seismic volume consists of a great many chromosomes and an even greater number of genes. The pre-interpretation process searches objectively both locally and globally for waveforms which evolve into populations (surfaces) of genetically related shapes. As the populations continue to evolve, the common waveform associated with each population of waveforms (genotype) also evolves until all (trough and peak) surfaces have been identified and catalogued into a visual database. The automatically extracted peak and trough surfaces and associated high quality attributes (e.g. amplitude, two-way-time [TWT] and fitness) maps were accessible from a 3D visual database. We are not advocating the use of all surfaces in the geological model; however, it is important the geomodel captures sufficient information which describes the variability in the data volume. Having all the surfaces available provides an opportunity to manually or automatically mine this visual database to ensure this variability is captured. Moreover, the interpreter needs to become visually aware of anomalous aspects of the data before they can consider their significance.
While the TWT and amplitudes attributes are well known instantaneous attributes, the fitness attribute for each surface provides an indication of genetic similarity for each individual trace in the population compared with the common waveform of that population (genotype). Since the genotype for each surface has evolved as the population of waveforms grows and merges with other sub populations, the fitness map also provides an indication of waveform stability associated with the TWT surface. A high degree of genetic similarity between a trace in a population and that population’s genotype is indicated by the colour green on the fitness maps. The fitness colours blue and red indicate that the genetic relationship is weaker (e.g. 1st or 2nd cousin). By reviewing the database of surfaces and their attributes, fluid flow features were identified in the seismic volumes. These selected horizons were used to demonstrate these fluid flow features over several stratal levels from the Triassic to the seafloor.
Further automated analyses of these selected surfaces were undertaken by applying differential geometry to create a
three Palaeozoic sequences that formed during the Silurian, Devonian to early Carboniferous, and Late Carboniferous to Permian (Hocking, 1990). These deposits accumulated in a series of intra-continental rift basins that form the southern part of the late Palaeozoic-early Mesozoic Westralian Superbasin (Yeates et al., 1987).
The Late Triassic to earliest Cretaceous and Cretaceous sequences of the Northern Carnarvon Basin (Fig. 1) reflect development of the rift system related to fragmentation of Gondwanaland and separation of Greater India from the western margin of the Australian craton. The sedimentary sequences formed in a variety of settings including a pre-rift trough during Triassic time, a rift valley in Jurassic time, and post-breakup troughs and trailing margin shelves during Cretaceous time (Hocking, 1990; Exon & Buffler, 1992; Exon et al., 1992; Baillie et al., 1994). The Late Cretaceous and Cenozoic sequences are dominated by carbonate sediments that formed through progradation of the continental shelf (Hocking, 1990) and carbonate-dominated hemipelagic sedimentation (Von Rad & Haq, 1992; Boyd et al., 1992).
Many continental slopes define the transition from continental crust to oceanic crust. However, the Carnarvon Basin deposits that form the Exmouth Plateau represent a fragment of continental material that was stranded during the rifting process (AGSO North West Shelf Study Group, 1994). As such the continental slope on the Exmouth Plateau represents the transition from the continental shelf (proper) to a stranded continental fragment that stalled during the rifting process. Geological evidence of syn-rifting lava flows at the ocean-continent boundary (Fig. 1), fluvial/subaerial depositional environments for pre-rift sedimentary sequences, as well as subsidence modelling (Kaiko & Tait, 2001) indicate that 1 to 4 km of syn and post-rift subsidence has occurred (from east to west) across the Exmouth continental margin. Total subsidence is suggested to be a combination of tectonic subsidence and thermal sagging during rifting and cooling of the Late Jurassic to Early Cretaceous seafloor. It is this tectonic subsidence and thermal sagging that has led to the depressed elevation (i.e., deeper water depths) of the continental fragment that forms the Exmouth Plateau part of the Northern Carnarvon Basin (DRET, 2013). The Exmouth Plateau sedimentary sequence is dominated by up to 15,000 m of Triassic succession with the Jurassic section either thin or absent (DRET, 2013).
Former rift-related extensional structures have undergone Neogene to Holocene transpression leading to both transform and contractional reactivation and structural inversion of basin sequences (Boyd et al., 1992; Cathro & Karner, 2006; Keep & Moss, 2000; Kaiko & Tait, 2001; Keep et al., 2007) (Fig. 3). Some of these inversion structures underlie the continental slope and are targets for exploration activity. These inversion structures also are sources of upward fluid flow, gas and fluid venting, as well as potential earthquake sources. Thus, slopes above inversion structures are susceptible to failure from several different triggering mechanisms (Hengesh et al., 2012).
SEAFloor AND SubSurFAcE FluID Flow: ProSPEct AND GEoHAzArDS

6 West Australian Basins Symposium 2013 Perth, WA, 18–21 August 2013
Ampl
itude
Fitn
ess
TWT
Sub-
Mar
ine
Cany
ons
On
Shel
f Bre
ak
Zone
of S
lum
ping
30 km
Gor
gon
3D (1
992)
Blu
eBel
l 1
Chr
ysao
r 1
NG
3 N
G2
NG
4
NG
4 N
G6
CG
4 G
3 G
1 10 km
a b c
d Lo
w
Fit
ness
High
-ve
Ampli
tude
+
ve
High
S
tructu
re
Low
Fig
ure
4.
Seafl
oo
r se
ism
ic a
ttri
bu
te m
aps
fro
m t
he
Go
rgo
n 3
D s
eism
ic s
urv
ey.
a) r
end
ered
TW
T;
b)
fitn
ess;
an
d c
) in
stan
tan
eou
s am
plit
ud
e.
At
the
scal
e p
rese
nte
d s
mal
l co
nic
al
dep
ress
ion
s ar
e d
iffi
cult
to
see
on
th
e fi
tnes
s an
d a
mp
litu
de
map
s. R
end
erin
g a
nd
sh
adin
g i
mp
rove
s th
eir
visi
bili
ty
on
th
e TW
T m
ap.
Ther
e is
a h
igh
er c
on
cen
tati
on
of
po
ckm
arks
wit
hin
th
e zo
ne
of
slu
mp
ing
. Fi
eld
ou
tlin
es a
nd
wel
l lo
cati
on
s ar
e al
so h
igh
ligh
ted
(A
bb
revi
atio
ns
incl
ud
e: N
G=
No
rth
Go
rgo
n ;
CG
=C
entr
al G
org
on
an
d G
=G
org
on
). T
he
inse
rted
dia
log
ue
bo
x (d
) sh
ow
s a
two
leve
l qu
ery
that
was
ap
plie
d t
o t
he
dat
abas
e o
f m
orp
ho
met
ric
feat
ure
s fr
om
th
e TW
T su
rfac
e m
ap. T
he
resu
lts
of
this
qu
ery
are
sho
wn
in t
he
nex
t fi
gu
re.
J.K. DIrStEIN, J.V. HENGESH & A.J. StANlEy
Perth, WA, 18–21 August 2013 West Australian Basins Symposium 2013 7
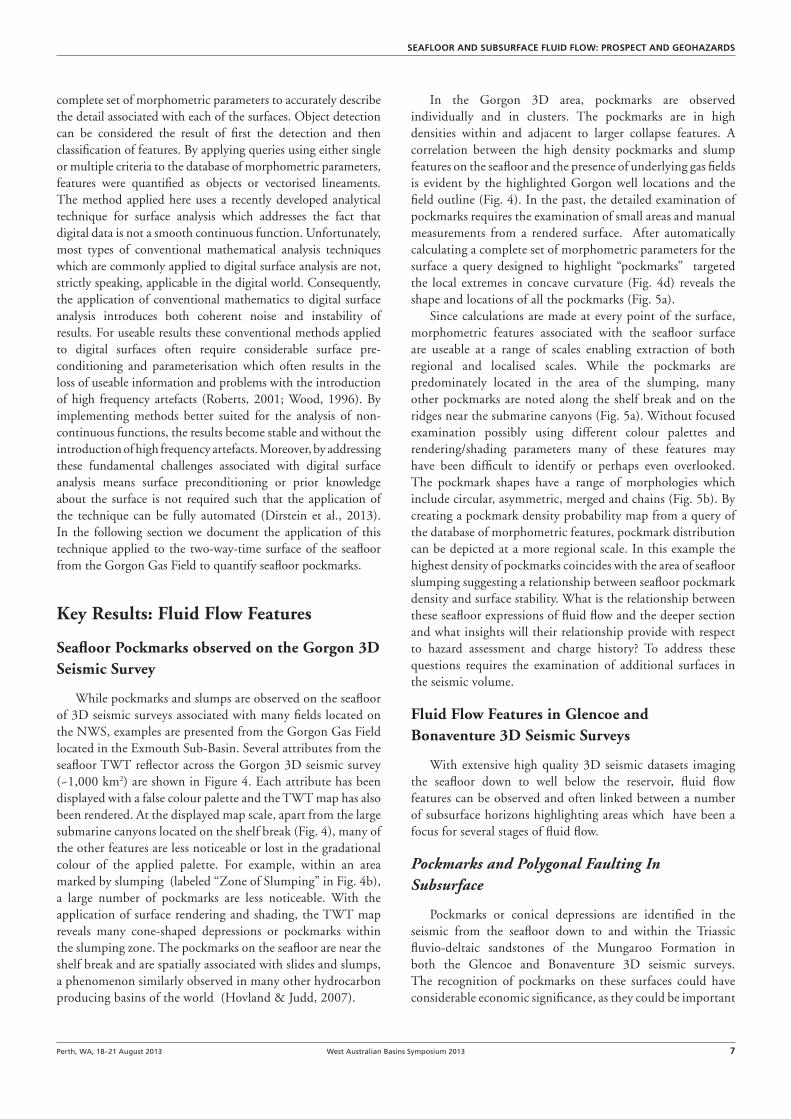
In the Gorgon 3D area, pockmarks are observed individually and in clusters. The pockmarks are in high densities within and adjacent to larger collapse features. A correlation between the high density pockmarks and slump features on the seafloor and the presence of underlying gas fields is evident by the highlighted Gorgon well locations and the field outline (Fig. 4). In the past, the detailed examination of pockmarks requires the examination of small areas and manual measurements from a rendered surface. After automatically calculating a complete set of morphometric parameters for the surface a query designed to highlight “pockmarks” targeted the local extremes in concave curvature (Fig. 4d) reveals the shape and locations of all the pockmarks (Fig. 5a).
Since calculations are made at every point of the surface, morphometric features associated with the seafloor surface are useable at a range of scales enabling extraction of both regional and localised scales. While the pockmarks are predominately located in the area of the slumping, many other pockmarks are noted along the shelf break and on the ridges near the submarine canyons (Fig. 5a). Without focused examination possibly using different colour palettes and rendering/shading parameters many of these features may have been difficult to identify or perhaps even overlooked. The pockmark shapes have a range of morphologies which include circular, asymmetric, merged and chains (Fig. 5b). By creating a pockmark density probability map from a query of the database of morphometric features, pockmark distribution can be depicted at a more regional scale. In this example the highest density of pockmarks coincides with the area of seafloor slumping suggesting a relationship between seafloor pockmark density and surface stability. What is the relationship between these seafloor expressions of fluid flow and the deeper section and what insights will their relationship provide with respect to hazard assessment and charge history? To address these questions requires the examination of additional surfaces in the seismic volume.
Fluid Flow Features in Glencoe and Bonaventure 3D Seismic Surveys
With extensive high quality 3D seismic datasets imaging the seafloor down to well below the reservoir, fluid flow features can be observed and often linked between a number of subsurface horizons highlighting areas which have been a focus for several stages of fluid flow.
Pockmarks and Polygonal Faulting In Subsurface
Pockmarks or conical depressions are identified in the seismic from the seafloor down to and within the Triassic fluvio-deltaic sandstones of the Mungaroo Formation in both the Glencoe and Bonaventure 3D seismic surveys. The recognition of pockmarks on these surfaces could have considerable economic significance, as they could be important
complete set of morphometric parameters to accurately describe the detail associated with each of the surfaces. Object detection can be considered the result of first the detection and then classification of features. By applying queries using either single or multiple criteria to the database of morphometric parameters, features were quantified as objects or vectorised lineaments. The method applied here uses a recently developed analytical technique for surface analysis which addresses the fact that digital data is not a smooth continuous function. Unfortunately, most types of conventional mathematical analysis techniques which are commonly applied to digital surface analysis are not, strictly speaking, applicable in the digital world. Consequently, the application of conventional mathematics to digital surface analysis introduces both coherent noise and instability of results. For useable results these conventional methods applied to digital surfaces often require considerable surface pre-conditioning and parameterisation which often results in the loss of useable information and problems with the introduction of high frequency artefacts (Roberts, 2001; Wood, 1996). By implementing methods better suited for the analysis of non-continuous functions, the results become stable and without the introduction of high frequency artefacts. Moreover, by addressing these fundamental challenges associated with digital surface analysis means surface preconditioning or prior knowledge about the surface is not required such that the application of the technique can be fully automated (Dirstein et al., 2013). In the following section we document the application of this technique applied to the two-way-time surface of the seafloor from the Gorgon Gas Field to quantify seafloor pockmarks.
Key Results: Fluid Flow Features
Seafloor Pockmarks observed on the Gorgon 3D Seismic Survey
While pockmarks and slumps are observed on the seafloor of 3D seismic surveys associated with many fields located on the NWS, examples are presented from the Gorgon Gas Field located in the Exmouth Sub-Basin. Several attributes from the seafloor TWT reflector across the Gorgon 3D seismic survey (~1,000 km2) are shown in Figure 4. Each attribute has been displayed with a false colour palette and the TWT map has also been rendered. At the displayed map scale, apart from the large submarine canyons located on the shelf break (Fig. 4), many of the other features are less noticeable or lost in the gradational colour of the applied palette. For example, within an area marked by slumping (labeled “Zone of Slumping” in Fig. 4b), a large number of pockmarks are less noticeable. With the application of surface rendering and shading, the TWT map reveals many cone-shaped depressions or pockmarks within the slumping zone. The pockmarks on the seafloor are near the shelf break and are spatially associated with slides and slumps, a phenomenon similarly observed in many other hydrocarbon producing basins of the world (Hovland & Judd, 2007).
SEAFloor AND SubSurFAcE FluID Flow: ProSPEct AND GEoHAzArDS
8 West Australian Basins Symposium 2013 Perth, WA, 18–21 August 2013
Fig
ure
5.
a) P
ock
mar
k o
bje
cts
auto
mat
ical
ly i
den
tifi
ed a
nd
vec
tori
sed
(o
ran
ge)
fro
m t
he
seafl
oo
r su
rfac
e in
TW
T (s
ho
wn
as
gra
ysca
le)
usi
ng
su
rfac
e an
alys
is t
ech
niq
ue
dev
elo
ped
by
Geo
Pro
xim
a. b
) b
low
-up
of
area
sh
ow
n in
a.
smal
ler
area
in m
ore
det
ail.
c) p
ock
mar
k d
ensi
ty p
rob
abili
ty m
ap c
reat
ed f
rom
th
e p
ock
mar
k o
bje
cts.
TWT
(gre
ysca
le)
30 km
10 km
Gor
gon
3D
(199
2)
Blu
eBel
l 1
Chr
ysao
r 1
NG
3 N
G2
NG
4
NG
4 N
G6
CG
4 G
3 G
1
Poc
kmar
k D
ensi
ty P
roba
bilit
y
10 K
m
500m
Zoom
ed in
Vie
w
a b c Low
D
ensit
y/Pro
babil
ity
Hi
gh
J.K. DIrStEIN, J.V. HENGESH & A.J. StANlEy
Perth, WA, 18–21 August 2013 West Australian Basins Symposium 2013 9
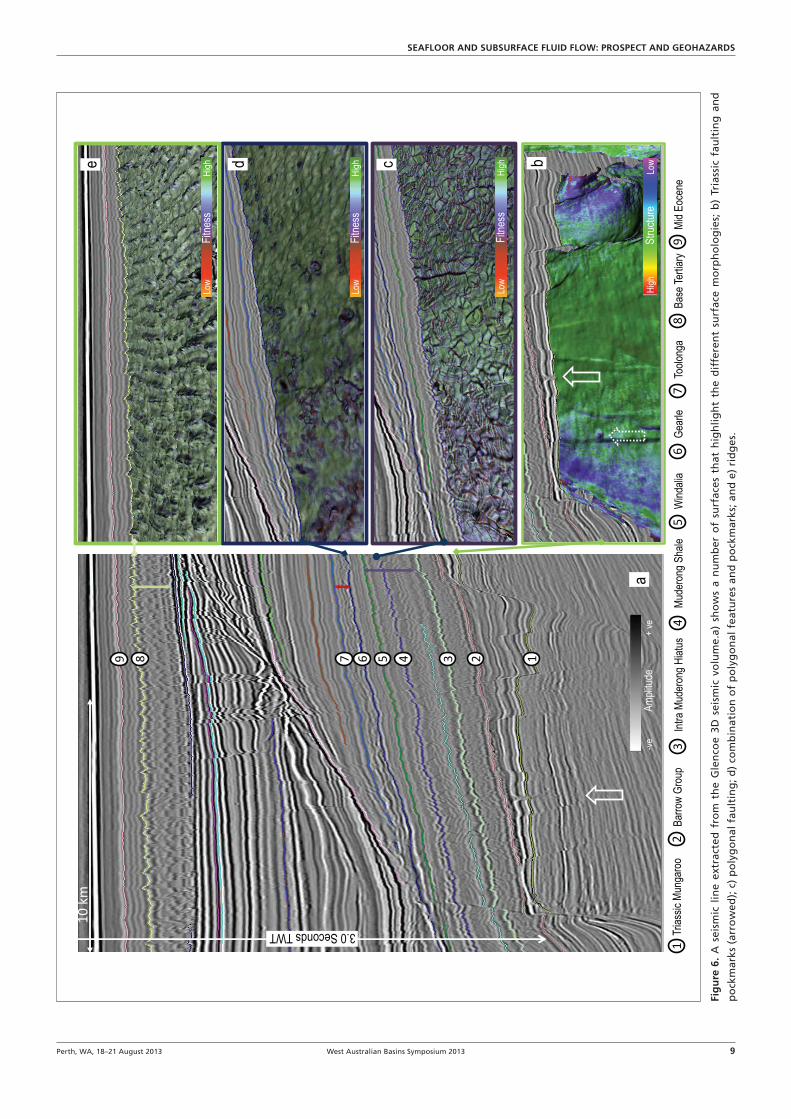
Fig
ure
6.
A s
eism
ic l
ine
extr
acte
d f
rom
th
e G
len
coe
3D s
eism
ic v
olu
me.
a) s
ho
ws
a n
um
ber
of
surf
aces
th
at h
igh
ligh
t th
e d
iffe
ren
t su
rfac
e m
orp
ho
log
ies;
b)
Tria
ssic
fau
ltin
g a
nd
po
ckm
arks
(ar
row
ed);
c)
po
lyg
on
al f
ault
ing
; d)
com
bin
atio
n o
f p
oly
go
nal
fea
ture
s an
d p
ock
mar
ks; a
nd
e)
rid
ges
.
6 a
b c d e
3.0 Seconds TWT
Low
Fitne
ss
Hi
gh
-ve
Ampli
tude
+
ve
10 k
m
1 2
Trias
sic M
unga
roo
Barro
w Gr
oup
3 Int
ra M
uder
ong H
iatus
4
Mude
rong
Sha
le
5 W
indali
a 6
Gear
le
1 2 3 4 5 6 8
7 To
olong
a
Low
Fitne
ss
Hi
gh
Low
Fitne
ss
Hi
gh
High
S
tructu
re
Low
8 Ba
se Te
rtiary
7
9 Mi
d Eoc
ene
9
SEAFloor AND SubSurFAcE FluID Flow: ProSPEct AND GEoHAzArDS

10 West Australian Basins Symposium 2013 Perth, WA, 18–21 August 2013
particularly in the south western portion of the Glencoe 3D survey (Figs 7a & b). Here, the areas of small polygonal features transition into areas dominated by larger polygonal structures, often linked, that have centrally located pockmarks. A detailed view of the seismic traces in the vicinity of one of the pockmarks, shows how both the amplitude and waveform change characterise the objects with respect to both surface and vertical variability (Fig. 7c). The conical band of distorted seismic extends above and below the surface and these changes in acoustic impedance are interpreted to be the result of fluids propagating though and above the surfaces.
Intrusive Sedimentary Features in the Subsurface
Both the Glencoe and Bonaventure 3D volumes contain examples where fluid flow has resulted in sedimentary intrusion which is also referred to as injection or extrusion. A concave circular depression observed in the Bonaventure 3D volume is located on the hanging-wall of a fault and broadens as it extends into the younger section (Figs 8a & 8b). However, in this case a dome-shaped feature of high-amplitude reflectivity forms a structurally closed anticlinal cap over and adjacent to the pockmark. This suggests intrusive bypass with sediment remobilisation (Cartwright et al., 2007). In this example the upward fluid flow composition is either different from other similar pockmarks at this stratigraphic level, and/or conditions at this location are more favourable for sediment accumulation and preservation. In the Glencoe 3D volume, a number of fluid flow sediment remobilisation features are observed (Fig. 8c). Vertically extensive conical depressions are observed within hanging-walls adjacent to a footwall that show a localised high amplitude event which is assumed to be associated with gas (white rectangle in Fig. 8c). Another interesting feature (indicated by the red arrow in Fig. 8c) is morphology similar to the “large-scale sand injectites” described as significant reservoirs in the North Sea (Huuse et al., 2007). These similarities include the discordant “wings” and “jack-up” of concordant surfaces within the feature (Fig. 8d). Huuse et al. (2007) document several North Sea examples of sandstone injectites that are associated with hydrocarbon charged reservoirs (e.g. Balder Field).
Discussion
The observational evidence from seismic surface attribute maps demonstrates that large areas of the Exmouth Plateau have been the focal point for upward fluid flow. However, their morphological signatures vary within and across different stratal packages. Examination of the details of these features may highlight those structures that have been most likely to have received charge during the migration of thermogenic fluids. The fluid escape features from this portion of the NWS have, over geological time, created a dynamic environment contributing to variability in sub-surface and
with respect to charge history, seal integrity, reservoir quality and re-mobilisation of coarse clastics (i.e. injectites).
The pockmarks observed at the Triassic−Jurassic stratal levels in the Glencoe 3D seismic survey (Figs 6a & b) appear as isolated, individual depressions or as linear or circular clusters. They often are located in the hanging-wall of faults and have vertical and horizontal expressions over hundreds of metres. While these pockmarks appear to occur at a lower density than those observed on the seafloor, the vertical resolution of the seismic decreases with depth and the smaller pockmarks observed on the seafloor may not be detectable at these deeper depths. Typically, pockmarks were characterised by a decrease in instantaneous amplitude (surface localised) and an anomalous seismic waveform (i.e. low fitness).
A number of automatically extracted populations of genetically similar waveforms (surfaces) are highlighted in Figure 6a. The deepest surface highlighted (green) is located near the Top of the Triassic Mungaroo Formation. Conical depressions or pockmarks appear to penetrate this surface extending hundreds of meters above and below this surface (Figs 6a & b). Often located in the hanging-wall of a normal fault, these features become narrower with depth appearing to extend down to the fault plane. Above the Near Top Mungaroo surface these features broaden until they terminate at the Top Barrow Group unconformity (Fig. 6a, red horizon). Above this unconformity polygonal faulting develops (zone highlighted with the vertical arrow (purple) in Fig. 6a over several hundred meters of predominately claystone section. Horizons contained in this unit are Top Windalia (green), Top Muderong (purple) and Intra Muderong Hiatus (IMH) (light green). The intensity of the polygonal faulting appears strongest at the Top Muderong horizon (Fig.6c).
Above the polygonal fracturing an interval (highlighted by a red vertical arrow Fig. 6a) contains claystones and marls with the upper horizon (blue) corresponding to the high resistivity log break (Top Toolonga) at Glencoe 1 (HESS Glencoe WCR, 2009). The surface at the lower boundary of this interval is shown in Figure 6a (dark blue horizon) and as a fitness attribute map in Figure 6d (Gearle). While Figure 6d provides some visual evidence of pockmarking, the detail of polygonal features and pockmarks associated with this surface are shown in Figure 7. The upper interval highlighted by the green vertical arrow (Figs 6a & e) highlights a zone which is deformed by slumping and mass movement, but still retains some internal reflector geometry. In other data sets this interval is characterised by Mass Transport Complexes (MTC) (e.g. the Willem 3D seismic survey, Hengesh et al, (2012)). Across the Glencoe 3D these ridges extend over more than 600 km2 (Fig. 6e) forming en-echelon curvilinear features that change in trend coincident with piercement points from deeper faulting.
Figure 7 reveals more detail about the basal portion of the calcareous, marly claystone interval between the Toolonga and Gearle surfaces (Figure 6d). The instantaneous amplitude displays from this surface exhibit a very high degree of heterogeneity in both frequency and shape of features,
J.K. DIrStEIN, J.V. HENGESH & A.J. StANlEy

Perth, WA, 18–21 August 2013 West Australian Basins Symposium 2013 11
Figure 7. The instantaneous amplitude (grayscale) of the seismic surface (Gearle Siltstone) from the Glencoe 3D seismic survey shown
in Figure 6d. a) and b) show the varibility and the extensive nature of these pockmarks; c) details of the seismic response across one
pockmark demonstrates the effect on the seismic waveform; d) polygonal convection cells formed as a result of heating a mixture of
silicon oil and aluminum oxide (image modified from Brown University website, 2013); e) The center of the convection cell shows fluid
discharge with downflow at the edges of the polygonal features.
b
a
~ 550 Sq. km N
c
d
-ve Amplitude + ve
10 km
Gearle
e
seafloor geomorphology, stratigraphy, diagenesis, charge and tectonics. There clearly is a complex interrelationship between these processes and the observational data which can be automatically extracted from the volumes presents new opportunities to refine and validate existing geomodels.
Hovland et al. (2010) noted that “the underground plumbing system has yet to be established” for pockmarks and seafloor fluid expulsion features, as early analysis of these features (King & Maclean, 1970) was limited, by the data, to small near seafloor datasets. With extensive 3D coverage the automated methodology presented demonstrates that these conical depressions in the seafloor can be efficiently
extracted from TWT surface attributes. Using the pockmark density probability maps created from multi-level queries to the morphometric database for the seafloor, a better understanding of the spatial distribution and perhaps volumes could be estimated.
While vertical fluid flow has a significant role in the formation, preservation and destruction of hydrocarbon accumulations, modelling the process is extremely complex requiring many simplifying assumptions with respect to variations in fluid density which in turn complicates estimations of velocities and directions of fluid movement. Moreover, phase transitions in the fluid rock system with
SEAFloor AND SubSurFAcE FluID Flow: ProSPEct AND GEoHAzArDS
12 West Australian Basins Symposium 2013 Perth, WA, 18–21 August 2013
sediments (Figs 7a, b & 8c). The types of features observed are conical depressions (Fig. 8c), mounding (Fig. 8a) and wing-like intrusions (Fig. 8c). To enable significant volumes of sediment remobilisation through upward fluid flow requires a source of mobile material (e.g. unconsolidated sand bodies), an overlying seal, regional overpressure and a triggering event (Huuse et al., 2007). These factors would also dictate the timing and duration of the fluid movement. Since the fluid flow is crossing bedding boundaries, the lateral permeability of the host material is implied to be, locally, relatively low compared to the sealing capacity of the sedimentary succession.
Throughout the claystone dominated section (IMH, Muderong Shale and Windalia Radiolarite) the polygonal faulting provides evidence of more laterally extensive fluid flow (Figs 6a & c). Whether the formation of these features occurred early during shallow dewatering (Gay et al., 2007) or as a result of over pressure driven fracturing (Cartwright, et al, 2007) or develop into polygonal fault networks primarily because of low coefficients of friction along fault planes responding to increasing overburden stress (Goulty, 2008), these fault systems are of interest for a number of reasons. They may exhibit higher pore pressures, can act, at times, as conduits for fluid flow and usually indicate a high quality seal as polygonal faulting usually occurs in low permeability sediments (Cartwright et al., 2007).
The fluid flow features that characterise the claystones and marls found in the Toolonga Calcilutite & Gearle Silstone interval are characterised by highly variable and, in places quite complex polygonal features (Figs 7a & b) without the faulting observed in the deeper section. The patterns are observed to affect both instantaneous and waveform attributes (Fig. 7c) and appears quite similar to self organising Rayleigh-Benard natural convection patterns developed when fluids are heated from below (Fig. 7d) (Brown University, 2013). The convection cells created by heating a pan containing a mixture of silicon oil and aluminium powder (Fig. 7d) shows a striking resemblance to features observed on the seismic surface (Fig. 7a & b). As the silicon oil at the base becomes much hotter than the surface, convection cells form which carry the hot fluids up from the deeper section to the cooler upper surface. When the hot fluid reaches the upper surface it cools and spreads outward descending along the edges of the cell (Fig. 7e). The high variability observed in the polygonal and pockmark features observed in the seismic amplitude and waveform would be in response to changing conditions affecting fluid flow. Using the patterns observed on the heated pan as a template, the seismic surface that shows the smaller polygons maybe near the “edge of the pan” where the temperature differential is not as large. Alternatively, the effectiveness of vertical fluid could also impact upon the patterns observed on the seismic data. Regardless of the source of these hydrothermal fluids, they are known to contribute to authigenic diagenesis (Hovland & Judd, 2007), sediment mobilisation (Hengesh et al., 2012; Huuse et al., 2007), hydro-fracturing (Chi et al., 2011) and the migration of hydrocarbons. Given the Glencoe 1 well
respect to temperature and pressure can dramatically impact upon the properties of the rock and the behaviour of the fluids within them. Consequently, without detailed consideration and integration of the history of geological development, geodynamics, geochemistry, mineralogy, lithology, thermodynamics, etc., a meaningful solution is practically impossible (Djunin & Korzun, 2010). Many of the questions that need to be addressed include understanding the driving mechanisms for the migration of deep fluids, the spatial positioning of areas of discharge, recharge and migration pathways, the role of host rocks in fluid formation, the interaction between the geological sequence and undoubtedly more. Therefore, any insights obtained directly from the seismic data, if only about the discharge areas, would go a long way towards building a better model of fluid flow. From the examples presented, seafloor pockmarks represent only part of what appears to be a multi-phased and dynamic history of fluid flow that is providing charge at some stages, dewatering and remobilisation of unconsolidated material, and hydraulic fracturing of more rigid formations. Within the hydrodynamic system, the equalisation of pressure, temperature, and PH/EH gradients results in the circulation of fluids at both large and small scales and highlights that many features on the Northern Carnarvon Basin have had a long history of charge and venting.
Seafloor Pockmarks across the Gorgon field
After creating a complete set of morphometric parameters describing the TWT surface of the seafloor, a multi-level query to the database revealed objects which all had a particular set of features. The results quickly and quantitatively identified the pockmarks associated with the area of seafloor slumping, as well as those located on canyon, ridges and elsewhere on the surface. Many of the pockmark features appear asymmetric, clustered along lineaments. Future slumping at the seafloor would likely exploit these lineaments (Fig. 5b). Since the technique applied has been developed to deal specifically with the non-continuous (digital) data, the approach is well suited for automation and the application to large and multiple datasets. Maps created over large areas of the seafloor using the approach demonstrated develops a more regional perspective about seafloor fluid flow. Extending the analysis to include additional surfaces from deeper in the section provides a three dimensional understanding of the extent and the changing morphology of the objects, timing and distribution of fluid flow events.
Fluid flow features from the Glencoe and Bonaventure 3Ds
The fluid flow features observed across the Glencoe 3D show different morphologies. The Jurassic and Triassic reservoir section both show features that have hundreds of metres of vertical extent, are located near fault planes and demonstrate a relatively focused remobilisation of fluids and
J.K. DIrStEIN, J.V. HENGESH & A.J. StANlEy

Perth, WA, 18–21 August 2013 West Australian Basins Symposium 2013 13
A B
C
D
Low
Fitne
ss
Hi
gh
-ve
Ampli
tude
+
ve
2 km
4
km
prod
uctio
n
Fig
ure
8.
a) s
eism
ic l
ine
thro
ug
h a
po
ckm
ark
ob
serv
ed i
n a
Tri
assi
c fa
ult
blo
ck f
rom
th
e B
on
aven
ture
3D
su
rvey
. Th
is p
ock
mar
k ex
hib
its
char
acte
rist
ics
asso
ciat
ed w
ith
sed
imen
t
rem
ob
ilisa
tio
n. b
) th
e Tr
iass
ic s
urf
ace
fitn
ess
attr
ibu
te d
rap
ed o
nto
th
e TW
T su
rfac
e sh
ow
s w
hat
is in
terp
rete
d a
s m
ou
nd
ed r
emo
bili
sed
sed
imen
ts.
c) s
eism
ic p
anel
fro
m G
len
coe
3D
surv
ey s
ho
ws
an in
ject
ite
(red
arr
ow
) th
at h
as m
any
of
the
char
acte
rist
ics
(e.g
. dis
cord
ant
win
gs
and
inte
rnal
jack
up
) o
ver
the
Bal
der
Fie
ld (
Hu
use
et
al.,
2007
)). W
hit
e re
ctan
gle
sh
ow
s
that
evi
den
ce o
f fl
uid
flo
w e
xten
ds
thro
ug
ho
ut
mu
ch o
f th
e Tr
iass
ic s
ecti
on
an
d a
ll o
f th
e Ju
rass
ic s
ecti
on
. N
ote
th
e ad
jace
nt
amp
litu
de
ano
mal
y (w
hit
e ar
row
), w
hic
h m
ay i
nd
icat
e
gas
in t
he
Jura
ssic
res
ervo
ir; d
) cl
ose
-up
of
dis
cord
ant
win
gs
and
jack
-up
str
uct
ure
s ac
ross
Bal
der
Fie
ld (
mo
difi
ed f
rom
Hu
use
et
al.,
2007
).
SEAFloor AND SubSurFAcE FluID Flow: ProSPEct AND GEoHAzArDS
14 West Australian Basins Symposium 2013 Perth, WA, 18–21 August 2013
A B
C
D
10 k
m
Z Z'
Z Z'
Z
Z'
Z Z'
Low
Fitne
ss
Hi
gh
High
S
tructu
re
Low
Near
Top B
rigad
ier
Near
Top G
earle
Near
Top C
retac
eous
S
ea F
loor
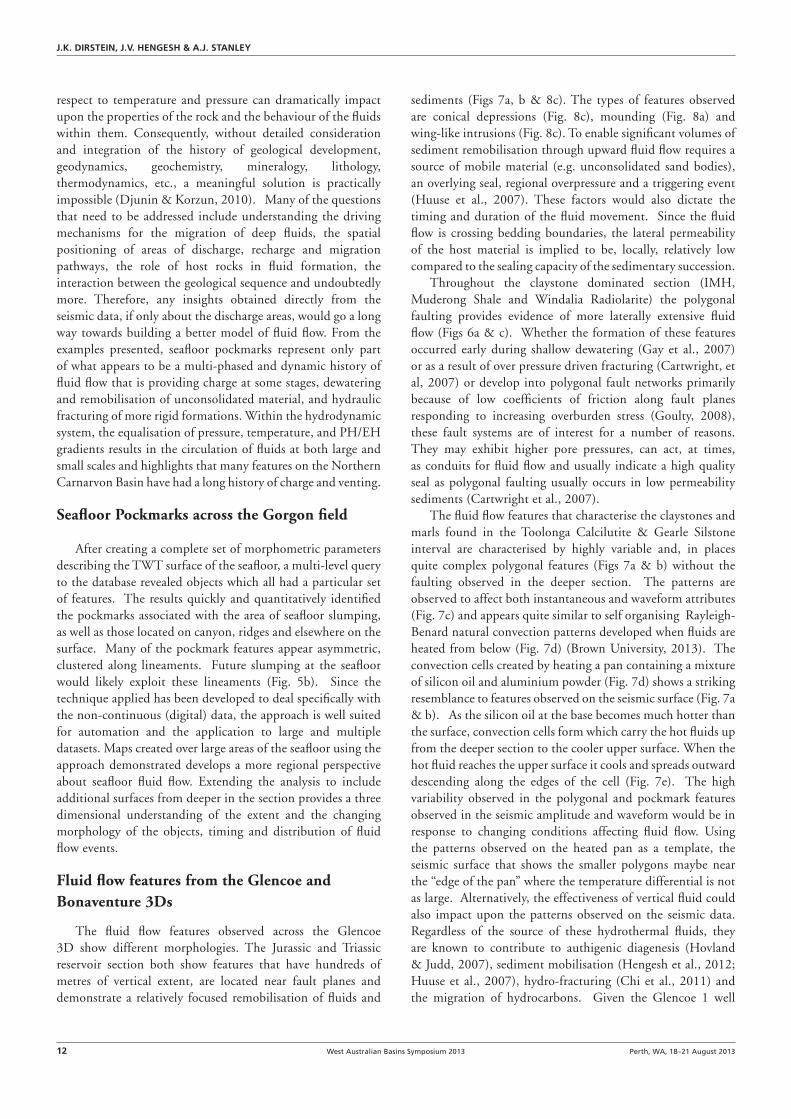
Fig
ure
9.
Seve
ral
surf
aces
fro
m t
he
Bo
nav
entu
re 3
D s
eism
ic s
urv
ey.
a) a
uto
mat
ical
ly e
xtra
cted
nea
r-To
p B
rig
adie
r TW
T su
rfac
e sh
ow
sstr
uct
ura
l fa
ult
blo
cks
and
th
e p
rese
nce
of
circ
ula
r d
epre
ssio
ns
(wh
ite
circ
les)
of
vari
ou
s si
zes
(i.e
. 10
0s t
o o
ver
a 1,
000
met
ers
in d
iam
eter
).
Fitn
ess
map
s o
f th
ree
pro
gre
ssiv
ely
you
ng
er s
urf
aces
, b
) n
ear
top
Gea
rle,
c)
nea
r
top
Cre
tace
ou
s an
d d
) h
igh
ligh
t th
e w
avef
orm
var
iab
ility
up
to
th
e se
aflo
or.
N
ote
th
e co
inci
den
ce o
f th
e ar
eas
of
Tria
ssic
str
uct
ure
(a)
, lo
w fi
tnes
s ci
rcu
lar
feat
ure
s (b
an
d c
), a
nd
circ
ula
r se
aflo
or
colla
pse
fea
ture
(d
). T
he
thre
e fi
tnes
s m
aps
pro
vid
e an
ind
icat
ion
of
gen
etic
like
nes
s b
etw
een
eac
h in
div
idu
al in
th
e p
op
ula
tio
n (
surf
ace)
as
it r
elat
es t
o t
he
com
mo
n
wav
efo
rm (
gen
oty
pe)
. As
the
fitn
ess
vari
es a
cro
ss t
he
map
are
a, t
he
asso
ciat
ed w
avef
orm
ch
ang
es w
ill b
e in
res
po
nse
to
ch
ang
es in
ro
ck p
rop
erti
es a
nd
/or
laye
r g
eom
etri
es.
J.K. DIrStEIN, J.V. HENGESH & A.J. StANlEy

Perth, WA, 18–21 August 2013 West Australian Basins Symposium 2013 15
Four simple diagrams in Figure 11 indicate ways upward fluid flow may impact upon different units as it progresses from higher pressures to the surface. The focused point source of fluid flow propagating through lower units (Fig. 11a), could just as easily be a fault plane or a surface beneath a sealing unit. If the units are sufficiently competent layers, sills may form that exploit the existing bedding planes or fractures. As the fluids continue upward, some units may develop hydro fractures or vent if the resistance to lateral movement is greater (e.g. low permeability authigenic sediments) compared to over lying material (Fig. 11b). In highly permeable layers or fault blocks, pressure may build up under a regional unit that may flow or fracture depending on rock properties and pressures (Figs 11c & d). Examination of all surfaces associated with the larger surfaces of genetically similar waveforms (without the seismic) draws attention to anomalous geometry changes and zones of low or complex reflectivity (Fig. 11e). Moreover, the fitness associated with all of these larger surfaces (Fig. 11f ) shows areas where lower genetic likeness highlights local changes in waveform and reveals vertical connectivity of changing stratigraphy, fluid flow, structure and pore fluid features throughout the section.
Polygonal patterns are observed as a morphometric feature in many different materials and environments. While many are examples of convective forces, the scale and magnitude of the driving process can range from molecular to stellar (Folk, 1976). The polygonal features observed in the Exmouth Plateau are also associated with convective processes. The role and net effect of the fluid flow along its path depends upon the media through which it propagates. For example, some polygonal patterns are vertically quite localised and fit into the concept of shallow burial dewatering of sediments with relatively low lateral permeability (Gay & Berndt, 2007). However, in some cases, the forces required to provide high density fracturing over large areas of competent section, several hundreds of metres thick, are occurring at very different scales. Irrespective of the detail regarding their formation, polygonal faults can act as fluid conduits providing laterally extensive or in particular cases, a focused pathway for the migration of fluids (Gay & Berndt, 2007). Focused fluid flow is a much more efficient process for fluid migration than diffusive flux (Abrams, 1992; Brown, 2000) with many of the large areas of polygonal faulting acting as a “heat sink” for convective processes. Current and paleo-stress regimes and periodic fault reactivation would also play a role as to whether these faults behave as conduits or seals.
Geohazards: Knowing hazards and reducing risk
Traditional and deepwater hydrocarbon developments face a range of geological hazards that can affect the pressure integrity of the system, vulnerability of structures, and safety of operators and other personnel associated with a project.
reported loss of circulation in this section (Hess, 2009), the density and variability of the features in this interval is of interest with respect to drilling plans.
At the base tertiary level long curvilinear ridges are observed of a large portion of the Glencoe 3D survey (Figs 6a & e). Below this surface, the reflectors are distorted and broken up but still retain some internal seismic character. The fitness volume created from the large surfaces shows seismic waveform changes along the ridge crestal axes (Fig.11f ) for a number of adjacent surfaces. The observation of these subtle waveform changes on multiple surfaces has been interpreted as fluid flow features.
A Geological/Fluid Flow Model in Bonaventure 3D Seismic Survey
Fluid flow features are observed at the Triassic stratal level, various stratal levels through the Tertiary, and younger sections that extend up to the seafloor in the Bonaventure 3D.
The near top Brigadier TWT surface (rendered) (Fig. 9a) reveals the structure and faults automatically identified during the segmentation process as well as numerous circular collapse features with diameters measuring several hundred meters to more than one thousand meters (white circles in Fig. 9a). Generally, these features are located in the hanging-walls of the rift-related normal faults. The fitness map shown (Fig. 9b) shows a large circular area of low fitness (along Z-Z’) in a younger surface (Gearle Siltstone) that indicates a significant variability compared to the common waveform associated with this surface. Polygonal faulting dominates a progressively younger surface with sets of interconnecting horsts and grabens (Fig. 9c). However, within areas of low fitness (red in Fig. 9c), the polygonal fault patterns are absent. It is speculated that fluid flow has played a significant role in the alteration of this interval’s properties.
Lastly, the fitness map of the seafloor TWT surface (Fig. 9d) shows a number of collapse scarps. The southern circular collapse feature is a submarine landslide with a diameter of approximately eleven kilometres. Here, the landslide is clearly associated with a zone of expulsion, fluid venting and discharge flowing onto the seafloor and off towards the northwest. Numerous small pockmarks are present along the edges of the flow path and near other submarine slope failures. Figure 10 presents 3D perspective of one of the maps of the Figure 9 surfaces showing the location of seismic line (Z to Z’) that highlights the seismic response across these features. While the TWT geomorphology and structure at the seafloor and Brigadier Formation levels are prominent, by comparison, the seismic TWT variability along the other two surfaces is much more subtle; highlighting the benefit, in this case, of using the waveform variability to identify anomalous features. The coincidence of the Triassic structure, along with the overlying circular features and the seafloor circular slumping suggests that the fluid flow pathways have been active through these strata.
SEAFloor AND SubSurFAcE FluID Flow: ProSPEct AND GEoHAzArDS

16 West Australian Basins Symposium 2013 Perth, WA, 18–21 August 2013
A
~45k
m
B
N
1.3 S
ec
3.0 S
ec
1 km
Low
Fitne
ss
Hi
gh
-ve
Ampli
tude
+
ve
3D P
ersp
ectiv
e Vi
ew
1 2
Near
Top B
rigad
ier
Near
Top G
earle
3
Near
Top C
retac
eous
4
Sea F
loor
1
2
3
4 Z
Z’
Fig
ure
10.
A p
ersp
ecti
ve v
iew
sh
ow
ing
th
e N
ear
Top
Cre
tace
ou
s (a
) al
on
g w
ith
a d
isp
lay
of
seis
mic
(b
) (l
oca
tio
n s
ho
wn
on
pre
vio
us
fig
ure
as
Z–Z’
).
The
seis
mic
lin
e w
ith
th
e su
rfac
es
hig
hlig
hts
th
e su
btl
e as
pec
t o
f th
e se
ism
ic c
har
acte
r as
soci
ated
wit
h t
hes
e fe
atu
res
and
th
e u
nd
erly
ing
fau
lt w
hic
h is
ap
par
entl
y ac
tin
g a
s a
flu
id c
on
du
it.
J.K. DIrStEIN, J.V. HENGESH & A.J. StANlEy

Perth, WA, 18–21 August 2013 West Australian Basins Symposium 2013 17
11
e f Lo
w
Fit
ness
High
4 km
a b
c d
Fig
ure
11.
Th
e sc
hem
atic
flu
id fl
ow
dia
gra
ms
(a t
o d
) th
at s
ho
w a
mo
del
wh
ich
su
gg
ests
a n
um
ber
of
flu
id fl
ow
sce
nar
ios.
B
y h
igh
ligh
tin
g a
sel
ecti
on
of
som
e o
f th
e la
rger
auto
mat
ical
ly e
xtra
cted
su
rfac
es f
rom
th
e B
on
aven
ture
3D
sei
smic
su
rvey
det
ail
abo
ut
chan
gin
g s
trat
al g
eom
etri
es (
e) i
s re
veal
ed.
The
fitn
ess
for
the
sam
e su
rfac
es (
f) s
ho
ws
zon
es
of
hig
h w
avef
orm
var
iab
ility
nea
r st
rati
gra
ph
ic a
no
mal
ies
(wh
ite
circ
les)
. N
ote
th
at t
hes
e d
iag
ram
s o
nly
co
nsi
der
dis
char
ge
and
no
t th
e im
po
rtan
t as
pec
t o
f re
char
ge.
SEAFloor AND SubSurFAcE FluID Flow: ProSPEct AND GEoHAzArDS
18 West Australian Basins Symposium 2013 Perth, WA, 18–21 August 2013
data to highlight areas demonstrating multiple stages of upward fluid flow from beneath, within and well above the reservoir helps validate regional models by establishing the presence and more detail about a local migration pathway.
Conclusions
The seafloor fluid expulsion features observed in openfile 3D seismic data from the Northern Carnarvon Basin are present as single pockmarks or as clusters. High densities of pockmarks in the Gorgon 3D seismic survey are associated with large-scale slump features. Pockmarks, polygonal faulting, and other features observed at the seafloor and in the subsurface are evidence of the dynamic processes of fluid flow that creates “the underground plumbing system” (Hovland et al., 2007) linking deep sourced fluids to the surface. Moreover, focused upward fluid flow is likely to have played an important role in the formation of shelf margins, sediment remobilisation (e.g. mass transport complexes and injectites), hydro-fracturing and migration of hydrocarbons. These observational data provides insights and or validation of interpreted migration pathways, charge history and prospect ranking.
Since there is such a paucity of the data necessary to develop models of the complex problem of fluid flow, the simplifying assumptions applied to modelling can potentially trivialise the solution. Consequently, there is a need to extract as much observation data from the large amounts of high quality 3D seismic data found across the Exmouth Plateau and use this information as a framework for model refinement and validation. Unfortunately, for all this information to become part of the cognitive experience features and objects need to be identified. One way to locate all the observation evidence for upward fluid flow requires a review of many surfaces within the 3D seismic volume by visual or data mining processes. Ten years ago, a task such as this was virtually impossible given the interpretation tools available. Fortunately, with the recent development and implementation of automated 3D segmentation technology, even the very large 3D seismic volumes can be processed to extract virtually all surfaces. Moreover, review and examination of large numbers of pre-interpretation surfaces can also be automated by searching for objects of interest based on mining morphometric features for quantifiable objects. From the resulting seismic-based model, a better understanding of the seafloor, drilling path, target and exploration fairway can be developed.
Acknowledgements
The authors wish to thank Nabil Tnacheri (Seisnetics inventor and patent holder) and the Seisnetics team for processing the openfile volumes for all trough and peak surfaces. Ruiping Li for her assistance with review and image preparation. The authors would also like to thank Paul Ihring
Geohazards on the seafloor and in the subsurface can include submarine landsliding, shallow gas and excess pore pressure (Vanneste, et al., 2012). On the North West Shelf, the unusual geotechnical characteristics of the shallow sediments are in their own right a hazard due to their exceedingly low strength (Von Rad & Haq, 1992). The presence of shallow gas, gas conduits and vents, excess pore pressures, and pockets of trapped gas can substantially increase these hazards particularly with the weak soils.
The scale of the potential geohazard features identified in the 3D seismic survey varies from small (metres) to very large (10s of km). Pockmarks range from 10s to 1,000s of metres across at the seafloor and can be associated with conduits and trapped gas at depth. The vertical fluid flow features observed through the Bonaventure 3D seismic survey illustrates how conduits at depth may be up to 1 km across while forming surface expressions of many kilometres across. The Bonaventure 3D seismic survey features also illustrates the direct relationship between fluid expulsion features at depth and seafloor instability and landsliding. These seafloor landslides are just over 10 km across with runouts of many 10s of kilometres. One of the major considerations in assessing the hazard of submarine landslides is in determining the triggering mechanism. Landslides are often attributed to seismic events, however, the clear associations seen between the seafloor fluid expulsion features, slumps/landslides in the Gorgon, Glencoe (Hengesh et al., 2012) and Bonaventure 3D seismic surveys demonstrates that fluid expulsion on its own may be a triggering factor.
The Glencoe 1 WCR (Hess, 2009)) documents loss of returns in the interval characterised by the highly variable pockmarks and polygonal features (Figs 6 & 7). While the problem was remedied by reducing the mud weight, how pervasive or significant might this be at other locations? Identification of these fluid flow features is important because their presence is not accounted for in conventional stratigraphic models. Consequently, their detection, frequency of occurrence and distribution needs to be derived from observational based data from the seismic data.
The automated pre-interpretation techniques demonstrated show the value of reviewing more of the 3D data volumes. This approach allows for a far more complete assessment of features which need to be incorporated into the geological model along with processes that affect the area and lead to a better perception of risk and exploration potential.
Prospectivity
One of the aspects of prospect ranking is the assessment of risk associated with charge and location on a favourable migration pathway. Modelling thermogenic maturation history and fluid flow in the subsurface requires a great many assumptions from sparse amounts of data (Djunin & Korzun, 2005) resulting in models that have high uncertainty and low resolution. Using observational based data from the seismic
J.K. DIrStEIN, J.V. HENGESH & A.J. StANlEy

SEAFloor AND SubSurFAcE FluID Flow: ProSPEct AND GEoHAzArDS
Perth, WA, 18–21 August 2013 West Australian Basins Symposium 2013 19
CHI, G., XUE, C., QING, H., XUE W., ZHENG, J. & SUN, Y., 2011, Hydrodynamic analysis of clastic injection and hydraulic fracturing structures in the Jinding Zn-PB deposit, Yunnan, China, Geoscience Frontiers, 3, 73−84.
DIRSTEIN, J.K. & FALLON. G.N., 2011, Automated Interpretation of 3D Seismic Data Using Genetic Algorithms, ASEG Preview, 201, 30–37.
DIRSTEIN J.K, IHRING, P. & HRONCEK, S., 2013, Digital surface analysis: A new approach using differential geometry, ASEG 23rd International Geophysical Conference and Exhibition, Melbourne Australia. Extended Abstract.
DJUNIN, V. I. & KORZUN, A. V., 2010, Hydrogeodynamics of Oil and Gas Basins, Translated by Ivan Basov, First published in 2005 in Russian.DOI 10.1007/978–90–481–2847–1.
DEPARTMENT OF RESOURCES, ENERGY AN TOURISM (DRET), 2013, Regional Geology of the Northern Carnarvon Basin Australia 2013 Offshore Petroleum Exploration Acreage Release, http://www.petroleum-acreage.gov.au/documents/regional-geology/Regional_Geology-Northern_Carnarvon.pdf
EXON, N.F. & BUFFLER, R.T., 1992, Mesozoic Seismic Stratigraphy and Tectonic Evolution of the Western Exmouth Plateau, in VON RAD, U., HAQ, B. U., et al. (Eds), Proceedings of the Ocean Drilling Program: Scientific Results, Vol. 122.
EXON, N. F., HAQ, B.U. & VON RAD, U., 1992, Exmouth Plateau Revisited: Scientific Drilling and Geological Framework, in, VON RAD, U., HAQ, B.U. et al., (Eds), Proceedings of the Ocean Drilling Program, Scientific Results, Vol. 122.
FOLK, R.L, 1976, Rollers and ripples in sand, streams and sky: rhythmic alteration of transverse and longitudinal vortices in three orders, Sedimentology, 23, 649−668.
GAY, A. & BERNDT, C., 2007, Cessation/reactivation of polygonal faulting and effects on fluid flow in the Vøring Basin, Norwegian Margin, Journal of the Geological Society, London, 164, 129–141.
GAY, A., LOPEZ, M., BERNDT, C., Séranne, M., 2007, Geological controls on focused fluid flow associated with seafloor seeps in the Lower Congo Basin, Marine Geology, 244, 68−92.
GOULTY, N.R., 2008, Geomechanics of polygonal fault systems: a review, Petroleum Geoscience, 14, 389–397.
HENGESH, J., DIRSTEIN,J.K. & STANLEY,A.J., 2012, Seafloor geomorphology and submarine landslide hazards along the continental slope in the Carnarvon Basin, Exmouth Plateau, North West Shelf, Australia, The APPEA Journal, 52, 493–512.
HESS Exploration Australia Pty Limited, 2009, Glencoe 1 and Glencoe 1 CH1 Well Completion Report (Basic Data), WA-390-P, Northern Carnarvon Basin.
HOCKING, R.M., 1990, Field Guide for the Carnavon Basin, Geological Survey of Western Australia Record, 1990/11.
HOVLAND, M. GARDNER, J.V. & JUDD, A.G, 2002,
and Stano Hroncek for their efforts in the development and application of GeoProxima’s surface analysis technology. We would also like to thank Diane Jorgensen and an anonymous reviewer for their constructive comments and patience. Finally, we would like to acknowledge the value of the “open-file” policy for petroleum data in Australia.
References
ABRAMS, M.A. 1992, Geophysical and geochemical evidence for subsurface hydrocarbon leakage in the Bering Sea, Alaska, Marine and Petroleum Geology, 9, 208–221.
AGSO NORTH WEST SHELF STUDY GROUP, 1994, Deep reflections on the North West Shelf:changing perspectives of basin formation, in PURCELL, P.G. & PURCELL, R.R. (Eds), The Sedimentary Basins of Western Australia: Proceedings of the Petroleum Exploration Society of Australia Symposium, Perth, WA, 1994, 63−74.
BAILLIE, P.W, POWELL, C. McA., LI, Z.X. & RYAN, A.M, 1994, The tectonic framework of Western Australia’s Neoproterozoic to Recent sedimentary basins, in PURCELL, P. G. & PURCELL, R.R. (Eds), The Sedimentary Basins of Western Australia, Proceedings of the Petroleum Exploration Society of Australia Symposium, Perth, WA, 1994, 45−62.
BOYD, R. WILLIAMSON, P. & HAQ, B.U., 1992, Seismic stratigraphy and passive margin evolution of the southern Exmouth plateau, in VON RAD, U., HAQ, B.U. et al. (Eds), Proceedings of the Ocean Drilling Program: Scientific Results, 122.
BROWN, A., 2000, Evaluation of possible gas microseepage mechanisms, AAPG Bulletin, 84, 1775–1789.
BROWN UNIVERSITY, 2013, 8A10.70 Solar surface convection, Lecture demonstrations, Department of Physics, https://wiki.brown.edu/confluence/display/physlecdemo/8A10.70+Solar+Surface+Convection.
CARTWRIGHT, J.A. & LONERGAN, L., 1996, Volumetric contraction during the compaction of mudrocks: a mechanism for the development of regional-scale polygonal fault systems, Basin Research, 8, 183–193.
CARTWRIGHT J.A, JAMES D. & BOLTON A., 2003, The Genesis of Polygonal Faults: A Review, in VAN RENSERBERGEN, P., HILLIS, R. R., MALTMAN, A.J & MORLEY, C.K. (Eds.) Subsurface Mobilization: Geological Society, London, Special Publications, 216, 223–243.
CARTWRIGHT, J., HUUSE, M. & APLIN, A., 2007, Seal bypass systems, AAPG Bulletin, 91, 1141–1166.
CATHRO, D.L. & KARNER, G.D., 2006, Cretaceous-Tertiary inversion history of the Dampier sub-basin, northwest Australia: Insights from quantitative basin modelling, Marine and Petroleum Geology, 23, 503−526.
CHEVRON AUSTRALIA PTY. LTD., 2009, Guardian 1 Well Completion Report–Basic Data; Exmouth Plateau: WA-365-P

20 West Australian Basins Symposium 2013 Perth, WA, 18–21 August 2013
KING, L.H. & MACLEAN,B., 1970, Pockmarks on the Scotian Shelf, Geological Society of America Bulletin,, 81, 3141–3148.
ROBERTS, A., 2001, Curvature attributes and their application to 3D interpreted horizons. First Break, 19(2) p. 85–100.
VANNESTE, M., L’HEUREAUX J., BAETEN N., BRENDRYEN J., VARDY, M.E., STEINER, A., FORSBERG, C.F., KVALSTAD T.J., LABERG J. S., CHAND S., LONGVA O., RISE, L., HAFLIDASON, H., HJELSTUN, B.O., FORWICK, M., MORGAN E., LECONNTE, I., KOPF, A., VORREN, T.O. & REICHEL, T., 2012, Shallow Landslides and their Dynamics In Coastal and Deepwater Environments Norway in YAMADA, Y., KAWAMURA, K., IKEHARA, K., OGAWA, Y., URGELES, R., MOSHER, D., CHAYTOR, J. & STRASSER, M. (Eds), Submarine mass movements and their consequences: Advances in Natural and Technological Hazards Research, 31, 29−41.
VON RAD, U. & HAQ, B.U., 1992, Proceedings of the Ocean Program, Scientific Results, Leg 122, College Station, Texas, USA, Ocean Drilling Program, doi:10.2973/odp.proc.sr.122.
WOOD, J.D, 1996, The geomorphological characterisation of digital elevations models, PhD Thesis, University of Leicester, UK, 185 pp.
YEATES, A.N., BRADSHAW, M.T., DICKINS, J.M., BRAKEL, A.T., EXON, N.F., LANFORD, R.P., MULHOLLAND, S.M., TOTTERDELL, J.M., & YEUNG, M., 1987, The Westralian Super basin, an Australian link with Tethys, in MCKENZIE, K. G., (Ed.), Shallow Tethys 2: 2nd International Symposium on Shallow Tethys, Wagga Wagga, 1987,199–213.
The significance of pockmarks to understanding fluid flow processes and geohazards, Geofluids, 2,127–136.
HOVLAND, M. & JUDD, A, 2007, Seabed fluid flow, the impact on geology, biology and the marine environment, First Published in 1988. Cambridge University Press, 475 pp.
HOVLAND, M., HEGGLAND R., DE.VRIES M. H. & TJELTA T.O., 2010, Unit-pockmarks and their potential significance for predicting fluid flow, Marine and Petroleum Geology, 27, 6, 1190–1199.
HUUSE, M.CARTWRIGHT, J., HURST. A. &, STEINSLAND, N.,2007, Seismic characterization of large-scale sandstone intrusions, in A. HURST & CARTWRIGHT, J. (Eds), Sand injectites: implications for hydrocarbon exploration and production, AAPG Memoir, 87, 21–35.
HUUSE, M., JACKSON, C., RENSBERGEN, P.V., DAVIES, R.J., FLEMINGS, P.B. & DIXON, R.J., 2010, Subsurface sediment remobilisation and fluid flow in sedimentary basins: an overview, Basin Research, 22, 342–360.
KAIKO, A.R. & TAIT, A.M., 2001, Post-rift tectonic subsidence and palaeo-water depths in the northern Carnarvon Basin, Western Australia, The APPEA Journal, 41, 368–379.
KEEP, M. & MOSS, S.J.,2000, Basement reactivation and control of Neogene structures in the Outer Browse Basin, Northwest Shelf, Exploration Geophysics, 31, 424–432.
KEEP, M., HARROWFIELD, M. & CROWE, W., 2007, The Neogene tectonic history of the North West Shelf, Australia, Exploration Geophysics, 38, 151–174.
J.K. DIrStEIN, J.V. HENGESH & A.J. StANlEy
SEAFloor AND SubSurFAcE FluID Flow: ProSPEct AND GEoHAzArDS
Jim Dirstein studied Geology and Geophysics at the University of Toronto graduating in 1980. With more than thirty years of international experience in the oil industry including the last twenty years as the founder/director of Total Depth Pty Ltd, Jim has developed a diverse set of skills working in a wide range of geological and corporate settings. He has a proven track record with both small and large companies identifying, and applying, new and existing technology to improve corporate exploration/exploitation work flows. He is currently involved in conventional petroleum exploration, Coal Seam Methane, Coal mining and airborne exploration projects which include aspects of prospect generation/appraisal/development, training, research and business development.
Aside from his activities with Total Depth Jim has helped with the commercialization and application of many new technologies. Recently, this has included the refinement of a patent of a new airborne geophysical technique; Seisnetics patented processing algorithm and establishing Geoproxima Pty Ltd. Jim is a member and past WA branch president of ASEG and has current memberships with SEG, PESA, AAPG, SEPM and EAGE.
Biographies
James V. Hengesh received his B.Sc. from Humboldt State University and M.Sc. from Idaho State University in the United States. He currently is completing his Ph.D. in marine geohazards at The University of Western Australia (UWA). He is an Assistant Professor in the Centre for Offshore Foundation Systems at the UWA and is owner of Interface Geohazard Consulting. He is a licensed Professional Geologist with over 25 years experience conducting geological hazard investigations for critical facilities worldwide and has worked on the ground in 30 countries. He is a member of the Geological Society of America, Seismological Society of America, Petroleum Exploration Society of Australia and is on the Executive Committee of the Australian Earthquake Engineering Society.
Alistair J. Stanley received his B.Sc. from Durham University in 2009, studying Natural Sciences where he majored in geology. Alistair is experienced in the oil industry having worked with both Pinemont Technologies on airborne exploration projects and Total Depth Pty Ltd. His work with Total Depth Pty Ltd has included the processing and interpretation of seismic data from a variety of sedimentary basins throughout Australia for both petroleum and coal exploration projects. He spends most of his time developing the pre-interpretation processing technology Seisnetics™ and has actively contributed to its application in both academic research projects and corporate workflows.
Perth, WA, 18–21 August 2013 West Australian Basins Symposium 2013 21