Embed Size (px)
Citation preview

Identification of Distinct Usage Patterns and Prediction
of Customer Behavior
Sharam Dadashnia, Joerg Evermann, Peter Fettke, Philip Hake, Nijat Mehdiyev,
Tim Niesen
Institute for Information Systems (IWi) at the German Research Center
for Artificial Intelligence (DFK), Saarbrücken, Germany
{sharam.dadashnia, philip.hake, nijat.mehdiyev, tim.niesen, peter.fettke}@dfki.de
Memorial University of Newfoundland, St. John's, NL, Canada [email protected]
Abstract. The given BPI Challenge 2016 provides a case study based on a real-
life event log. In this report, we analyze usage data from IT systems of the Dutch
employee insurance agency (UWV). The data comprises information about
customer demographics, click data describing their behavior when using the
agency’s website, and data from customer service systems. We identify distinct
usage patterns, report on the change of those patterns over time as well as on
cause-effect analyses explaining when customers deviate from standard
procedures. Moreover, we present a prediction approach based on deep learning
algorithms that helps to determine future events for running customer sessions.
As a result, some recommendations for the UWV are derived in order to increase
the user experience and decrease expensive communication-channel transitions.
Keywords: process mining, process analysis, usage pattern identification,
process prediction, deep learning
1 Introduction
The analysis of how customers use the systems and services provided by an
organization – often called customer journey analysis in marketing – is an important
activity to gather insights into the specific requirements and preferences that drive
different customer groups. It can help to segment the customer basis according to
various properties, ranging from demographics like age or gender to behavioral
characteristics, for instance heavy users, casual users etc. Results from such analysis
can help to better understand individual customer demands, to improve existing system
and service interactions, and eventually to enhance overall customer experience and
satisfaction. As these aspects depict an important distinguishing feature for customers
when choosing between service providers, they have traditionally been of great interest
in competitive market situations. However, in recent years providing satisfying
customer experience also gains in importance for governmental institutions.
In this paper, the setting is defined within the scope of employee insurances and
labor market and data services in the Netherlands. The data at hand comprises user

2 Sharam Dadashnia, Joerg Evermann, Peter Fettke, Philip Hake, Nijat Mehdiyev,
Tim Niesen
interaction data from different IT systems, which is operated by the Dutch Employee
Insurance Agency UWV that in turn is commissioned for the implementation and
operation of respective services by the Ministry of Social Affairs and Employment
(SZW). For that purpose, UWV operates two major IT systems: (1) the website
www.werk.nl, which serves as a central contact point for matching people looking for a
suitable job with currently available positions, and (2) the so-called werkmap, which
serves as an instrument to keep track of customers’ obligations and manage associated
activities.
According to the problem statement formulated in the context of this year’s BPI
Challenge 2016, UWV is interested in the way both the site www.werk.nl and the
Werkmap systems are used. In particular, the following questions have been posed:
1. Are there clear distinct usage patterns of the website to be recognized? In particular,
insights into the way various customer demographics use the website and the
Werkmap pages of the website are of interest.
2. Do the usage patterns of the website by customers change over time? Do customers
visit different pages when they start using the website versus when they have been
using the website for some time? How does the usage change over time?
3. When is there a transition from the website to a more expensive channel, such as
sending a Werkmap message, contacting the call center or filing a complaint? Is
there a way to predict and possibly prevent these transitions?
4. Does the behavior of the customers change after they have send a Werkmap
message, made a phone call or filed a complaint? Are customers more likely to use
these channels again after they have used them for the first time? What is the
customer behavior on the site after customers have been in contact through the
Werkmap or by phone?
5. Is there any specific customer behavior that directly leads to complaints?
6. Finally, we challenge the creative minds, to surprise UWV with new insights on
the provided data to help improve the experiences of our customers when using the
website.
For most questions, there is a clear focus on usage behavior and on customer
interactions with the different IT systems. As a consequence, temporal aspects of the
data – for instance when, in which order and over which period in time did an event
occur – need to be considered in order to answer those questions.
The paper is organized as follows. Section 2 provides a brief overview to the data
description and analysis tools used in the current paper. Section 3 addresses the
identification of distinct usage patterns. The change of usage patterns is discussed in
the Section 4. Section 5 examines the applicability of deep learning approach to predict
the next process event. Exploratory analysis about more expensive channels are
discussed in Section 6, while section 7 introduces the usage patterns that lead to
complaints. Finally, section 8 gives a short summary and concludes the report.

3
2 Data Description and Software Tool Chain
The data used for the analysis described hereafter was published in the context of
the Sixth International Business Process Intelligence Challenge (BPIC’16).1 It
comprises five different datasets originating from multiple sources in an internal
process of the Dutch Employee Insurance Agency UWV, a facility which provides
employee insurances and market labor services in the Netherlands. Table 1 provides an
overview of the individual datasets along with a brief description and some basic
statistics. All data files were provided in plain .csv format. For the sake of brevity,
datasets are numbered consecutively for easier reference throughout this paper.
Table 1. Software frameworks and tools employed for data preprocessing and analysis.
Name Description
Dataset 1 [1] Customer interaction data from website www.werk.nl where customers do
not have logged in to the site, i. e. they are anonymous to the system as no
demographic data is available. The dataset contains additional information
about visited pages, timestamps for events, and details on technical
behavior of the website.
Dataset 2 [2] Interaction data from registered customers who have logged in to the
website. Demographic (age category and gender) and organizational
information (responsible resources/offices) is available in addition to the
data from dataset 1.
Dataset 3 [3] Meta information about questions asked by customers. Besides customer
data the question is described by theme, subtheme and topic depicting
predefined categories that a customer can specify when posting their
question.
Dataset 4 [4] Data from the Werkmap system that is used as an internal instrument to
keep track of customers’ obligations. It provides information on when
customers sent messages to UWV, the message type and the ID of the
handling channel.
Dataset 5 [5] Meta information about complaints filed by customers, where provided
data fields correspond to Dataset 3.
The data focuses on customer interactions with UWV’s IT systems in a specific
process (“unemployment benefits process”) where both passive interactions – a
customer using the website without the need for UWV to interfere – and active
interactions – e. g. a customer requesting support by writing a complaint – are captured.
In total, customer interaction data from an eight-month period is provided. Regarding
the language, the datasets contain both Dutch and English text. While for some data
fields, entries are provided in both languages (e. g. for theme, subtheme and topic in
datasets 3 and 5), others are only provided in a single language (e. g. page_name in
dataset 1 and 2 which describes the name of the webpage a customer visited).
To efficiently inspect, analyze, and understand the data, all datasets were loaded into
a unified local database. This way, slicing and extracting relevant data sections and
joining information that was distributed across several sets for a comprehensive
analysis were largely facilitated. For data discovery and preprocessing of high-volume
1 http://www.win.tue.nl/bpi/doku.php?id=2016:challenge

4 Sharam Dadashnia, Joerg Evermann, Peter Fettke, Philip Hake, Nijat Mehdiyev,
Tim Niesen
data, an additional in-memory database was employed. A variety of tools was then used
to investigate the data from different perspectives in order to provide valuable insights
and answers to the questions formulated in the challenge. While descriptive analytics
were primarily used to describe static aspects and distributions of the data, analysis
have been complemented by the application of methods to consider temporal aspects
of data. The following table provides a summary of the software frameworks and tools
that have been applied for data preprocessing and analysis.
Table 2. Software frameworks and tools employed for data preprocessing and analysis.
Framework/Tool Application purpose
Disco Process mining, process discovery, behavior analysis
Java Data preprocessing, data querying, data conversion
ProM 5.2 Sequence clustering, data conversion
SAP HANA In-
memory database
Data preprocessing, descriptive analytics, data slicing, calculation of
metrics
PostgreSQL Local database for lightweight data preprocessing
R and RStudio Data discovery, descriptive analysis, data manipulation, graphs
Tensorflow Deep Learning
Weka Machine Learning, regression analysis
3 Challenge 1: Distinct Usage Patterns for www.werk.nl
This section provides answers to the following question: Are there clear distinct
usage patterns of the website to be recognized? In particular, insights into the way
various customer demographics use the website and the Werkmap pages of the website
are of interest.
As a first step, we define the concept of usage patterns that will be the basis for
subsequent description: A usage pattern is hereafter considered a collection of
individual website pages that have been visited frequently by users in order to fulfill
certain tasks on werk.nl as well as the transitions between those pages. Thus, a pattern
captures the characteristics of system interactions conducted by different types of users,
e. g. with a specific age categories or any other specific demographic features.
To identify specific usage patterns for different demographic customer groups, we
employ process mining analysis in Disco. With respect to the given datasets in the form
of clickstream logs, process mining can leverage causal and temporal order of frequent
occurring sequences. As demographical information about customers is only contained
within dataset 2, we focused on this dataset when identifying distinct usage patterns.
Therefore, the following steps were conducted each segment:
1. Separation of dataset 2 into segments
2. Import of segmented data into Disco
3. Extraction of most frequent events from segments
4. Analysis of reduced event sets
5. Derivation of usage patterns
Step 1: Separation of dataset 2 into segments. In order to segment the entire
customer base, we concentrate on the data fields containing demographic information,

5
that is the fields age_category and gender. Therefore, the distinct attribute values for
those fields were determined yielding the following sets of characteristics: gender
contains the values {M,V} describing female and male customers while age_category
comprises the value ranges {18-29,30-39,40-49,50-65}. According to those values,
subsets of the dataset are then extracted using SQL and saved to individual .csv files
per segment. Table 3 shows some statistics on those subsets, namely the number of
process instances or cases (i. e. individual customers) and the total number of events
per segment.
Table 3. Segmentation of customer basis with respect to demographic features.
Segment Cases Events
#1 Age category 18-29 105.832 1.102.717
#2 Age category 30-39 133.310 1.427.763
#3 Age category 40-49 158.687 1.774.864
#4 Age category 50-65 262.490 2.848.044
While the sum of cases for the segmentation by age should match the sum of cases
for the segmentation by gender, there are some missing values for the gender field such
that those number slightly differ.
Step 2: Import of segmented data into Disco. In the next step the segment files
were separately imported into Disco. The following import settings were applied for all
files: the data field “session_id” was set as case id, “page name” was set as activity,
“timestamp” was matched to the timestamp field provided by Disco and “user_id” was
matched to the resource field.
Table 4. Filtered activities representing the most frequent activities for segment 1.
Activity Absolute Frequency Relative Frequency
taken 326.294 29,59%
mijn_cv 166.920 15,14%
home 83.778 7,60%
vacatures_bij_mijn_cv 82.588 7,49%
mijn_berichten 79.481 7,21%
vacatures_zoeken 67.217 6,10%
aanvragen-ww 59.339 5,38%
inschrijven 36.113 3,27%
mijn_werkmap 28.967 2,63%
mijn_sollicitaties 27.268 2,47%
mijn_documenten 21.237 1,93%
werkmap 18.882 1,71%
wijziging_doorgeven 14.026 1,27%
vragenlijst-uwv 13.058 1,18%
Step 3: Extraction of most frequent events from segments: Due to the high
number of cases and events, importing the individual segments according to step 2
resulted in a very large process model (so-called “spaghetti model”). To reduce this
preliminary all-encompassing model, only the most frequent activities were further
considered while others were filtered out by using the build-in features provided by

6 Sharam Dadashnia, Joerg Evermann, Peter Fettke, Philip Hake, Nijat Mehdiyev,
Tim Niesen
Disco. Following the idea that usage patterns describe characteristic user behavior,
filtering was done with respect to the relative frequency of an activity within the
segment dataset. The threshold was set to 1%, i. e. we only considered activities that
occurred with a relative frequency of equal to or greater 1%, which resulted in a total
number of 13 to 14 activities depending on the dataset. Table 4 exemplarily shows the
results for segment 1. While the lists of activities slightly differ for each segment, the
was a large overlapping, for instance taken, mijn_cv, home, and werkmap appear across
all segments.
Step 4: Analysis of reduced event sets: based on the filtered set of events from step
3, process models were generated. The Disco tool provides additional filtering options
regarding the number of activities and scope of paths between those activities that
should be included in the model. In our case, those parameters were set to 100% of
activities (that is all activities from the reduced set) and 0% of paths (meaning only the
most frequent ones). Following our definition of a usage model, those values are sound
since they lead to the generation of process models which contain only those activities
and transitions that are very common. The figures on the next pages show the resulting
models regarding the segments.
Fig. 1. Process map for segment 1

7
Step 5: Derivation of usage patterns: to finally derive characteristic usage patterns
per segment, the models were compared based on the following features: start activities
(corresponding to entry pages of the website), the flow of activities (corresponding to
transitions between pages), and unique activities (corresponding to pages typical for a
specific segment). In the following, we present key findings along with possible
interpretations and recommendations on usability improvements where appropriate:
While segments 1 to 3 clearly start with activity home, this is not true for segment 4
where the werkmap activity represents the entrance. Assuming that the home page
is the intended starting point that a customer is supposed to use when logging into
the system, this deviation is remarkable for two reasons: First, it implies a very
different system usage by the customers, because their primary interest is managing
the werkmap tasks, which significantly deviates from other segments. Second, there
is no direct path connecting werkmap with the home activity, which indicates that
the assumed entry point is only used when customers have already performed some
tasks.
To overcome this issue, one measure could be to further investigate the reasons for
this behavior: is the information presented on the home page not relevant for the
interest of these customers? Are there any design or content-specific aspects that
impede the customers from using this page? The activity vacatures (Dutch for
“vacancy”, i. .e an open job offering) is frequent in all segments except for segment
1. Instead, customers from segment 1 do look for vacancies (activity
vacatures_zoeken) but apparently do not find any suitable positions that match their
criteria or profiles. For all other segments, the usage pattern that leads to the activity
vacatures is identical: starting from home, customers visit their werkmap, then
vacatures and finally choose to go to mijn_werkmap. This may possibly indicate that
interesting vacancies were stored in customers’ personal work folders for review or
application. This issue might indicate that it is hard for younger customers (as in
terms of demographics referring to segment 1) to find a suitable job offering.
Whether this is problematic or not must be determined from a professional point of
view. However, it shows that the focus of young customers using the website is at
least in part different from other customers.
In all segments, taken (Dutch for “tasks”) is by far the most frequent activity. There
is also a high repetition in the form of a cycle, which indicates the activity as the
central page of the website to which customers repeatedly return. In addition, there
are some noticeable cycles between adjacent activities and the taken activity, for
instance with vragenlist-uwv (list of questions). There is no outgoing path from
vragenlist-uwv to any other activity than taken, isolating the page from others. Thus,
questions seem to arise in the context of customers’ task and not to be related to
other activities. However, this cycle appears in segments 1 to 3 but not in segment
4, which shows that older customers seem to have fewer questions. The reasons for
this presumable unintended behavior should be further investigated to derive specific
recommendations for system improvement.

8 Sharam Dadashnia, Joerg Evermann, Peter Fettke, Philip Hake, Nijat Mehdiyev,
Tim Niesen
Fig. 2. Process map for segment 2.
Fig. 3. Process map for segment 3.

9
Fig. 4. Process map for segment 4.
4 Challenge 2: Changes of Usage Patterns Over Time
This section provides answers to the following question: Do the usage patterns of
the website by customers change over time? How does the usage change over time?
To investigate the website usage patterns of the customers over time we have sliced the
log data of all individual customers in terms of session orders. By using such a
categorization, we can identify not only the altering usage patterns over time but also
figure out the direction of change, trends and other key measures. Before answering the
question about the trends over time, we have to identify what proportion of the
customers continues to use the website. Table 5 introduces the number of customer
having at least 15 sessions of using the website. The analysis of results suggests that
26,647 users had at least one session which significantly decreased to 14,792 who had
at least 15 sessions. From this statistics, we can infer that the users don’t tend to use the
website after they used it for the first time and this trends continues over time. E.g.
Table 5 suggests that 3.54 % of the customers did not use the website again after they
used it for the first time. The average drop rate between sessions is 4.12%.

10 Sharam Dadashnia, Joerg Evermann, Peter Fettke, Philip Hake, Nijat Mehdiyev,
Tim Niesen
Table 5. Number of customers having at least # of sessions.
Session Customers Change
1 Session 26,647 -
2 Sessions 25,705 -3.54%
3 Sessions 24,733 -3.78%
4 Sessions 23,814 -3.72%
5 Sessions 22,896 -3.85%
6 Sessions 21,956 -4.11%
7 Sessions 21,053 -4.11%
8 Sessions 20,143 -4.32%
9 Sessions 19,292 -4.22%
10 Sessions 18,452 -4.35%
11 Sessions 17,691 -4.12%
12 Sessions 16,962 -4.12%
13 Sessions 16,202 -4.48%
14 Sessions 15,435 -4.73%
15 Sessions 14,792 -4.17%
Table 6. Click trend over time (sessions are sorted).
# of Sessions # of Click
Logs
Change Average # of Clicks per
customer pro session
1. Sessions 453,928 - 17.03
2. Sessions 381,350 -16% 14.84
3. Sessions 343,817 -10% 13.90
4. Sessions 309,035 -10% 12.98
5. Sessions 284,811 -8% 12.44
6. Sessions 266,686 -6% 12.15
7. Sessions 248,288 -7% 11.79
8. Sessions 231,511 -7% 11.49
9. Sessions 213,970 -8% 11.09
10. Sessions 201,291 -6% 10.91
11. Sessions 191,186 -5% 10.81
12. Sessions 183,143 -4% 10.80
13. Sessions 171,892 -6% 10.61
14. Sessions 162,147 -6% 10.51
15. Sessions 151,629 -6% 10.25
In Table 6 we have aggregated the number of logs per session sorted according to
the time. The first column of this table indicates not the amount but the order of the
sessions. E.g. the number of click logs in the first session of all individual customers is
equal to 453,928. These results also propose that the number of click logs per session
drops over time by decreasing to 151,629 in fifteenth session of all customers. This
trend can be considered as reasonable since the numbers customers per session
decreases as mentioned above (See Table 5). However, the velocity of negative change
in number of clicks is much higher with an average of -7%. Furthermore, to normalize

11
the results we have also calculated the average numbers of clicks by individual
customers per session (See Table 6). A decreasing trend in this feature can also be easily
observed. On these grounds we can argue that, not only the number of customers using
the website decreases over time but also the average clicks per session follows a
negative trend.
In order to answer the question how the usage patterns change, we have aggregated
the log data of customers beginning from their first session to the fifteenth session and
analyzed the visits of website. Figure 5 provides valuable insights into change of
website usage behavior over time. We have introduced here the visited webpages with
relative frequency higher than 1%. From the underlying diagram we can detect a
significant drop in the visit of the “mijn_cv” page. The relative frequency of “mijn_cv”
decreased to less than 10% in the fifteenth, which was more than 25% in the first session
of users. A significant negative trend is also observed in the visit frequency of
“aanvragen-ww” and “inschrijven”.
Fig. 5. Change of website usage over time.
In contrast to mijn_cv, taken follows an increasing preference trend over time. The
relative frequency of taken has increased from 17.86% in the first sessions to 28.45%
in the fifteenth sessions. In other websites such as werkmap, mijn_sollicitaties,
vacatures_zoeken, mijn_berichten and etc. we can observe an increasing trend
however, the amplitude of the change is not significantly high.
0,00%
5,00%
10,00%
15,00%
20,00%
25,00%
30,00%
1 2 3 4 5 6 7 8 9 101112131415
Rel
ativ
e F
req
uen
cy
Sessions
taken
vacatures_bij_mijn_cv
mijn_cv
home
vacatures_zoeken
mijn_berichten
mijn_sollicitaties
mijn_werkmap
werkmap
aanvragen-ww
mijn_documenten
inschrijven
vacatures

12 Sharam Dadashnia, Joerg Evermann, Peter Fettke, Philip Hake, Nijat Mehdiyev,
Tim Niesen
Fig. 6. Process Model representing first sessions of customers.
Fig. 7. Process Model representing fifteenth sessions of customers.

13
In order to identify the changes in the transition between websites we have created
the corresponding process maps. Figure 6 and 7 introduce the process models, which
represent the first and fifteenth sessions of all users respectively. The number within
the process activities are the absolute frequency of visited websites. A significant drop
in the number of clicks can also be directly observed here. These process diagrams
allow us to observe the process paths evolved over time. A narrow analysis of process
models reveal that the sequence of transitions did not change significantly with a few
exceptions. E.g., aanvragen-ww was one of the most visited website in the earlier
sessions, which almost disappeared towards the last sessions. Another example is that
there is no link between mijn_documenten and home in the first sessions of visitors but
we can see a high number of direct transitions in the last session.
5 Challenge 3 and 6: Process Prediction
Predicting the behaviour of a user interacting with an information system enables an
optimization of the underlying processes. Knowing what step a user is most likely to
take next enables individual user assistance, which results in an increased user
experience. Furthermore, it allows for estimating and allocating the future resources
that are required to effectively accomplish the processes. Since a recent approach in
process prediction achieved significant gains in precision by adapting deep learning
techniques, we develop a deep neural network and train it using sequences of user
actions as training data in order to predict the next user action.
Facing challenge six and three we present a recent machine learning-based approach
that enables a real-time prediction of
the general user behaviour and especially
impending user-induced transitions to more expensive channels, e.g. a call centre.
Our approach consists of a (1) pre-processing, (2) a learning stage and (3) an
evaluation of our predictor based on the provided log data. In a pre-processing step we
first generate sequences of user actions from the specified logs. Then we feed the
sequences in the learning stage into the neural network in order to train its prediction
capabilities. Afterwards, we evaluate the prediction capabilities in order to assess a real-
time customer behaviour monitoring [6].
The predictor is trained on all log entries that are directly linked to a user identifier.
Thus, we use the datasets BPI2016_Clicks_Logged_In, BPI2016_Questions,
BPI2016_Complaints and BPI2016_Werkmap_Messages. Each of these log entries is
considered a user’s action and is uniquely identified by the user identifier and the
timestamp. While we differentiate all click actions, we abstract from specific questions,
complaints and Werkmap messages. Hence, a user action is considered a URL of either
a click event, a question, a Werkmap message, or a complaint. The Pre-processing of
the log entries lead to a total of 785 distinct actions, consisting of 782 URL actions, a
question action, a Werkmap message action and a complaint action. For each user we
generate a list of actions ordered by the timestamp of the respective action. In order to
improve the precision of our prediction, we also add the organizational units handling
the customer to a customer’s action. Hence, an action, which is processed to the neural
network, is represented by a code of the pattern AAA-UUU-WWW. AAA represents

14 Sharam Dadashnia, Joerg Evermann, Peter Fettke, Philip Hake, Nijat Mehdiyev,
Tim Niesen
the unique identifier provided by the SQL database for each click action, question,
complaint and Werkmap message. UUU and WWW represent the original identifiers
of the Benefits Office and the Employment Service Office as provided in the log files.
Since our network requires sequences of actions to predict the next action, we
concatenate the ordered actions of all customers and split up the concatenated actions
each 10th action. We apply the techniques proposed in to translate the obtained
sequences into vectors, which then can be fed to the network in order to train it.
We use the deep learning framework tensorflow to generate, train and assess our
predictor. In particular we model a Long Short-Term Memory (LSTM) network with
two hidden layers, each consisting of 128 neurons. Long Short-Term Memory networks
have been proven to be effective in order to learn the dependencies between the
elements of sequences. Hence, they are well known in the field of speech recognition
and time series prediction.
predicted actions
sequence of actions
likelihood
distribution
32-313-296 371-313-296 344-313-296 344-313-296
LSTM network
encoding
hidden layer
0 0 1 01 0 0 0 0 0 1 0 0 0 1 0
.0 .0 .89 .01.03 .05 .89 .01 .0 .0 .78 .0 .01 .01 .11 .78
371 344 344 785
Fig. 8. Feeding action sequences into the neural network
Figure 8 exemplarily shows a processing of an action sequence, which is executed in
order to predict the next action, after having trained the network. First, we apply an
encoding that maps the sequences to the size of our hidden layers. The obtained vectors
of the encoding are then processed within the hidden layers. Finally, the outputs of the
hidden layers are transformed into a likelihood distribution over all 785 actions. While
training the network on a high-performance consumer GPU took us a couple of days,
the retrieval of the customer’s next action providing the preceding ten actions is
instantly achieved. The evaluation of the prediction capabilities based on the given log
data yield an average precision of 64%. Using our predictor and the last 10 actions a
customer has taken, gives UWV the ability to predict the costumer’s next action with
an estimated correctness of 64%.
We now sketch the potential of our predictor based on the asked questions of the
customers. We consider a customer’s phone call likely to be related to the actions she
took on the website, if the phone call is made within an hour after the last click action.
This constraint applies for more than 50% of the customers, which asked a question (in

15
total 58,062 customers). Given the fact that an average phone call of the question log
data lasts almost 4 minutes, handling these customer requests takes more than 5 months.
Monitoring the customers by applying our predictor enables the identification of
customers that are likely to contact the call centre. By providing an intelligent assistance
to these customers in shape of suggested next steps or a chat feature could significantly
reduce a transition to the call centre and reduce the overall effort handling these
customers.
However, the fact that our predictor is based on data of a limited period implies that
there might be further behaviour patterns, which have not been discovered while
training the neural network. Furthermore, our investigation in section 4 shows that the
customer behaviour changes over time and new behavioural patterns are likely to
evolve. Therefore, a real-world application of our predictor requires also continuously
evaluating and improving the prediction model based on recent data.
6 Challenge 4: Transition to more expensive channels
Within this section, we give answers to several questions: Does the behavior of the
customers change after they have send a Werkmap message, made a phone call or filed
a complaint? Are customers more likely to use these channels again after they have
used them for the first time? What is the customer behavior on the site after customers
have been in contact through the Werkmap or by phone? As the first and third questions
are strictly related to each other, we answer these questions in the following two
subsections:
6.1 Are customers more likely to use these channels again after they have used
them for the first time?
In order to answer this question we have to identify the relevant exploratory statistics
about the customers, who used the expensive channels such as sending werkmap
message, complaints or contacting the call center. As depicted in the Fig. 1 the total
number of contacts via complaints, werkmap and questions are 289, 66,058 and
123,403 respectively. These numbers suggest that calling the customer center is the
mostly preferred communication channel by almost doubling the number of werkmap
messages. Filling complaints is rarely used by customers as means of communication
by corresponding to 0.1% of total contacts.
A further analysis reveals that some customers have used the different channels
multiple times as only 226, 16,653 and 21,533 unique customers sent complaints,
werkmap messages and questions respectively (See Fig. 10). Considering the averages,
we can argue that the customers tend to contact call centers to ask questions (5.73 times)
and send werkmap messages (3.97 times) relatively more after they have used them for
the first time. This number is 1.28 for sending complaints which implies that with a few
exceptions, the customers don’t tend to fill the complaints after their first time.
Another interesting finding is related to the use of multiple channels by the same
customers. As presented in Fig. 11, 95% of the customers (total 214) who sent
complaints, called the call center as well. Furthermore, 78% (177) of them also sent
werkmap messages. 74% (168) of customers who sent complaints, used both werkmap
and questions (call center) as communication medium. 83% (13,740) of the customers

16 Sharam Dadashnia, Joerg Evermann, Peter Fettke, Philip Hake, Nijat Mehdiyev,
Tim Niesen
who contacted through werkmap messages, also asked questions by calling the
customer services. Total number of contacts related to the customers who preferred
multiple channels are also described in Fig. 11. E.g. the customers who used both
questions and werkmap messages, sent the 77% (51,178) of total werkmap messages
(66,058).
Fig. 9. Total number of communication channel uses. Second columns indicate the number of
unique customers who contacted via complaints, werkmap and questions (call center)
Fig. 10. Multiple use of communication channels by same customers.
289226
0
200
400
Total Unique
Complaints
66.058
16.653
0
50.000
100.000
Total Unique
Werkmap
123.403
21.5330
100.000
200.000
Total Unique
Questions
1,28
5,733,97
0
5
10
Complaints Questions Werkmap
Averages
232
177
0
50
100
150
200
250
Total Unique
Complaints & Werkmap
277
214
0
100
200
300
Total Unique
Complaints & Questions
51.178
13.740
0
20.000
40.000
60.000
Total Unique
Questions & Werkmap
214168
0
100
200
300
Total Unique
Complaints & Werkmap &
Questions

17
To explore the statistics of click data of the relevant customers, we joined the tables
comprising the information about various communication channels (complaints,
werkmap and questions) with the click log file using the identification number of
customers. The total amount of clicks in the provided original log data is equal to almost
7.2 million. The numbers of clicks by customers who sent questions, werkmap
messages and complaints are 5.86 million, 5.57 million and 79.3 thousands
respectively. The fact that the sum of individual clicks exceeds the total click logs,
confirms again the finding discussed above which suggests that, majority of customers
used multiple contact mediums.
Fig. 11. Total number of click logs according to communication channels preferred
by customers.
After joining the log data (clickstream) with the list of complaints, werkmap and
questions (call center), we have also revealed that the related click data of some
customers are not available. This finding implies that either these customers contacted
through diverse communication channels mentioned above without surfing in the
website or the click log data file misses the relevant data of these customers. Table 1
provides an overview to the statistics of these customers, suggesting that the click logs
for 768 customers are not available.
Table 7. Total number of customers who contacted via diverse channels, extracted from Click
Log Data and separate communication channel files (complaints, werkmap and questions).
Communication
channels
# of customer in
log data
# of customers in
Communication
channel files
Difference
Complaints 225 226 1
Werkmap 16,649 16,653 4
Questions 20,770 21,533 763
Total 26,647 27,415 768
7.174.934
79.340
5.575.395
5.864.173
0 2.000.000 4.000.000 6.000.000 8.000.000
Total Click Logs
Complaints
Werkmap
Questions

18 Sharam Dadashnia, Joerg Evermann, Peter Fettke, Philip Hake, Nijat Mehdiyev,
Tim Niesen
6.2 Does the behavior of the customers change after they have send a
Werkmap message, made a phone call or filed a complaint? What is the
customer behavior on the site after customers have been in contact through
the Werkmap or by phone?
To identify the trend (increasing or decreasing) in the usage of websites by customers
after contacting UWV, the click data of customers have to be divided into “before and
after” datasets describing the click before of customers after categorizing them in terms
of used communication channel. However, generating such datasets is a complicated
issue since the majority of customers contacted the UWV several times using the same
communication medium (See Averages in Fig 10.). E.g. the issue is how identify the
click behavior of a particular customer before sending a werkmap message, if he/she
sent five werkmap messages in the given period.
To conduct such an analysis we propose an “overlapping intervals” approach.
Consider we have n communication points of the particular channel by the same
customer. The log data before the 1st communication point are considered as “before”
data for all communication nodes. Likewise, the log data occurring after nth describe
always the “after” behavior. According to the adopted approach, we consider the click
logs between 1 and n as both “before” and “after” behavior corresponding to the
position of the node in the given time interval. E.g. The click logs between the
communication nodes 1 and n represent the “after" behavior for the node 1, which at
the same time describe the “before” behavior for node n.
Fig. 12. The approach to identify the click logs before and after communication point.
Following this approach, we have identified the trend of using website after sending
werkmap messages, questions or complaints. As Fig.14 suggests, the number of clicks
have declined significantly after the customers sent the complaints and werkmap
messages. This reduction rate is 34.09% for customers who sent complaints and 30.35%
for customers who sent werkmap messages. The trend for using the UWV website after

19
calling the call centers follows an opposite pattern. After asking questions, the use of
website increased by 12.85%.
Fig. 13. The number of clicks after sending complaints, werkmap and questions
7 Challenge 5: Customer Behavior that Leads to Complaints
Within this section, we give an answer to the question: Is there any specific customer
behavior that directly leads to complaints? This question is important to get insight into
the logged data to further improve the application. Regarding that, the processing of
complaints for the support-team of the website is very cost intensive, the complaints
should be avoided. Therefore, the usage behavior analysis of the customers is very
important for avoiding wrong usage behavior within the website. To extract and analyze
these usage patterns we establish a three-step approach of analyzing the data. For this
question, we need dataset 1 and dataset 5 (“complaints”). To analyze the behavior we
extract certain usage patterns regarding Question 1. We use the following three-step
approach.
Step 1: Join dataset 2 and dataset 5. First, dataset 2 and 5 were joined to only
obtain user interaction data from customers which eventually filed a complaint. In order
to separate the customer interactions before those very customers sent a complaint from
the one that took place after they sent a complaint, the data was split into two segments
(before_complaint and after_complaint).
Step 2: Clustering of segments. Using ProM, we then clustered the segments with
the build-in sequence clustering algorithm in order to reduce the model complexity [7].
These clusters contain similar sequences (corresponding to similar usage behavior),
55.287
36.437
0
10.000
20.000
30.000
40.000
50.000
60.000
Clicks before
complaint
Clicks after
complaint
17.272.909
12.028.923
0
5.000.000
10.000.000
15.000.000
20.000.000
Clicks before
werkmap
Clicks after
werkmap
17.306.238
19.530.738
16.000.000
16.500.000
17.000.000
17.500.000
18.000.000
18.500.000
19.000.000
19.500.000
20.000.000
Clicks before questions Clicks after questions

20 Sharam Dadashnia, Joerg Evermann, Peter Fettke, Philip Hake, Nijat Mehdiyev,
Tim Niesen
which are more suitable for deriving usage patterns compared to considering the entire
segment. Table 8 describes cluster statistics.
Table 8. Final clusters resulting from sequence clustering algorithm.
Cluster Cases Events
#1 710 5354
#2 519 6994
#3 402 5748
#4 511 6918
#5 646 5449
#6 625 5861
The clustering of the log data will give us an aggregation of similar usage behavior
regarded the click-stream, which represents a sequence within the particular cases. The
single sequences in the log data have a strict analogy to actually usage behavior of the
users with the software system. Therefore, this clustering mechanism gives us the main
patterns of users, who sent a complaint. To analyze the click behavior in the next step,
we use the discovery mechanism of Disco to derive the relevant usage patterns.
Step 3: Derivation of usage patterns. For the derivation of the usage patterns,
which lead strictly to a complaint, we load the clustered log data into the Disco
software. The following usage patterns are described regarding a high relative
frequency to ensure the detection of general problems of certain users with the software
system and not particular cases or users. For the identification of possible user problems
with the system, we focus on the duration of site usage of the users. Therefore, the
metric mean duration as well as the absolute frequency and the max duration are very
useful to identify problems and anomalies within the system. The following process
models or extractions of the mined process models show problems or bottlenecks
concerning the system usage for the first cluster. The pattern introduced in Fig. 15
shows that mijn_sollicitaties (dutch for my applications) has a direct connection to the
website contact. As mentioned in the graph, the mean duration of the site
mjin_sollicitaties is 23.3 minutes which is too long to check own application.
Fig. 14. Extract of cluster #1.

21
Therefore, it could be reasonable to prove some user specific information e.g. for
the guidance of the website. In order to the results of question one we have been
recognized that the normal usage behavior of the customers is that the click after about
22.7 seconds to the next page wijziging_doorgeven (dutch for forward changes).
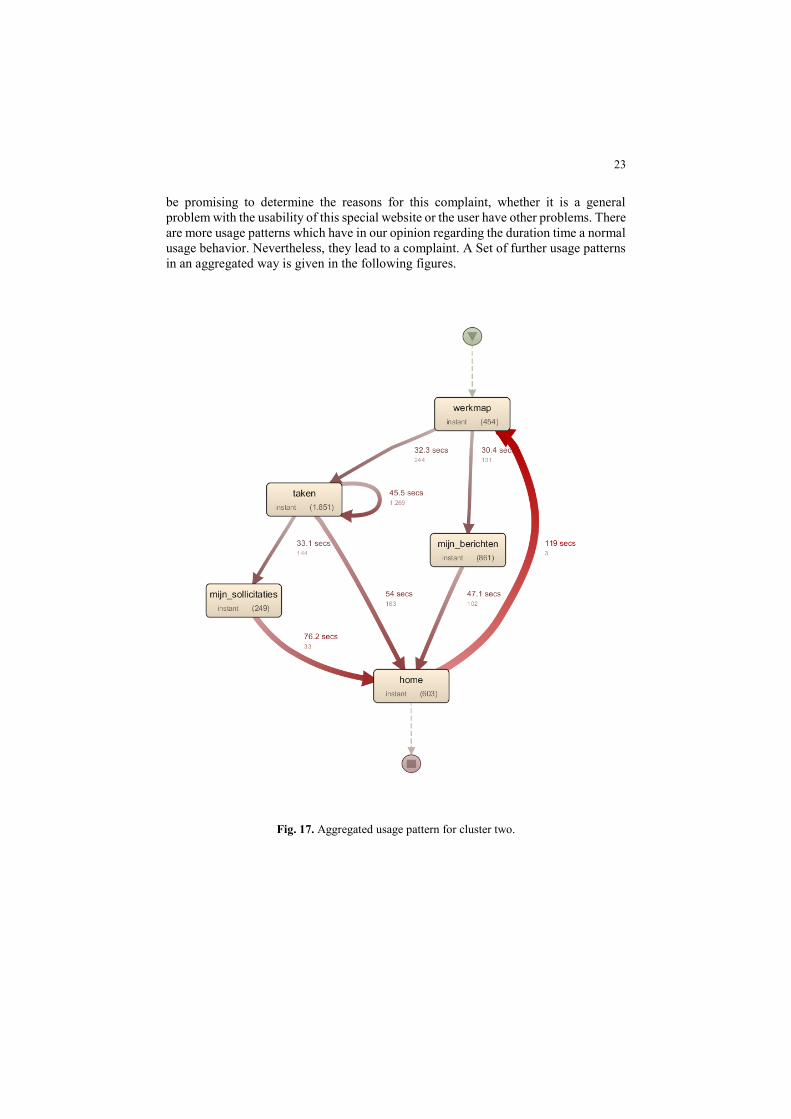
Therefore, it could be promising to determine the reasons for this complaint, whether it
is a general problem with the usability of this special website or the user have other
problems. On a more aggregated level regarding with the most frequent activities, we
visualized in Figure 16 the derivation of a more general pattern, which leads to
complaints. The pattern shows that there is a long visit of the website taken. A reason
for the long duration of this particular site could be the amount of open task of the page.
The website should be further developed to improve this average time regarding user
specific assistance systems like chats to get answers or support directly by the executed
tasks. There are certain iterations on the taken (dutch for task) website. Another aspect
is the general average duration time of the site taken before the users switch to the
home-site. After they fulfill their task, the general way is to navigate back of the home-
site and leave after they navigate to werkmap and to the site mijn_berichten.
Fig. 15. Usage pattern of cluster #1.
The following extracts of the mined process models show some of the problems or
bottlenecks concerning the system usage for the second cluster.

22 Sharam Dadashnia, Joerg Evermann, Peter Fettke, Philip Hake, Nijat Mehdiyev,
Tim Niesen
Fig. 16. Extract of cluster #2.
The pattern in Fig. 16 shows that aanvragen_bijstand (dutch for requesting for
assistance) has a direct connection to home. As mentioned in the graph the mean
duration of the site aanvragen_bijstand is 38.4 minutes, which is very long regarding
the other site durations. Therefore, it could be reasonable to prove this site in detail to
ensure a user specific guidance for processing the tasks on this site. Another reason for
the long duration time could be a bad usability of this particular site. Therefore, it could
23
be promising to determine the reasons for this complaint, whether it is a general
problem with the usability of this special website or the user have other problems. There
are more usage patterns which have in our opinion regarding the duration time a normal
usage behavior. Nevertheless, they lead to a complaint. A Set of further usage patterns
in an aggregated way is given in the following figures.
Fig. 17. Aggregated usage pattern for cluster two.

24 Sharam Dadashnia, Joerg Evermann, Peter Fettke, Philip Hake, Nijat Mehdiyev,
Tim Niesen
Fig. 18. Aggregated usage pattern for cluster three.
Fig. 19. Aggregated usage pattern for cluster four.

25
Fig. 20. Aggregated usage pattern for cluster five.
Fig. 21. Aggregated usage pattern for cluster six.

26 Sharam Dadashnia, Joerg Evermann, Peter Fettke, Philip Hake, Nijat Mehdiyev,
Tim Niesen
8 Conclusion
In our study, we have investigated the usage patterns of UWV (Dutch Employee
Insurance Agency) website by customers and examined underlying process models.
The click log data extracted from the usage of UWV website and the information about
the communication channels used by customers such as complaints, werkmap and
questions (call center) were used as inputs for the underlying analysis. After providing
a detailed introduction and a brief overview to the tools used for analysis, we have
structured the rest of the underlying paper by answering each question defined within
the frame of BPI Challenge.
In this paper we have addressed not only the identification of diverse usage patterns
considering various aspects such as demographic characteristics of customers, but also
examined the causes, directions and effects of the change trends over time in the usage
of website. Additionally, the process models were extracted using the log data which
provide a detailed overview to the transition paths among business processes in the
context of website usage. Our findings reveal that both the number of website usage by
existing visitors and the number of click logs per session decreases over time. The detail
of this analysis have important broader implications for future interventions in order to
prevent the undesired situations. We have also determined various issues related to the
usage of websites such as cycles between two processes, significant decrease in the
relative frequency of particular websites, crucial variability in different age categories
which may provide hints for the future development and maintenance of the website
specific processes. Such findings related both to usage patterns and process models
serve as an invaluable basis for identification of bottlenecks in the business processes
and detecting the deviations from designed path. Furthermore, we applied deep learning
algorithm with the goal to identify the future business process events (transition to the
other website in our case) in runtime.
We have also researched the transition of customers to more expensive channels
such as sending complaints, werkmap messages and asking questions which are
undesired by the UWV due to high support costs. The findings reveal that the customers
tend to use the same communication channels repeatedly. The majority of them also
use the multiple channels. The results of analysis also suggest that the usage behavior
of the websites before and after contacting the service team through expensive
communication channel differ significantly. The customers tend not to use the website
after contacting via werkmap and complaints. However, this trend is opposite after they
contact call centers. Furthermore, we have examined the specific behavior patterns
which may lead to filling complaints. After clustering the relevant log data we have
identified several possible reasons for such problems. E.g. spending long time with the
assistance function of the website directly before sending complaints can be linked with
the lacking usability.
We are strongly convinced the use various novel process mining techniques will help
to improve the service of UWV by identifying the reasons of shortcomings. Moreover,
we would like to express our gratitude and appreciations to UWV for providing these
invaluable datasets and BPI committee for organizing this event.

27
References
1. Dees, M., van Dongen, B., F.: BPI Challenge 2016. DOI 10.4121/uuid:9b99a146-51b5-48df-
aa70-288a76c82ec4.
2. Dees, M., van Dongen, B., F.: BPI Challenge 2016. 10.4121/uuid:01345ac4-7d1d-426e-
92b8-24933a079412.
3. Dees, M., van Dongen, B., F.: BPI Challenge 2016. 10.4121/uuid:2b02709f-9a84-4538-a76a-
eb002eacf8d1.
4. Dees, M., van Dongen, B., F.: BPI Challenge 2016. 10.4121/uuid:c3f3ba2d-e81e-4274-87c7-
882fa1dbab0d.
5. Dees, M., van Dongen, B., F.: BPI Challenge 2016.10.4121/uuid:e30ba0c8-0039-4835-a493-
6e3aa2301d3f.
6. Evermann, J., Rehse, J.R., Fettke, P.: A Deep Learning Approach for Predicting Process
Behaviour at Runtime (to be published at PRAISE 2016)
7. Thaler, T., Ternis, S., Fettke, P., Loos, P.: A Comparative Analysis of Process Instance Cluster
Techniques. In: Proceedings der 12. Internationalen Tagung Wirtschaftsinformatik (WI
2015). pp 423–437.


![Co-circulation of West Nile virus and distinct insect-specific ......study to allow effective prediction and or control of potential or ongoing epidemics [5]. Initially characterised](https://img.dokumen.tips/doc/110x75/60aa0202e7c1251e8a096e82/co-circulation-of-west-nile-virus-and-distinct-insect-specific-study-to.jpg)