Embed Size (px)
Citation preview

IDENTIFICATION OF ATP8A2 GENE MUTATION IN A
CONSANGUINEOUS FAMILY SEGREGATING
CEREBELLAR ATROPHY AND QUADRUPEDAL GAIT
A THESIS
SUBMITTED TO THE DEPARTMENT
OF MOLECULAR BIOLOGY AND GENETICS
AND THE GRADUATE SCHOOL OF ENGINEERING AND SCIENCE
OF BILKENT UNIVERSITY
IN PARTIAL FULFILLMENT OF THE REQUIREMENTS
FOR THE DEGREE OF
DOCTOR OF PHILOSOPHY
By
Onur Emre Onat
December, 2012

ii
I certify that I have read this thesis and that in my opinion it is fully adequate, in scope
and in quality, as a thesis for the degree of Doctor of Philosophy.
Prof. Dr. Tayfun Özçelik (Advisor)
I certify that I have read this thesis and that in my opinion it is fully adequate, in scope
and in quality, as a thesis for the degree of Doctor of Philosophy.
Assoc. Prof. Dr. Işık Yuluğ
I certify that I have read this thesis and that in my opinion it is fully adequate, in scope
and in quality, as a thesis for the degree of Doctor of Philosophy.
Assoc. Prof. Dr. Rengül Çetin-Atalay

iii
I certify that I have read this thesis and that in my opinion it is fully adequate, in scope
and in quality, as a thesis for the degree of Doctor of Philosophy.
Assoc. Prof. Dr. Hilal Özdağ
I certify that I have read this thesis and that in my opinion it is fully adequate, in scope
and in quality, as a thesis for the degree of Doctor of Philosophy.
Assist. Prof. Dr. Katja Doerschner
Approved for the Graduate School of Engineering and Science
Prof. Dr. Levent Onural
Director of the Graduate School

iv
ABSTRACT
IDENTIFICATION OF ATP8A2 GENE MUTATION IN A
CONSANGUINEOUS FAMILY SEGREGATING
CEREBELLAR ATROPHY AND QUADRUPEDAL GAIT
Onur Emre Onat
Ph.D. in Molecular Biology and Genetics
Supervisor: Prof. Dr. Tayfun Özçelik
December, 2012
Cerebellar ataxia, mental retardation, and dysequilibrium syndrome is a rare and
heterogeneous neurodevelopmental disorder characterized by cerebellar atrophy,
dysarthric speech, and quadrupedal locomotion. Here, a consanguineous family with
four affected individuals which suggest an autosomal recessive inheritance was
investigated. Homozygosity mapping analysis using high-resolution genotyping arrays
in two affected individuals revealed four shared homozygous regions on 13q12,
19p13.3, 19q13.2, and 20q12. Target enrichment and next-generation sequencing of
these regions in an affected individual was uncovered 11 novel protein altering variants
which were filtered against dbSNP132 and 1000 genomes databases. Further
population filtering using personal genome databases and previous exome sequencing
datasets, segregation analysis, geographically-matched population screening, and
prediction approaches revealed a novel missense mutation, p.I376M, in ATP8A2
segregated with the phenotype in the family. The mutation resides in a highly
conserved C-terminal transmembrane region of E1-E2 ATPase domain. ATP8A2 is
mainly expressed in brain, in particular with the highest levels at cerebellum which is
a crucial organ for motor coordination. Mice deficient with Atp8a2 revealed impaired
axonal transport in the motor neurons associated with severe cerebellar ataxia and body
tremors. Recently, an unrelated individual with a de novo t(10;13) balanced
translocation whose one of the ATP8A2 allele was disrupted has been identified. This
patient shares similar neurological phenotypes including severe mental retardation and
hypotonia. These findings suggest a role for ATP8A2 in the neurodevelopment,
especially in the development of cerebro-cerebellar structures required for posture and
gait in humans.
Keywords: Quadrupedal locomotion, CAMRQ, cerebellar atrophy, next-generation
sequencing, ATP8A2.

v
ÖZET
EL AYAK ÜZERİNDE YÜRÜYÜŞ VE SEREBELLAR ATROFİ
AKTARILAN AKRABA EVLİLİĞİ YAPMIŞ BİR AİLEDE
ATP8A2 GEN MUTASYONU SAPTANMASI
Onur Emre Onat
Moleküler Biyoloji ve Genetik, Doktora
Tez Yöneticisi: Prof. Dr. Tayfun Özçelik
Aralık, 2012
Serebellar ataksi, mental retardasyon ve dengesizlik sendromu, serebellar atrofi,
dizartirik konuşma ve el ayak üzerinde yürüme ile tanımlanan nadir heterojen bir sinir-
gelişimsel hastalıktır. Burada, hastalığın otozomal resesif olarak aktarıldığı bir ailede,
ebeveynleri arasında akraba evliliği bulunan etkilenmiş dört bireyin durumu
tanımlanmıştır. Etkilenmiş iki bireyde yüksek çözünürlüklü genotipleme yöntemi ile
yapılan homozigotluk haritalaması sonucu 13q12, 19p13.3, 19q13.2 ve 20q12
üzerinde dört adet ortak homozigot bölge tespit edilmiştir. Bu bölgelerin etkilenmiş
bir bireyde hedefe yönelik yeni nesil dizilemesi sonucu bulunan varyantlar,
“dbSNP132” ve “1000 genomes” veri tabanlarında filtrelenmiş ve 11 adet yeni protein
yapısını değiştiren varyant belirlenmiştir. Bu varyantların, kişisel genom veri
tabanlarında ve eksom dizileme veri setlerinde filtrelenmesi, segregasyon analizi, aynı
bölgeden bireylerde toplum taraması ve öngörü yaklaşımları ile elenmesi sonucu
olarak, ailede hastalığın kalıtımı ile uygun ATP8A2 üzerinde yeni bir yanlış anlam
mutasyonu, p.I376M, ortaya çıkmıştır. Mutasyon E1-E2 ATPaz etki alanında evrimsel
olarak son derece korunmuş C-terminal transmembran bölgesinde yer almaktadır.
ATP8A2 en çok beyinde ifade edilir, özellikle motor koordinasyondan sorumlu
serebellumda en yüksek seviyededir. Atp8a2 geni eksik farelerde motor nöronlarda
bozuk aksonal transporttan kaynaklı ciddi serebellar ataksi ve vücut titremesi
görülmüştür. Yakın zamanlarda, t(10;13) dengeli translokasyon taşıyan alakasız bir
bireyin ATP8A2 bozulması sonucu ciddi mental retardasyon ve hipotoni gibi benzer
nörolojik fenotipleri taşıdığı gösterilmiştir. Bu bulgular, insanlarda duruş ve yürüyüş
için gereken serebro-serebellar yapıların gelişmesinde ATP8A2’nin bir rolü olduğunu
düşündürmektedir.
Ahahtar Sözcükler: ATP8A2, serebellar hipoplazi, hedefe yönelik yeni nesil dizileme,
el ayak üzerinde yürüme, CAMRQ

vi
To my family…
Gülseren and İsmail Onat

vii
Acknowledgement
Foremost, from the depth of my heart I express my deep sincere gratitude and heartfelt
thanks to my supervisor, Prof. Tayfun Özçelik, who extended all facilities and
opportunities throughout my Ph.D. study and research and provided continuous
support, immense knowledge, inspiring guidance, motivation, and encouragement for
the successful completion of my research work and the improvement of my academic
career. I deem it as my chance to work under his able guidance. I will forever remain
grateful to him.
Besides my advisor, I am thankful to my committee members, Assoc. Prof. Işık
Yuluğ and Assist. Prof. Katja Doerschner for providing valuable guidance and
suggestions, Assoc. Prof. Rengül Çetin-Atalay and Assoc. Prof. Hilal Özdağ for
serving on my dissertation committee, and all other faculty members for their
inspiration, help and suggestions.
I am also thankful to Dr. Süleyman Gülsuner for his effort and help in research
and for his valuable guidance in bioinformatics approaches.
I would like to thank Prof. Murat Günel and Dr. Kaya Bilgüvar for their effort
and support in next generation sequencing experiments and providing access to the
published and unpublished exome sequencing datasets. I also would like to thank
Prof. Salim Çıracı for providing access to computer facilities and servers.
I would like to thank Prof. Uner Tan and Prof. Meliha Tan for identifying and
recruitment of the patients and other pedigree members, for brain imaging studies and
for clinical tests.

viii
I would like to thank Prof. Ayşe Nazlı Başak and Prof. Haluk Topaloğlu for
providing control subjects and collect their blood samples.
I also record my appreciation to the senior researchers of our group, Dr.
Chigdem Aydın Mustafa, Gülşah Dal, and Füsun Doldur Balcı, senior students, and
all other lab members for their pleasant association and help in various forms.
The financial, academic and technical support of the Bilkent University and its
staff and the financial support of the TUBİTAK are gratefully acknowledged.
I would like to offer special thanks to İclal Özçelik for her kind and valuable
support, for the careful review and many suggestions that she provided on the
manuscripts and for her behind-the-scenes efforts.
I would like to express my deep thanks to İnci Şimşek for her constant support,
generous care, love and patience during writing of this thesis.
I think of my parents Gülseren and İsmail Onat, my spiritual mother Güler
Uğurlu, my sister Emel Göllü and her family Eyyüp, Bade Naz, Ela Berfin, all my
uncles, aunts, and cousins whose spiritual support, understanding, love and unceasing
prayers has enabled me to reach the present position in life. I will be forever indebted
for having such a large and lovely family.
Thank You.
Onur Emre Onat

ix
Contents
1. Introduction 1
1.1 Quadrupedal Locomotion in Humans ............................................................. 1
1.2 Cerebellum and Motor Coordinates ................................................................ 2
1.2.1 Function of the cerebellum ................................................................... 2
1.2.2 Anatomy of the cerebellum and pathology characteristics ................... 3
1.2.3 Cellular components of the cerebellum and neuronal circuits .............. 4
1.2.3.1 Purkinje cells ............................................................................ 4
1.2.3.2 Granule cells ............................................................................. 5
1.2.3.3 Deep nuclei ............................................................................... 6
1.2.3.4 Mossy fibers ............................................................................. 6
1.2.4.5 Climbing fibers ......................................................................... 7
1.2.4.6 Neuronal circuits of the cerebellum ......................................... 7

x
1.3 Cerebellar Dysfunction and Ataxia ................................................................. 9
1.4 Autosomal Recessive Cerebellar Ataxias ..................................................... 10
1.5 Cerebellar Ataxia, Mental Retardation, and Disequilibrium Syndrome ....... 10
1.5.1 Genetic heterogeneity ......................................................................... 11
1.5.1.1 Very low-density lipoprotein receptor .................................... 12
1.5.1.2 Carbonic anhydrase VIII ........................................................ 16
1.5.1.3 WD repeat domain 81 ............................................................. 16
1.6 Gene Identification in Mendelian Disorders ............................................... 18
1.6.1 Genetic mapping in autosomal recessive disorders ............................ 19
1.6.2 Consanguinity ..................................................................................... 21
1.6.3 Genetic heterogeneity ......................................................................... 23
1.6.4 Targeted next generation sequencing .................................................. 24
1.6.5 Identification of the causal mutation in CAMRQ ............................... 25
1.7 Subject and outline of the Thesis .................................................................. 18
2. Materials and Methods 27
2.1 Recruitment of Patients and Controls ........................................................... 27
2.2 Clinical Investigations .................................................................................. 28
2.3 DNA Isolation from the Family Members .................................................... 28
2.4 Genetic Mapping Techniques ....................................................................... 29
2.4.1 Genome-wide SNP Genotyping .......................................................... 29

xi
2.4.2 Homozygosity mapping analysis and haplotype construction ............ 30
2.5 The Candidate Gene Approach ..................................................................... 32
2.5.1 Selecting a candidate gene .................................................................. 32
2.5.2 Testing the Candidate Gene ................................................................ 33
2.5.2.1 Determination of the coding regions of the candidate genes . 33
2.5.2.2 Primer design and quality ....................................................... 33
2.5.2.3 Amplification of the coding regions ....................................... 33
2.5.2.4 Visualization of the PCR products ......................................... 34
2.5.2.5 Sequencing of the candidate genes ......................................... 34
2.5.2.6 Visualization and analysis of the sequencing data ................. 35
2.6 Targeted next generation sequencing analysis .............................................. 36
2.6.1 Probe and Chip design ........................................................................ 36
2.6.2 Single-end library construction and sequence capture ........................ 38
2.6.3 Analysis of the targeted NGS data ...................................................... 38
2.6.3.1 Alignment and read mapping ................................................. 40
2.6.3.2 Genotype and variant calling .................................................. 40
2.6.3.3 Fold enrichment and coverage analysis .................................. 41
2.6.3.4 Genotype calling error analysis .............................................. 42
2.6.3.5 Positional and functional annotation of the variants .............. 43
2.6.3.6 File formats ............................................................................. 45

xii
2.7 Identification of the disease causing mutation .............................................. 45
2.7.1 Population screening ........................................................................... 46
2.7.1.1 Population datasets ................................................................. 46
2.7.1.2 Alleles specific PCR analysis ................................................. 47
2.7.1.3 Restriction fragment length polymorphism analysis .............. 47
2.7.2 Confirmation of the candidate variants ............................................... 47
2.7.3 Segregation analysis of the candidate variants ................................... 48
2.8 Screening the candidate genes in neurological disease cohorts .................... 48
2.9 Functional Characterization of ATP8A2 ...................................................... 49
2.9.1 Prediction tools and databases ............................................................ 49
2.9.2 Expression analysis ............................................................................. 50
2.9.2.1 cDNA libraries construction ................................................... 50
2.9.2.2 Semi-quantitative RT-PCR analysis ....................................... 52
2.9.2.3 Real time Quantitative RT-PCR analysis ............................... 52
2.9.2.4 Data mining from published expression datasets ................... 53
2.10 Enzymes, Chemicals, and Reagents ............................................................ 54
2.10.1 Enzymes ............................................................................................ 54
2.10.2 Solutions and buffers ........................................................................ 55
2.10.3 Chemicals and reagents..................................................................... 56
2.11 Reference sequences used in this study ...................................................... 57

xiii
2.12 Web Sources ............................................................................................... 59
3. Results 60
3.1. Clinical Assessment of the Family .............................................................. 60
3.2. Genetic Mapping .......................................................................................... 64
3.2.1. Homozygosity mapping using Affymetrix arrays.............................. 64
3.2.2. Candidate gene sequencing ................................................................ 65
3.2.3. Homozygosity mapping using high-resolution Illimuna arrays......... 69
3.3 Targeted next generation sequencing of the homozygous regions ............... 72
3.3.1 Sample Preparation ............................................................................. 72
3.3.2 Capture and sequence enrichment ...................................................... 76
3.3.3 Data Analysis ...................................................................................... 76
3.3.3.1 Variant calling and error rates ................................................ 76
3.3.3.2 Analysis of the low-coverage regions .................................... 78
3.4 Identification of the Disease-Causing Determinants .................................... 79
3.4.1 Genotype calling and analysis ............................................................ 83
3.4.2 SNP calling and filtering ..................................................................... 83
3.4.3 Functional annotation of the novel homozygous variants .................. 85
3.4.4 Population Screening .......................................................................... 87
3.4.5 Exclusion of the variants ..................................................................... 88
3.4.5.1 Database Search...................................................................... 88

xiv
3.4.5.2 Segregation Analysis by haplotype construction ................... 96
3.4.5.3 Exclusion of the APBA3 as the disease causing gene .......... 102
3.4.5.4 Exclusion of the PCP2 as the disease causing gene ............. 106
3.4.6 ATP8A2 p.I376M as the disease causing mutation .......................... 109
3.5 Characterization of ATP8A2 ....................................................................... 115
3.6 Expression of ATP8A2 ............................................................................... 116
3.6.1 Real time RT-PCR analysis .............................................................. 116
3.6.2 Annotation clustering of early embryonic mouse brain genes.......... 116
4. Discussion 122
4.1 Disease Gene Identification ........................................................................ 122
4.2 Overview of Variant Filtration and Prioritization ....................................... 124
4.3 ATP8A2 is associated with CAMRQ ......................................................... 127
4.3.1 Biochemical properties of P-type ATPases ...................................... 127
4.3.2 Clinical phenotypes associated with P4-type ATPases ..................... 128
4.3.3 Clinical phenotypes associated with ATP8A2 .................................. 129
4.3.4 ATP8A2 p.I376M mutation .............................................................. 131
4.3.5 Expression of ATP8A2 ..................................................................... 132
4.3.6 Association with other CAMRQ genes............................................. 133
4.4 Conclusion .................................................................................................. 134

xv
5. Future Perspectives 136
6. References 138
7. Appendices 154
Appendix A ....................................................................................................... 155
Appendix B ....................................................................................................... 162
Appendix C ....................................................................................................... 170
Appendix D ....................................................................................................... 174
Appendix E ....................................................................................................... 176
8. Publications 18107

xvi
List of Figures
1.1 Schematic representation of the major functional and anatomical divisions
of the cerebellum ................................................................................................ 5
1.2 Neuronal circuits and cellular components of the cerebellum ........................... 8
1.3 Genetic heterogeneity in CAMRQ ................................................................... 13
1.4 Pedigree of the Family A ................................................................................. 15
1.5 Pedigree of the Family D ................................................................................. 15
1.6 Pedigree of the Family B.................................................................................. 17
1.7 Schematic representation of the gene identification in Mendelian diseases .... 20
1.8 Homozygosity mapping of recessive disease genes......................................... 22
1.9 Prevalence of the consanguineous marriages in the world .............................. 24
2.1 DNA Markers used in the study ....................................................................... 35
2.2 Schematic representation of the NGS and analysis algorithm ......................... 37

xvii
2.3 Representation of the library construction and sequence capture .................... 39
2.4 Algorithm of the ANNOVAR annotation pipeline .......................................... 44
3.1 Family pedigree of the affected individuals ..................................................... 62
3.2 Quadrupedal walking of patients ..................................................................... 63
3.3 Standing postures of the quadrupedal and bipedal ataxic man ........................ 64
3.4 Homozygosity mapping analysis using Affymetrix arrays .............................. 65
3.5 Homozygosity mapping analysis using high-resolution Illimuna arrays ......... 70
3.6 Comparison of the Affymetrix and Illimuna arrays…………………………....71
3.7 Density measurements using agarose gel electrophoresis ............................... 73
3.8 Linear regression graph of PicoGreen assay .................................................... 75
3.9 Graphical representation of the coverage analysis of the NGS data ................ 80
3.10 Schematic representation of the disease-causing gene identification method . 82
3.11 Functional annotation of the novel homozygous coding variants .................... 87
3.12 Schematical representation of the analysis, annotation, and exclusion of
the genetic variants ........................................................................................... 90
3.13 Haplotype structure of the disease interval on chromosome 13q12 ................ 97
3.14 Haplotype structure of homozygous region on chromosome 19 ..................... 98
3.15 Haplotype structure of homozygous region on chromosome 20 ..................... 99
3.16 Segregation analysis of the variants in the affected individuals .................... 100

xviii
3.17 Amino acid sequence homology of the APBA3 protein ................................ 103
3.18 Conservation analysis of the APBA3 protein ................................................ 104
3.19 The PSIPRED protein secondary structure prediction of APBA3 ................. 105
3.20 Pfam domain analysis of the APBA3 ............................................................ 105
3.21 Confirmation of the PCP2 p.E2del variant by Sanger sequencing ................ 107
3.22 Amino acid sequence homology of the PCP2 protein ................................... 108
3.23 Conservation analysis of the PCP2 protein .................................................... 108
3.24 Graphical representation of the predicted functional and structural elements
of ATP8A2 protein ......................................................................................... 109
3.25 The secondary protein structures of the wild-type and mutant ATP8A2....... 111
3.26 Multiple amino acid sequence alignments of ATP8A2 protein ..................... 112
3.27 Conservation analysis of the ATP8A2 protein............................................... 113
3.28 Phylogenetic tree analysis of multiple sequence alignments of ATP8A2 ..... 113
3.29 Expression profiles of ATP8A2 in multiple human tissues ........................... 117
3.30 Real-time expression profiles of ATP8A2 in multiple human tissues ........... 117
3.31 Real-time expression profiles of ATP8A2 in different human brain
regions............................................................................................................. 118
3.32 Schematic representation of the functional annotation clustering ................. 119
3.33 Graphical representation of the expression profiles of the filtered differentially
expressed genes within day groups….............................................................120

xix
List of Tables
1.1 Classification of the most common autosomal recessive ataxia syndromes .... 11
1.2 Clinical characteristics of the families with VLDLR deficiency ..................... 14
1.3 Clinical characteristics of the family with WDR81 deficiency. ...................... 18
2.1 Databases used to evaluate novel homozygous protein altering candidate
variants .............................................................................................................. 51
2.2 Enzymes used in the experiments .................................................................... 54
2.3 Solutions and buffers used in the experiment .................................................. 55
2.4 Reagents and chemicals used in the experiment .............................................. 56
2.5 Accession codes and locations of the ortholog sequences of the candidate
genes ................................................................................................................. 57
2.6 Web-tools used in analysis and design ............................................................ 59

xx
3.1 Physical, radiological, and genetic characteristics of the patients. .................. 61
3.2 Shared homozygous regions of Affymetrix 250K data ................................... 66
3.3 Genes located on the 13q candidate homozygous region ................................ 67
3.4 Gene prioritization using GeneWanderer......................................................... 68
3.5 Statistics of the sequencing results of the 13q region ...................................... 69
3.6 Shared homozygous regions of Illimuna arrays ............................................... 70
3.7 DNA concentrations as a result of densitometric measurements ..................... 73
3.8 DNA concentrations as a result of spectrophotometric measurements ............ 74
3.9 DNA concentrations as a result of PicoGreen analysis .................................... 74
3.10 Average concentrations of samples of PicoGreen measurements ................... 75
3.11 Statistics of targeted next generation sequence data ....................................... 77
3.12 Coverage analysis of the next generation sequencing data ............................. 79
3.13 List of genes corresponding to low and zero coverage regions ...................... 81
3.14 Statistics of the genetic variants after base calling and positional
annotations ..................................................................................................... 84
3.15 Statistics of the novel genetic variants filtered by using dbSNP32 database .. 86
3.16 Novel homozygous protein altering variants at the targeted region ............... 89
3.17 Database annotation of the novel homozygous protein altering variants ....... 91
3.18 Evaluation of the candidate genes in several databases .................................. 95

xxi
3.19 Novel coding variants identified by targeted next-generation sequencing
of 05-996 ...................................................................................................... 101
3.20 Locations and orientations of the predicted transmembrane helices of
ATP8A2 ....................................................................................................... 110
3.21 Mutation screening of ATP8A2 p.I376M in isolated cases, healthy controls,
patients with non-neurological phenotypes and databases. .......................... 115
3.22 Transcripts of ATP8A2 according to Ensembl database .............................. 115
3.23 Genes associated with human diseases which are co-expressed with
Atp8a2 .......................................................................................................... 121
4.1 Clinical phenotypes associated with P4-type ATPases ................................. 130
A.1 Primers for candidate gene sequencing ........................................................ 155
A.2 Sanger sequencing primers for segregation analysis of protein altering
variants ......................................................................................................... 160
A.3 AS-PCR primers for population screening .................................................. 161
A.4 Real time RT-PCR primers expression analysis .......................................... 161
A.5 STR markers for haplotype construction of chromosome 13q12 ................ 161
B.1 Full list of the candidate genes located at the shared homozygous regions . 162
C.1 Full list of novel homozygous variants at the homozygous regions ............ 170
D.1 Exons of longest transcript of ATP8A2 isoform 1 ....................................... 174
E.1 DAVID analysis to determine enrichment for genes whose expression profiles
correlated with ATP8A2 .............................................................................. 176

xxii
Abbreviations
ACTB Beta-Actin
ALFRED The Allele Frequency Database
APBA3 Amyloid Beta (A4) Precursor Protein-Binding, Family A,
Member 3
APOER2 Apolipoprotein E Receptor 2
APTX Aprataxin
AS-PCR Allele Specific PCR
ATM Ataxia Telangiectasia Mutated
ATP12A Atpase, Na+/K+ Transporting, Alpha Polypeptide-Like 1
ATP8A2 Atpase, Class I, Type 8a, Member 2
BRIC Benign Recurrent Intrahepatic Cholestasis Type 1
BWA Burrows-Wheeler Aligner
BWT Burrows-Wheeler Transform
CA8 Carbonic Anhydrase VIII
CAMRQ Cerebellar Ataxia, Mental Retardation, and Disequilibrium
Syndrome
CCAS Cerebellar Cognitive Affective Syndrome
CENPJ Centromeric Protein J
CGAP-GAI Cancer Genome Anatomy Project-Genetic Annotation
Initiative
CNS Central Nervous System
CT Computed Tomography
DAB1 Disabled, Drosophila, Homolog of 1
DAVID Database for Annotation, Visualization and Integrated
Discovery

xxiii
DCX Doublecortin
DES-H Disequilibrium Syndrome
DGV Database of Genomic Variants
EtBr Ethidium Bromide
EVS Exome Sequencing Project
F-SNP Functional SNPs
FXN Frataxin
GA Genome Analyzer
GAPDH Glyceraldehyde 3-Phosphate Dehydrogenase
GEO Gene Expression Omnibus
GERP Genomic Evolutionary Rate Profiling
GO Gene Ontology
GWAS Genome-Wide Association
HAD Haloacid Dehalogenase-Like Hydrolase
HMMs Hidden Markov Models
HOPE Have yOur Protein Explained
IGV Integrative Genomics Viewer
ILOCA Idiopathic Late Onset Cerebellar Ataxia
IP3 Inositol 1,4,5-Triphosphate
IRB Institutional Review Boards
ITPR1 Inositol 1,4,5-Triphosphate Receptor, Type 1
indel Insertion and Deletion
JAX KO The Jackson Laboratory Knock-Out
JSNP Japanese SNP
KEGG Kyoto Encyclopedia of Genes and Genome
LD Linkage Disequilibrium
LIS2 Lissencephaly 2
LISX1 Lissencephaly, X-Linked
MAF Minor Allele Frequency
Maq Mapping And Assembly with Qualities
MGI Mouse Genome Informatics
MIM Mendelian Inheritance Of Man
MMSE Mini Mental State Examination
MRI Magnetic Resonance Imaging

xxiv
MSA Multiple System Atrophy
MTMR6 Myotubularin-related Protein 6
NGS Next Generation Sequencing
NHGRI National Human Genome Research Institute
NUPL1 Nucleoporin-like 1
OMIM Online Mendelian Inheritance in Man
PCP2 Purkinje Cell Protein-2
PFIC1 Progressive Familial Intrahepatic Cholestasis Type 1
phyloP Phylogenetic p-Value
PNS Peripheral Nervous System
POLG Polymerase Gamma
QRT- PCR Real-Time Quantitative RT-PCR
RELN Reelin
RFLP Restriction Fragment Length Polymorphism
SACS Sacsin
SAMtools Sequence Alignment/Map Tools
SCA15 Spinocerebellar Ataxia 15
SETX Senataxin
SNP Single Nucleotide Polymorphism
SNV Single Nucleotide Variants
SSAHA Sequence Search and Alignment Hashing Algorithm
STRs Short Tandem Repeats
TDE1 Tumor Differentially Expressed
Tm Melting Temperatures
TMpred Web-based Transmembrane Prediction
UniProt Universal Protein Resource
UPGMA Unweighted Pair Group Method With Arithmetic Mean
UTRs Untranslated Regions
VLDLR Very Low-Density Lipoprotein Receptor
WDR81 WD Repeat Domain 81

1
Chapter 1
Introduction
1.1 Quadrupedal Locomotion in Humans
Quadrupedalism is the form of locomotion of the majority of vertebrates and
mammals. It uses limbs and legs. Bipedalism is the fundamental adaptation of
hominids which separate them from other primates. However, bipedal gait including
long-distance walking and running is one of the key characteristics of humans.[1-3]
Actually, humans begin life with crawling on all fours but do not retain quadrupedal
gait and continue life with up-right posture.[2, 4] The origin of human bipedalism is
still on debate since its genetic background is poorly understood, but a century of
research of fossil and comparative anatomy studies give valuable information about
the development of the bipedal locomotion.[1-6]
Bipedal walking in humans is controlled by central nervous system which
transmits the signals to peripheral nervous system.[7] Detailed functional analysis of
the brain regions revealed that cerebellum, cerebral cortex, occipital cortex, and basal
ganglia are the crucial parts in controlling locomotion.[8] Especially, recent studies on

2
cerebellar disorders revealed that cerebellum has a particular role in controlling motor
movements and balance in humans.[9, 10]
1.2 Cerebellum and Motor Coordinates
1.2.1 Function of the cerebellum
The cerebellum is a brain region involved in motor control. Lesions in cerebellum are
associated with loss of coordination (asynergia), drunk-like movement (ataxia),
inability to perform rapid movements (adiadochokinesia), poor articulation
(dysarthria), movement tremors (intention tremor), inability to decide when to stop
(dysmetria), weak muscle tone (hypotonia), and abnormal eye movement
(nystagmus).[11]
The role of cerebellum in cognitive functions such as articulation, emotion, and
mental behavior has not been elucidated yet. The evidence underlying the causes of
the cognitive function of the cerebellum comes from the anatomical investigations,
clinical manifestation of the cerebellar disorders, and functional neuroimaging
approaches, but genetic evidence is still missing.[12] Recent improvements in brain
imaging techniques, genetics, and mouse genomics have provided identification of
many genes involved in cerebellar malformations which in turn provided information
about the function of the cerebellum.[13]
The strongest clues about the function of the cerebellum have come from
animals and humans with cerebellar dysfunction. The essential role of the cerebellum
is the coordinating motor movements such as typing, running, and talking. Patients
with completely damaged or loss of the cerebellum continue to generate motor
movements but they loses precision, coordination, and accurate timing.[14]

3
The cerebellum functionally locates between the central nervous system (CNS)
and peripheral nervous system (PNS). The PNS connects the CNS with the rest of the
body by network of nerves. The input signals from the sensory organs unite with the
input signals from the motor pathways.[15] These inputs transmitted to the CNS via
sensory pathways and to muscles and glands via motor pathways. The signals from
various parts of the spinal cord and brain integrated to the cerebellum via spinal and
cranial nerves, respectively. Cerebellum analyzes these inputs, corrects mismatches
between predicted and actual movements, calculates timing, and decides the action
quickly.[16] These predictions are learnt according to past experiences which is called
motor learning.[17] There are some evidence that the cerebellum participates in some
types of motor learning with basal ganglia and cerebral cortex.[18] Cerebellum also
helps to motor cortex in planning the next movement while controlling a motor
movement.[19]
1.2.2 Anatomy of the cerebellum and pathology characteristics
The cerebellum constitutes 10% of the total volume of the brain locating at the bottom
between the cerebral cortex and pons which is the part of brainstem.[20] It is separated
from the cerebrum by a layer called dura mater. More than half of all neurons reside
at the cerebellum with a regular repeating manner because of the presence of the
granule cells. Cerebellum is divided into several distinct regions (Figure 1.1). First, it
is divided into two hemispheres each of which divided into intermediate and lateral
regions where vermis located at the middle line. According to its standing position,
cerebellum classified in three regions: the anterior (front), posterior (behind) , and
flocculonoduler lobes.[21]
The volume of the cerebellum is occupied by gray matter, also called the
cerebral cortex at the outside, the internal white matter, and the deep nuclei. The gray
and white matters are made up myelinated nerve fibers and the deep nucleus is
composed of branched nerve bodies. The cerebellar output originates from the deep
nuclei and is transmitted to white and gray matter.[22]

4
The cerebellum coordinates motor functions at three levels:
vestibulocerebellum, spinocerebellum, and cerebrocerebellum (Figure 1.1).
Vestibulocerebellum consist of flocculonoduler lobes and a small portion of the
vermis. Evolutionary it is the oldest part of the cerebellum. This region plays a role in
the coordination of the balance of the movements with the help of vestibular system
and also in the eye movements.[22] The spinocerebellum composed of most portions
of the vermis and medial zone of the anterior and posterior lobes. This region involves
in the coordination of the movements at the distal part of the body, especially hands
and fingers. It receives input signals from the spinal cord, visual and auditory systems
and transmits these signals to the cerebral cortex and brainstem. The
cerebrocerebellum is the largest functional part including the both hemispheres and it
provides connection with the cerebral motor cortex and cerebrum. The input signals
from the motor and sensory pathways are received by cerebrocerebellum and the
output signals are transmitted back to the ventrolateral thalamus and red nuclei where
the cerebellum functions in the planning and coordination of the sequential voluntary
movements.[19, 20]
1.2.3 Cellular components of the cerebellum and neuronal circuits
At cellular level cerebellum composed of three types of neuronal cells which are
Purkinje, granule and deep nuclei cells and three types of axon fibers which are mossy,
climbing and parallel fibers.
1.2.3.1 Purkinje cells
Purkinje cells are evolutionary the earliest cell types and are packed in the cerebral
cortex, called Purkinje layer. These cells are one of the largest neurons in the human
brain composed of dendritic bodies which are branched perpendicular to the cerebellar
folds. These dendrites receive signals from the fibers which then travel into the deep
cerebellar nuclei via axons.[23]

5
Figure 1.1: Schematic representation of the major functional and anatomical divisions
of the cerebellum
Purkinje cells are at the heart of cerebellar circuits connected with two layers.
The dendrites of the Purkinje cells reach to the cerebellar nuclei through parallel fibers
and to the inferior olivary nucleus through climbing fibers. They send inhibitory
(GABAergic) signals to the deep nuclei to provide motor coordination in the cerebral
cortex.[23]
1.2.3.2 Granule cells
Granule cells are the smallest but the most numerous neurons in the brain. They
account for the half of the neurons in the CNS. These cells are packed at the bottom of

6
the cerebral cortex forming the dendritic claw. These dendritic claws receive excitatory
signals from the mossy fibers originating at the pontei nuclei and inhibitory signals
from the Golgi cells. The axons of the granule cells reach to the upper layer of the
cerebral cortex and split into parallel fibers through dendritic bodies of the Purkinje
cells. At this level, granule cells and the Purkinje cells contact each other at every 3-5
parallel fibers forming synapses using glutamate as a neurotransmitter so it is
excitatory.[22] These parallel fibers of the granule cells fire synchronization which
results in the only excitatory signals present in the cortex. The synapse between
Purkinje cells and granule cells has a role in motor learning.[24]
1.2.3.3 Deep nuclei
The deep nucleus is the center of the output signals from the cerebellum that resides at
the core region within the gray matter. It consists of three nuclei: dentate nucleus
communicates with the lateral parts of the cerebellar cortex; interpositus and fastigial
nuclei communicate with the spinocerebellum. The neurons at the deep nuclei have
large cell bodies and dendrites. Most of them use glutamate neurotransmitter which
target several regions outside the cerebellum. A little portion of the neurons use GABA
neurotransmitter and target the olivary nucleus which is the source of climbing
fibers.[21]
The deep nuclei always receive excitatory signals from mossy and climbing
fiber pathways and inhibitory signals from Purkinje cells in the cerebellar cortex. The
deep nuclei inhibited by the Purkinje cells when the motor cortex is activated after a
short delay with a negative feedback signal which prevent the overreaction and
oscillation of the muscles.[23]
1.2.3.4 Mossy fibers
Mossy fibers are the major inputs to the cerebellum. They originate from many
regions: most of them from pontei nuclei of the cerebral cortex and remaining fibers
from vestibular nuclei, spinal cord, reticular formation, and the deep nuclei. These
7
fibers make synapses with the dendritic claws of the granule cells at the deep nuclei
forming fiber rosettes within the structures called glomeruli. Mossy fibers function in
the sensory pathway by transmitting the information from pontine nuclei to the granule
cells, which is then transmitted to the Purkinje cells through the parallel fibers.[23]
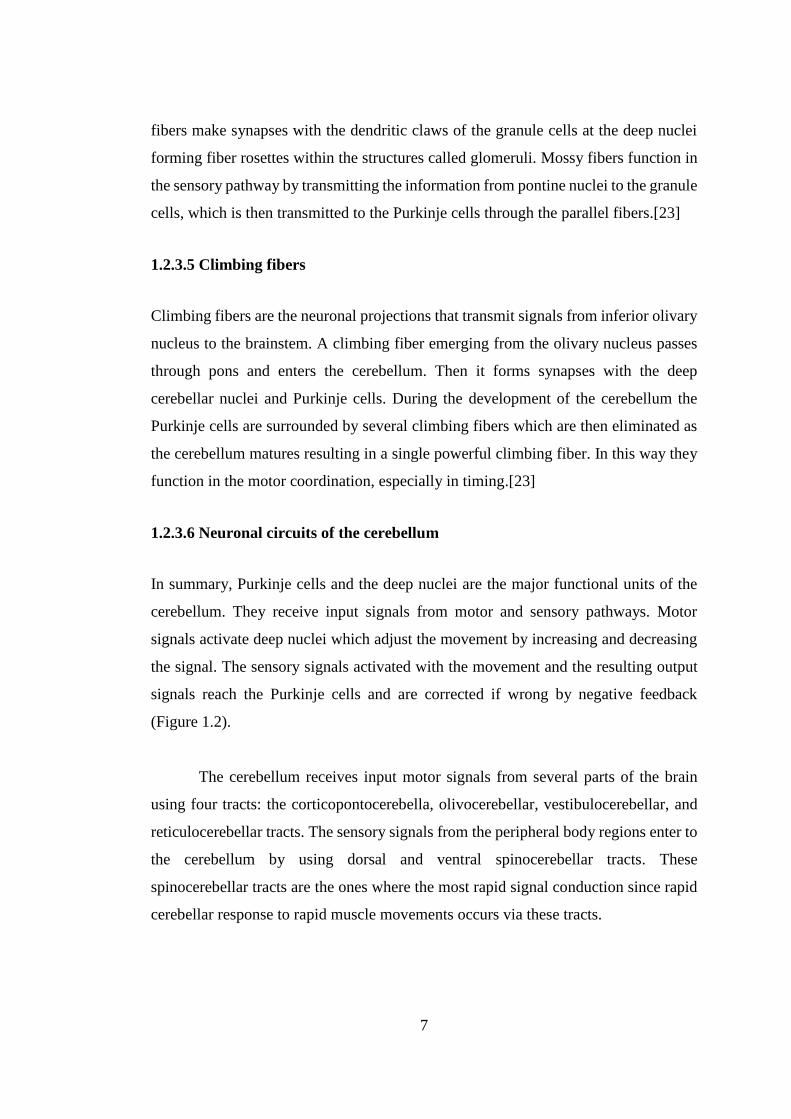
1.2.3.5 Climbing fibers
Climbing fibers are the neuronal projections that transmit signals from inferior olivary
nucleus to the brainstem. A climbing fiber emerging from the olivary nucleus passes
through pons and enters the cerebellum. Then it forms synapses with the deep
cerebellar nuclei and Purkinje cells. During the development of the cerebellum the
Purkinje cells are surrounded by several climbing fibers which are then eliminated as
the cerebellum matures resulting in a single powerful climbing fiber. In this way they
function in the motor coordination, especially in timing.[23]
1.2.3.6 Neuronal circuits of the cerebellum
In summary, Purkinje cells and the deep nuclei are the major functional units of the
cerebellum. They receive input signals from motor and sensory pathways. Motor
signals activate deep nuclei which adjust the movement by increasing and decreasing
the signal. The sensory signals activated with the movement and the resulting output
signals reach the Purkinje cells and are corrected if wrong by negative feedback
(Figure 1.2).
The cerebellum receives input motor signals from several parts of the brain
using four tracts: the corticopontocerebella, olivocerebellar, vestibulocerebellar, and
reticulocerebellar tracts. The sensory signals from the peripheral body regions enter to
the cerebellum by using dorsal and ventral spinocerebellar tracts. These
spinocerebellar tracts are the ones where the most rapid signal conduction since rapid
cerebellar response to rapid muscle movements occurs via these tracts.

8
Figure 1.2: Neuronal circuits and cellular components of the cerebellum.

9
1.3 Cerebellar Dysfunction and Ataxia
There are several diseases involving dysfunction of the cerebellum and producing
ataxia. The clinical symptoms of the ataxic motor syndromes involve body
disequilibrium, uncoordinated movement, tremor, dysarthria, extremity and eye
movements. A small proportion of the diseases with cerebellar lesion do not result in
ataxia. Patients with the cerebellar cognitive affective syndrome (CCAS) have defects
in executive, visual, and linguistic abilities.[25]
The lesions on the different regions of the cerebellum have distinct
consequences. Patients with cerebellar lesions without any damage to the central core
of the cerebellum, which is called deep nuclei, can still perform motor functions but in
slow rate. [21] The dysfunction of the vestibulocerebellum results in impairment in the
balance and the eye control. The dysfunction of the spinocerebellum including vermis
results in truncal ataxia which is drunk-like movement. The dysfunction of the
cerebrocerebellum results in appendicular ataxia which is the inability to achieve
voluntary and planned movements. These patients represent intention tremor,
dysarthria, dysdiadochokinesia, and dysmetria.[25]
The cerebellar ataxias are a very diverse group of disorders according to the
clinical representation and causes. The ataxic disorders caused by cerebellar
dysfunction divided into three groups. First group involves acquired ataxias which are
mostly caused by stroke, trauma, and intoxication such as alcohol induced
degeneration, radiation poisoning, and vitamin B12 deficiency.[26] The second group
is degenerative ataxias, which are caused by de novo mutations, including idiopathic
late onset cerebellar ataxia (ILOCA) and multiple system atrophy (MSA).[27] The last
group consists of the hereditary ataxias caused by genetic mutations segregated in the
family with Mendelian inheritance. Hereditary ataxias include autosomal dominant
cerebellar ataxias such as episodic ataxias and spinocerebellar ataxias; autosomal
recessive cerebellar ataxias such as Friedreich’s ataxia, ataxia telangiectasia, and

10
Niemann Pick disease; and X-linked cerebellar ataxias such as fragile X-associated
tremor/ataxia syndrome.[26]
The genetic ataxias are both genetically and phenotypically heterogeneous
where they can be caused by mutations in several different genes or different mutations
in the same gene can cause different phenotypes.[26]
1.4 Autosomal Recessive Cerebellar Ataxias
Autosomal recessive cerebellar ataxias are neurodegenerative diseases. Most of them
are heterogeneous with respect to age of onset, severity, and the frequency of the
disease. They are associated with both CNS and PNS. Several autosomal recessive
cerebellar ataxia disorders may have the same phenotype, whereas mutations in the
same genes may lead to distinct phenotype such as frataxin (FXN), polymerase gamma
(POLG), aprataxin (APTX), ataxia telangiectasia (ATM) or senataxin (SETX).[10]
Therefore, the clinical classification is still remains controversial.
Palau and Espinos classified autosomal recessive cerebellar ataxias in four
groups depending on the molecular mechanism as congenital and developmental
ataxias, metabolic ataxias, , degenerative and progressive ataxias, ataxias due to DNA
repair defects.[9] The examples of these subgroups are described in Table 1.1
1.5 Cerebellar Ataxia, Mental Retardation, and Disequilibrium
Syndrome
Cerebellar ataxia, mental retardation, and disequilibrium syndrome (CAMRQ) is a
genetically heterogeneous disorder characterized by cerebellar atrophy, mental
retardation, dysarthric speech, and hypotonia with or without quadrupedal gait.

11
Table 1.1: Classification of the most common autosomal recessive ataxia syndromes.
Adopted from Palau and Espinós (2006).[9]
Classification Gene Locus
Congenital ataxias
Joubert syndrome JBTS4 NPHP1 2q13
Cayman ataxia ATCAY 19p13.3
Metabolic ataxias
Ataxia with isolated vitamin E deficiency α-TTP 8q13
Refsum disease PhyH 10pter-p11.2
DNA repair defects
Spinocerebellar ataxia with axonal neuropathy TDP1 14q31
Ataxia with oculomotor apraxia 1 APTX 9p13
Ataxia telangiectasia ATM 11q22.3
Xeroderma Pigmentosum A XPA 9q22.3
Degenerative ataxias
Infantile onset spinocerebellar ataxia C10orf2 10q22.3-q24.1
Charlevoix-Saguenay spastic ataxia SACS 13q12
Friedreich’s ataxia FXN 9q13
Marinesco-Sjögren syndrome SIL1 5q32
1.5.1 Genetic heterogeneity
This form of ataxia is first described by Tan in a large consanguineous family in
Turkey.[28] Since then multiple consanguineous families with CAMRQ syndrome
with autosomal recessive inheritance have been reported. Genetic analysis revealed a
genetically heterogeneous condition (Figure 1.3).
The first locus of CAMRQ was mapped on the locus 17p13 and a missense
mutation was reported on WDR81 (WD repeat domain 81) [CAMRQ2; MIM: 610185;
also referred to as Uner Tan syndrome].[29-31] VLDLR (very low-density lipoprotein
receptor) is the first gene identified as a cause of CAMRQ syndrome [CAMRQ1;

12
MIM: 224050] by using linkage mapping followed by candidate gene sequencing.[31-
34] Furthermore, CA8 (Carbonic anhydrase VIII) gene [CAMRQ3; MIM: 613227]
identified in another consanguineous family using the same methodology.[35]
1.5.1.1 Very low-density lipoprotein receptor
VLDLR has a role in the neural positioning in the cortical brain and neuronal migration
by forming complex with reelin (RELN), apolipoprotein E receptor 2 (APOER2), and
the adaptor protein, disabled, drosophila, homolog of 1 (DAB1) [36], which regulates
Purkinje cell alignment in the cerebellum.[37] RELN is responsible for Lissencephaly
2 which is associated with cerebellum, hippocampus, and brainstem abnormalities
[LIS2; MIM: 257320].[38] Mice knock-outs of reelin represent ataxic gait and
trembling [38], whereas mice knock-outs of VLDLR appear normal with small
cerebellum.[36]
In humans VLDR is first identified in the North American Hutterite population
as a cause of Disequilibrium syndrome [DES-H, MIM: 224050] with truncal ataxia,
mental retardation, delayed ambulation, and cerebral gyral simplification (Table
1.2).[39] However, none of the disequilibrium syndromes including DES-H have been
characterized with quadrupedal gait in the literature.[32] VLDLR is the first gene
reported by our group as responsible for CAMRQ1 with quadrupedal locomotion in
two unrelated consanguineous Turkish families. During the course, two additional
families with CAMRQ1 with VLDLR mutation identified (Figure 1.3).
Family A is a consanguineous family from southeastern Turkey with seven
affected individuals (Figure 1.4) and Family D is another consanguineous family from
western Turkey with three affected individuals (Figure 1.5).[32, 40] Family A and D
have distinct clinical characteristics (Table 1.2). Genome wide linkage analysis in the
family linked the disease locus at chromosomal locus 9p24.2. Following candidate
gene sequencing identified a nonsense mutation (p.R257X) and a single nucleotide
deletion (c.2339delT) in VLDLR gene in Family A and D, respectively.[32]

13
Figure 1.3: Genetic heterogeneity in CAMRQ. Four different loci identified in seven
families with CAMRQ, so far. The candidate gene research furthers for two more
families (represented on top). The genes carrying the causal mutations were shown at
the bottom.

14
Table 1.2: Clinical characteristics of the families with VLDLR deficiency
Family A Family D DES-H
Locus 9p24 9p24 9p24
Gene VLDLR VLDLR VLDLR
Gait Quadrupedal Quadrupedal Bipedal
Mental retardation Profound Profound Moderate to profound
Inferior cerebellum Hypoplasia Hypoplasia Hypoplasia
Hypotonia Absent Absent Present
Speech Dysarthric Dysarthric Dysarthric
Corpus callosum Normal Normal Normal
Barany caloric nystagmus Normal Not done Not done
Tremor Very Present Absent
Cortical gyri Mild simplification Mild simplification Mild simplification
Ambulation Delayed Delayed Delayed
Inferior vermis Absent Absent Absent
Seizures Very rare Absent Various degree
Strabismus Present Present Present
Truncal ataxia Severe Severe Severe
Upper extremity reflexes Vivid Vivid Vivid
Lower leg reflexes Hyperactive Hyperactive Hyperactive
Pes-planus Present Present Present
Furthermore, in recent studies, VLDLR was found to be associated with very
similar phenotypes. Another consanguineous family from Iran with eight affected
individuals with a homozygous truncating mutation in the VLDLR gene (p.R448X)
represents a phenotype with cerebellar ataxia, disturbed equilibrium, strabismus, and
short stature.[33] In addition, a 21-kb long homozygous deletion in the VLDR gene is
reported in unrelated consanguineous Turkish family with two affected sibs who had
delayed psychomotor development, cerebellar atrophy, speech delay, severely ataxic
bipedal gait, dysarthria, dysmetria, dysdiadochokinesis, and hyperreflexia.[34]

15
Figure 1.4: Pedigree of the Family A. Seven individuals in the consanguineous Turkish
family are affected by CAMRQ1.
Figure 1.5: Pedigree of the Family D. Three individuals in the consanguineous Turkish
family are affected by CAMRQ1.

16
1.5.1.2 Carbonic anhydrase VIII
CA8 gene encodes carbonic anhydrase VIII which binds to inositol 1,4,5-triphosphate
(IP3) receptor, type 1 (ITPR1). Mutations in the ITPR1 is responsible for autosomal
dominant spinocerebellar ataxia 15 [SCA15; MIM 606658] in humans.[41] CA8
inhibits binding of IP3 to ITPR1 which inhibits calcium release from the endoplasmic
reticulum.[42] Mice deficient with both Ip3r1 and Ca8 represents ataxia but not
cerebellar atrophy.[43]
In humans, homozygous mutation (S100P) in CA8 gene detected by genome-
wide linkage analysis and following candidate gene sequencing reported as the cause
of CAMRQ3 in a consanguineous Iraqi family with four affected sibs. All of the
patients represent quadrupedal gait, ataxia and mild mental retardation.[35] Another
missense mutation in CA8 was detected by using homozygosity mapping followed by
exon sequencing in an unrelated consanguineous family with CAMRQ3 in four
affected individuals.[44]
1.5.1.3 WD repeat domain 81
Family B is the first consanguineous family in the literature with quadrupedal gait
(Figure 1.6). The family lives in the southeastern Turkey and consists of six affected
sibs with cerebellar hypoplasia, dysarthric speech, mental retardation, truncal ataxia
and quadrupedal locomotion (Table 1.3).[28]
The disease locus was mapped to chromosomal region 17p13 by linkage
analysis [32]. Homozygosity mapping of the affected individuals broaden the region
and following targeted next generation sequencing revealed a homozygous missense
mutation (p.P856L) at WDR81 gene segregated with the autosomal recessive
inheritance of the family.[29] The analysis of multiple brain regions of the affected
individuals using Magnetic Resonance Imaging (MRI) revealed cerebellar atrophy and
abnormalities in corpus callosum, precentral gyrus, and Brodmann areas.[29]

17
Figure 1.6: Pedigree of the Family B. Six of the 19 sibs of a first cousin marriage are
affected by CAMRQ2.
WDR81 was a predicted uncharacterized gene with unknown function. In a
very recent study, Gulsuner et al. (2011) stated that the WDR81 encodes a
uncharacterized protein which is predicted to be a membrane-spaning transmembrane
protein with six domains.[29] WDR81 expression is analyzed in different parts of the
brain regions and the highest level of expression is detected in the cerebellum and
corpus callosum. Analysis of the expression profiles of the mouse embryos using
published expression datasets revealed that mouse Wdr81 is detected at the Purkinje
cells in the cerebellum. Functional clustering analysis of the genes which are
coexpressed with the Wdr81 revealed that these genes are especieally enriched in
neurodevelopmental processes including neuronal differentiation, axonogenesis, and
cell morphogenesis.[29] This suggested a role of WDR81 in nervous system
development.

18
Table 1.3: Clinical characteristics of the family with WDR81 deficiency.
Family B
Locus 17p13
Gene WDR81
Gait Quadrupedal
Mental retardation Severe to profound
Inferior cerebellum Hypoplasia
Hypotonia Absent
Speech Dysarthric
Corpus callosum Reduced
Ambulation Delayed
Truncal ataxia Severe
Upper extremity reflexes Vivid
Tremor rare
Pes-planus Present
Strabismus Present
Seizures Rare
Barany caloric nystagmus Cvs defect
Lower leg reflexes Hyperactive
Inferior vermis Absent
Cortical gyri Mild simplification
1.6 Gene Identification in Mendelian Disorders
The human genome consists of thousands of genes and finding a particular gene
responsible for a given phenotype is literally defined as “needles in stacks of
needles”.[45] Traditionally, disease gene identification begins with family-based
linkage analysis. However, this analysis has difficulties in identifying disease causing
de novo mutations. This problem was overcome with the development of high-
resolution microarrays for Genome-Wide Association (GWAS) and Next Generation
Sequencing (NGS) technologies and as a consequence, family-based linkage studies
in Mendelian disorders have become the focus of genetic studies.[46]

19
Over the past decade, association studies in large cohorts with cases and
controls using genome-wide single nucleotide polymorphism (SNP) microarrays were
used to identify common risk factors in common diseases. However, association
studies had weaknesses in identifying rare disease causing mutations through linkage
disequilibrium (LD) with common SNPs.[47] Family-based linkage analysis using
genome-wide SNP microarrays made it possible to identify genetic loci that
encompass the rare variants. This approach using genome-wide SNP microarrays also
contributed to overcome population stratification and heterogeneity problems.[48]
Thus, combination of next generation sequencing technology with family-based
linkage analysis become the most powerful and robust approach to identify disease
causing rare variants (Figure 1.7).[49]
1.6.1 Genetic mapping in autosomal recessive disorders
Identification of familial disorder with autosomal recessive inheritance pattern is the
first step in understanding the pathobiological events and certain pathways underlying
the disease. The most commonly used method to map the disease causing loci in
autosomal recessive case is the linkage analysis. Linkage analysis is suitable when a
family with multiple generations including multiple affected and unaffected
individuals is found. Under these circumstances, the disease loci can be detected by
genotyping certain markers, which are genetically variable, in the family.[50]
However, the disease locus identification is not this simple in every case. The
most important limitation is the number of the genetic markers surrounding the locus,
which is recently overcome with the use of high-throughput genome-wide SNP
genotyping arrays. With the use of this technology thousands to millions of SNPs can
be genotyped in many individuals at one step. The disease causing locus can be
identified by determining which alleles were present only in affected individuals in
large families.[49]

20
Figure 1.7: Schematic representation of the gene identification in Mendelian diseases.
The methods used to identify the causal genes responsible for autosomal recessive
disorders are represented. In this study homozygosity mapping and next generation
sequencing is used to identify disease causing genes.

21
Most often families with multiple affected and unaffected individuals can not
be obtained so mapping of gene locus involved in rare autosomal recessive disorders
would be a difficult task. In such cases, homozygosity mapping analysis using
genome-wide SNP arrays is the best way to identify disease locus. Homozygosity
mapping is the detection of the regions which would probably be homozygous only in
patients because of the presence of the homozygous mutation inherited from each
parent (Figure 1.8). One of the overlapping homozygous blocks in the genomes of the
each patient should contain the disease causing mutation. This procedure can give
information in families with two or three affected individuals from the same
kindred.[51] These homozygous intervals can be searched for disease causing gene by
conventional Sanger sequencing.
The rate limiting step of the identification of the disease causing gene using
homozygosity mapping is the total length of the intervals determined by the analysis.
These regions can be several megabases long and can contain several genes. At these
circumstances Sanger sequencing of the entire genes would be time consuming and
expensive. Bioinformatics approaches try to prioritize the candidate genes at the
intervals by their probability of involvement in a disease phenotype using functional
predictions and online databases. However, this is not applicable when the functional
information or characterization of a protein is absent or hypothetical genes present at
the locus. With the advent of targeted capture of the determined homozygous regions
and next generation sequencing technology, it is now possible to search the regions at
single nucleotide resolution.[52-54]
1.6.2 Consanguinity
Homozygosity mapping is an efficient method when searching for a mutation
segregating within a small and closed population with a small gene pool due to founder
effect. In such a population the mutation would probably come from each carrier parent
by segregating on the same haplotype. Co-efficiency of inbreeding increases with the

22
Figure 1.8: Homozygosity mapping of recessive disease genes. Rare mutations can be
identified in autosomal recessive disorders in consanguineous families based on the
fact that, the disease locus will not have tendency to recombine and will be identical
by decent. So it is likely that these regions contain the disease gene.

23
level of consanguinity. Thus, homozygosity mapping is the most robust technique in
consanguineous families with autosomal recessive disorders.
Homozygosity mapping method depends on the fact that the regions adjacent
to the disease causing mutation will be identical in affected individuals coming from
a common ancestor in an inbred family. Percentage of homozygous regions, also called
as inbreeding coefficient, of the siblings in consanguineous families, differs from 0.4
to 12.5% depending on the degree of consanguinity.[55]
At the randomly mated populations the occurrence of a recessive disease is
proportional to the square of disease allele frequency. The rate of consanguineous
marriages increases in the southern and eastern rims of the Mediterranean basin
(Figure 1.9). In some regions such as Saudi Arabia and Pakistan, the consanguinity
rate reaches to 50% of the population. At such regions the occurrence of the recessive
diseases is directly proportional to the disease allele frequency.[56]
1.6.3 Genetic heterogeneity
A Mendelian genetic disorder caused by more than a single gene or allele is defined as
genetically heterogeneous. The increased usage of the next generation sequencing
technologies revealed that Mendelian disorders with genetic heterogeneity is far
greater than expected.[57]
As a result of next generation sequencing experiments, millions of variants
with no phenotypic effect were identified whereas individually rare mutations with
deleterious effect were at very small proportional. These rare deleterious mutations
were implicated in several genetically heterogeneous Mendelian disorders and also in
common diseases such as breast cancer [58], inherited hearing loss [59], autism and
schizophrenia.[60, 61]

24
Figure 1.9: Prevalence of the consanguineous marriages in the world. Consanguinity
increases at the southern and eastern rims of the Mediterranean basin. (Copyright ©
2009, National Academy of Sciences. From Bittles et al., 2010 with permission]
1.6.4 Targeted next generation sequencing
Disease gene identification studies in consanguineous families with genetically
heterogeneous autosomal recessive diseases were greatly improved with the combined
use of homozygosity mapping, target-enrichment, and next generation sequencing.
Such a sequencing reaction could generate thousands of genetic variations including
structural variations, single nucleotide variants (SNVs), and small insertions or
deletions (indels). More than 95% of these variants would be phenotypically neutral
and identified in healthy populations. The critical point here is the identification of
the causal mutation among the remaining suspicious variants.[45, 62]

25
The identification of the recessive causal mutation involves several steps
depending on the exclusion of the irrelevant variants. As a first step, novel variants
should be identified by discrete filtering of the variants against a set of polymorphisms
with minor allele frequencies higher than 0.1% using databases or datasets such as
NCBI dbSNP, 1000 Genomes Project, and NHLBI GO Exome Sequencing Project.
The next step would be stratification of the candidate variants on the basis of their
positional and functional impacts by coding (frameshift, stop codon, splice site,
missense, silence) or noncoding (intronic, intergenic, UTR). Protein altering variants
that reside at the exons, regulatory regions and canonical splice sites should be selected
for further analysis. The most important step here is the filtering of the variants which
are not segregated with the disease phenotype in the family. Population screening
would be last filtering step of the novel homozygous protein altering variants. The
remaining variants can be annotated using the computational approaches such as
evolution-based conservation analysis as the measure of deleteriousness, constraint-
based prediction analysis concerning the effect of variation on the protein-coding
sequence and analysis of the curated databases.[45, 62]
As a result of sequencing data annotation, the most likely culprit disease
causing mutation is identified. Experimental analysis would provide a support of
causality for the given phenotype. The most powerful approach is the identification of
the same or different mutations in the same gene in different families or unrelated
sporadic cases. However, the phenotype and/or the mutation would be extremely rare
in some recessive cases. In such cases, molecular consequences of the causal mutation
could be evaluated in vitro or the phenotypic consequences of the causal mutation
could be evaluated in vivo in a model organism.
1.6.5 Identification of the causal mutation in CAMRQ
In this thesis, identification of a novel missense causal mutation in a consanguineous
Turkish family with a genetically heterogeneous autosomal recessive disorder,
Cerebellar Ataxia, Mental Retardation, and disequilibrium syndrome with or without

26
quadrupedal locomotion (CAMRQ), by using homozygosity mapping followed by
target enrichment and next generation sequencing will be discussed.
1.7 Subject and outline of the Thesis
CAMRQ syndrome is observed in another consanguineous family (Family C) from
southern Turkey with four affected individuals in three branches of the pedigree
(Figure 1.3, Figure 3.1, and Table 3.1).[32, 63]
The involvement of previously identified CAMRQ genes VLDLR, WDR81 and
CA8 genes were excluded by using Sanger sequencing and homozygosity analysis.
Homozygosity mapping analysis revealed four shared homozygous regions on
chromosomes 13, 19 and 20 (Table 3.2). In order to identify the culprit gene, all
homozygous regions were sequenced using target enrichment followed by next-
generation sequencing and all segregated variants were evaluated using structural and
functional predictions, and population screening (Table 3.19). In this thesis, the story
behind the identification of a missense mutation in ATP8A2, encoding a P4-type
transmembrane protein ATPase, aminophospholipid transporter, class I, type 8A,
member 2, which is found to be associated with the phenotype in Family C is
described.[64]

27
Chapter 2
Materials and Methods
2.1 Recruitment of Patients and Controls
A consanguineous family from southern Turkey, Family C, in which four individuals
had CAMRQ syndrome, was investigated (Figure 3.1). The only affected female in the
family was withdrawn form the study since her parents did not give consent for
publishing the DNA analysis results. The index patient of the study, coded as 05-993,
recently died secondary to a respiratory infection. The study was approved by the
institutional review boards (IRB) at the Cukurova and Baskent Universities (decision
21/3, 08.11.2005 and KA07/47, 02.04.2007, respectively).
A total of 605 healthy individuals with no family history of movement
disorders were used as a control in the study. Two additional cohorts including patients
with similar neurological phenotypes were used in the study to find another patient
with the candidate mutation: A cohort of 58 patients with cerebellar phenotypes with
or without quadrupedal locomotion and a cohort of 750 patients with degenerative

28
neurological disorders or structural cortical malformations. All the participants and/or
their parents were asked to sign an informed consent form prior to the study.
2.2 Clinical Investigations
Clinical investigations were performed at Cukurova University while the patients were
awake and the clinical description of the family was published elsewhere. [63] All
clinical investigations performed were compatible with the Helsinki Declaration
(http://www.wma.net).
The “Mini Mental State Examination” (MMSE) test is performed in order to
measure mental statuses of the individuals. It measures five cognitive function:
language, registration, orientation, recall, and attention/calculation. A score of 23 or
lower out of 30 reveals a cognitive problem with varying degrees.[65] Standardized
Turkish version of the MMSE test was used for the three of the four patients.[66]
Cranial MRI and full-body computed tomography (CT) screening studies were
performed at Cukurova University, Medical Faculty, Adana, Turkey.
2.3 DNA Isolation from the Family Members
Peripheral blood samples obtained from the patients and their parents by a specialist
using venipuncture technique. 10 ml venous blood samples were collected in K3-
EDTA containing BD Vacutainer® Blood Collection tubes (Becton Drive, NJ, USA).
The tubes were transferred to the laboratory at cold chains, quickly divided into 1 ml
aliquots in 1.5 ml eppendorf tubes, and stored at -80oC refrigerators.
DNA isolation was performed with 200 µl peripheral blood samples using
Nucleospin® Blood kit (Macherey-Nagel Inc., PA, USA) according to protocols

29
manufacturers supplied. A second DNA isolation from patients (05-993, 05-994, and
05-996) were carried out using Phenol-Chloroform DNA extraction method [67] to
obtain genomic DNA with high quality and high quantity which is necessary for high-
throughput genotyping and sequencing reactions.
The quantities and qualities of the samples were measured by densitometry
analysis using horizontal 1% gel electrophoresis, by spectrophotometric reading using
NanoDropTM ND-1000 Spectrophotometer (NanoDrop Technologies, Inc., DE, USA),
and by fluorometric quantification using PicoGreen® assay.[68]
2.4 Genetic Mapping Techniques
2.4.1 Genome-wide SNP Genotyping
DNA from peripheral blood samples of four patients and their three obligate carrier
parents and two siblings were genotyped using the GeneChip® Human Mapping
Affymetrix 10K Xba arrays (Affymetrix, Inc., CA, USA) for haplotype construction.
SNP genotyping experiments were performed according to the manufacturer's protocol
(Affymetrix, Inc., CA, USA). Briefly, 250 nanogram of DNA was digested with XbaI
and the fragmented DNA was ligated to the XbaI adaptor. PCR amplification of the
fragments carried out using AmpliTaq Gold (Applied Biosystems, CA, USA) enzyme
following by array hybridization. Affymetrix GTYPE v4.1 software (Affymetrix, Inc.,
CA, USA) was used to generate CEL files. Exploration, normalization, and retrieval
of genotype calls were achieved using Affymetrix Genotype Console Software v2.1
(Affymetrix, Inc., CA, USA) with the default parameters.
For homozygosity mapping analysis, three patients’ (05-993, 05-994, and 05-
996) DNA were genotyped by using GeneChip® Human Mapping Affymetrix 250K
NspI arrays as in the protocol that the manufacturer supplied (Affymetrix, Inc., CA,
USA). Briefly, 250 nanograms of DNA was digested using NspI restriction enzyme

30
followed by linker ligation, PCR amplification, fragmentation, labeling, and array
hybridization. Affymetrix GTYPE v4.1 software (Affymetrix, Inc., CA, USA) was
used to generate CEL files. Image data were normalized and genotypes were called
using Affymetrix Genotype Console Software v2.1 (Affymetrix, Inc., CA, USA) with
the default parameters using the BRLMM algorithm.
In addition, a higher resolution Illumina Human610-Quad BeadChip arrays
(Illumina, Inc., CA, USA) were used to genotype two affected individuals (05-994 and
05-996) in order to confirm homozygous regions detected by Affymetrix SNP array.
The experiments were performed according to manufacturer's instructions. Briefly,
200 nanogram of genomic DNA was whole-genome amplified, fragmented with FMS
reagent (Illumina, Inc., CA, USA), precipitated with 2-propanol and resuspended in
RA1 hybridization buffer supplied by the manufacturer (Illumina, Inc., CA, USA).
After overnight hybridization, the arrays were subjected to single-base extension,
labeling, and coating with XC4 (Illumina, Inc., CA, USA). The image data were
obtained by Illumina Bead Array Reader (Illumina, Inc., CA, USA). Normalization of
the image data and genotype calling were achieved using Bead Studio software
(Illumina, Inc., CA, USA) with the default parameters.
2.4.2 Homozygosity mapping analysis and haplotype construction
Homozygosity mapping is used to identify the locus containing the gene underlying
recessive diseases. It is based on enrichment of homozygosity in the region harboring
the disease causing gene in the affected individuals in a family.[51] Advances in high
throughput SNP genotyping made this technique crucial in the identification of the
disease causing recessive locus.
Processing and analysis of the Affymetrix and Illimuna SNP genotyping data
was carried out using web-based HomozygosityMapper software [69] to identify
homozygous regions. Homozygosity mapping using the Affymetrix 250K SNP arrays
was performed in the three affected patients. According to array data sheet supplied

31
by the manufacturer, these arrays capable of genotyping a total of 262,264 SNPs with
a median physical distance of 5.0 Kb and an average distance of 11.0 Kb between
SNPs. The average heterozygosity of these SNPs is 0.30.
Homozygosity mapping analysis was repeated using Illimuna SNP array which
has the genomic coverage of 620,901 SNPs. This provide marker spacing down to 1.5
Kb (median physical distance: 2.7 Kb, average distance: 4.7 Kb according to data sheet
provided by the manufacturer) with a mean heterozygosity rate of 0.22. This analysis
with relatively low average heterozygosity and high density of SNP chips excluded the
previously detected homozygous blocks with a length of 0.01 and 1.4 cM. The
contiguous homozygous blocks detected by Affymetrix SNP array on chromosomes
13 and 19 were evaluated as a single block in Illimuna array most probably due to high
false positive rate of Affymetrix SNP data.
Haplotype blocks were analyzed by hand for each homozygous blocks
including flanking regions detected by Illimuna SNP array data, separately using
Affymetrix 10K SNP data. One affected individual (05-999), her sibling (05-1000),
and her obligate carrier parents (05-997 and 05-998) leaved from the study by request.
Linkage analysis is a powerful technique to identify critical region segregating with
the disease. However, a meaningful LOD scores can be obtained in a large informative
families. Therefore, haplotypes constructed were used for segregation of variants
detected.
In order to saturate the homozygosity of the most likely candidate locus, 13q12,
polymorphic microsatellite markers, also known as short tandem repeats (STRs), were
genotyped by appropriate primers (see Appendix A). The selected STR markers
D13S787, D13S1243, D13S742, D13S283, D13S1294, and D13S221 were
determined using “Simple Repeats” tract of UCSC Genome Browser database (human
reference genome NCBI36/hg18).

32
2.5 The Candidate Gene Approach
2.5.1 Selecting a candidate gene
Homozygosity mapping is a powerful technique to identify disease locus without any
information about the disease causing genes. Candidate gene approach allows
investigating genetic basis of the disorder. Selecting the appropriate candidate gene
focus on the etiological role of the genes in disease, by understanding of the underlying
biological pathway.[70]
The candidate disease loci identified by homozygosity mapping could contain
several genes. In such a situation, the candidate genes can be identified by several
methods, including database search, prediction analysis using bioinformatics tools, or
expression analysis.
After detecting the shared regions, the genes involved in the homozygous
blocks were extracted using web based Ensembl BioMart data mining tool. By using
BioMart several information from several databases about the corresponding genes
can be obtained such as chromosome names, gene loci, chromosomal bands, transcript
counts, gene biotypes, gene statuses, gene ontology (GO) functions, Mendelian
Inheritance of Man (MIM) associations, associated diseases, protein family domains,
expression profiles, and gene functions.
As a next step, corresponding genes on the homozygous blocks were prioritized
using computational prediction tools. The GeneWanderer is a web-based tool which
measures the probability by comparing the relative positions of each candidate genes
to genes known to be involved in the disease pathogenesis by using protein-protein
interactions.[71]

33
2.5.2 Testing the Candidate Gene
2.5.2.1 Determination of the coding regions of the candidate genes
Coding regions of the selected candidate genes were determined using Ensembl
database (according to the human reference assembly GRCh37) and the corresponding
sequences with the flanking regions were extracted by using the BioMart data mining
tool of the Ensembl database.
2.5.2.2 Primer design and quality
Appropriate primers (Appendix A) were designed for sequencing coding exons, exon-
intron boundaries, untranslated regions (UTRs) using web-based Primer3 (v. 0.4.0)
software.[72] In order to verify 3’ and 5’ self-complementarity, internal hairpin
structures, and Tm differences, In-Slico PCR tool of the UCSC Genome Browser
(http://genome.ucsc.edu/cgi-bin/hgPcr) was used. Also, primers were analyzed using
BLAT tool of UCSC Genome Browser (http://genome.ucsc.edu/cgi-bin/hgBlat) to
check assembly to the entire genome. The primers were purchased from IONTEK, Inc.
(Istanbul, Turkey).
2.5.2.3 Amplification of the coding regions
The coding regions were amplified by conventional PCR technique in TechneTM TC-
512 thermal cycler (Bibby Scientific, Inc., UK) with the following template conditions:
initial denaturation step at 95oC for five minutes, followed by 35 cycles of denaturation
(95oC for 30 seconds), annealing (60oC for 30 seconds) and elongation (72oC for 30
seconds), and final elongation for five minutes at 72 oC. The template PCR conditions
were optimized according to the GC-content of the amplified region and/or low-or-
high melting temperatures (Tm) of the primers by increasing or decreasing the
annealing temperatures.

34
PCR reactions were carried out in a total volume of 25 μL with the following
ingredients: 75-150 ng of template DNA samples, 1X Taq polymerase buffer, 10 pmol
of each primer, 0.2 mM dNTP, 1.0 mM MgCl2, and 1.25 unit Taq polymerase enzyme
(MBI Fermentas, NY, USA). The template PCR cocktail were optimized when the
GC-content of the targeted region is higher than 55% by addition of the BSA or
DMSO, which help to dissolve secondary structure of DNA. Additional optimization
is achieved by increasing or decreasing the amount of MgCl2 and/or primers when
unwanted fragments obtained.
2.5.2.3 Visualization of the PCR products
It is necessary to check suitable PCR amplification which should contain a single PCR
fragment prior to sequencing. PCR products were run in the 1% agarose gel (Basica
LE, EU) which was completely dissolved in 1X TAE buffer. As a fluorescence tag, 30
ng/ml ethidium bromide (EtBr) was added to the agarose gel. PCR products were
mixed with 6X loading dye (MBI Fermentas, NY, USA) and loaded onto agarose gel.
The PCR products were run horizontally at the magnetic field (90-120 Volts)
for 25-40 minutes according to the size of the products at room temperature. pUC Mix
Marker 8 and Mass Ruler DNA Ladder (MBI Fermentas, NY, USA) were used as
DNA markers (Figure 2.1). PCR products were visualized using GelDoc imaging
system (Bio-Rad, CA, USA) and the images were captured by MultiAnalyst software
version 1.1 (Bio-Rad, CA, USA).
2.5.2.4 Sequencing of the candidate genes
The PCR products were sequenced using conventional automated Sanger method. The
sequencing reactions were carried out by Refgen, Inc., (Ankara, Turkey) using ABI
3130 XL capillary sequencing instrument (Applied Biosystems, Inc., CA, USA). The
purification of the PCR products was also carried out by the company using
MinEluteTM 96 UF PCR Purification Kit (Qiagen, MD, USA).

35
2.5.2.5 Visualization and analysis of the sequencing data
As a result of Sanger sequencing, raw sequence data files were obtained in the AB1
sequence trace format. Each sequence trace file was aligned to the corresponding
reference sequence extracted from NCBI database and analyzed by using CLCBio
Main Workbench 6 software (CLC bio, Denmark) with the default parameters. The
possible variations found were searched in the NCBI SNP database.
Figure 2.1: DNA Markers used in the study. MassRuler DNA Ladder: 10 µL per lane,
1% agarose gel, 1X TAE 7 V/cm, 45 minutes. pUC Mix Marker 8: 0.5 µg per lane,
1.7% agarose gel, 1X TBE, 5 V/cm, 1.5 hours (http://www.fermentas.com/en/support/
printed-media).

36
2.6 Targeted next generation sequencing analysis
Since 2007, several next generation sequencing technologies such as Roche 454,
Illumina Genome Analyzer (GA), and ABI SOLiD have emerged and improved. Since
the disease loci identified contains many genes, targeted next generation sequencing
of these candidate intervals determined by homozygosity mapping would be the best
option because of its advantages on focus time, expenses, and data storage. In order
the identify disease causing mutation, Illimuna GA platform was used to sequence the
targeted region in an affected individual (05-996). The sequencing procedure involves
several steps which were summarized in Figure 2.2.
2.6.1 Probe and Chip design
Target enrichment method allows that selected regions were enriched in the genomic
DNA library. The homozygous regions were analyzed using UCSC Genome Browser
and as a result, 45,181 unique probes on chromosomes 13, 19, and 20 with a total
length of 16,711,445 base pairs were designed. The designed probes were reanalyzed
by using Sequence Search and Alignment Hashing Algorithm (SSAHA) software [73]
with the less stringent parameters to determine uniqueness of the probes and efficiency
of mapping. SSAHA maps sequence reads to a reference genome using pair-wise
alignment.
Next, the probes then printed on a custom designed sequence capture
microarrays, Roche NimbleGen Human Sequence Capture HD2 2.1M (Roche,
Madison, USA), which is an ideal solution for targeted enrichment of the human
disease associated regions. These high density microarrays constitudes 2.1 million
long oligonucleotide probes with more than 60-bp single-probes. The manufactured
arrays targeted an extended region of 16,756,626 base pairs.

37
Figure 2.2: Schematic representation of the next generation sequencing and analysis
algorithm. Software packages and databases used were given at the bottom of boxes.

38
2.6.2 Single-end library construction and sequence capture
DNA sample from an affected individual (05-996) was captured using the custom
designed Nimblegen Human Sequence Capture HD2 2.1 M microarrays (Roche
NimbleGen, WI, USA) according to the protocol supplied by the manufacturer (Roche
NimbleGen, WI, USA) with modifications at the W. M. Keck Facility at Yale
University. This process includes fragmentation of the DNA sample, ligation of the
adapter sequences, and amplification of the produced DNA templates (Figure 2.3).
Briefly, genomic DNA was sheared randomly into fragments by sonication and
the GS FLX Titanium adaptors were ligated to these fragments. The verification of the
sizes of the adaptor-ligated templates was carried out by agarose gel electrophoresis.
The DNA sample was extracted from the gel and amplified by ligation-mediated PCR
with the universal primers supplied. The PCR products were purified to avoid primer
dimers and then hybridized in the appropriate buffer supplied to the capture array at
42.0°C. Washing steps repeated two times at 47.5 °C and three more times at room
temperature. The fragments which are bound to designed probes on the chip were
eluted using 125 mM NaOH solution. These fragments amplified again by ligation-
mediated PCR. The amplified fragments are purified one more time and ready for
sequencing. Captured DNA samples were sequenced by Illumina Genome Analyser
IIx platform (Illimuna, CA, USA) as single-end 74- and 75-base pair reads. For
additional information, see manufacturer's manual (http://www. nimblegen.com/
products/seqcap/arrays/2.1m/).
2.6.3 Analysis of the targeted NGS data
Next generation sequencing results in huge data which requires several steps for
annotation. These steps include quality control filtering, alignment to reference
sequences, variant calling and annotation. In order to achieve these steps several
commercial and non-commercial pipelines generated.
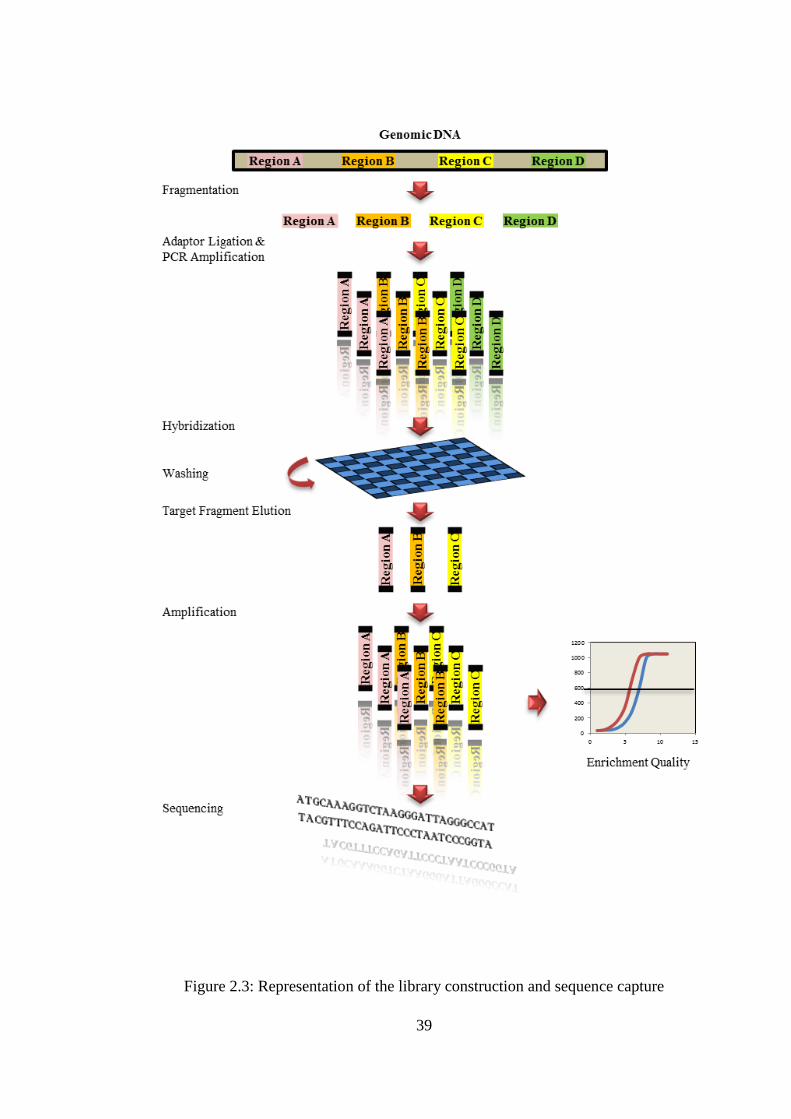
39
Figure 2.3: Representation of the library construction and sequence capture

40
2.6.3.1 Alignment and read mapping
Illumina sequence data were mapped to reference genome (human reference genome
NCBI36 / hg18) using Mapping and assembly with qualities (Maq) [74] and Burrows-
Wheeler Aligner (BWA) [75] software packages.
Maq is suitable for alignment of the single-end short reads (<200 bp) to a
reference genome in order to detect SNVs. The software is able to index all the reads
with up to 2 or 3 mismatches by using ungapped alignment. While assembling the
reads on the reference, Maq calls the heterozygote and homozygote bases by
maximizing the posterior and phred qualities at each position. The manufacturer’s
protocol involving detailed description, Maq codes and commands, and examples can
be downloaded from http://maq.sourceforge.net/maq-manpage.shtml.
BWA is suitable for relatively short sequences to a reference genome by using
a gapped Burrows-Wheeler Transform (BWT) algorithm in order to detect short indels.
This algorithm can be used to map short queries up to 200bp with error rate lower than
3%. The manufacturer’s protocol involving detailed description, BWA codes and
commands, and examples can be downloaded from http://bio-bwa.Sourceforge.net/
bwa.shtml.
2.6.3.2 Genotype and variant calling
Alignment data obtained by using BWA and Maq was used for SNV and short indel
calling, respectively. Variant detection and analysis were carried out using Sequence
Alignment/Map Tools (SAMtools) software package.[76] SAMtools has ability to
sort, merge, and index reads retrieved from Maq and BWA tools and generate a pile
up of read bases. The detected homozygous and heterozygous variants were generated
as variant calling output format which can be annotated using other resources.
Genotype calling is performed by using default cut-off rules such as an average
Phred-type quality score of 20, a minimum read number of 2, a minimum coverage of

41
8, a minimum variation frequency of 0.01, and a minimum error rate of 0.01. All cut-
off values were set to zero while doing analysis, in order to obtain all possible SNVs
and indels. Phred quality scores can be obtained from the image data with the formula
“QPhred = -10log10P (error rate)”. [77] Note that, 1% error rate is equal to a Phred score
of 20.
Variant coordinates were converted to the updated human genome assembly
GRCh37/hg19 by using Batch Coordinate Conversion tool (liftOver) of UCSC
Genome Browser (http://genome.ucsc.edu/cgi-bin/hgLiftOver). Read mapping and
genotype calling analysis were repeated with the converted coordinates.
2.6.3.3 Fold enrichment and coverage analysis
The fold enrichment factor explains the total count of reads on each individual base
pair. The analysis carried out using pileup module of SAMtools. The fold enrichment
was calculated by dividing the mean number of covered bases to mean number of
excluded bases.[78] Base coverage is the mean number of how many times of each
base at the targeted region was read. Coverage calculations were evaluated using the
mpileup module of SAMtools and coverage calculation of the coding regions were
evaluated with intersectBED command of the BEDtools software packages.[79]
Samtools mpileup module provides information of alignment coverage across
the targeted region by calculating mean of the read depths of each base in the multiple
alignments. The called bases were classified as zero-covered bases for the ones with
<1X mean read depth, low-coverage bases for the ones with 1-3X mean read depth,
and high-covered bases for the ones with ≥4X mean read depth. The average coverage
percentage values were calculated for each.
BEDtools utilities have ability to evaluate overlapping features and coverage
calculations. In order to determine zero-covered, low-covered, and high-covered bases
which were located in the coding regions, sequencing data files were intersected with

42
the exome data (genome assembly NCBI36/hg18, exome_B_NCBI36.bed, created
from HAVANA & ENSEMBL data on 2008, downloaded from ftp://ftp.sanger.ac.uk/
pub/fsk/exome/) and the evolutionary conserved protein-coding exons (genome
assembly GRCh17/hg19, Exoniphy, downloaded from UCSC Genome Browser Genes
and Gene Prediction tracts). A total statistics indicating the coverage percentages of
each region was calculated. Using the start-end coordinates of the coding regions and
the constitutive exons, zero- and low-covered regions were annotated.
The exoniphy program determines the constitutive exons which are
evolutionarily conserved across species by multiple alignments of the coding regions
using a phylogenetic hidden Markov model.[80] Constitutive exon coverage was
calculated using BEDtools and non-covered (low- and zero-covered) constitutive
exons were determined. The genes corresponding to the non-covered constitutive
exons were extracted from Ensembl BioMart database and evaluated by the same tool
according to expression profiles, mice knock-out studies, or involvement in a
phenotype.
Zero- and low-coverage regions were further analyzed visually by using
Integrative Genomics Viewer (IGV) platform.[81] IGV allows interactive exploration
of the genomic datasets.
2.6.3.4 Genotype calling error analysis
A Mendelian error describes a wrong allele inherited from none of the parents.
Mendelian errors were calculated and evaluated using PLINK Whole Genome
Association Analysis Toolset.[82]
PLINK has ability to analyze, visualize and annotate genotype/phenotype data.
The annotation includes management of the data (merge, intersect, flip files, and
extract subsets), summary statics (allele and genotype frequencies, missing genotype
rates), and population stratification (linkage, significance, association, CNV, and
haplotype analyses).

43
Mendelian error rates calculated by comparing SNP genotypes obtained from
Illumina Human610-Quad BeadChip array and targeted next generation sequencing
data obtained from NimbleGen Human Sequence Capture HD2 2.1 M microarrays
using “Mendel” module of the PLINK software package.
2.6.3.5 Positional and functional annotation of the variants
The next step of the analysis of variants determined at the targeted region is the
positional and functional annotation of the variants and determination of the novel
variants by filtering of the SNPs.
Annotation and filtering of the variants carried out using ANNOVAR software
package [83]. ANNOVAR software package has an ability to annotate genetic variants
detected from high-throughput sequencing data by performing gene-based, region-
based, and filter-based annotations. Functional annotations such as protein coding
alterations at the amino acid level can be detected using gene-based annotations. By
using region-based annotation positional specification, conservation across species,
segmental duplications, GWAS hits, OMIM hits and genomic variants can be
determined. Filter based-annotation is used to identify SNPs that are reported in NCBI
dbSNP database, 1000 genomes datasets, and NHBLI-EVS exome sequencing projects
datasets.
Conversion of the SAMtools variant calling output file into ANNOVAR
annotation input file can be achieved by using “convert2annovar” script. Annotation
of the variants using ANNOVAR can be achieved by either manually (for detailed
manual visit http://www.openbioinformatics.org/annovar/annovar_startup.html) or
automatically by using “summarize_annovar” script. This developed pipeline allows
annotation of the sequence data with steps on a cluster. The automated annotation
generates an excel file with gene annotation, exonic function, amino acid change and
its effect, conservation analysis and predictions, population screening, and SNP
identifiers (Figure 2.4).

44
Figure 2.4: Algorithm of the ANNOVAR annotation pipeline. Functional annotation
of the variants carried out using summarize_annovar script of the ANNOVAR
software package.

45
As a result, novel variants were determined by exclusion of the SNPs with
heterozygosity rates higher than 0.01 using dbSNP132 database. Novel homozygous
and heterozygous variants were classified according to their genomic location as
intronic, protein coding, intergenic, non-coding RNA, upstream, downstream, exonic
splicing, intronic splicing, 3’UTR, and 5’UTR. The protein coding variants then
classified according to their functional effects as frameshift insertion, frameshift
deletion, frameshift block substitution, stop-gain, stop-loss, nonframeshift insertion,
nonframeshift deletion, nonframeshift block substitution, nonsynonymous SNV,
synonymous SNV. Novel homozygous protein altering variants were considered as a
potential disease causing mutation.
2.6.3.6 File formats
Targeted next generation sequencing generates a huge data which should be annotated.
For functional annotation of the targeted next generation sequencing data several files
were generated in order to make them usable for the next annotation in the pipeline.
The raw data in the form of “.bcl” files were generated by sequencing of the
targeted region using Illumina Hiseq 2000 platform and converted to “.qseq” files
through the use of Illumina’s BCL converter tool to obtain “.fastq” files for further
analysis. The FASTQ format is a text-based file with the sequencing read data. FASTQ
files validated, indexed and aligned to the human reference genome in order to obtain
output files in the SAM format using the BWA tool which uses Burrows-Wheeler
Transform algorithm and Maq which uses ungapped algorithm. The “.sam” file is
designed to store nucleotide alignments. After the alignment is performed, “.sam” files
converted to the “.bam” files by SAMtools which are binary representations of the
reads. The “.bam” files than indexed and used to generate “.pileup” files which
includes additional tracks such as diversity and SNP by mpileup module of the
SAMtools. PILEUP file than converted to several formats such as VCF, IGV, and BED
for annotations and coverage analysis.

46
2.7 Identification of the disease causing mutation
Novel homozygous protein altering variants at the homozygous blocks determined by
combining Illimuna SNP array and targeted next generation sequencing data were
considered as potential disease causing mutation candidates. In order to find the
disease causing gene, the remaining candidate variants were subjected to exclusion
and the remaining variant was defined as the culprit mutation.
2.7.1 Population screening
2.7.1.1 Population datasets
Functional novel variants were further analyzed in two population datasets: 1000
genome datasets (http://www.1000genomes.org, data release, phase I) and NHLBI
Exome Sequencing Project (EVS) (http://evs.gs.washington.edu/EVS/, data release
ESP6500). Common variants were excluded if minor allele frequency (MAF) was
higher than 0.01.
1000 genomes, a deep catalog of the human genetic variation, project aimed to
determine SNPs in different populations by using next generation sequencing. The
pilot project composed of sequencing data of 2,500 healthy individuals in the “.vcf”
format which are available for researchers. The sequencing data was annotated with
1000 genome database by using tabix module of the SAMtools.
EVS database is a collaborating group project aims to discover novel genes in
non-neurological phenotypes such as lung, blood, and heart disorders by using next-
generation sequencing. The data release ESP6500 composed of 6503 samples. The
sequencing data can be analyzed individually for each variant on the project site or can
be annotated by ANNOVAR.

47
2.7.1.2 Alleles specific PCR analysis
Functional variants which had not been recognized by a restriction enzyme were
genotyped by allele specific PCR (AS-PCR) method in Turkish population in order to
exclude rare variants as disease causing mutation. The cohort consists of 305 random
healthy individuals and 300 region-match healthy controls which constitute a total of
1210 control chromosomes. The mutant and wild type primers, and also the reference
primer which is used as internal control designed by using web-based Primer3 software
and analyzed using In-Slico PCR and BLAT tools of UCSC Genome Browser
(Appendix A). The primers were purchased from IONTEK, Inc. (Istanbul, Turkey).
PCR products were visualized on 1.5% agarose gel electrophoresis.
2.7.1.3 Restriction fragment length polymorphism analysis
Functional variants which are recognized by restriction enzymes were analyzed by
using restriction fragment length polymorphism (RFLP). Restriction enzymes were
determined by using web-based NEBcutter tool.[84] The related fragments were
amplified by the appropriate primers (Appendix A). Restriction enzyme digestion was
carried out with at 37oC, overnight. The cocktail composed of 5 µL of PCR products,
2 µL of appropriate reaction buffer (10x), and 2 units restriction enzyme (MBI
Fermentas, NY, USA) in 20 µL completed with double-distilled H20.The digested
samples were visualized on 2.0% agarose gel electrophoresis.
2.7.2 Confirmation of the candidate variants
Novel functional homozygous variants were analyzed by conventional Sanger
sequencing explained in section 2.5.2.4, AS-PCR, and RFLP methods in order to
confirm targeted next generation sequencing results. The related regions were
amplified by the appropriate primers (Appendix A). The sequencing results were
evaluated using CLC Main Workbench 6.

48
2.7.3 Segregation analysis of the candidate variants
Segregation analysis of the novel homozygous candidate variants were facilitated
using haplotyping analysis explained in section 2.4.2 in order to determine if the
candidate genes were co-segregated with the autosomal recessive disease.
The candidate genes that were not co-segregated with the disease in
homozygous state were confirmed by conventional Sanger sequencing in three
affected individuals (05-993, 05-994, and 05-996). The related regions were amplified
by the appropriate primers (Appendix A). The sequencing results were evaluated using
CLC Main Workbench 6.
2.8 Screening the candidate genes in neurological disease cohorts
The most important step in candidate gene approach is the identification of other
mutations in randomly chosen subjects with the disease. For this purpose the candidate
genes were further screened in two cohorts of patients with neuro-developmental
phenotypes with unknown causal mutation.
The first cohort consisted of 58 patients with ataxia. Among these, twelve
patients have cerebellar ataxia with or without quadrupedal locomotion. The screening
of the mutations carried out using AS-PCR.
The second cohort consisted of 750 patients with neuro-degenerative diseases
or structural cortical malformations for whom the underlying genetic cause is missing.
Analysis of the region was carried out by evaluation of the homozygous regions
spanning the linkage interval. The genotyping of the patients were carried out using
Illumina Human 370 Duo or 610 Quad BeadChip microarrays at Yale University, CT,
USA.

49
2.9 Functional Characterization of ATP8A2
2.9.1 Prediction tools and databases
Predictive analytics compose of several statistical techniques and is used to provide
predictive models concerning biological, biochemical, and evolutionary functions of
the candidate genes. Also, several databases used in the study (see section 2.12 and
Table 2.1) in order to collect information about candidate genes and data to use in
analysis.
Evolutionary conservation analysis is carried out by multiple sequence
alignment of the protein sequences of the orthologs of the candidate genes. The protein
sequences in the fasta format were extracted from Ensembl database (see section 2.11
for reference sequence IDs and chromosomal locations). The homologous protein
sequences were aligned using the appropriate modules of CLCMain Workbench 6
(CLC Bio, Aarhus, Denmark). This software also generates phylogenetic tree using
Unweighted Pair Group Method with Arithmetic Mean (UPGMA) algorithm that is
evaluated by bootstrap analysis. UPGMA algorithm creates a root tree by assuming a
constant rate of evolution by calculating a bootstrap value using pairwise similarity
matrix.
Conservation analysis using multiple alignments is validated using prediction
tools. First, Phylogenetic p-Value (phyloP) and Genomic Evolutionary Rate Profiling
(GERP) scores of the each candidate variant were extracted using the approapriate
tracts of the UCSC Genome Browser: phyloP46wayall track21 and allHg19RS_BW
track20, respectively. GERP score can be defined as neutral if the substitution occurs
in multiple alignments, and as under functional constraints if not.[85] The phyloP score
identifies acceleration (for negative scores) or conservation (for positive scores) in a
subtree using likelihood ratio test.[86] Next, web-based prediction tools were used
which depend on the effect of the mutated amino acid on the protein structure and
function. So, disease causing probabilities of the candidate variants were evaluated

50
using SIFT [87], Polyphen2 [88], and MutationTaster [89] tools. By using “liftOver”
tool of the UCSC Genome Browser, the variant coordinates were converted into the
human genome assembly GRCh37/hg19.
Functional domains and predicted membrane-spanning domains of the
ATP8A2 protein were determined using Protein Family (Pfam) database [90] and
Transmembrane Prediction (TmPred) tool (http://www.ch.embnet.org/software/
TMPRED_form), respectively. Pfam is a database including collection of protein
families predicted by multiple sequence alignments and hidden Markov models
(HMMs). TMpred predicts the possible membrane spanning regions of the
transmembrane domains. The possible effects of the each candidate variant on the two-
and three-dimensional protein structure were predicted using web-based Protein
Structure Prediction PSIPRED server [91] and Have yOur Protein Explained (HOPE)
project tools [92], respectively.
The protein altering candidate variants were further evaluated in several
databases. The description and websites of the databases were given in Table 2.1
2.9.2 Expression analysis
2.9.2.1 cDNA libraries construction
cDNA synthesis was carried out with random hexamer primers using RevertAidTM
First Strand cDNA Synthesis kit (Fermentas, NY, USA) after DNaseI (Fermentas, NY,
USA) digestion. First-strand cDNAs were obtained from multiple commercially
available human RNA samples [Clontech: 636567 (Corpus Callosum), 636643
(Human Total RNA Master Panel); Agilent: 540005 (Total Brain), 540007
(Cerebellum), 540053 (Brain Stem), 540117 (Frontal Cortex), 540135 (Striatum),
540137 (Occipital Cortex), 540143 (Parietal Cortex), 540157 (Fetal Brain)]. The
quantities and the qualities of the samples were measured by NanoDrop
spectrophotometry.

51
Table 2.1: Databases used to evaluate novel homozygous protein altering candidate
variants
Databases Description Website
HapMap International HapMap Project hapmap.ncbi.nlm.nih.gov
DGV Database of Genomic Variants projects.tcag.ca/variation
DDBJ DNA Data Bank of Japan www.ddbj.nig.ac.jp
ALFRED Human ALlele FREquency
Database
alfred.med.yale.edu/alfred
CGAP SNP
CGAP Genetic Annotation
Initiative
lpgws.nci.nih.gov/perl/snpbr
FESD II Functional Element SNPs
Database
sysbio.kribb.re.kr:8080/fesd
F-SNP Functional SNPs compbio.cs.queensu.ca/F-SNP
Gene Viewer Displays SNPs in mRNA
sequences
lpgws.nci.nih.gov/GeneViewer
GWAS A genotype-phenotype
association database
www.gwascentral.org/index
JSNP Japanese SNP Database snp.ims.u-tokyo.ac.jp
PhenCode Paving the Path between
Phenotype and Genome
globin.bx.psu.edu/phencode
SNAP SNP Annotation Platform snap.humgen.au.dk/views
SNPper Look for known SNPs in public
databases
snpper.chip.org/bio/snpper
Tagger Selection and evaluation of tag
SNPs from genotype data
www.broadinstitute.org/tagger
HGMD The Human Gene Mutation
Database
www.hgmd.cf.ac.uk/ac

52
2.9.2.2 Semi-quantitative RT-PCR analysis
Semi-quantitative RT-PCR assay was performed using conventional PCR of the
cDNAs obtained. Glyceraldehyde 3-phosphate dehydrogenase (GAPDH) was used as
reference since it is highly expressed in the leukocytes as a housekeeping gene. The
reaction was performed using the following protocol: Initial denaturation step at 95oC
for five minutes, followed by 25 cycles of denaturation (95oC for 30 seconds),
annealing (60oC for 30 seconds) and elongation (72oC for 30 seconds), and final
extension for five minutes at 72 oC. 25µL reaction mixture composed of 100 ng of
template DNA samples, 1X Taq polymerase buffer, 10 pmol of each primer, 0.2 mM
dNTP, 1.0 mM MgCl2, and 1.25 unit Taq polymerase enzyme (MBI Fermentas, NY,
USA).
2.9.2.3 Real time Quantitative RT-PCR analysis
Real-time Quantitative Reverse Transcription PCR (QRT-PCR) assay was performed
using iQTM SYBR® Green Supermix according to standard protocols (BioRad, CA,
USA) with ABI 7500 Fast Real-Time PCR System (Applied Biosystems, CA, USA).
The relative quantifications were calculated by normalizing Ct values to reference
genes beta-actin (ACTB) and GAPDH. The expression data were analyzed using the
Pfaffl method [93].
Real-time QRT-PCR primers were designed at the exon-intron boundaries in
order to prevent amplification of the DNA contaminations by Primer3 software
(Appendix A) and verified by In-silico PCR and BLAT tools of the UCSC Genome
Browser. Each primer was normalized by diluting cDNAs from 1-5-6 fold to verify
efficiency. Primers were purchased from Iontek, Inc., Istanbul, Turkey.
The reaction was carried out in 25µL cocktail including 12.5 µL SYBR Green
Supermix, 5 pmol from each primer, 100 ng of cDNA, and double-distilled H2O by
using the following conditions: Initial denaturation step at 95oC for ten minutes,
followed by 45 cycles of denaturation (95oC for 30 seconds), annealing (60oC for 30
53
seconds) and elongation (72oC for 30 seconds), and final extension for five minutes at
72 oC. Melting curve analysis were carried out in order to detect contaminations and/or
improper binding of the primers, if any, by using dissociation-chracteristics of double-
stranded DNA, just after the final elongations step by raising the temperature 0.5oC
per 15 seconds from 55oC to 94oC.
2.9.2.4 Data mining from published expression datasets
NCBI Gene Expression Ombibus (GEO) is a database of curated gene expression
experiments (http://www.ncbi.nlm.nih.gov/projects/geo/query/acc.cgi). Microarray
expression data of the mouse brain tissues at the embryonic days E9.5, E11.5 and
E13.5 were extracted from the database.[94] The data was evaluated with GeneSpring
GX V11.1 software (Agilent Technologies, Inc.). Quality control and filtering analysis
was carried out using the appropriate modules of the software as in the manufacturer’s
protocol (A detailed protocol can be obtained from the http://www.chem.agilent.com/
cag/bsp/products/gsgx/manuals/GeneSpring-manual.pdf). Differentially expressed
genes within day groups were annotated and filtered using One-way ANOVA Test
(Bonferroni corrected p < 0.001). By using “Find Similar Entity Lists” module of the
GeneSpring software genes that are predicted to be correlated with the candidate gene
(R≥0.95) were detected. The human disease associations of the related genes were
evaluated by Mouse Genome Informatics (MGI) database.[95]
Functional annotation clustering of the correlated genes was evaluated by the
Database for Annotation, Visualization and Integrated Discovery (DAVID) tool.[96,
97]

54
2.10 Enzymes, Chemicals, and Reagents
2.10.1 Enzymes
Table 2.2: Enzymes used in the experiments
Enzyme Company
Proteinase K Appligene, CA, USA
Taq DNA Polymerase Fermentas, NY, USA
DNase I Fermentas, NY, USA
Bpil Fermentas, NY, USA
Phusion® Hot Start Flex New England Biolabs, UK
OneTaq® Hot Start New England Biolabs, UK
OneTaq® DNA Polymerase New England Biolabs, UK
iQ SYBR Green Bio-Rad, CA, USA
Phusion Hot Start II High-Fidelity Finnzymes, Finland

55
2.10.2 Solutions and buffers
Table 2.3: Solutions and buffers used in the experiment
Solutions and Buffer Content
Ethidium bromide: 10 mg/ml in water (stock solution)
30 ng/ml (working solution)
Acrylamide:bisacrylamide (30%): 29.5 gr acrylamide
0.44 gr bisacrylamide
ddH2O to 100 ml
Agarose gel loading buffer (6X): 15% coll
0.05% bromophenol
0.05% xylene cyanol
1X TAE (Tris-acetic acid-EDTA): 40mM Tris-acetate,
2 nM EDTA
pH 8.0
1X TBE (Tris-Boric Acid-EDTA) 89 mM Tris-base
89 mM boric acid
2 mM EDTA
pH 8.3
SSC (20X): 175.32 gr Sodium Chloride
88.23 gr Sodium Citrate
ddH20 to 1 lt
pH 7.0
10% APS 1 g Ammonium persulfate
ddH2O to 10 ml

56
2.10.3 Chemicals and reagents
Table 2.4: Reagents and chemicals used in the experiment
Reagent/Chemical Company
Acetic acid Sigma, MO, USA
Acrylamide Sigma, MO, USA
Agarose Basica LE, EU
Ammonium per sulfate Carlo Elba, Italy
Anti-Digoxigenin-AP, Fab fragments Roche, Germany
Bakers yeast RNA Sigma, MO, USA
BCIP Roche, Germany
Bisacrylamide Sigma, MO, USA
Bromophenol blue Sigma, MO, USA
BSA Promega, CA, USA
CHAPS Sigma, MO, USA
Denhardt's reagent Invitrogen, CA, USA
dNTPs Fermentas, NY, USA
EDTA Fermentas, NY, USA
Ethanol Merck, Germany
Ethidium bromide Sigma, MO, USA
Ficoll Type 400 Sigma, MO, USA
Formamide (Deionized) Ambion, TX, USA
Heparin Sigma, MO, USA
Herring sperm DNA Invitrogen, CA, USA
MgCl2 Fermentas, NY, USA
NBT Roche, Germany
NH4OAc Ambion, TX, USA
TEMED Sigma, MO, USA
Tris-Base Bio-Rad, CA, USA
Tris-HCl Sigma, MO, USA
Trizol reagent Invitrogen, CA, USA
Tween-20 Sigma, MO, USA
Xylene Cyanol Sigma, MO, USA

57
2.11 Reference sequences used in this study
Table 2.5: Accession codes and locations of the ortholog sequences of the candidate
genes
Species Ensemble Gene ID Location
APBA3 orthologes
Bos taurus ENSBTAG00000008395 7:21440493-21447907
Canis familiaris ENSCAFG00000019193 20:55713773-55721057
Cavia porcellus ENSCPOG00000026376 687:63474-66471
Dipodomys ordii ENSDORG00000005324 5484:7506-12773
Felis catus ENSFCAG00000019172 4155:157830-165598
Gorilla gorilla ENSGGOG00000004637 19:3832569-3843515
Homo sapiens ENSG00000011132 19:3750771-3761673
S.tridecemlineatus ENSSTOG00000000352 1:2124399-2130070
Macaca mulatta ENSMMUG00000009672 19:3590577-3601845
Macropus eugenii ENSMEUG00000013011 8213:22976-31616
Microcebus murinus ENSMICG00000014756 3672:14526-20558
Mus musculus ENSMUSG00000004931 10:81268172-81273247
Myotis lucifugus ENSMLUG00000010776 504:187520-193685
Otolemur garnettii ENSOGAG00000017147 1:16443947-16451566
Pan troglodytes ENSPTRG00000010275 19:3753399-3763164
Procavia capensis ENSPCAG00000000644 6138:24641-33058
Rattus norvegicus ENSRNOG00000020466 7:9930015-9934987
Sarcophilus harrisii ENSSHAG00000002223 G410.1:26352-32251
Sorex araneus ENSSARG00000004110 129:653-6870
Sus scrofa ENSSSCG00000013492 2:75521565-75529547
ATP8A2 Orthologs
Bos taurus ENSBTAG00000019529 12:33754809-34054513
Danio rerio ENSDARG00000077492 24:21980347-22077198
Dipodomys ordii ENSDORG00000000239 2794:7266-241256
Felis catus ENSFCAG00000001581 1872:202599-915634
Gallus gallus ENSGALG00000017106 1:181054445-181328604
Gorilla gorilla ENSGGOG00000003045 13:7288395-7801797
Homo sapiens ENSG00000132932 13:25946209-26599989
Macaca mulatta ENSMMUG00000008520 17:5281514-5918044
Monodelphis domestica ENSMODG00000008674 4:295073504-295928157

58
Mus musculus ENSMUSG00000021983 14:59647531-60197179
Ochotona princeps ENSOPRG00000003638 2068:4320-730369
Otolemur garnettii ENSOGAG00000003827 1:5252098-5877244
Pan troglodytes ENSPTRG00000005721 13:24918459-25571779
Pteropus vampyrus ENSPVAG00000000898 3706:27656-465399
Tarsius syrichta ENSTSYG00000002400 3466:9606-14765
Tetraodon nigroviridis ENSTNIG00000012718 6:3751410-3769309
Tursiops truncatus ENSTTRG00000012736 1304:21683-467711
Xenopus tropicalis ENSXETG00000010674 272.1:102868-323788
PCP2 Orthologs
Bos taurus ENSBTAG00000008906 7:17700404-17701870
Canis familiaris ENSCAFG00000018302 20:52407779-52409628
Cavia porcellus ENSCPOG00000020356 42:14877819-14878832
Equus caballus ENSECAG00000006836 7:4617290-4618648
Erinaceus telfairi ENSETEG00000018017 259696:1910-2915
Felis catus ENSFCAG00000001595 445:41838-44033
Gorilla gorilla ENSGGOG00000002452 19:7845053-7847186
Homo sapiens ENSG00000174788 19:7696509-7698570
Loxodonta africana ENSLAFG00000007547 114:1659014-1660387
Macaca mulatta ENSMMUG00000028904 19:7582857-7585049
Macropus eugenii ENSMEUG00000001483 980:33754-36479
Microcebus murinus ENSMICG00000010552 430:12274-14003
Monodelphis domestica ENSMODG00000015012 3:463179948-463181640
Mus musculus ENSMUSG00000004630 8:3623371-3625545
Otolemur garnettii ENSOGAG00000001240 821.1:493965-495066
Pan troglodytes ENSPTRG00000010396 19:7732220-7734353
Procavia capensis ENSPCAG00000010909 728:34704-36528
Rattus norvegicus ENSRNOG00000000993 12:2529466-2531706
Sorex araneus ENSSARG00000010822 733:287-1115

59
2.12 Web Sources
Table 2.6: Web-tools used in analysis and design
Web-Tool Web address Reference
HomozygosityMapper www.homozygositymapper.org [69]
BioMart www.ensembl.org/biomart/martview -
GeneWanderer compbio.charite.de/genewanderer/ [71]
Ensembl www.ensembl.org -
Primer3 frodo.wi.mit.edu [72]
BLAT genome.ucsc.edu/cgi-bin/hgBlat -
In-Slico PCR genome.ucsc.edu/cgi-bin/hgPcr -
SSAHA www.sanger.ac.uk/resources/ssaha [73]
Maq maq.sourceforge.net [74]
BWA bio-bwa.sourceforge.net [75]
SAMtools samtools.sourceforge.net [76]
liftOver genome.ucsc.edu/cgi-bin/hgLiftOver -
BEDtools code.google.com/p/bedtools [79]
IGV www.broadinstitute.org/igv [81]
PLINK pngu.mgh.harvard.edu/~purcell/plink [82]
ANNOVAR www.openbioinformatics.org/annovar [83]
dbSNP www.ncbi.nlm.nih.gov/projects/SNP -
1000 Genomes www.1000genomes.org -
EVS evs.gs.washington.edu/EVS -
NEBcutter tools.neb.com/NEBcutter2 [84]
Genome Bioinformatics genome.ucsc.edu -
GERP mendel.stanford.edu/SidowLab [85]
phyloP compgen.bscb.cornell.edu/phast [86]
SIFT sift.jcvi.org/ [87]
PolyPhen2 genetics.bwh.harvard.edu/pph2 [88]
MutationTaster www.mutationtaster.org/ [89]
Pfam pfam.sanger.ac.uk/ [90]
TMpred www.ch.embnet.org/TMPRED -
HOPE www.cmbi.ru.nl/hope/home [92]
PSIpred bioinf.cs.ucl.ac.uk/psipred [91]

60
Chapter 3
Results
3.1. Clinical Assessment of the Family
The consanguineous family from Adana-Turkey has four affected individuals with
mental retardation, dysarthric speech, and truncal ataxia (See the pedigree in Figure
3.1). All the patients in the family had significant developmental delay noted in
childhood (Table 3.1). Two of the patients (05-994 and 05-999) exhibited quadrupedal
locomotion (Figure 3.2). These patients did not show any ataxic movements during
quadrupedal walking. The woman (05-999) had ability to stand upright and maintain
the position with bent knees and hips. She preferentially got back to quadrupedal
position while walking. The man (05-994) could only stand by support (Figure 3.3,
left). One of the male patients (05-996) walked quadrupedally during infancy, acquired
occasional drunk-like ataxic bipedal gait later in his adulthood with
dysdiadochokinesia and dysmetria (Figure 3.3, right). The last patient (05-993) also
walked quadrupedally during childhood, but exhibiting total inability to walk during
his adulthood.
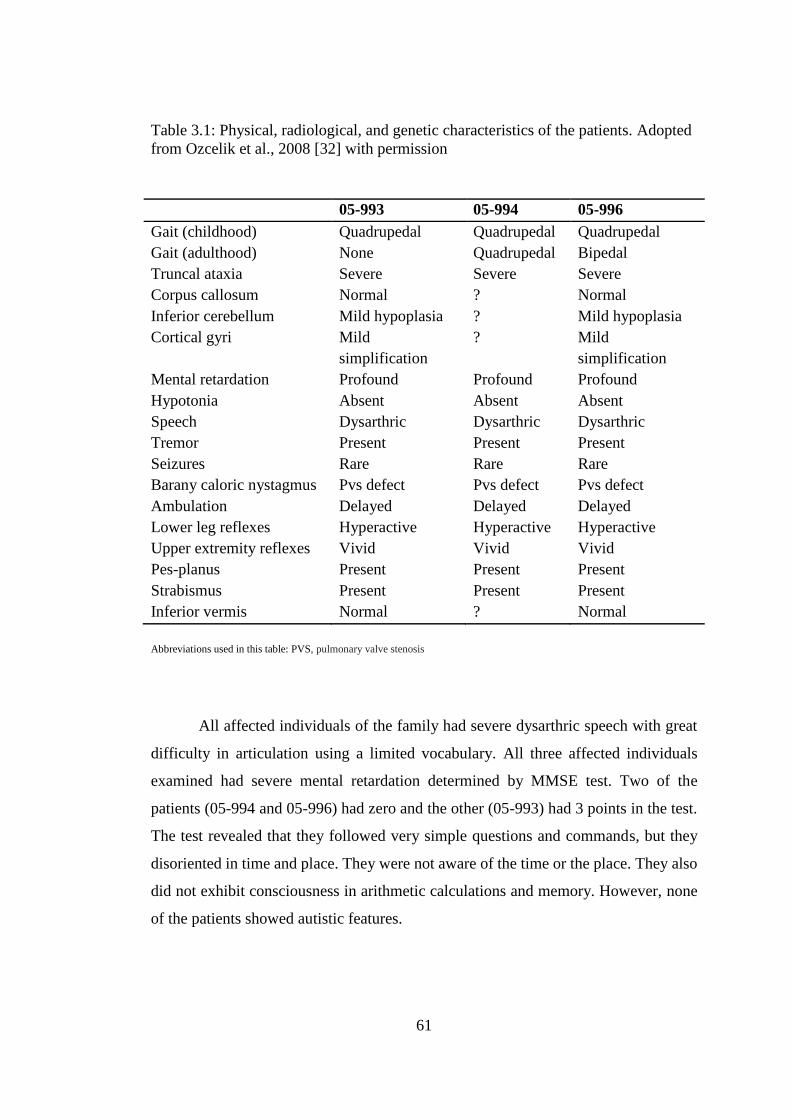
61
Table 3.1: Physical, radiological, and genetic characteristics of the patients. Adopted
from Ozcelik et al., 2008 [32] with permission
05-993 05-994 05-996
Gait (childhood) Quadrupedal Quadrupedal Quadrupedal
Gait (adulthood) None Quadrupedal Bipedal
Truncal ataxia Severe Severe Severe
Corpus callosum Normal ? Normal
Inferior cerebellum Mild hypoplasia ? Mild hypoplasia
Cortical gyri Mild
simplification
? Mild
simplification
Mental retardation Profound Profound Profound
Hypotonia Absent Absent Absent
Speech Dysarthric Dysarthric Dysarthric
Tremor Present Present Present
Seizures Rare Rare Rare
Barany caloric nystagmus Pvs defect Pvs defect Pvs defect
Ambulation Delayed Delayed Delayed
Lower leg reflexes Hyperactive Hyperactive Hyperactive
Upper extremity reflexes Vivid Vivid Vivid
Pes-planus Present Present Present
Strabismus Present Present Present
Inferior vermis Normal ? Normal
Abbreviations used in this table: PVS, pulmonary valve stenosis
All affected individuals of the family had severe dysarthric speech with great
difficulty in articulation using a limited vocabulary. All three affected individuals
examined had severe mental retardation determined by MMSE test. Two of the
patients (05-994 and 05-996) had zero and the other (05-993) had 3 points in the test.
The test revealed that they followed very simple questions and commands, but they
disoriented in time and place. They were not aware of the time or the place. They also
did not exhibit consciousness in arithmetic calculations and memory. However, none
of the patients showed autistic features.

62
Figure 3.1: Family pedigree of the affected individuals. (Copyright © 2013, Copyright
Clearance Center, Inc. Adopted from Tan et al., 2006 [63] with permission).
Neurological examinations of the affected individuals were carried out at the
Cukurova University University Hospital by specialists which revealed that they had
bilateral dysmetria and dysdiadochokinesia with severe truncal ataxia. Motor
examinations revealed normal muscle tone and power and no sensory loss. Patients’
lower extremities were hyperactive and upper extremities were vivid. Cranial MRI and
whole-body CT examinations of the patients revealed normal corpus callosum and
inferior vermis whereas mild cerebral and cerebellar atrophy, mild cerebral cortical
simplification.

63
Figure 3.2: Quadrupedal walking of patients 05-994 (left) and 05-999 (right).
(Copyright © 2013, Copyright Clearance Center, Inc. From Tan et al., 2006 [63]
with permission).

64
Figure 3.3: Standing postures of the quadrupedal man (05-994) and bipedal ataxic man
(05-996). (Copyright © 2013, Copyright Clearance Center, Inc. From Tan et al., 2006
[63] with permission).
3.2. Genetic Mapping
Close examination of the pedigree revealed that CAMRQ inherited in the family with
autosomal recessive transmission. Homozygosity mapping analysis is a useful method
to map recessive traits in consanguineous families.
3.2.1. Homozygosity mapping using Affymetrix arrays
Homozygosity mapping analysis was facilitated with Affymetrix 250K NspI
genotyping data which was generated using DNA of three affected individuals (05-
993, 05-994 and 05-996) (Figure 3.4). As a result 23 shared homozygous regions
detected for a mutation segregating within the three affected individuals (Table 3.2).
Since nine of the homozygous blocks were located in centromeric or telomeric regions,
they were excluded from the study. The two consecutive blocks on chromosome 13
were supposed as a single block and selected as the first candidate locus.

65
Figure 3.4: Homozygosity mapping analysis using Affymetrix arrays. Shared
homozygosity regions of the three affected individuals (05-993, 05-994 and 05-996)
were determined using web-based online HomozygosityMapper software. Y-axis of
the graph indicates genome-wide homozygosity scores (max=1000). Red bars refer to
the common homozygous intervals.
3.2.2. Candidate gene sequencing
The shared homozygous blocks contain 563 genes including 286 protein coding (see
Appendix B), 149 pseudogenes, 15 processed transcripts, and 113 RNA genes.
Because of the huge number of genes, a candidate gene approach determined. The
shared homozygote interval on 13q region evaluated as the primary candidate.
The 1.3 Mb long candidate region on chromosome 13q contains 10 protein
coding genes (Table 3.3). Among these ATP12A (ATPase, Na+/K+ transporting, alpha
polypeptide-like 1), ATP8A2 (ATPase, class I, type 8a, member 2), MTMR6
(Myotubularin-related protein 6), NUPL1 (Nucleoporin-like 1), CENPJ (Centromeric
protein j), and SACS (Sacsin) genes expressed at the cerebellum. Especially CENPJ
gene causes primary microcephaly [MIM: 609279] with mental retardation and SACS
gene causes spastic ataxia [MIM: 270550].
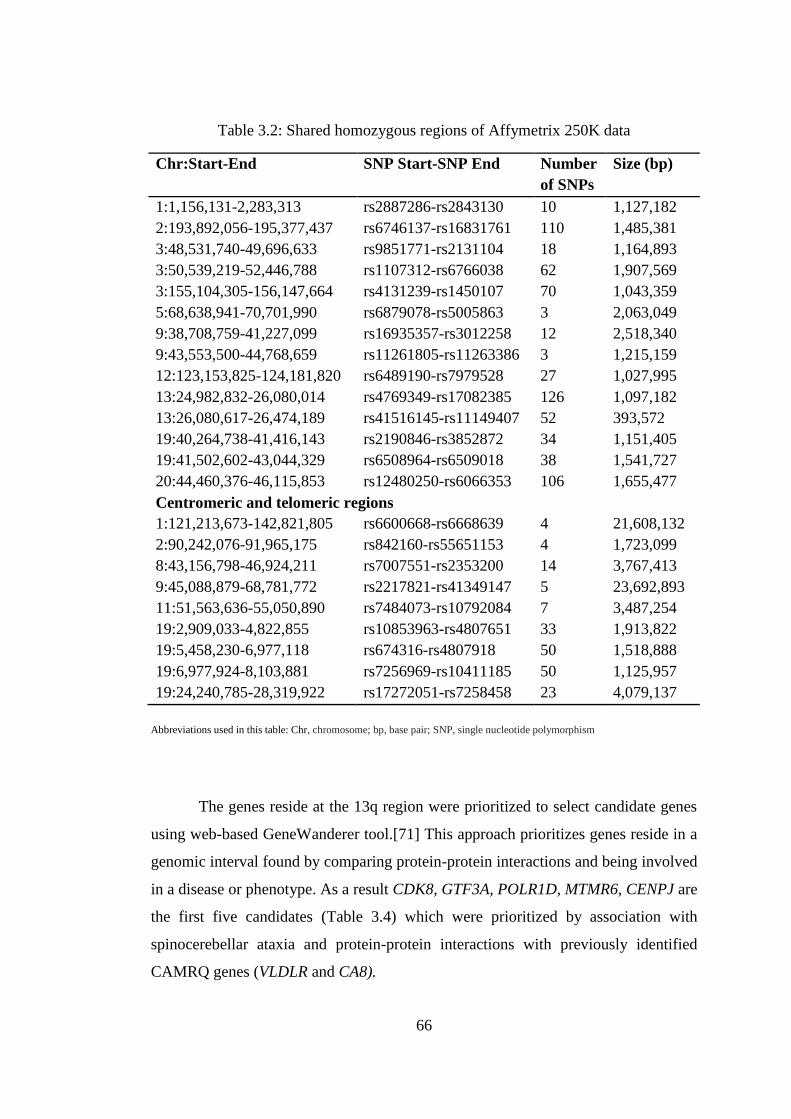
66
Table 3.2: Shared homozygous regions of Affymetrix 250K data
Chr:Start-End SNP Start-SNP End Number
of SNPs
Size (bp)
1:1,156,131-2,283,313 rs2887286-rs2843130 10 1,127,182
2:193,892,056-195,377,437 rs6746137-rs16831761 110 1,485,381
3:48,531,740-49,696,633 rs9851771-rs2131104 18 1,164,893
3:50,539,219-52,446,788 rs1107312-rs6766038 62 1,907,569
3:155,104,305-156,147,664 rs4131239-rs1450107 70 1,043,359
5:68,638,941-70,701,990 rs6879078-rs5005863 3 2,063,049
9:38,708,759-41,227,099 rs16935357-rs3012258 12 2,518,340
9:43,553,500-44,768,659 rs11261805-rs11263386 3 1,215,159
12:123,153,825-124,181,820 rs6489190-rs7979528 27 1,027,995
13:24,982,832-26,080,014 rs4769349-rs17082385 126 1,097,182
13:26,080,617-26,474,189 rs41516145-rs11149407 52 393,572
19:40,264,738-41,416,143 rs2190846-rs3852872 34 1,151,405
19:41,502,602-43,044,329 rs6508964-rs6509018 38 1,541,727
20:44,460,376-46,115,853 rs12480250-rs6066353 106 1,655,477
Centromeric and telomeric regions
1:121,213,673-142,821,805 rs6600668-rs6668639 4 21,608,132
2:90,242,076-91,965,175 rs842160-rs55651153 4 1,723,099
8:43,156,798-46,924,211 rs7007551-rs2353200 14 3,767,413
9:45,088,879-68,781,772 rs2217821-rs41349147 5 23,692,893
11:51,563,636-55,050,890 rs7484073-rs10792084 7 3,487,254
19:2,909,033-4,822,855 rs10853963-rs4807651 33 1,913,822
19:5,458,230-6,977,118 rs674316-rs4807918 50 1,518,888
19:6,977,924-8,103,881 rs7256969-rs10411185 50 1,125,957
19:24,240,785-28,319,922 rs17272051-rs7258458 23 4,079,137
Abbreviations used in this table: Chr, chromosome; bp, base pair; SNP, single nucleotide polymorphism
The genes reside at the 13q region were prioritized to select candidate genes
using web-based GeneWanderer tool.[71] This approach prioritizes genes reside in a
genomic interval found by comparing protein-protein interactions and being involved
in a disease or phenotype. As a result CDK8, GTF3A, POLR1D, MTMR6, CENPJ are
the first five candidates (Table 3.4) which were prioritized by association with
spinocerebellar ataxia and protein-protein interactions with previously identified
CAMRQ genes (VLDLR and CA8).

67
Table 3.3: Genes located on the 13q candidate homozygous region
Chr:Start-End (bp) Gene Biotype Status
13:24982295-25171798 RP11-556N21.4 pseudogene known
13:24993688-24995180 RP11-169O17.5 processed transcript putative
13:24995064-25086948 PARP4 protein coding known
13:25129366-25129451 AL359538.2 miRNA novel
13:25140981-25144866 PSPC1P2 pseudogene known
13:25141011-25171814 TPTE2P6 processed transcript novel
13:25183217-25183313 AL359538.1 miRNA novel
13:25254549-25285921 ATP12A protein coding known
13:25277694-25277803 RNY1P7 misc RNA known
13:25278540-25278926 RPL26P34 pseudogene known
13:25316815-25320322 IRX1P1 pseudogene known
13:25324795-25326309 ANKRD20A10P pseudogene known
13:25338290-25454059 RNF17 protein coding known
13:25457171-25497018 CENPJ protein coding known
13:25498815-25542625 TPTE2P1 pseudogene known
13:25511014-25512491 LINC00357 processed transcript putative
13:25517713-25518636 SLC25A15P3 pseudogene known
13:25562715-25563063 RPL34P27 pseudogene known
13:25670006-25673392 PABPC3 protein coding known
13:25715794-25716046 AL359757.1 pseudogene novel
13:25735822-25746426 FAM123A protein coding known
13:25746966-25754217 RP11-165I9.4 lincRNA novel
13:25755579-25763898 RP11-165I9.8 antisense novel
13:25767245-25784433 RP11-165I9.6 processed transcript putative
13:25780187-25780640 RPL23AP69 pseudogene known
13:25802307-25862147 MTMR6 protein coding known
13:25820669-25820753 AL590787.1 miRNA novel
13:25874262-25875576 RP11-271M24.2 antisense novel
13:25875662-25923938 NUPL1 protein coding known
13:25939937-25940293 TCEB2P1 pseudogene known
13:25946209-26599989 ATP8A2 protein coding known
13:26027137-26027428 Metazoa_SRP misc RNA novel
13:26091257-26091363 RNU6-78 snRNA known
13:26437388-26437805 RP11-467D10.2 pseudogene known
13:26442061-26455095 AL138815.1 protein coding known
Abbreviations used in this table: Chr, chromosome; bp, base pair; misc RNA, miscellaneous RNA, miRNA, microRNA

68
Table 3.4: Gene prioritization using GeneWanderer
Rank Gene Symbol Score Start (bp) End (bp)
1 CDK8 0.06336 25,726,755 25,876,568
2 GTF3A 0.06135 26,895,848 26,907,957
3 POLR1D 0.01466 27,094,002 27,139,547
4 MTMR6 0.01304 24,718,338 24,759,703
5 CENPJ 0.01227 24,354,411 24,395,084
6 CDX2 0.00785 27,434,277 27,441,316
7 PDX1 0.00775 27,392,156 27,397,393
8 WASF3 0.00213 26,029,839 26,161,081
9 LNX2 0.00208 27,018,049 27,092,719
10 SHISA2 0.00167 25,516,734 25,523,197
11 RPL21 0.00149 26,723,691 26,728,704
12 NUPL1 0.00093 24,773,665 24,814,560
13 ATP8A2 0.00087 24,844,208 25,493,419
14 GSX1 0.00057 27,264,779 27,266,088
15 ATP12A 0.00040 24,152,694 24,183,917
16 GPR12 0.00032 26,230,959 26,231,963
17 RNF6 0.00029 25,684,904 25,694,507
18 PABPC3 0.00029 24,568,275 24,570,704
19 USP12 0.00010 26,540,432 26,644,027
20 RNF17 0.00005 24,236,300 24,352,058
21 RASL11A 0.00000 26,742,463 26,745,826
Abbreviations used in this table: bp, base pair
All in all, taking expression and prioritization analysis and database searches
into account MTMR6, NUPL, CENPJ and SACS genes were selected as the first
candidates for sequencing. The 96.8% of the 57 exons, the exon-intron boundaries and
untranslated regions of these four genes were sequenced with 93 primers (see
Appendix A for the full list of primers) but no mutations associated with the disease
were detected (Table 3.5). Further sequencing using candidate gene priorization
approach would be time and expense consuming so the Affymetrix array genotyping
results were evaluated.

69
Table 3.5: Statistics of the sequencing results of the 13q region
Genes Exon
Number
Total
Reactions
Exons not
Sequenced
Completed
(%)
MTMR6 15 19 1 100
CENPJ 17 18 1 94.4
NUPL1 16 22 0 100
SACS 9 36 1 97.2
3.2.3. Homozygosity mapping using high-resolution Illimuna arrays
Homozygosity mapping analysis using Affymetrix 250K NspI array results with 23
shared homozygous loci. 9 of them were excluded since they were at the centromeric
or telomeric regions. Remaining 14 loci on chromosomes 1, 2, 3, 5, 9, 12, 13, 19, 20
could not be excluded from the study. Affymetrix 250K SNP Array contains of
approximately 262,264 SNPs and do not represent all regions of the genomes. Also
the experiment resulted with low confidence (79.5%) since 53.787 SNPs were not
informative for haplotyping.
Therefore, the homozygosity mapping analysis were repeated with a more
comprehensive SNP array, Illumina Human610-Quad BeadChip with 599,012 SNP
and 21889 CNV probes, using DNA’s of the two patients (05-994 and 05-996).
Homozygosity mapping analysis were carried out using web-based
HomozygosityMapper software using 589,904 informative SNPs (98.5% coverage)
for both patients (Figure 3.5). As a result four shared homozygous blocks were
identified in two affected individuals (Table 3.6). All other previously reported regions
including the telomeric and centromeric ones and also previously identified locus for
CAMRQ syndrome were excluded by this analysis (Figure 3.6).
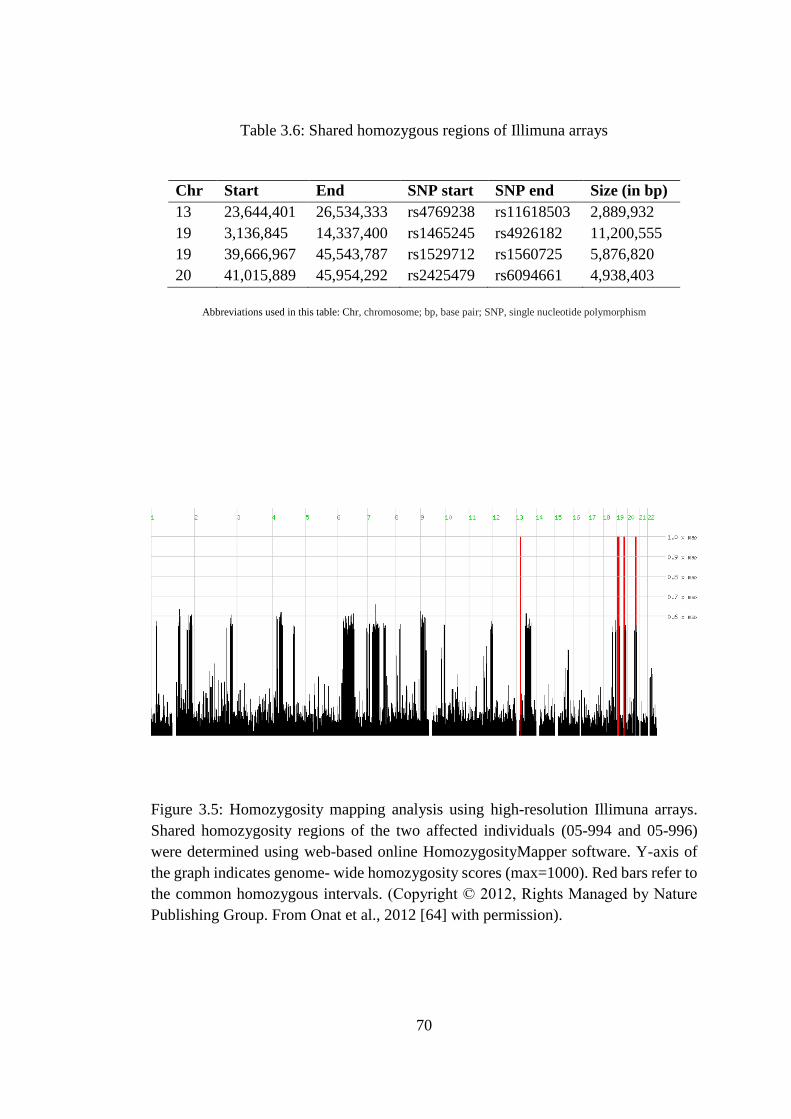
70
Table 3.6: Shared homozygous regions of Illimuna arrays
Chr Start End SNP start SNP end Size (in bp)
13 23,644,401 26,534,333 rs4769238 rs11618503 2,889,932
19 3,136,845 14,337,400 rs1465245 rs4926182 11,200,555
19 39,666,967 45,543,787 rs1529712 rs1560725 5,876,820
20 41,015,889 45,954,292 rs2425479 rs6094661 4,938,403
Abbreviations used in this table: Chr, chromosome; bp, base pair; SNP, single nucleotide polymorphism
Figure 3.5: Homozygosity mapping analysis using high-resolution Illimuna arrays.
Shared homozygosity regions of the two affected individuals (05-994 and 05-996)
were determined using web-based online HomozygosityMapper software. Y-axis of
the graph indicates genome- wide homozygosity scores (max=1000). Red bars refer to
the common homozygous intervals. (Copyright © 2012, Rights Managed by Nature
Publishing Group. From Onat et al., 2012 [64] with permission).

71
Figure 3.6: Comparison of the Affymetrix and Illimuna arrays. Homozygosity
mapping analysis using Affymetrix 250K NspI array results with 23 shared
homozygous loci. 9 of them were located at the centromeric or telomeric regions.
Affymetrix array experiment resulted with 208.477 informative SNPs (79.5%
coverage). Homozygosity mapping analysis was repeated with a Illumina Human610-
Quad BeadChip with 589,904 informative SNPs (98.5% coverage). Four shared
homozygous blocks were identified which excluded many of the regions identified by
Affymetrix arrays including the telomeric and centromeric ones.

72
3.3 Targeted next generation sequencing of the homozygous regions
Four common homozygous intervals determined by high-resolution Illimuna
genotyping contain 882 genes with 2,263 transcripts and 16,935 exons which
constitute a total of 4,068,182 base pairs. The shared regions constitute a total of
24,905,710 base pairs with intergenic and intragenic regions which may be involved
in regulation of the transcription. The region also contains 594 known protein coding
genes so candidate gene prioritization would not be work. Because of the huge number
of genes it is not possible to sequence all exons with exon-intron boundaries and
untranslated regions; therefore a genome-wide approach was aimed.
As a next step, targeted enrichment followed by next generation sequencing
technology is the most promising step towards maximizing the efficiency and cost.
Sample preparation, capture and sequence enrichment, and data analysis are the major
steps that encompass workflow.
3.3.1 Sample Preparation
The quality of the next generation sequencing data depends on the optimal sample
preparation. Genomic DNA with high quality and high quantity is necessary for
targeted next generation sequencing experiments as in all high-throughput sequencing
or genotyping experiments.
Genomic DNA isolations of the selected individuals were carried out using
phenol-chloroform extraction method. The quantities and qualities of the samples were
measured by gel electrophoresis using densitometry analysis (Figure 3.7 and Table
3.7), spectrophotometry measurements (Table 3.8), and PicoGreen method (Table 3.9,
Table 3.10, and Figure 3.8).

73
Table 3.7: DNA concentrations as a result of densitometric measurements
Sample Concentration (ng/µl) Dilution Total (ng/µl)
05-992 70.23 1/5 351.15
05-994 67.57 1/5 337.85
05-996 94.37 1/5 471.85
Affy DNA 25ng 22.76 1/2 45.52
Affy DNA 50ng 50 1 reference
MassRuler 10k 25 1 reference
MassRuler 8k 20 1 reference
Abbreviations used in this table: ng, nano gram; µl, microliters; Affy, Affymetrix
Figure 3.7: Density measurements using agarose gel electrophoresis. DNA samples
were run on 1% agarose gel at 70V for 50 minutes. Lane 1: MassRuler DNA Ladder
Mix (1 µl); Lanes 2-4: DNA samples diluted 1:5 in TE (1 µl); Lanes 5-6: Affymetrix
Reference gDNA (25 ng, 50 ng); Lane 7: pUC mix Marker 8 (1 µl). Gel image was
captured with BioRad Gel Doc 2000 system, DNA quantitation was performed using
BioRad Multi Analyst 1.1 software. Affymetrix gDNA (50 ng) and MassRuler (10k:
25 ng, 8k: 20 ng) used as reference. Affymetrix gDNA (25 ng) used as control.

74
Table 3.8: DNA concentrations as a result of spectrophotometric measurements
Sample 260/280 260/230 Conc.
(ng/µl)
Dilution Total
(ng/µl)
Total DNA
(95 µl)
Affy DNA
(50 ng)
1.79 1.78 49.82 1 49.82 -
Affy DNA
(25 ng)
1.87 1.22 22.76 1/2 45.52 -
05-992 1:5 1.77 2.10 63.88 1/5 319.40 30.34
05-994 1:5 1.84 2.28 123.48 1/5 617.40 58.65
05-996 1:5 1.82 2.21 95.99 1/5 479.95 45.60
Abbreviations used in this table: Conc., concentration; ng, nano gram; µl, microliters; Affy, Affymetrix
Table 3.9: DNA concentrations as a result of PicoGreen analysis
Well Fluorescein Dilution
Factor
Counts Concentration
(ng/ml)
Total
DNA
Reference 1246 0 0 -2,62 -
Reference 5125 1 3879 6,81 -
Reference 5156 1/10 3910 6,89 -
Reference 43385 1/100 42139 99,88 -
Reference 413440 1/1000 412194 1000,04 -
05-992 123510 1/5 122264 294,79 147,39
05-992 200728 1/5 199482 482,62 241,31
05-994 303311 1/5 302065 732,15 366,08
05-994 343331 1/5 342085 829,50 414,75
05-996 235531 1/5 234285 567,28 283,64
05-996 252286 1/5 251040 608,03 304,02
Affy DNA 66914 1/2 65668 157,12 31,42
Affy DNA 58375 1/2 57129 136,34 27,27
05-992 67102 1/10 65856 157,57 157,57
05-994 174756 1/10 173510 419,44 419,44
05-994 59471 1/20 58225 139,01 278,02
05-992 374703 1/2 373457 905,81 181,16
05-996 130496 1/10 129250 311,78 155,89
Abbreviations used in this table: ng, nano gram; µl, microliters; Affy, Affymetrix

75
Table 3.10: Average concentrations of samples of PicoGreen measurements
Samples 1:2 1:5 1:5 1:10 1:20 Average
(ng/µl)
Total DNA
(95 µl)
05-992 181 147 241 157 - 182 17.2
05-994 - 366 414 419 278 369 35.1
05-996 - 283 304 155 - 247 23.5
Affy DNA
(50ng)
- 31 27 - - 58 -
Abbreviations used in this table: ng, nano gram; µl, microliters; Affy, Affymetrix
Figure 3.8: Linear regression graph of PicoGreen assay
y = 411,1x + 2323,8R² = 0,9999
0 200 400 600 800 1000 1200
0
50000
100000
150000
200000
250000
300000
350000
400000
450000

76
3.3.2 Capture and sequence enrichment
The next step to be considered for targeted next generation sequencing experiment is
the make-up of the library to be sequenced. So the capturing reaction should recover
the fragments with low bias and high complexity to obtain a high percentage of
coverage of the targeted region. The minimal critical regions at the shared homozygous
regions determined by homozygosity mapping using Illimuna genotyping data
(chr13:23,644,401-26,534,333, chr19:3,136,845-14,337,400, chr19:39,666,967-
45,543,787, chr20:41,015,889-45,954,292, according to hg19 reference genome) was
captured using 3 µg input DNA of one affected individual, 05-996 by custom-designed
Nimblegen Human Sequence Capture HD2 microarray. A total of 16,756,626 base
long unique probes were designed to target homozygous regions and as a result
captured with 629-fold enrichment (Table 3.11). Captured DNA sample of the affected
individual was sequenced by Illimuna Genome Analyzer IIx using Titanium series
reagents. 29.2% of the reads mapped to the targeted homozygosity intervals. Average
read length was 74.32 base-pairs with 4,764,521 single-end 75 base-pair reads
contributing 20.42 fold coverage and 10,059,448 single-end 74 base-pair reads
contributing 42.55 fold coverage. A total of 48.62 million reads were sequenced with
62.96 fold mean coverage depth. As a result, 97.41% of the targeted bases being
covered by at least four reads (Table 3.11).
3.3.3 Data Analysis
3.3.3.1 Variant calling and error rates
Since next generation sequencing is a valuable technique for understanding disease
and health, management and analysis of the huge data obtained requires several steps.
At first, error sources and rates in the original raw data should be determined. Data
should be analyzed by computational methods including assembly, alignment, and
variation detection. Variant annotation requires a broad range of genetic analysis

77
including comparative genomics, polymorphism detection, analysis of coding and
non-coding regions, and identifying mutant genes in disease pathways.
Table 3.11: Statistics of targeted next generation sequence data. (Copyright © 2012,
Rights Managed by Nature Publishing Group. From Onat et al., 2012 [64] with
permission).
Patient ID 05-996
Number of lanes 3
Read Type (SR/PE) SR
Read length 75 bp
Total number of reads 48,627,393
Targ
eted
Sh
are
d
Hom
ozy
gosi
ty I
nte
rvals
Interval size (bp) 16,756,626
Fold enrichment 629
% mapped to the interval 29.20
Mean coverage (fold) 62.96
% of bases covered at least 4X 97.41
Mean error rate (%) 0.61
2nd base error rate (%) 0.25
Last base error rate (%) 2.36
Abbreviations used in this table: SR, single repeat; PE, paired end; bp, base pair
It is critical to assess the quality of the sequencing reactions by evaluating the
sequencing errors and artifacts. Variant calling accuracy is affected by several factors
such as library generation, read mapping, variation in unique and repetitive elements,
detecting indels with short reads, difficulties in mapping homopolymer regions and
GCC motifs, and artificial amplification.[98] Next generation sequencing platforms
had an average of 0.1-1% error rate which reaches to 3-4.5% at homopolymer
regions.[99] Comparison analysis between the Illimuna SNP genotyping data and
Illimuna targeted sequencing data revealed a mean error rate of 0.61% (0.24%-2.36%)
determined on overall sequencing data.

78
3.3.3.2 Analysis of the low-coverage regions
As mentioned, as a result of targeted next generation sequencing, 97.41% of the
targeted bases being covered by at least four reads. Therefore, 2.59% of the targeted
bases which constitutes 434,494 bases were whether covered less than four reads
(239,122 bp) or did not covered at all (195,372 bp) (Table 3.12, see also Figure 3.9).
So in principle, mutations in these low and zero coverage regions could also be disease
causing and should be analyzed.
The non-covered bases would reside at the coding exons, exon-intron
boundaries, untranslated regions, introns, and intragenic regions. Classification of
these non-covered bases according to their physical location would provide
information about the functional consequences of the possible variations since the non-
covered bases at the non-coding regions would not be important in coverage
calculations.
The targeted regions contain 5,235 exons that compose a total of 1,067,180
bases (genome assembly NCBI36/hg18, exome_B_NCBI36.bed, created from
HAVANA & ENSEMBL data on 2008, downloaded from ftp://ftp.sanger.ac.uk/
pub/fsk/exome/) of which 919,453 bases are on the evolutionary conserved protein-
coding exons (genome assembly GRCh17/hg19, Exoniphy, downloaded from UCSC
Genome Browser Genes and Gene Prediction tracts).
Evaluation of the low and zero coverage regions using mpileup module of
Samtools and intersectBED command of BEDtools revealed that 14,027 bases reside
at the exonic regions which increase the coverage to 98.69%. A more detailed analysis
of the exonic region revealed that only 4,505 bases place on the constitutive parts
which comprise 99.51% coverage with at least four times readings (Table 3.12, see
also Figure 3.9). These 4,505 bases correspond to 77 exons in 9 genes (Table 3.13)

79
Table 3.12: Coverage analysis of the next generation sequencing data
Base pairs Percentage
Interval size 16,756,626 100
Bases covered (>3X) 16,322,132 97.41
Low covered bases (1-3X) 239,122 1.42
Zero covered bases 195,372 1.17
Bases non-covered 434,494 2.59
Bases non-covered at the noncoding regions 420,467 2.51
Bases non-covered at the exonic regions 14,027 0.08
Bases non-covered at the UTRs and boundaries 9,522 0.05
Bases non-covered at the constitutive exons 4,505 0.03
Total number of exons 1,067,180 5.49
Exonic coverage (>3X) 14,027 98.69
Total number of constitutive exons 919,454 6.37
Constitutive exonic coverage (>3X) 4,505 99.51
The genes located at the low or zero coverage regions with the constitutive
exons were evaluated in detail. It is revealed that they neither have cerebellar
expression nor display a phenotype compatible with cerebellar involvement in mouse
knockouts (Table 3.13). Based on these results, we concluded that it is highly unlikely
that a causative mutation is missed at the low or zero coverage regions.
3.4 Identification of the Disease-Causing Determinants
With the advent of next generation sequencing technology, identifying novel disease
genes has become facilitated. Figure 3.10 summarizes the procedure followed in this
study to identify disease-causing genes. The common step in disease-causing gene
identification is mutation testing in a candidate gene, but the other steps are unique to
the case. In general the method we used can be divided into those that determination
of the chromosomal location of the disease locus, next generation sequencing,
genotype calling and functional annotation of the variants, evaluation and exclusion of
the variants, identification and confirmation of the disease-causing variant.

80
Figure 3.9: Graphical representation of the coverage analysis of the next generation
sequencing data. 97.41% of the targeted bases covered by at least four reads. Among
these, 99.51% of the constitutive exons in protein coding regions were found to be
covered by at least four reads. The numbers corresponds to base pairs. Coverage
analysis carried out using intersectBED command of BEDtools and mpileup module
of Samtools.

81
Table 3.13: List of genes corresponding to low and zero coverage regions. (Copyright © 2012, Rights Managed by Nature Publishing
Group. From Onat et al., 2012 [64] with permission).
Gene Name Gene Biotype MIM
accession
Exp. in
cerebellum
Exp. in
brain
Exp. in
nerve
MGI Phenotype of the homozygous mice
GNA15 Protein coding - no no no Normal hematopoiesis and normal response to
inflammatory challenges
CLASRP Protein coding - no yes yes -
DOHH Protein coding - yes yes no Embryonic lethal
SAFB2 Protein coding - yes yes yes Born at the expected Mendelian ratio and did
not show any obvious defects in growth or
fertility
PAK4 Protein coding - yes yes yes Die at midgestation exhibiting heart defects as
well as impaired neuronal development and
yolk sac vasculature
CHAF1A Protein coding - yes yes yes Lethality before implantation, embryonic
growth arrest, and abnormal heterochromatin
morphology
AC006271.1 Pseudogene - no no no -
C1QTNF9 Protein coding - no no no -
C1QTNF9-AS1 Processed
transcript
- no no no -
Abbreviations used in this table: MIM, Mendelian Inheritance in Man; Exp., expression

82
Figure 3.10: Schematic representation of the disease-causing gene identification
method.

83
3.4.1 Genotype calling and analysis
After the sequencing reaction was completed, image analysis and base calling was
performed using Illumina Pipeline version 1.5 with default parameters to generate
primary sequencing data. Genotype calling is the process done to determine positions
in which a SNP or variant has been called. Obtained 75 base pair single-end reads were
then aligned against the reference human genome (NCBI36/hg18) using Maq and
BWA software packages to determine single nucleotide variants and insertion/
deletions, respectively. SNVs and indels were extracted and analyzed using SAMtools
software package. Positional annotations of the genetic variants carried out using the
ANNOVAR software package.
As a result, a total of 35,325 variants (18,292 heterozygous + 17,033
homozygous) were detected within the targeted homozygous regions (Table 3.14).
Among these, heterozygous variants composed of 3,866 SNVs, 7,948 insertions, and
6,478 deletions; and homozygous variants composed of 15,311 SNVs, 687 insertions
and 1,035 deletions. As a result, a total of 489 protein coding heterozygous variations
(457 exonic, 23 exonic splicing and 24 intronic splicing variants) and 596 protein
coding homozygous variations (581 exonic, 10 exonic splicing and 5 intronic splicing
variant were detected (See Table 3.14 for detailed analysis).
3.4.2 SNP calling and filtering
Exclusion of the variants that matching with previously reported SNPs is the first
filtering step, since the NCBI dbSNP database assumed not to contain pathogenic
variations. Non-pathogenic SNP calling and filtering carried out using the ANNOVAR
software package by utilizing dbSNP132 in hg18 coordinates.

84
Table 3.14: Statistics of the genetic variants after base calling and positional annotations
Functional Annotation
Protein Coding Noncoding Regions
Total Exonic Exonic;
splicing
Splicing Intergenic Intronic ncRNA Upstream;
downstream
UTR
Total number of
variations
35325 1038 23 24 13447 16819 1562 1493 919
Heterozygous variations 18292 457 13 19 6997 8789 789 760 468
SNVs 3866 106 3 5 1533 1798 190 133 98
Insertions 7948 311 10 8 2859 3820 321 369 250
Deletions 6478 40 0 6 2605 3171 278 258 120
Homozygous variations 17033 581 10 5 6450 8030 773 733 451
SNVs 15311 569 8 4 5773 7189 682 678 408
Insertions 687 6 1 1 264 333 34 27 21
Deletions 1035 6 1 0 413 508 57 28 22
Abbreviations used in this table: SNV, single nucleotide variation; ncRNA, noncoding RNA; UTR, untranslated region
85
As a result, 43.8% of the total variants (15,470 variants) called as SNP and
excluded from the study. Remaining 18,726 novel variants (15,946 heterozygous +
2,780 homozygous) were analyzed (See Table 3.15 for detailed statistics). Novel
heterozygous variants composed of 3,188 SNVs, 7,948 insertions, and 5,662 deletions;
and novel homozygous variants composed of 1,736 SNVs, 687 insertions and 634
deletions. As a result of positional annotations, a total of 467 novel protein coding
heterozygous variations (437 exonic, 12 exonic splicing variant and 18 intronic
splicing variant) and 126 novel protein coding homozygous variations (121 exonic, 3
exonic splicing variant and 2 intronic splicing variant) were detected (Table 3.15).
3.4.3 Functional annotation of the novel homozygous variants
Since the family pedigree revealed an autosomal recessive inheritance, the
patients would carry a homozygous mutation. After the exclusion of the previously
reported dbSNP32 variants, the variants were evaluated according to their positions.
126 novel protein coding homozygous variations (See Appendix C for the full list of
the variants) were selected for further functional annotation according to their exonic
function. As a result, novel protein coding homozygous variants classified as
frameshift deletion, frameshift insertion, nonframeshift deletion, nonframeshift
insertion, synonymous SNV, and nonsynonymous SNV (Figure 3.11). The 92 protein
altering variations were selected for further analysis.

86
Table 3.15: Statistics of the novel genetic variants filtered by using dbSNP32 database
Functional Annotation
Protein Coding Noncoding Regions
Total Exonic Exonic;
splicing
Splicing Intergenic Intronic ncRNA Upstream;
downstream
UTR
SNPs filtered by dbSN132 15470 480 8 4 5981 7407 674 570 346
Novel variants 19855 558 15 20 7466 9412 888 923 573
Novel Heterozygous variants 16798 437 12 18 6410 8056 717 710 438
SNVs 3188 87 2 5 1263 1482 151 115 83
Insertions 7948 311 10 8 2859 3820 321 369 250
Deletions 5662 39 0 5 2288 2754 245 226 105
Novel Homozygous variants 3057 121 3 2 1056 1356 171 213 135
SNVs 1736 111 2 1 544 705 102 170 101
Insertions 687 6 1 1 264 333 34 27 21
Deletions 634 4 0 0 248 318 35 16 13
Abbreviations used in this table: SNV, single nucleotide variation; ncRNA, noncoding RNA; UTR, untranslated region

87
Figure 3.11: Functional annotation of the novel homozygous coding variants
3.4.4 Population Screening
According to the NCBI database dbSNP build 132 (2010) contains 19,727,605
validated SNPs which were used to filter non-pathogenic variants. Meanwhile, with
the development of the next generation sequencing technology, sequencing of
individual genomes has become possible. As a consequence, open source public
databases that contain catalogue of common and rare variations generated. These
databases can be ordered as 1000 genomes, NHLBI Exome Sequencing Project,
Database of Structural Variants and International HapMap Project.
The 92 protein altering variations (exonic splicing, intronic splicing,
nonsynonymous SNVs, frameshift indels) were further filtered using these databases
with the criteria that if the MAF of the common variant was lower than 0.1%. Actually,
allele frequency of 1% or higher is the classic definition of the polymorphism, but at
coding regions the allele frequencies have reduced down towards 0.1% [100]. As a
3
5
1
1
32
79
2
3
Frameshift deletion
Frameshift insertion
Nonframeshift deletion
Nonframeshift insertion
Synonymous SNV
Nonsynonymous SNV
Intronic; splicing
Exonic; splicing
0 20 40 60 80 100

88
result, 10 homozygous novel coding missense SNVs and one homozygous novel
coding nonframeshift deletion (Table 3.16).
Four of the 11 coding variants (ZNF234 p.G602E, MEGF8 p.V2502I,
CYP2A6 p.V80M, MBD3L3 p.G124S) were excluded by screening the unpublished
exome sequencing data of Yale University of 2400 individuals with non-neurological
disorders. Seven missense variants (ATP8A2 p.I376M, APBA3 p.A97T, MUC16
p.A6352V, MUC16 T6290I, ZNF823 p.C250R, SERINC3 p.M116T, PCP2 p.E6) with
minor allele frequency of 0.1% or higher were selected for further analysis (Table
3.16).
3.4.5 Exclusion of the variants
Figure 3.12 summarizes the analysis, annotation and exclusion of the genetic variants
determined used targeted next generation sequencing of the homozygous regions of
the affected individual (05-996).
3.4.5.1 Database Search
As a first step in determination of the disease causing variant, remaining 7 variant were
evaluated in the several databases in order to understand their biological functions (see
Table 3.17). Online Mendelian Inheritance in Man (OMIM) database focuses on the
relationships between genotype and phenotype. We did not find any reported
phenotype related with candidate genes. The Universal Protein Resource (UniProt)
database is a catalog of information on proteins. According to this database none of
candidate genes reported to be involved directly in a neurological function. Kyoto
Encyclopedia of Genes and Genome (KEGG) database shows the molecular functions
of the genes in diverse biological pathways. None of the genes reported to be involved
in a neurological pathway.

89
Table 3.16: Novel homozygous protein altering variants at the targeted region (Copyright © 2012, Rights Managed by Nature
Publishing Group. Adopted from Onat et al., 2012 [64] with permission).
Chr Position Base
change
Het/Hom Gene Segdup Simple
Repeats
dbSNP pgVariation 1000
Genomes
Yale
Data
Candidate SNVs
chr13 25026001 C>G Hom ATP8A2 None None Novel Novel Novel Novel
chr19 3710974 C>T Hom APBA3 None None Novel Novel Novel Novel
chr19 8929391 G>A Hom MUC16 None None Novel Novel Novel Novel
chr19 8929577 G>A Hom MUC16 None None Novel Novel Novel Novel
chr19 11694601 A>G Hom ZNF823 None 1 Novel Novel Novel Novel
chr20 42574904 A>G Hom SERINC3 None None Novel Novel Novel 1
Candidate deletion
chr19 7604325 CTC>- Hom PCP2 None None Novel Novel Novel Novel
Excluded by Yale exome sequencing data
chr19 49353814 G>A Hom ZNF234 None None Novel Novel 1:11,2:0 9
chr19 47571934 G>A Hom MEGF8 None None Novel Novel Novel 11
chr19 46047668 C>T Hom CYP2A6 1 None Novel Novel Novel 13
chr19 7007590 C>T Hom MBD3L3 1 None Novel Novel 1:285,2:11 461
Abbreviations used in this table: Chr, chromosome; SNV, single nucleotide variation; Het, heterozygous, Hom, homozygous; Segdup, segmental duplication

90
Figure 3.12: Schematical representation of the analysis, annotation, and exclusion of
the genetic variants

91
Table 3.17: Database annotation of the novel homozygous protein altering variants
GENE ATP8A2 APBA3 MUC16 MUC16 ZNF823 SERINC3 PCP2
CHR chr13 chr19 chr19 chr19 chr19 chr20 chr19
POSITION (HG_19) 26128001 3759974 9068391 9068577 11833601 43141490 7698326-7698328
TYPE Sub Sub Sub Sub Sub Sub Del
BASE CHANGE C>G C>T G>A G>A A>G A>G CTC>-
CCDS POSITION C1128G C289T G19055A C18869T A748G A347G -
STATUS Coding-missense Coding-missense Coding-missense Coding-missense Coding-missense Coding-missense Coding
AA CHANGE I376M A97T A6352V T6290I C250R M116T E6
UNIPROT
Function: Catalytic activity: May modulate processing of the beta-APP
- May be involved in transcriptional
regulation.
May be involved in cellular transformation.
-
Subcellular Location: Multi-pass membrane
protein.
- Single-pass type I membrane protein.
Secreted, extracellular space.
Nucleus (Probable) Multi-pass membrane
protein
-
Tissue Specificity: - Expressed in all the tissues with
lower levels in brain and testis.
Overexpressed in ovarian carcinomas and
ovarian low malignant (LMP) tumors
- Increased expression in
lung tumor tissues
-
Similarity: Cation transport
ATPase-P family.
Contains 2 PDZ (DHR), 1 PID
domains
Contains 2 ANK repeats, 56 SEA domains Krueppel C2H2-type
zinc-finger family.
Belongs to the TDE1
family
-
Induction: - - Up-regulated in ovarian cancer cells - - -
Polymorphism: - - The number of repeats is highly polymorphic.
- - -
OMİM: - - - - - - -
KEGG PATHWAY - - - - - - -
JAX KO&MGI - Deletion in mutants causes
abnormalities in colon
morphology Surviving
homozygotes display postnatal
viability and decreased life span.
Homozygous null mice are viable and fertile
with no gross histological abnormalities.
Homozygous male mice father larger litters
when crossed to wild-type females.
.
- TDE1 overexpression
reduces apoptosis caused
by serum starvation. Did
not alter cell growth rate,
immortalization, or motility
Mice homozygous for
a null mutation do not
exhibit any detectable
abnormalities.

92
EXPRESSION
Fetal brain 143,9 4,8 4,55 4,55 NA 147,85 NA
Whole brain 41,95 4,15 3,85 3,85 - 564,1 -
Temporal Lobe 74,65 4,2 4 4 - 335,85 -
Parietal Lobe 58,8 4,45 4,25 4,25 - 386,5 -
Occipital Lobe 46,5 4,1 3,9 3,9 - 393,8 -
Prefrontal Cortex 135,45 5,85 5,5 5,5 - 522,75 -
Cingulate Cortex 102,25 4,3 4,1 4,1 - 157 -
Cerebellum 28,75 3,5 3,35 3,35 - 188,3 -
Cerebellum Peduncles 97,05 4,85 4,6 4,6 - 180,25 -
Amygdala 104,3 4,75 4,4 4,4 - 321,95 -
Hypothalamus 138,75 5,35 5 5 - 290,7 -
Thalamus 93,7 4,45 4,2 4,2 - 209,15 -
Subthalamic Nucleus 102,45 4,3 4,2 4,2 - 298,15 -
Caudate nucleus 24,8 3,9 3,7 3,7 - 136,8 -
Globus Pallidus 45,35 3,6 3,55 3,55 - 242,25 -
Olfactory Bulb 8 3,9 3,7 3,7 - 176,8 -
Pons 39,45 4,25 4 4 - 192,65 -
Medulla Oblongata 70,35 4,4 4,2 4,2 - 296,95 -
Spinal cord 15,65 4,75 4,5 4,5 - 146,95 -
Ciliary Ganglion 11,5 3,3 3,15 3,15 - 60,75 -
Trigeminal Ganglion 7,4 3,45 3,4 3,4 - 29,3 -
Thymus 8,4 4,4 4,05 4,05 - 453,85 -
Tonsil 9,05 4,8 4,45 4,45 - 94,1 -

93
Lymph node 8,85 5,1 4,1 4,1 - 88,9 -
Bone marrow 8,95 4,15 3,95 3,95 - 191,8 -
Whole Blood 9 9,15 4,85 4,85 - 399,1 -
Appendix 9,75 4,25 4,2 4,2 - 51 -
Skin 7,2 3,45 3,3 3,3 - 26,85 -
Adipocyte 9,4 4,55 4,35 4,35 - 276,6 -
Thyroid 10,35 10,3 5,35 5,35 - 197,45 -
Adrenal gland 7,7 3,7 3,55 3,55 - 290,4 -
Adrenal Cortex 9,2 4,3 4,25 4,25 - 117,95 -
Prostate 9,85 7,5 5,15 5,15 - 318,9 -
Salivary gland 8,25 4 3,9 3,9 - 28,65 -
Pancreas 7,75 3,55 3,35 3,35 - 62,5 -
Heart 8,95 4,5 4,05 4,05 - 40,65 -
Skeletal Muscle 8,35 3,95 3,9 3,9 - 7,85 -
Smooth Muscle 9,9 5,55 5,15 5,15 - 338,95 -
Uterus 7,55 4,15 4,25 4,25 - 248,95 -
Trachea 8,25 3,9 61,7 61,7 - 201,8 -
Lung 9,2 4,9 4,6 4,6 - 381,25 -
Kidney 7,35 3,4 3,2 3,2 - 127,8 -
Liver 9,65 4,55 4,25 4,25 - 105,45 -
Placenta 9,35 5 4,85 4,85 - 762,4 -
Ovary 6 3 2,85 2,85 - 59,65 -
Testis 9,2 4,25 4 4 - 393,35 -
Abbreviations used in this table: Chr, chromosome; sub, substitution; del, deletion; aa, amino acid; ccds, consensus coding sequence

94
Next, the candidate genes were searched in The Jackson Laboratory Knock-
Out (JAX KO) Mice and Mouse Genome Informatics (MGI) databases (Table 3.17).
As a result, mice knock-out models of APBA3, MUC16, SERINC3, and PCP2 have
been identified.
Deletion of APBA3 in mice causes morphological and physiological
abnormities in colon. Blood urea nitrogen levels increase while serum chloride,
sodium and potassium levels decrease in these mice. Surviving APBA3 homozygote
knockouts display diarrhea, postnatal viability and decreased life span. MUC16
homozygous null mice are viable and fertile with no histological abnormalities.
SERINC3 is a member of TDE1 (Tumor Differentially Expressed) family.
TDE1 overexpression reduces apoptosis but did not alter cell growth rate,
immortalization, or motility.
Next, mice homozygous for a null mutation in PCP2 do not exhibit any
detectable abnormalities. To conclude, none of the candidate genes is reported to be
involved in neurological processes.
Lastly the candidate genes corresponding to 7 candidate variants were
evaluated in several open source databases including Database of Genomic Variants
(DGV) [101], The Allele FREquency Database (ALFRED) [102], SNPper [103],
Cancer Genome Anatomy Project – Genetic Annotation Initiative (CGAP-GAI,
http://gai.nci.nih.gov/cgap-gai/) , Japanese SNP (JSNP) [104], Functional SNPs (F-
SNP) [105], SPSmart [106], National Human Genome Research Institute Genome
Wide Association Studies (NHGRI GWAS) [107] for genomic variants. As a result,
five functional SNVs for MUC16, one functional SNV for ZNF823 and on functional
SNV for PCP2 were detected. However, no reported functional indels, genomic and
structural SNVs/indels, CNVs, or associated SNPs were detected (Table 3.18).

95
Table 3.18: Evaluation of the candidate genes in several databases
Database ATP8A2 APBA3 MUC16 ZNF823 SERINC3 PCP2
International HapMap Project HapMap - - - - - -
Genomic Variants DGV - - - - - -
Genome-Wide Association studies NHGRI - - - - - -
OMIM disease associations NCBI - - - - - -
ALFRED USNatSciFnd - - - - - -
SNPper CHIP - - - - - -
CGAP SNP index NCI - - - - - -
SPSmart Meta Search USC - - - - - -
F-SNP (functional SNPs) Queen's Uni - - - - - -
CGAP-GAI NCI - - - - - -
JSNP Database Uni of Japan - - - - - -
NHLBI ESP Uni of Wash 1 splice-3 1 splice-5 5 nonsense
2 splice-5
1 nonsense 1/4873 1 nonsense
1 splice-5
Abbreviations used in this table: DGV, Database of Genomic Variants; NHGRI, National Human Genome Research Institute; NCBI, National Center for Biotechnology Information; USNatSciFnd, U.S.
National Science Foundation; NCI, National Cancer Institute; USC, University of South California; Uni, university; CGAP-GAI, Cancer Genome Anatomy Project-Genetic Annotation Initiative; ESP,
Exome Sequencing Project

96
3.4.5.2 Segregation Analysis by haplotype construction
Segregation analysis is achieved in order to determine if the selected candidate genes,
underling the distribution in CAMRQ family, were inherited in Mendelian autosomal
recessive manner.
Segregation analysis was facilitated by haplotype construction and confirmed
by Sanger sequencing. Haplotype construction of the all homozygous regions was
carried out using Affymetrix 10K genotyping data which was generated using DNA
of the selected family members (05-992, 05-993, 05-994, 05-995 and 05-996). In
addition, markers D13S221, D13S283, D13S742, D13S787, D13S1243, and
D13S1294 were used to confirm the linkage disequilibrium among the affected
individuals for the most likely candidate locus on chromosome 13q12 (Figure 3.13,
Figure 3.14, and Figure 3.15). As a result, four of the 7 candidate variants were
excluded by segregation analysis. Confirmation of the haplotyping analysis carried our
using Sanger sequencing of the excluded variants in three affected individuals (05-
993, 05-994, and 05-996) (Figure 3.16).
All in all, a 3-bp in-frame deletion (PCP2 p.E6del) and two missense variants
(ATP8A2 p.I376M and APBA3 p.A97T) were determined to be consistent with the
recessive inheritance of the disease allele in the family (Table 3.19).

97
Figure 3.13: Pedigree of Family C with haplotype structure of the disease interval on
chromosome 13q12. Haplotype segregating with the disease is boxed. ATP8A2
p.I376M variant is bold. Positions are given as Mb. Please note that the DNA of one
affected individual is not available for the study. (Copyright © 2012, Rights Managed
by Nature Publishing Group. From Onat et al., 2012 [64] with permission).

98
Figure 3.14: Haplotype structure of homozygous region on chromosome 19.
Haplotype segregating with the disease on chromosomal region 19:3,136,845-
14,337,400 is boxed. APBA3 p.A97T, PCP2 p.E6del, MUC16 p.T6290I, MUC16
p.A6352V and ZNF823 p.C250R variants are bold. Positions are given as Mb.
(Copyright © 2012, Rights Managed by Nature Publishing Group. From Onat et al.,
2012 [64] with permission).

99
Figure 3.15: Haplotype structure of homozygous region on chromosome 20.
Haplotype segregating with the disease on chromosomal region 20:41,015,889-
45,954,292 is boxed. SERINC3 c.1128 C4G variant is bold Positions are given as Mb.
(Copyright © 2012, Rights Managed by Nature Publishing Group. From Onat et al.,
2012 [64] with permission).

100
Figure 3.16: Segregation analysis of the variants in the affected individuals (05-993,
05-994 and 05-996) by using Sanger sequencing. The variants (a) ZNF823 p.C250R
(b) SERINC3 p.M116T (c) MUC16 p.A6352V and (d) MUC16 p.T6290I do not co-
segregate with the disease.

101
Table 3.19: Novel coding variants identified by targeted next-generation sequencing of 05-996. (Copyright © 2012, Rights Managed by
Nature Publishing Group. From Onat et al., 2012 [64] with permission).
Gene Position (hg19) Base
Change Effect
dbSNP
132 pgVar 1000g 2400e
GERP
(Score)
PhyloP
(Score)
SIFT
(Score)
Polyphen2
(Score)
M.Taster
(p-value)
Candidate Variants
ATP8A2 chr13:26.128.001 C>G I376M Novel Novel Novel 0 2,18 1,091 D. (0,02) P.D. (1,00) D.C. (0,995)
APBA3 chr19:3.759.974 C>T A97T Novel Novel Novel 0 -4,11 -0,308 T. (0.16) B. (0,14) P. (0,999)
PCP2 chr19:7.698.326 CTC>- E6del Novel Novel Novel 0 N.A. 0,168 N.A. N.A. P. (0,717)
Variants not cosegregated with the disease phenotype in the family
MUC16 chr19:9.068.391 G>A A6352V Novel Novel Novel 0 -1,45 -0,803 N.A. N.A. P. (0,999)
MUC16 chr19:9.068.577 G>A T6290I Novel Novel Novel 0 2,35 2,273 N.A. N.A. P. (0,999)
ZNF823 chr19:11.833.601 A>G C250R Novel Novel Novel 0 0,63 1,532 D. (0,00) P.D. (1,00) P. (0,994)
SERINC3 chr20:43.141.490 A>G M116T Novel Novel Novel 1 3,98 2,524 T. (0,34) B. (0,13) D.C. (0,999)
Variants excluded with population screening
MBD3L3 chr19:7.056.590 C>T G124S Novel Novel 45:02,2 461 0,74 -0,345 T. (0,58) Ps.D (0,70) P. (0,999)
CYP2A6 chr19:41.355.828 C>T V80M Novel Novel Novel 13 2,72 1,568 T. (0,10) P.D. (0,99) P. (0,996)
MEGF8 chr19:42.880.094 G>A V2502I Novel Novel Novel 11 5,11 6,197 T. (0,06) P.D. (0,99) P. (0,996)
ZNF234 chr19:44.661.974 G>A G602E Novel Novel 11:02,2 9 1,89 2,503 D. (0,04) P.D. (0,99) P. (0,970)
Abbreviations used in this table: M.Taster, MutationTaster, D., Damaging; T., Tolerated; P.D., Probably Damaging; Ps.D, possibly damaging; B., Benign; N.A., Not Available; D.C., Disease Causing; P.,
Polymorphism, 1000g, 1000 genomes; 2400e, Yale exome sequencing project; pgVar, pgVariation database; chr, chromosome

102
3.4.5.2 Exclusion of the APBA3 as the disease causing gene
Amyloid beta (A4) precursor protein-binding, family A, member 3 (APBA3), p.A97T
variant was excluded from the study based on the conservation considerations and
prediction analyses. Protein sequences of the sequenced species are downloaded from
Ensembl database and alignments done using CLC Workbench 6. Multiple sequence
alignment and conservation analysis revealed that four of 20 species (O. garnetti, S.
scrofa, C. porcellus, S. tridecemlineatus) sequenced have threonine (T) at the
orthologous site (Figure 3.17). Pair-wise alignment of the APBA3 in 46 vertebrates
carried out using USCS Genome Browser Multiz Alignments tract which revealed two
more species (O. garnetti, I. tridecemlineatus, and T. nigroviridis) sequenced have
threonine (T) at the site (Figure 3.18). These results suggest that this variant would be
a polymorphism and not damaging to humans.
Next, the secondary structures of the both wild-type and mutant APBA3
protein sequences were predicted using Protein Structure Prediction Server
(PSIPRED) v.3.0. As a result, the p.A97T amino acid change had no effect on protein
secondary structure (Figure 3.19). Additionally, the p.A97T alteration did not reside
in any of the three protein family domains (one PID, phosphotyrosine interaction
domain; two PDZ domains) found by Protein Families (Pfam) database (Figure 3.20).
Next, evolutionary conservation analysis by prediction tools used to improve
multiple alignment results. GERP identifies the substituted elements in multiple
alignments. The presence of the substitutions reveals a neutral element; the absence of
the substitutions reveals a functional constraint. A negative GERP score (-4.11) for the
mutated nucleotide suggests that this site is probably evolving neutrally. PhyloP
algorithm computes conservation or acceleration p-values based on a model of neutral
evolution. PhyloP score of the variant (-0.308) suggests a faster evolution than
expected for this site. Furthermore, web-based SIFT, PolyPhen2 and MutationTaster
tools predict whether an amino acid substitution affects protein function. The
predictions based on conservation of the residues in sequence alignments. The variant
was predicted as “tolerated” by SIFT (SIFT score, 0.16), “benign” by PolyPhen2

103
(PSIC score difference, 0.0) and “polymorphism” by MutationTaster (p-value, 0.999)
(Table 3.19).
In conclusion, conservation analysis using multiple and pair-wised alignments
together with the prediction of mutant secondary protein structure, protein family
domains, and amino acid substitution effect on protein function strongly suggest that
this variant is a neutral polymorphism.
Figure 3.17: Amino acid sequence homology of the APBA3 protein. Conservation
analysis of the APBA3 p.A97T variant among 20 species sequenced. Four of the 20
species have threonine (T) at the mutation site. A97T residue is represented with a box.
The bootstrap values on the tree represent the phylogenetic distances. (Copyright ©
2012, Rights Managed by Nature Publishing Group. From Onat et al., 2012 [64] with
permission).

104
Figure 3.18: Conservation analysis of the APBA3 p.A97T variant among 46 species
sequenced using pair-wise alignment. A97T residue was represented by red arrow.

105
Figure 3.19: The PSIPRED protein secondary structure prediction of the wild-type and
mutant sequences of APBA3
Figure 3.20: Pfam domain analysis of the APBA3. p.A97T variant do not reside in any
of the three domains found. The numbers represent the amino acid positions of the
protein.

106
3.4.5.3 Exclusion of the PCP2 as the disease causing gene
Purkinje cell protein-2 (PCP2) is highly expressed in cerebellar Purkinje cells and
retinal bipolar neurons. The expression pattern of Pcp2 reveals a role in the
development of CNS.[108] However, its function remains unknown. Mice
homozygous for null PCP2 mutation do not exhibit any detectable phenotypic change
such as loss of balance, intention tremor, and ataxia which are associated with
cerebellar defects in humans. Also, the structure and shape of Purkinje cells is not
affected in these knock-out mice.[109-112]
PCP2 p.E6del variant was excluded from the study based on population
screening. The 180 healthy control individuals which were from the geographically
same region with the family were selected for genotyping using RFLP. In 360 healthy
chromosomes, four heterozygous individuals were identified and verified by Sanger
sequencing (Figure 3.21). This yields an expected homozygote frequency of
approximately 1 in 8,000 which is much higher than expected.
Multiple and pair-wise sequence alignments of the region containing the
mutation suggested that it was not conserved among species. PCP2 p.R6 is deleted in
eight of the 20 species sequenced (Figure 3.22 and Figure 3.23), and the deletion was
also predicted as “polymorphism” by MutationTaster (p-value, 0.717) (Table 3.19).
To conclude, population screening together with the literature searches
involving gene knock-outs and the conservation considerations using multiple and
pair-wise alignments and the prediction tools strongly revealed that this variant is a
neutral polymorphism.

107
Figure 3.21: Confirmation of the PCP2 p.E2del variant by Sanger sequencing.
Sequence data of family members (05-992 and 05-993) and unrelated healthy
individuals (wild type: 10-120; carriers: 10-237, 10-245, 10-350, 10-373) are shown.
(Copyright © 2012, Rights Managed by Nature Publishing Group. From Onat et al.,
2012 [64] with permission).

108
Figure 3.22: Amino acid sequence homology of the PCP2 protein. PCP2 p.E6del
variant is represented with a box. The bootstrap values on the tree represent the
phylogenetic distances. (Copyright © 2012, Rights Managed by Nature Publishing
Group. From Onat et al., 2012 [64] with permission).
Figure 3.23: Conservation analysis of the PCP2 p.E6 variant among 46 species
sequenced using pair-wise alignment. p.E6 residue was represented by red arrow.

109
3.4.6 ATP8A2 p.I376M as the disease causing mutation
The remaining variant at chr13:26,128,001 (hg19; c.1128 C>G) results in an isoleucine
(I) to methionine (M) substitution at residue 376 and is located in exon 12 of ATPase,
aminophospholipid transporter, class I, type 8A, member 2 (ATP8A2,
ENSG00000132932, ENST00000381655) gene. The mutation co-segregated with the
disease in the family (Figure 3.13).
The longest isoform of the ATP8A2 encodes 1,148 amino acids. According to
the Pfam database, the protein has 2 protein family domains; E1 E2 ATPase domain
at amino acids 123-396 and haloacid dehalogenase-like hydrolase (HAD) domain at
amino acids 425-830. The mutation lies in the C terminal transmembrane site of E1
E2 ATPase domain (Figure 3.24).
Figure 3.24: Graphical representation of the predicted functional and structural
elements of ATP8A2 protein. ATP8A2 is composed of an E1 E2 ATPase domain and
a haloacid dehalogenase-like hydrolase (HAD) domain. Ten transmembrane domains
were predicted by TMPRED. The mutation represented by red dot lies in the
transmembrane region of C-terminal end of E1 E2 ATPase domain. (Copyright ©
2012, Rights Managed by Nature Publishing Group. From Onat et al., 2012 [64] with
permission).

110
ATP8A2 is a multi-pass transmembrane protein. Web-based TransMembrane
Prediction (TMpred, http://www.ch.embnet.org/software/TMPRED_form.html) tool
makes a prediction of regions spanning membrane and their orientation. According to
TMpred predictions, ATP8A2 has 10 membrane spanning transmembrane helices
(Table 3.20). The p.I376M mutation lies inside the fourth transmembrane spanning
domain represented in Figure 3.24.
Table 3.20: Locations and orientations of the predicted transmembrane helices of
ATP8A2
Transmembrane
Helices
Start End Length Score Orientation
1 95 113 -19 1176 inside-out
2 118 137 -20 1093 outside-in
3 317 338 -22 2534 inside-out
4 363 382 -20 1489 outside-in
5 888 906 -19 1457 inside-out
6 913 931 -19 1425 outside-in
7 965 983 -19 1416 inside-out
8 997 1018 -22 1114 outside-in
9 1030 1049 -20 2317 inside-out
10 1064 1084 -21 1415 outside-in
Since there is no structural model or information known for ATP8A2 protein,
the consequences of the amino acid change were evaluated by comparing the predicted
secondary and tertiary protein structures of the wild-type and mutant ATP8A2 protein
sequences by using web-based PSIPred and HOPE tools. As a result, the wild type
protein is predicted to contain 27 beta-strands and 32 alpha-helices. I376 residue is
located at the N-terminus of the 11th alpha-helix. The mutation enlarges the 11th and
12th alpha-helices and creates an additional alpha-helix at residue 401 (Figure 3.25)

111
Multiple sequence alignment analysis using CLC Workbench 6.0 revealed that
the isoleucine (I) allele conserved in all 19 species sequenced (Figure 3.26). Protein
sequences of the sequenced species are downloaded from Ensembl database.
Additionally, pair-wise alignment of the ATP8A2 in 46 vertebrates carried out using
USCS Genome Browser Multiz Alignments tract which revealed p.I376 is highly
conserved across species (Figure 3.27). In particular the isoleucine residue is
completely conserved across all species sequenced including the most distantly related
ortholog T. nigroviridis determined by bootstrap analysis of the phylogenetic trees.
Human ATP8A2 and T. nigroviridis ATP8A2 have 49.09% similarity with a distance
score of 0.76 (Figure 3.28).
Figure 3.25: The secondary protein structures of the wild-type and mutant ATP8A2
protein sequences predicted by using PSIPRED tool. The wild type protein is predicted
to contain 27 beta-strands and 32 alpha-helices. I376 residue is located at the N-
terminus of the 11th alpha-helix. The mutation enlarges the 11th and 12th alpha-
helices and creates an additional alpha-helix at residue 401. (Copyright © 2012, Rights
Managed by Nature Publishing Group. From Onat et al., 2012 [64] with permission).

112
Next, evolutionary conservation analysis by using prediction tools revealed
that the mutation is under evolutionary constraints. Positive GERP and PhyloP scores
(2.18 and 1.091, respectively) revealed that the mutation evolved as a functional
constraint. Furthermore, the mutation was predicted to be “damaging” (SIFT score,
0.16), “probably damaging” (Polyphen2 PSIC score difference, 0.00) and “disease
causing” (p-value, 0.995) (Table 3.19).
In conclusion, conservation analysis using multiple and pair-wised alignments
together with the prediction of mutant secondary protein structure, protein family
domains, and amino acid substitution effect on protein function strongly suggest that
this variant is a causative mutation.
Figure 3.26: Amino acid sequence homology of the ATP8A2 protein. Multiple amino
acid sequence alignments show the sequence homology of ATP8A2 protein in
vertebrates. I376 residue is indicated with a box. The bootstrap values on the tree
represent the phylogenetic distances. (Copyright © 2012, Rights Managed by Nature
Publishing Group. From Onat et al., 2012 [64] with permission).

113
Figure 3.27: Conservation analysis of the ATP8A2 p.I376M variant among 46 species
sequenced using pair-wise alignment. p.I376 residue, represented by red arrow,
conserved among all species sequenced
Figure 3.28: Phylogenetic tree analysis of multiple sequence alignments of ATP8A2
from 19 sequenced species. Human ATP8A2 is the most similar with P. troglodytes
(98.23%) and less similar with T. nigroviridis (49.09%).

114
Mutation screening in unrelated families, isolated cases and healthy controls is
one of the most popular methods for providing evidence that a candidate gene is
responsible for the disease of interest. Identifying mutations in other families or in two
or more unrelated individuals with the same phenotype and in none of the healthy
individuals strongly suggests that the selected gene is responsible for the diseases.
ATP8A2 c.1128 C>G mutation was evaluated in several healthy and affected
individuals (Table 3.21).
Firstly, the mutation genotyped by allele specific PCR in 58 isolated ataxia
patients of which 12 of them have cerebellar phenotype with or without quadrupedal
locomotion. None of the patients have G allele neither in heterozygous nor in
homozygous state (Table 3.21).
Next, the status of ATP8A2 was evaluated in a cohort of 750 patients with
structural cortical malformations or degenerative neurological disorders including
cerebellar phenotypes in which the causative mutation is still unknown. According to
the SNP genotyping data generated by Illumina Human 370 Duo or 610K Quad
BeadChips none of the patients were found to harbor a homozygous interval (≥ 2.5
cM) surrounding the ATP8A2 locus. Analysis of the exome sequencing data of the
same group did not reveal any mutations, including compound heterozygous
substitutions, in ATP8A2 (Table 3.21).
By allele specific PCR the c.1128 C>G mutation was screened in 1,210 healthy
control chromosomes, including 305 individuals from the same geographic region as
the family. As a result, none of the individuals in this control population have G allele
neither in heterozygous nor in homozygous state. Together with the 1,092 healthy
controls from 1000 genomes database, 6500 healthy controls form Exome Variant
Server database, and exome sequencing data of the 2400 patients with non-
neurological phenotypes, the mutation was screened in 22808 healthy and affected
individuals with a MAF of 0.0 (Table 3.21).

115
Table 3.21: Mutation screening of ATP8A2 p.I376M in isolated cases, healthy
controls, patients with non-neurological phenotypes and databases.
Population A B MAF Ind (#) Method
Turkish Control 610 0 0 305 Allele spesific PCR
Region-matched controls 600 0 0 300 Allele spesific PCR
Yale exomes* 4800 0 0 2400 Exome sequencing
1000 genomes 2182 0 0 1092 WGS
EVS 13000 0 0 6500 Exome sequencing
Yale Patients** 1500 0 0 750 Illumina SNP array
Hacettepe Patients*** 116 0 0 58 Allele spesific PCR
Total 22808 0 0 11404 * The cohort consist of 2400 patients with non-neurological phenotypes
** The cohort consisted of 750 patients with structural cortical malformations or degenerative neurological disorders
*** 58 ataxia patients, 12 had cerebellar phenotype with or without quadrupedal gait Abbreviations used in this table: EVS, Exome variant server; MAF, minor allele frequency; Ind(#), number of the individuals;
WGS, whole genome sequencing
3.5 Characterization of ATP8A2
The transmembrane protein, ATP8A2, consists of three protein coding, one nonsense
mediated RNA decay transcript and two processed transcript isoforms according to
Ensembl database (Table 3.22). The longest isoform (ENST00000381655) contains a
total of 9,575 base pairs long transcript with 37 exons (See Appendix D for the full list
of exons). This transcript encodes a 1,188 amino acids long 112 kD protein
(ENSP00000371070).
Table 3.22: Transcripts of ATP8A2 according to Ensembl database
Name Transcript ID Length
(bp)
Protein ID Length
(aa)
Biotype
001 ENST00000381655 9575 ENSP00000371070 1188 p.c.
003 ENST00000381648 476 ENSP00000371062 141 p.c.
201 ENST00000255283 3674 ENSP00000255283 1123 p.c.
004 ENST00000281620 3891 ENSP00000281620 643 n.m.d
002 ENST00000466079 169 No protein product - p.t.
006 ENST00000491840 2227 No protein product - p.t.
Abbreviations used in this table: p.t., processed transcript; p.c., protein coding; n.m.d., nonsense mediated decay; aa, amino
acid; bp, base pair

116
3.6 Expression of ATP8A2
3.6.1 Real time RT-PCR analysis
ATP8A2 expression studies revealed that the protein is highly expressed in newborn
and embryonic tissues with the strongest expression in mouse heart, brain and
testis.[113, 114] In order to confirm expression profiles of ATP8A2, we analyzed
expression of the transcript ENST00000381655 by using quantitative real-time RT-
PCR and semi-quantitative RT-PCR in a cDNA panel of multiple human tissues (lung,
thyroid, prostate, trachea, skeletal muscle, spleen, liver, adrenal gland, fetal liver,
hearth, kidney, colon, thymus, salivary gland, placenta, big uterus, big testis, whole
brain, and fetal brain). ATP8A2 was detected with the highest levels in testis, whole
brain, trachea, thyroid, and fetal liver (Figure 3.29 and Figure 3.30)
Since the patients have cerebellar phenotype, we evaluated the possible
involvement of ATP8A2 in motor functions by evaluating the expression profile in of
ATP8A2 transcript in different human brain regions (strata parietal cortex, strata
brainstem, strata occipital cortex, strata striatum, strata frontal cortex, corpus callosum,
cerebellum) by quantitative real-time RT-PCR and semi-quantitative RT-PCR.
Human ATP8A2 is expressed in all regions of the brain with the highest level of
expression in the cerebellum (Figure 3.31). ATP8A2 expression in the patients cannot
be evaluated since the gene is not expressed in lymphocytes.
3.6.2 Annotation clustering of early embryonic mouse brain genes
In order to identify predicted biological function of ATP8A2 in brain development, a
bioinformatics approach was performed upon updating related approaches.[115] In
this approach, a large set of genes which are correlated with ATP8A2 were detected
and then categorized by functional annotation clustering (Figure 3.32).

117
Figure 3.29: Expression profiles of ATP8A2 in multiple human tissues. The expression
of the transcript ENST00000381655 was analyzed by using semi-quantitative RT-
PCR. The highest levels of expression was obseved in testis and brain regions.
Figure 3.30: Real-time expression profiles of ATP8A2 in multiple human tissues. The
expression of the transcript ENST00000381655 was analyzed by using quantitative
real-time RT-PCR. The highest levels of expression were detected in testis, fetal liver,
thyroid and trachea.
0
0,5
1
1,5
2
2,5
3

118
Figure 3.31: Real-time expression profiles of ATP8A2 in different human brain
regions. The expression of the transcript ENST00000381655 was analyzed by using
quantitative real-time RT-PCR. The highest levels of expression were detected in
cerebellum. (Copyright © 2012, Rights Managed by Nature Publishing Group.
Adopted from Onat et al., 2012 [64] with permission).
As a first step, expression data set of mouse brains at early embryonic days 9.5,
11.5, and 13,5 (GSE8091) [94] was extracted from the Gene Expression Omnibus
(GEO) database. Expression data were grouped into embryonic days and 3,611
differentially expressed genes were filtered (One-way ANOVA test Bonferroni
corrected p<0.001). By using GeneSpring GX expression data analysis software, 218
genes found to be significantly correlated with ATP8A2 according to their expression
profiles (R>0.95) (Figure 3.33). According to the MGI database, 24 of these genes
were associated with human diseases including neurological phenotypes (Table 3.23).
Especially, ATP8A2 is co-expressed with doublecortin (DCX) which is responsible for
Lissencephaly, X-linked [LISX1; OMIM: 300067] [116], and WD repeat domain 81
(WDR81) which is associated with Cerebellar Ataxia and Mental Retardation with or
Without Quadrupedal Locomotion 2 [CAMRQ2; OMIM: 610185] [29] suggesting that
these genes could represent similar developmental pathways.
0 0,5 1 1,5 2 2,5 3 3,5 4 4,5 5
Corpus collosum
Striatum
Parietal cortex
Whole brain
Brainstem
Fetal brain
Occipital cortex
Frontal cortex
Cerebellum
Fold Change

119
Figure 3.32: Schematic representation of the functional annotation clustering of a set
of genes which are correlated with ATP8A2.
Next, those 218 genes correlated with ATP8A2 expression profile were
evaluated by the Database for Annotation, Visualization and Integrated Discovery
(DAVID) tool. Functional annotation clustering analysis revealed that positively
correlated genes were enriched for those involved in neuron differentiation
(Bonferroni corrected p-value: 2.1E-3), cell and neuron projection morphogenesis
(Bonferroni corrected P values: 1.4E-3, and 1.5E-3, respectively) and axonogenesis
(Bonferroni corrected p-value: 1.9E-3) (see Appendix E for the full list of functional
annotation clusters).

120
Figure 3.33: Graphical representation of the expression profiles of the filtered
differentially expressed genes within day groups. Expression data set of mouse brains
at early embryonic days 9.5, 11.5, and 13.5 were grouped into embryonic days and
3,611 differentially expressed genes were filtered. By using GeneSpring GX
expression data analysis software, 218 genes found to be significantly correlated with
ATP8A2 according to their expression profiles.
-5
-4
-3
-2
-1
0
1
2
3
41 8
15
22
29
36
43
50
57
64
71
78
85
92
99
10
6
11
3
12
0
12
7
13
4
14
1
14
8
15
5
16
2
16
9
17
6
18
3
19
0
19
7
20
4
21
1
21
8
[E9.5] [E11.5] [E13.5]

121
Table 3.23: Genes associated with human diseases which are co-expressed with
Atp8a2
MGI ID Symbol Gene Name MIM
ID
MIM Term
102806 Acvr2a activin receptor IIA 261800 Pierre Robin Syndrome
104311 Ptger4 prostaglandin E receptor 4 607411 Patent Ductus Arteriosus
104741 Nfkbia nuclear factor of kappa light
polypeptide gene enhancer
in B-cells inhibitor, alpha
270150
603165
Sjogren Syndrome
Dermatitis, Atopic
107164 Ppp3ca protein phosphatase 3,
catalytic subunit, alpha
104300 Alzheimer Disease; AD
107978 Klc1 kinesin light chain 1 104300 Alzheimer Disease; AD
108085 Hpgd hydroxyprostaglandin
dehydrogenase
607411 Patent Ductus Arteriosus
1201673 Shox2 short stature homeobox 2 127300 Leri-Weill Dyschondrosteosis
249700 Langer Mesomelic Dysplasia
1277124 Asah1 N-acylsphingosine
amidohydrolase 1
228000 Farber Lipogranulomatosis
1277171 Dcx doublecortin 607432 Lissencephaly 1; LIS1
1354956 Trfr2 transferrin receptor 2 604250 Hemochromatosis, Type 3; HFE3
1858896 Spast spastin 182601 Spastic Paraplegia 4
2135272 Vangl2 vang-like 2 182940 Neural Tube Defects
2148705 Foxp2 forkhead box P2 602081 Speech-Language Disorder 1;
SPCH1
2389465 Tbx22 T-box 22 303400 Cleft Palate, X-Linked; CPX
88059 App amyloid beta (A4)
precursor protein
104300 Alzheimer Disease; AD
96015 Hba-a1 hemoglobin alpha,
adult chain 1
141800
141900
Hemoglobin--Alpha Locus 1
Hemoglobin--Beta Locus
96432 Igf1 insulin-like growth
factor 1
601489 Insulin-Like Growth Factor-
Binding Protein, Acid-Labile
Subunit; IGFALS
96909 Maf avian musculoaponeurotic
fibrosarcoma
610202 Cataract, Pulverulent, Juvenile-
Onset
97530 Pdgfra platelet derived growth
factor receptor, alpha
142340 Diaphragmatic Hernia, Congenital
98347 Snrpn small nuclear
ribonucleoprotein N
105830
176270
Angelman Syndrome; AS
Prader-Willi Syndrome; PWS
98371 Sox9 SRY-box containing gene 9 114290 Campomelic Dysplasia
98737 Thbs1 thrombospondin 1 270150 Sjogren Syndrome
99414 Id4 inhibitor of DNA binding 4 166710 Osteoporosis
99846 Gdi1 guanosine diphosphate
dissociation inhibitor 1
300104 GDP Dissociation Inhibitor 1;
GDI1
2681828 Wdr81 WD repeat domain 81 610185 Cerebellar hypoplasia, mental
retardation, and quadrupedal
locomotion 2

122
Chapter 4
Discussion
CAMRQ is a rare genetically heterogeneous disorder characterized by cerebellar
ataxia, mental retardation and dysarthric speech with or without quadrupedal gait.[28,
31] The first locus was mapped to chromosomal region 17p13 in Family B [31] and
the causative mutation identified in WDR81 using homozygosity mapping and targeted
next generation sequencing.[29] Two additional loci have been mapped so far on
chromosomes 9p24 and 8q12 in consanguineous families, and causative mutations
have been identified in VLDLR and CA8, respectively, using genome-wide linkage
analysis and candidate gene sequencing.[32, 35]
In this thesis, identification of the fourth gene locus in a consanguineous family
of two affected siblings and an affected nephew with CAMRQ inherited with
autosomal recessive transmission is described (Figure 1.3).
4.1 Disease Gene Identification
Disease gene identification amongst thousands of variants obtained via next generation
sequencing is a major challenge, and requires prioritization of the novel variants

123
depending on the number of affected individuals which are clinically well-
characterized and availability of the family members, the inheritance pattern, the
severity and frequency of the disease. Figure 3.10 summarizes the strategy followed
in this study to identify disease-causing gene.
Whole genome homozygosity mapping analysis, which is a powerful technique
to map recessive traits in consanguineous families, revealed 23 shared homozygous
regions in the three affected individuals. Candidate gene prioritization among 563
genes at the homozygous blocks and Sanger sequencing did not revealed a causative
mutation segregated with the disease in the family.
The high number of shared homozygous regions detected by 250K SNP arrays
gave rise to thought that SNPs were detected with less accuracy which would result in
non-contiguous homozygous regions due to low number of informative SNPs. A
recent study presented that 250K arrays is problematic in detection of homozygosity
since they have high false-positive heterozygosity rate (>4%) and low SNP density
with more non-informative alleles. These non-informative alleles generate additional
homozygosity peaks appear as backgrounds.[117] These backgrounds can be
eliminated either by linkage calculation with parental genotypes or by recently
developed more comprehensive SNP arrays. These high-resolution arrays are more
informative compared with 250K SNP arrays since they have high density of SNPs
and also contain HapMap-derived-SNPs with high heterozygosity rate.[117]
The problem is achieved by repeating the homozygosity mapping with more
comprehensive high-resolution genome-wide arrays in two affected individuals, which
in turn revealed four contiguous common homozygous intervals. These regions
contain a total of 882 genes with 2,263 transcripts and 16,935 exons, so a genome-
wide approach was determined. By using targeted enrichment of the homozygous
regions and next generation sequencing several missense variants were identified.
These variants were annotated and filtered using segregation analysis, population
screening, protein conservation, and disease gene prediction approaches.

124
Consequently, a novel missense variant in ATP8A2 (c.1128 C>G; p.I376M) is
identified as the causal mutation that segregates with the phenotype in the family.
4.2 Overview of Variant Filtration and Prioritization
With the development of the high-resolution genotyping arrays and the next-
generation sequencing technologies, human disease gene identification is greatly
facilitated.[29, 118, 119] However, in majority of the cases multiple candidate
variations on many candidate genes detected. Among these, none of the variants could
be on a gene with a protein product or cosegregate with the phenotype in the family.
The mutation could be on an uncharacterized gene or present only in one isoform. The
mutation could be a missense so did not cause a truncated protein. In such situations,
in order to demonstrate the causality of the identified gene, two or more independent
cases with a mutation on the corresponding gene should be identified.
In the absence of independent cases, where the mutation is associated with an
extremely rare and genetically heterogeneous autosomal recessive phenotype as in our
unique consanguineous family, narrowing the list of potential genetic culprits by
excluding the harmless ones could be applied (Figure 2.4 and Figure 3.12).
Improvements in bioinformatics likely increased the success rate of identifying the
disease causing gene. The first filtering step is the exclusion of the variants which are
previously reported by NCBI dbSNP because these variants assumed to be non-
pathogenic. However, the criteria for SNP filtering should depend on the allele
frequencies or genotyping rates since more than six million SNPs in this database
identified by the SNP discovery projects and not curated to be involved in disease
pathogenesis.[120] Thus, by definition of a polymorphism, SNPs with MAFs greater
than 1% which fit the Hardy-Weinberg equilibrium should be selected as a filtering
criterion.[121]
The second step involves screening of the variations for novelty with
comparison to personal genome databases and previous exome sequencing databases.

125
The remaining variants that match with the previously detected variants by next
generation sequencing projects could be further excluded using open source public
databases that contain catalogue of common and rare variants such as 1000 genomes,
NHLBI Exome Sequencing Project, Database of Structural Variants and International
HapMap Project. The screening of the candidate variations in the geographically
and/or ethnically matched unaffected individuals would distinguish the putative
mutation from the unknown rare SNPs.
Disease phenotypes are due to mutations that cause amino acid changes which
result in the loss of a critical protein function.[122] Thus, the variants annotated
according to the positions and their effects on the protein function. The protein altering
variants including nonsynonymous SNPs, frameshift coding insertions/deletions and
splice site variants could be pathogenic and potential disease causing candidates. These
candidates should be further evaluated in the family to determine whether the gene
cosegregated with the phenotypic trait.
Another filtering option is the functional annotation of the variants in several
databases. OMIM database contains several germ-line mutations associated with
corresponding phenotypes.[123] Association of a gene with a phenotype allows
comparison of the phenotypic similarities so the genes associated with the irrelevant
phenotypes could be excluded from further analysis. Besides that, mice knock-out or
knock-in studies provide useful information for understanding the role of the genes
since they are the most closely related animals to humans.[124] The loss of gene
expression in mice often causes phenotypic changes which could be compared with
the human disease phenotypes. Databases such as JAX KO and MGI collect those
information which can be used to evaluate candidate genes. Other databases including
KEGG, UniProt, DGV, F-SNP, etc. were given in (Table 2.1)
Next, conservation analysis would provide evolutionary comparison between
cross-species and give information about the predicted deleteriousness of the amino
acid change. The region where the mutation resides in a gene would be evolutionary
conserved across species. In addition, several tools can be used to predict the impact

126
of potential causal substitutions according to their effect on protein secondary
structure.[62] As a result of multiple sequence alignments across species sequenced
and consequences of the prediction tools, the variants with the mutant allele at many
orthologous species at the same site and with no effect on protein structure could be
considered as non-pathogenic, and could not be involved in the disease pathogenesis.
Lastly, the fold enrichment and coverage analysis reveal the total number of
reads on each individual bases and how many times those bases are read within the
targeted region. The targeted bases can be classified as zero-coverage bases which did
not read at all, low-coverage bases with 1-3X mean read depth, and high-covered bases
at least four read depths. The analysis revealed a mean coverage depth of 62.96-fold
across the targeted homozygosity intervals with 97.41% of the targeted bases being
covered by at least four reads. Thus, analysis of these non-covered regions including
gaps would be one of the important challenges of the sequencing analysis, since
disease causing mutations at these points could be missed. In sequencing reactions the
non-covered regions are mostly associated with GC-low and GC-rich regions because
they are difficult to amplify because of their secondary structures. These regions
comprise about 1% of the human genome and they are epigenetically important so
need to be evaluated.[125] Evaluation of these regions revealed that only 0.03% of the
targeted bases that are non-covered are located on the constitutive coding exons and
functionally important. This stated that 99.51% of the constitutive regions are covered
by at least four reads (Table 3.12 and Figure 3.9). Evaluation of these genes encoding
for the constitutive exons in the low- or zero-coverage regions were revealed that, they
either do not have cerebellar expression or do not display a phenotype compatible with
cerebellar involvement in mouse knockouts (Table 3.13). These results suggested that
missing a causative mutation at the non-covered regions seems highly unlikely.
All of these strategies are enriched for discrete filtering, stratification, and
functional annotation to explore which of the observed variants are more likely to
affect phenotype. In conclusion, an evolutionary conserved novel missense mutation
in ATP8A2 gene segregated with the CAMRQ in the family remained to be the only

127
causal mutation. However, biological evidence is still necessary in order to
demonstrate the identified mutation is the causal of the phenotype.
4.3 ATP8A2 is associated with CAMRQ
ATP8A2 is one of the members of P4-ATPases subfamily of P-type ATPases, which
are a large group of ion and lipid pumps involved in the transport across membranes.
4.3.1 Biochemical properties of P-type ATPases
The P-type ATPases are calcium pump (Ca+2-ATPase), proton-potassium pump
(H+K+-ATPase), sodium-potassium pump (Na+K+-ATPase), and the plasma
membrane proton pump (H+-ATPase). P-type ATPases include five subgroups: Type
I involves in transition of K+ and heavy metals; type II involves in transition of Ca+2;
type III involves in the transition of H+ and Mg+2; type IV involves in the transition of
aminophospholipids; and type IV in the transition of cations.[126]
P4-type ATPases are key regulators of lipid asymmetry that catalyze transport
by altering the curvature of the phospholipid bilayer by phosphorylation reactions in
order to flip aminophospholipids from the endoplasmic reticulum to the cytoplasmic
leaflet.[127] The best studied ones are the sarcoplasmic reticulum Ca+2-ATPase which
functions in muscle contradiction and plasma membrane associated Na+K+-ATPase
which functions in the stimulation and neuronal cells.[128] Functional analysis and
homology searches revealed that the transport mechanism through P4-type ATPases
conserved among all species.[127]
ATP8A1, the closest homolog of ATP8A2, is the first ATPase identified in
human red blood cells. Biochemical analysis revealed that this ATPase is activated by
aminophospholipids and inhibited by phosphatases. [129] This ATPase was found to
play role in transport across membrane by catalyzing rapid flipping of
128
phosphatidylserine. ATP8A2 was first purified from photoreceptor membranes and
play role in transport across membranes by catalyzing active transport of
phosphatidylserine. [130] Mice deficient for either Atp8a1 or Atp8a2 cannot survive
after birth. This reveals overlapping function of both genes. CDC50 protein family is
reported to play role in export of some types of ATPases from the endoplasmic
reticulum. Both ATP8A1 and ATP8A2 make complex with CDC50A to operate their
function in photoreceptor outer segment membranes. [130] In a more recent study,
downregulation of the CDC50A by using RNA interference technology revealed
reduced neurite outgrowth in PC12 cells which are derived from rat adrenal medulla.
Neurite outgrowth enhanced when ATP8A2 overexpressed in these cells. [131] These
results suggested that ATP8A2-CDC50A complex play role in vesicle formation or
transport across membranes.
4.3.2 Clinical phenotypes associated with P4-type ATPases
P4-type ATPases have been implicated in several phenotypes (Table 4.1). First,
mutations in ATP8B1 is associated with severe human liver diseases such as benign
recurrent intrahepatic cholestasis type 1 (BRIC) and progressive familial intrahepatic
cholestasis type 1 (PFIC1) in humans.[132] Similar to human phenotype, mice
deficient with Atp8b1 suffer from hearing loss due to degeneration of hair cells.[133]
Also, ATP2B2 is reported in a family with three affected individuals as the causal gene
associated with sensorineural hearing loss.[134] Murine ATP8B3 is implicated in
sperm cell capacitation and acrosome formation.[135] In vitro studies with Atp8b3
knock-out sperm cells are deficient in fertilization.[136] P4-type ATPases are also
implicated in complex disorders. Atp10a deficiency in mice leads to increased insulin
levels and hyperglycemia. It is implicated in related disorders such as type-2 diabetes,
obesity, and non-alcoholic fatty liver disease.[137] Besides that Atp10d deficiency is
implicated in lipid metabolism in mice which results in predisposition to obesity,
hyperglycemia, hyperinsulinemia, and hypertension.[138]

129
P4-type ATPases have also been implicated in neurological phenotypes. First
of all, genome-wide association studies revealed a highly significant association
between ATP8B4 gene and Alzheimer’s disease.[139] By using linkage analysis and
candidate gene sequencing ATP13A2 is found to be associated with Kufor-Rakeb
syndrome which is a rare autosomal recessive form of juvenile-onset atypical
Parkinson diseases.[140] Next, imprinting mutations in maternally expressed ATP10C
gene is associated with Angelman syndrome.[141] In addition heterozygous mutations
leads haploinsufficiency of ATP1A2 which is responsible for familial hemiplegic
migraine type 2.[142] Mice deficient with Atp8b2 have impaired motor coordination
and represents cerebellar ataxia.[143] In a very recent study, a missense mutation in
ATP2B3 was identified in a family by using X-exome sequencing as a cause of X-
linked congenital cerebellar ataxia.[144] Lastly, Atp8a1 deficiency, which is the
closest homolog of Atp8a2, leads to increase in phosphatidylserine externalization in
hippocampus and associated with delayed hippocampus-dependent learning.[145]
4.3.3 Clinical phenotypes associated with ATP8A2
ATP8A2 haploinsufficiency is reported in a patient with a de novo t(10;13) balanced
translocation leading to disruption of ATP8A2 gene. The patient represents severe
neurological phenotypes including severe mental retardation and major hypotonia
which brings into attention the clinical findings of carriers in Family C.[114] The
translocation carrier shares partially overlapped phenotype with the affected members
of Family C whereas the carriers of ATP8A2 p.I376M mutation (05-992 and 05-995)
did not show any detected neurological abnormalities. This suggests that ATP8A2
mutations should represent a clinical heterogeneity in humans, and demonstrates
fundamental features of genomic analysis of human traits such as variable expression,
allelic heterogeneity, and genotype–phenotype correlations.

130
Table 4.1: Clinical phenotypes associated with P4-type ATPases
Gene Phenotype Species Reference MIM ID
ATP8B1 Progressive familial intrahepatic
cholestasis type 1
human [129] 211600
ATP8B1 Benign recurrent intrahepatic
cholestasis type 1
human [130] 243300
ATP2B2 Deafness, autosomal recessive 12 human [131] 601386
ATP8B3 Impairment in sperm cell acrosome
formation and capacitation
murine [132] -
Atp8b3 Inability to fertilize mice [133] -
Atp10a Obesity, type-2 diabetes, and non-
alcoholic fatty liver disease
mice [134] -
Atp10d Obesity, hyperglycemia,
hyperinsulinemia, and hypertension
mice [135] -
ATP8B4 Alzheimer’s disease human [136] 104300
ATP13A2 Parkinson disease 9 human [137] 606693
ATP10C Angelman syndrome human [138] 105830
ATP1A2 Migraine, familial hemiplegic, 2 human [139] 602481
Atp8b2 Cerebellar ataxia mice [140] -
ATP2B3 X-linked congenital cerebellar ataxia human [141] -
Atp8a1 Delayed hippocampus-dependent
learning
mice [142] -
Atp8a2 Ataxia and body tremors mice [143] -
ATP8A2 Mental retardation and major
hypotonia
human [114] -
There are several examples of heterozygous and homozygous mutations in the
same gene causing similar phenotypes. First, both CRYBB1 homozygous and
heterozygous mutations cause congenital cataract.[147] Another example is
Zweymuller Weissenbacher syndrome, caused by heterozygous and homozygous
mutations in COLL11A2.[148] A deleterious homozygous mutation in MYBPC1
causes arthrogryposis that is more severe than that caused by heterozygous missense
MYBPC1 mutations.[149] The osteopetroses are caused by defects in ClCN7 or ATP6i
genes. They range from a devastating autosomal recessive neurometabolic disease to

131
more benign autosomal dominant conditions affecting adults.[150, 151] Menkes
disease is an X-linked disorder caused by mutations in ATP7A gene, but variable forms
exist such as occipital horn syndrome, which is the mildest form.[152] Autosomal
recessive lethal congenital contractural syndrome is a severe form of neuromuscular
arthrogryposis. SPG7 mutational screening in spastic paraplegia patients supports a
dominant effect for some mutations and autosomal recessive hereditary spastic
paraplegia.[153] It is noteworthy that in all these examples, the mutations causing the
recessive phenotypes are more severe than the dominant phenotypes. This is likely due
to the fact that the heterozygous mutations have dominant-negative effect where
recessive mutations are dramatically disrupt the encoded protein resulting in a normal
wild-type phenotype of the heterozygous individuals.
The wabbler lethal mice colonies with spontaneous homozygous mutation
were present in the Jackson Laboratory since 1952. These mice represent phenotype
with severe neurological abnormalities including ataxia and body tremors.[154] In a
recent study, genetic approaches revealed that these spontaneous mutations located in
the Atp8a2 gene. Further biochemical analysis represented that the phenotype occurs
due to axonal degeneration since loss of phosphatidylserine translocase activity of
Atp8a2 disrupts axonal transport in the motor neurons and accumulation of
phosphorylated neurofilaments.[146]
These findings suggest that ATP8A2 could be critical for the developmental
processes of central nervous system and alterations of this gene may lead to severe
neurological phenotypes.
4.3.4 ATP8A2 p.I376M mutation
The disease causing variant (c.1128C>G) located at chr13:26128001 in exon 12 of
ATP8A2 gene and results in an isoleucine (I) to methionine (M) substitution at residue
376. There is no structural model for ATP8A2 protein so the consequences of the
amino acid change are predicted. The protein is predicted to contain 27 β-strands and

132
32 α-helices. I376 residue is located at the N terminus of the 11th α-helix. The
substitution predicted to alter secondary protein structure by enlarging the 11th and
12th α-helices and creating an additional α-helix at residue 401.
The mutation lies in the predicted C-terminal-transmembrane site of the E1 E2
ATPase domain. The domain is present on the loop of ATPase which is essential for
the metal ion binding [155] and is highly conserved across species.
The wild-type residue is a methionine which is a hydrophobic and flexible
residue of intermediate size. It is mutated into an isoleucine which is also hydrophobic
and of an intermediate size. However, the shape of isoleucine is different, its side-
chain is beta-branched and less flexible. The mutation might cause sterical hindrance
with other side-chains that are surrounding the residue. In a transmembrane domain
hydrophobic residue can be located on the surface of the protein, making interactions
with hydrophobic membrane lipids. The mutation can affect these interactions. It is
also possible that the residue is located on the inside of the helix, facing the other
transmembrane helices. In that case the strong hydrophobic interactions are stabilizing
the protein. Therefore, the mutation might destabilize the protein.
4.3.5 Expression of ATP8A2
Previous studies revealed that Atp8a2 is highly expressed at embryonic and new born
stages. The strongest expression is at the heart, brain and testis tissues during these
stages.[114] Our real time RT-PCR analysis revealed that ATP8A2 expression is high
in the testis, whole brain, trachea, thyroid, and fetal liver.
Since the patients have cerebellar phenotype, we hypothesized that ATP8A2
would possibly involve in motor functions. In order to test our hypothesis, firstly,
expression profile of ATP8A2 was examined in different human brain regions. As a
result human ATP8A2 is expressed in all regions of the brain with the highest level of
expression in the cerebellum. In a very recent study, highest expression of Atp8A2

133
reported in central nervous system including cerebrum, cerebellum, spinal cord, and
retina [146] which together with our expression data confirmed our hypothesis.
Cerebellum is a crucial regulatory organ functioning in the coordination of the motor
activities so that this expression pattern is consistent with CAMRQ.
Biological function of the ATP8A2 in brain development is still a mystery. The
prediction-based bioinformatics approaches such as functional annotation clustering
analysis would provide clues about the function.[115] Functional clustering of the
genes correlated with ATP8A2 according to expression profiles revealed that they
involved in neural pathways such as neuron differentiation, neuron projection
morphogenesis and axonogenesis. Among the genes expressed with ATP8A2,
doublecortin is responsible for X-linked lissencephaly and WDR81 associated with
CAMRQ suggesting that these genes could represent similar developmental pathways.
As well as ATP8A2, CAMRQ associated genes WDR81, VLDLR, and CA8
expressed highly in retina.[156] Since strabismus is observed among all the patients
with CAMRQ reported eye abnormalities may be an additional clinical feature of the
phenotype.
4.3.6 Association with other CAMRQ genes
Expression pattern and functional clustering analysis of the genes responsible for the
CAMRQ syndrome revealed that these genes may be involved in a same or similar
developmental pathways. ATP8A2 gene is a multi-pass transmembrane protein where
VLDLR is a single-pass transmembrane protein. ATP8A2 is an ATP-dependent
transporter of aminophospholipids from outer to inner leaflet whereas VLDLR is a
ligand-dependent transporter of lipoproteins from outer to inner leaflet. CA8 encodes
a carbonic anhydrase VIII protein which inhibits binding of IP3 receptors to ITPR1.
ITPR1 is receptor localized in the intracellular membranes such as endoplasmic
reticulum and plays role in the transport of cytoplasmic Ca+2. Binding of CA8 to ITPR1
inhibits IP3 binding and causes calcium release from endoplasmic reticulum which

134
results in increased Ca+2 levels in the cytoplasm. [157] Increase in the cytoplasmic
Ca+2 levels regulated by a transcription factor, CREB, which is activated by
phosphorylation through calmodulin-dependent kinases such as Reelin. [158] VLDLR
forms complex with Reelin, the cytoplasmic adaptor protein Disabled-1,
apolipoprotein E receptor 2, and Src family kinases which regulates neural migration
during embryonic development. In a more recent study, it is indicated that Reelin
signaling is involved in the Ca+2 influx through NMDA receptors [158] which are
responsible for the synaptic plasticity and memory. [159]
ATP8A2 forms complex with CDC50 and this complex functions in the neurite
outgrowth in PC12 cells and in hippocampal neurons. Increase in the Ca+2 levels
through NMDAR mediated calcium influx also triggers Reelin-dependent
hippocampal neurite outgrowth and dendrite development through Apoer2/Vldlr-Dab1
dependent pathway. [160] Therefore, these data suggest that three genes may play role
in the similar pathways involved in neurite outgrowth and synapse formation.
Similar to ATP8A2, WDR81 also encodes a multi-pass transmembrane
protein, which is predominantly expressed in the cerebellum with unknown in vivo
function. Chracterization and functional annotation of the gene is necessary to draw a
common pathway among these genes.
4.4 Conclusion
A novel missense homozygous variant in ATP8A2 is identified as causal mutation of
the phenotype in three affected individuals with CAMRQ by filtering the all possible
culprit genes using co-segregation analysis, population screening, protein conservation
and disease gene prediction approaches. The mutation segregates with the autosomal
recessive inheritance in the family. The mutation is in a functional transmembrane
domain which is predicted to alter secondary structure of the protein and highly
conserved across species. ATP8A2 is a P4-type ATPase involved in the transportation
of the aminophospholipids across membranes. P4-type ATPases mostly implicated

135
with several neurological phenotypes in both humans and model organisms, especially
Atp8b2 with motor coordination and cerebellar ataxia [143], ATP2B3 with X-linked
congenital cerebellar ataxia [144], and the closest homolog Atp8a1 with delayed
hippocampus-dependent learning.[145] ATP8A2 is mainly expressed in brain tissues,
with highest levels in cerebellum which is a crucial regulatory organ for motor
coordination. The Atp8a2 deficiency in mice revealed impaired axonal transport in the
motor neurons associated with severe neurological phenotype including ataxia and
body tremors.[146] Lastly, a patient with a de-novo-balanced translocation leading to
ATP8A2 haploinsufficiency shares similar neurological phenotypes including severe
mental retardation and major hypotonia with affected individual in Family C. All these
findings are consistent with our observations and strongly suggest a possible role for
ATP8A2 in development of the nervous system especially in motor behavior.

136
Chapter 5
Future Perspectives
CAMRQ is a novel form of autosomal recessive cerebellar ataxias with mental
retardation, dysarthric speech and with or without quadrupedal locomotion. The
condition is phenotypically and genetically heterogeneous since four gene locus
identified so far: VLDLR on chromosome region 9p24 [32], CA8 on chromosome
region 8q12 [35], WDR81 on chromosome region 17p13 [29], and recently ATP8A2
on chromosome region 13q12.[64] The expression profiles of these genes, mouse
knock-out studies, and predictions about their biological roles revealed that these genes
may be involved in similar neurological pathways. Since biochemical analysis is
needed to observe functional common domains or motifs, gene-gene interactions,
differential pathway expression profiles. These data would provide to compare gene-
phenotype correlations and would address the phenotype related differences in gene-
pathway interactions. Such observations related with gene-pathway interactions are
important to understand the pathology underlying the disease mechanisms and would
provide clues for potential drug targeting. In addition, several consanguineous families
with CAMRQ or related phenotypes including autosomal recessive ataxias were
investigated so far. Identification of novel genes responsible for novel CAMRQ or
phenotypically related cases would help discovering common neurological pathways
involved in disease pathogenesis and classification of the clinical phenotypes arise

137
from phenotypic heterogeneity. Homozygosity mapping following targeted next
generation sequencing is the most efficient method for identifying novel genes
associated with autosomal recessive disorders in consanguineous families. Thus,
improvements in SNP genotyping arrays and target capturing arrays, as well as
sequence analysis methods would lower the error rates associated with false positives,
false negatives and coverage of the bases.
A novel missense homozygous variant in ATP8A2 is identified as causal
mutation of CAMRQ. Segregation analysis, population stratification, protein
conservation analysis, expression profiles, secondary structure predictions, functional
annotation clustering, as well as phenotypes associated with the gene and its homolog
relatives and mice studies revealed that the missense mutation is responsible for
CAMRQ and associated with the clinical phenotypes. However, direct evidence is still
missing. Introducing the same homozygous mutation into cell lines in vitro and
additionally into model organisms in vivo would provide significant information about
the role of ATP8A2 in nervous system development, especially in motor coordination
associated with cerebellum, mental retardation, and hypotonia.
Comparison and classification of the phenotypes associated with other
CAMRQ genes would help understanding the pathways involved in disease
pathogenesis. Therefore, fully characterization of the CAMRQ associated genes is
necessary. For that purpose, characterization of the gene structure and identification of
the tissue specific novel transcript isoforms of the WDR81 gene which is associated
with CAMRQ2 by using Zebrafish as a model organism have been got started in our
laboratories.

138
Chapter 6
References
[1] C. Zimmer, "Human evolution. Faster than a hyena? Running may make
humans special," Science, vol. 306, p. 1283, Nov 2004.
[2] B. G. Richmond, D. R. Begun, and D. S. Strait, "Origin of human bipedalism:
The knuckle-walking hypothesis revisited," Am J Phys Anthropol, vol. Suppl
33, pp. 70-105, 2001.
[3] D. M. Bramble and D. E. Lieberman, "Endurance running and the evolution of
Homo," Nature, vol. 432, pp. 345-52, Nov 2004.
[4] B. G. Richmond and D. S. Strait, "Evidence that humans evolved from a
knuckle-walking ancestor," Nature, vol. 404, pp. 382-5, Mar 2000.
[5] B. G. Richmond and W. L. Jungers, "Orrorin tugenensis femoral morphology
and the evolution of hominin bipedalism," Science, vol. 319, pp. 1662-5, Mar
2008.
[6] T. L. Kivell and D. Schmitt, "Independent evolution of knuckle-walking in
African apes shows that humans did not evolve from a knuckle-walking
ancestor," Proc Natl Acad Sci U S A, vol. 106, pp. 14241-6, Aug 2009.
[7] C. L. Vaughan, "Theories of bipedal walking: an odyssey," J Biomech, vol. 36,
pp. 513-23, Apr 2003.

139
[8] S. M. Morton and A. J. Bastian, "Mechanisms of cerebellar gait ataxia,"
Cerebellum, vol. 6, pp. 79-86, 2007.
[9] F. Palau and C. Espinós, "Autosomal recessive cerebellar ataxias," Orphanet J
Rare Dis, vol. 1, p. 47, 2006.
[10] M. Anheim, C. Tranchant, and M. Koenig, "The autosomal recessive cerebellar
ataxias," N Engl J Med, vol. 366, pp. 636-46, Feb 2012.
[11] C. J. O'Halloran, G. J. Kinsella, and E. Storey, "The cerebellum and
neuropsychological functioning: a critical review," J Clin Exp Neuropsychol,
vol. 34, pp. 35-56, 2012.
[12] J. D. Schmahmann, "The role of the cerebellum in cognition and emotion:
personal reflections since 1982 on the dysmetria of thought hypothesis, and its
historical evolution from theory to therapy," Neuropsychol Rev, vol. 20, pp.
236-60, Sep 2010.
[13] S. A. Sajan, K. E. Waimey, and K. J. Millen, "Novel approaches to studying
the genetic basis of cerebellar development," Cerebellum, vol. 9, pp. 272-83,
Sep 2010.
[14] M. Glickstein, P. Strata, and J. Voogd, "Cerebellum: history," Neuroscience,
vol. 162, pp. 549-59, Sep 2009.
[15] L. W. Bosman and A. Konnerth, "Activity-dependent plasticity of developing
climbing fiber-Purkinje cell synapses," Neuroscience, vol. 162, pp. 612-23,
Sep 2009.
[16] M. Manto, "The cerebellum, cerebellar disorders, and cerebellar research--two
centuries of discoveries," Cerebellum, vol. 7, pp. 505-16, 2008.
[17] D. Timmann, J. Drepper, M. Frings, M. Maschke, S. Richter, M. Gerwig, et
al., "The human cerebellum contributes to motor, emotional and cognitive
associative learning. A review," Cortex, vol. 46, pp. 845-57, 2010 Jul-Aug
2010.
[18] K. Doya, "Complementary roles of basal ganglia and cerebellum in learning
and motor control," Curr Opin Neurobiol, vol. 10, pp. 732-9, Dec 2000.
[19] A. J. Bastian, "Learning to predict the future: the cerebellum adapts
feedforward movement control," Curr Opin Neurobiol, vol. 16, pp. 645-9, Dec
2006.

140
[20] C. Ghez and S. Fahn, "The Cerebellum," in Principles of Neural Science, 2 ed:
Elsevier, 1985, pp. 502-522.
[21] C. A. Guyton and E. J. Hall, Textbook of Medical Physiology, 11 ed.: Elsevier,
2006.
[22] C. Ghez and W. T. Thach, "The Cerebellum," in Principles of Neural Science,
4 ed: McGraw-Hill, 2000, pp. 832-852.
[23] R. R. Llinas, K. D. Walton, and E. J. Lang, "Ch. 7 Cerebellum," in The Synaptic
Organization of the Brain, ed: New York: Oxford University Press., 2004.
[24] M. Manto and C. I. De Zeeuw, "Diversity and complexity of roles of granule
cells in the cerebellar cortex. Editorial," Cerebellum, vol. 11, pp. 1-4, Mar
2012.
[25] J. D. Schmahmann, "Disorders of the cerebellum: ataxia, dysmetria of thought,
and the cerebellar cognitive affective syndrome," J Neuropsychiatry Clin
Neurosci, vol. 16, pp. 367-78, 2004.
[26] M. Manto and D. Marmolino, "Cerebellar ataxias," Curr Opin Neurol, vol. 22,
pp. 419-29, Aug 2009.
[27] B. P. van de Warrenburg, J. A. Steijns, M. Munneke, B. P. Kremer, and B. R.
Bloem, "Falls in degenerative cerebellar ataxias," Mov Disord, vol. 20, pp. 497-
500, Apr 2005.
[28] U. Tan, "A new therory on the evolution of human mind," Neuroquantology,
vol. 4, pp. 250-255, 2005.
[29] S. Gulsuner, A. B. Tekinay, K. Doerschner, H. Boyaci, K. Bilguvar, H. Unal,
et al., "Homozygosity mapping and targeted genomic sequencing reveal the
gene responsible for cerebellar hypoplasia and quadrupedal locomotion in a
consanguineous kindred," Genome Res, vol. 21, pp. 1995-2003, Dec 2011.
[30] U. Tan, "A new syndrome with quadrupedal gait, primitive speech, and severe
mental retardation as a live model for human evolution," Int J Neurosci, vol.
116, pp. 361-9, Mar 2006.
[31] S. Türkmen, O. Demirhan, K. Hoffmann, A. Diers, C. Zimmer, K. Sperling, et
al., "Cerebellar hypoplasia and quadrupedal locomotion in humans as a
recessive trait mapping to chromosome 17p," J Med Genet, vol. 43, pp. 461-4,
May 2006.

141
[32] T. Ozcelik, N. Akarsu, E. Uz, S. Caglayan, S. Gulsuner, O. E. Onat, et al.,
"Mutations in the very low-density lipoprotein receptor VLDLR cause
cerebellar hypoplasia and quadrupedal locomotion in humans," Proc Natl Acad
Sci U S A, vol. 105, pp. 4232-6, Mar 2008.
[33] L. A. Moheb, A. Tzschach, M. Garshasbi, K. Kahrizi, H. Darvish, Y. Heshmati,
et al., "Identification of a nonsense mutation in the very low-density lipoprotein
receptor gene (VLDLR) in an Iranian family with dysequilibrium syndrome,"
Eur J Hum Genet, vol. 16, pp. 270-3, Feb 2008.
[34] L. E. Kolb, Z. Arlier, C. Yalcinkaya, A. K. Ozturk, J. A. Moliterno, O. Erturk,
et al., "Novel VLDLR microdeletion identified in two Turkish siblings with
pachygyria and pontocerebellar atrophy," Neurogenetics, vol. 11, pp. 319-25,
Jul 2010.
[35] S. Türkmen, G. Guo, M. Garshasbi, K. Hoffmann, A. J. Alshalah, C. Mischung,
et al., "CA8 mutations cause a novel syndrome characterized by ataxia and
mild mental retardation with predisposition to quadrupedal gait," PLoS Genet,
vol. 5, p. e1000487, May 2009.
[36] T. Hiesberger, M. Trommsdorff, B. W. Howell, A. Goffinet, M. C. Mumby, J.
A. Cooper, et al., "Direct binding of Reelin to VLDL receptor and ApoE
receptor 2 induces tyrosine phosphorylation of disabled-1 and modulates tau
phosphorylation," Neuron, vol. 24, pp. 481-9, Oct 1999.
[37] T. Miyata, K. Nakajima, K. Mikoshiba, and M. Ogawa, "Regulation of
Purkinje cell alignment by reelin as revealed with CR-50 antibody," J
Neurosci, vol. 17, pp. 3599-609, May 1997.
[38] S. E. Hong, Y. Y. Shugart, D. T. Huang, S. A. Shahwan, P. E. Grant, J. O.
Hourihane, et al., "Autosomal recessive lissencephaly with cerebellar
hypoplasia is associated with human RELN mutations," Nat Genet, vol. 26, pp.
93-6, Sep 2000.
[39] K. M. Boycott, S. Flavelle, A. Bureau, H. C. Glass, T. M. Fujiwara, E. Wirrell,
et al., "Homozygous deletion of the very low density lipoprotein receptor gene
causes autosomal recessive cerebellar hypoplasia with cerebral gyral
simplification," Am J Hum Genet, vol. 77, pp. 477-83, Sep 2005.

142
[40] U. Tan, "Unertan syndrome: review and report of four new cases," Int J
Neurosci, vol. 118, pp. 211-25, Feb 2008.
[41] J. van de Leemput, J. Chandran, M. A. Knight, L. A. Holtzclaw, S. Scholz, M.
R. Cookson, et al., "Deletion at ITPR1 underlies ataxia in mice and
spinocerebellar ataxia 15 in humans," PLoS Genet, vol. 3, p. e108, Jun 2007.
[42] R. L. Patterson, D. Boehning, and S. H. Snyder, "Inositol 1,4,5-trisphosphate
receptors as signal integrators," Annu Rev Biochem, vol. 73, pp. 437-65, 2004.
[43] M. Matsumoto, T. Nakagawa, T. Inoue, E. Nagata, K. Tanaka, H. Takano, et
al., "Ataxia and epileptic seizures in mice lacking type 1 inositol 1,4,5-
trisphosphate receptor," Nature, vol. 379, pp. 168-71, Jan 1996.
[44] H. Najmabadi, H. Hu, M. Garshasbi, T. Zemojtel, S. S. Abedini, W. Chen, et
al., "Deep sequencing reveals 50 novel genes for recessive cognitive
disorders," Nature, vol. 478, pp. 57-63, Oct 2011.
[45] G. M. Cooper and J. Shendure, "Needles in stacks of needles: finding disease-
causal variants in a wealth of genomic data," Nat Rev Genet, vol. 12, pp. 628-
40, Sep 2011.
[46] J. A. Veltman and H. G. Brunner, "De novo mutations in human genetic
disease," Nat Rev Genet, vol. 13, pp. 565-75, 2012.
[47] J. Hardy, "The real problem in association studies," Am J Med Genet, vol. 114,
p. 253, Mar 2002.
[48] V. Bansal, O. Libiger, A. Torkamani, and N. J. Schork, "Statistical analysis
strategies for association studies involving rare variants," Nat Rev Genet, vol.
11, pp. 773-85, Nov 2010.
[49] J. Ott, Y. Kamatani, and M. Lathrop, "Family-based designs for genome-wide
association studies," Nat Rev Genet, vol. 12, pp. 465-74, Jul 2011.
[50] J. Bras, R. Guerreiro, and J. Hardy, "Use of next-generation sequencing and
other whole-genome strategies to dissect neurological disease," Nat Rev
Neurosci, vol. 13, pp. 453-64, Jul 2012.
[51] E. S. Lander and D. Botstein, "Homozygosity mapping: a way to map human
recessive traits with the DNA of inbred children," Science, vol. 236, pp. 1567-
70, Jun 1987.

143
[52] T. J. Albert, M. N. Molla, D. M. Muzny, L. Nazareth, D. Wheeler, X. Song, et
al., "Direct selection of human genomic loci by microarray hybridization," Nat
Methods, vol. 4, pp. 903-5, Nov 2007.
[53] D. T. Okou, K. M. Steinberg, C. Middle, D. J. Cutler, T. J. Albert, and M. E.
Zwick, "Microarray-based genomic selection for high-throughput
resequencing," Nat Methods, vol. 4, pp. 907-9, Nov 2007.
[54] L. Mamanova, A. J. Coffey, C. E. Scott, I. Kozarewa, E. H. Turner, A. Kumar,
et al., "Target-enrichment strategies for next-generation sequencing," Nat
Methods, vol. 7, pp. 111-8, Feb 2010.
[55] F. S. Alkuraya, "Homozygosity mapping: one more tool in the clinical
geneticist's toolbox," Genet Med, vol. 12, pp. 236-9, Apr 2010.
[56] T. Ozçelik, M. Kanaan, K. B. Avraham, D. Yannoukakos, A. Mégarbané, G.
O. Tadmouri, et al., "Collaborative genomics for human health and cooperation
in the Mediterranean region," Nat Genet, vol. 42, pp. 641-5, Aug 2010.
[57] J. McClellan and M. C. King, "Genetic heterogeneity in human disease," Cell,
vol. 141, pp. 210-7, Apr 2010.
[58] T. Walsh and M. C. King, "Ten genes for inherited breast cancer," Cancer Cell,
vol. 11, pp. 103-5, Feb 2007.
[59] A. A. Dror and K. B. Avraham, "Hearing loss: mechanisms revealed by
genetics and cell biology," Annu Rev Genet, vol. 43, pp. 411-37, 2009.
[60] A. Guilmatre, C. Dubourg, A. L. Mosca, S. Legallic, A. Goldenberg, V.
Drouin-Garraud, et al., "Recurrent rearrangements in synaptic and
neurodevelopmental genes and shared biologic pathways in schizophrenia,
autism, and mental retardation," Arch Gen Psychiatry, vol. 66, pp. 947-56, Sep
2009.
[61] T. Walsh, J. M. McClellan, S. E. McCarthy, A. M. Addington, S. B. Pierce, G.
M. Cooper, et al., "Rare structural variants disrupt multiple genes in
neurodevelopmental pathways in schizophrenia," Science, vol. 320, pp. 539-
43, Apr 2008.
[62] M. J. Bamshad, S. B. Ng, A. W. Bigham, H. K. Tabor, M. J. Emond, D. A.
Nickerson, et al., "Exome sequencing as a tool for Mendelian disease gene
discovery," Nat Rev Genet, vol. 12, pp. 745-55, Nov 2011.

144
[63] U. Tan, "Evidence for "Unertan Syndrome" and the evolution of the human
mind," Int J Neurosci, vol. 116, pp. 763-74, Jul 2006.
[64] O. Emre Onat, S. Gulsuner, K. Bilguvar, A. Nazli Basak, H. Topaloglu, M.
Tan, et al., "Missense mutation in the ATPase, aminophospholipid transporter
protein ATP8A2 is associated with cerebellar atrophy and quadrupedal
locomotion," Eur J Hum Genet, Aug 2012.
[65] M. F. Folstein, S. E. Folstein, and P. R. McHugh, ""Mini-mental state". A
practical method for grading the cognitive state of patients for the clinician," J
Psychiatr Res, vol. 12, pp. 189-98, Nov 1975.
[66] C. Güngen, T. Ertan, E. Eker, R. Yaşar, and F. Engin, "[Reliability and validity
of the standardized Mini Mental State Examination in the diagnosis of mild
dementia in Turkish population]," Turk Psikiyatri Derg, vol. 13, pp. 273-81,
2002.
[67] J. Sambrook and E. Fritsch, Tom, Molecular Cloning : A Laboratory Manual,
2 ed. Cold Spring Harbor Laboratory: NY: Cold Spring Harbor Laboratory
Press, 1989.
[68] V. L. Singer, L. J. Jones, S. T. Yue, and R. P. Haugland, "Characterization of
PicoGreen reagent and development of a fluorescence-based solution assay for
double-stranded DNA quantitation," Anal Biochem, vol. 249, pp. 228-38, Jul
1997.
[69] D. Seelow, M. Schuelke, F. Hildebrandt, and P. Nürnberg,
"HomozygosityMapper--an interactive approach to homozygosity mapping,"
Nucleic Acids Res, vol. 37, pp. W593-9, Jul 2009.
[70] J. M. Kwon and A. M. Goate, "The candidate gene approach," Alcohol Res
Health, vol. 24, pp. 164-8, 2000.
[71] S. Köhler, S. Bauer, D. Horn, and P. N. Robinson, "Walking the interactome
for prioritization of candidate disease genes," Am J Hum Genet, vol. 82, pp.
949-58, Apr 2008.
[72] S. Rozen and H. Skaletsky, "Primer3 on the WWW for general users and for
biologist programmers," Methods Mol Biol, vol. 132, pp. 365-86, 2000.
[73] Z. Ning, A. J. Cox, and J. C. Mullikin, "SSAHA: a fast search method for large
DNA databases," Genome Res, vol. 11, pp. 1725-9, Oct 2001.

145
[74] H. Li, J. Ruan, and R. Durbin, "Mapping short DNA sequencing reads and
calling variants using mapping quality scores," Genome Res, vol. 18, pp. 1851-
8, Nov 2008.
[75] H. Li and R. Durbin, "Fast and accurate long-read alignment with Burrows-
Wheeler transform," Bioinformatics, vol. 26, pp. 589-95, Mar 2010.
[76] H. Li, B. Handsaker, A. Wysoker, T. Fennell, J. Ruan, N. Homer, et al., "The
Sequence Alignment/Map format and SAMtools," Bioinformatics, vol. 25, pp.
2078-9, Aug 2009.
[77] B. Ewing and P. Green, "Base-calling of automated sequencer traces using
phred. II. Error probabilities," Genome Res, vol. 8, pp. 186-94, Mar 1998.
[78] A. U. Rehman, R. J. Morell, I. A. Belyantseva, S. Y. Khan, E. T. Boger, M.
Shahzad, et al., "Targeted capture and next-generation sequencing identifies
C9orf75, encoding taperin, as the mutated gene in nonsyndromic deafness
DFNB79," Am J Hum Genet, vol. 86, pp. 378-88, Mar 2010.
[79] A. R. Quinlan and I. M. Hall, "BEDTools: a flexible suite of utilities for
comparing genomic features," Bioinformatics, vol. 26, pp. 841-2, Mar 2010.
[80] A. Siepel and D. Haussler, "Combining phylogenetic and hidden Markov
models in biosequence analysis," J Comput Biol, vol. 11, pp. 413-28, 2004.
[81] J. T. Robinson, H. Thorvaldsdóttir, W. Winckler, M. Guttman, E. S. Lander,
G. Getz, et al., "Integrative genomics viewer," Nat Biotechnol, vol. 29, pp. 24-
6, Jan 2011.
[82] S. Purcell, B. Neale, K. Todd-Brown, L. Thomas, M. A. Ferreira, D. Bender,
et al., "PLINK: a tool set for whole-genome association and population-based
linkage analyses," Am J Hum Genet, vol. 81, pp. 559-75, Sep 2007.
[83] K. Wang, M. Li, and H. Hakonarson, "ANNOVAR: functional annotation of
genetic variants from high-throughput sequencing data," Nucleic Acids Res,
vol. 38, p. e164, Sep 2010.
[84] T. Vincze, J. Posfai, and R. J. Roberts, "NEBcutter: A program to cleave DNA
with restriction enzymes," Nucleic Acids Res, vol. 31, pp. 3688-91, Jul 2003.
[85] E. V. Davydov, D. L. Goode, M. Sirota, G. M. Cooper, A. Sidow, and S.
Batzoglou, "Identifying a high fraction of the human genome to be under

146
selective constraint using GERP++," PLoS Comput Biol, vol. 6, p. e1001025,
2010.
[86] G. M. Cooper, E. A. Stone, G. Asimenos, E. D. Green, S. Batzoglou, A. Sidow,
et al., "Distribution and intensity of constraint in mammalian genomic
sequence," Genome Res, vol. 15, pp. 901-13, Jul 2005.
[87] P. C. Ng and S. Henikoff, "Predicting deleterious amino acid substitutions,"
Genome Res, vol. 11, pp. 863-74, May 2001.
[88] I. A. Adzhubei, S. Schmidt, L. Peshkin, V. E. Ramensky, A. Gerasimova, P.
Bork, et al., "A method and server for predicting damaging missense
mutations," Nat Methods, vol. 7, pp. 248-9, Apr 2010.
[89] J. M. Schwarz, C. Rödelsperger, M. Schuelke, and D. Seelow, "MutationTaster
evaluates disease-causing potential of sequence alterations," Nat Methods, vol.
7, pp. 575-6, Aug 2010.
[90] M. Punta, P. C. Coggill, R. Y. Eberhardt, J. Mistry, J. Tate, C. Boursnell, et al.,
"The Pfam protein families database," Nucleic Acids Res, vol. 40, pp. D290-
301, Jan 2012.
[91] K. Bryson, L. J. McGuffin, R. L. Marsden, J. J. Ward, J. S. Sodhi, and D. T.
Jones, "Protein structure prediction servers at University College London,"
Nucleic Acids Res, vol. 33, pp. W36-8, Jul 2005.
[92] H. Venselaar, T. A. Te Beek, R. K. Kuipers, M. L. Hekkelman, and G. Vriend,
"Protein structure analysis of mutations causing inheritable diseases. An e-
Science approach with life scientist friendly interfaces," BMC Bioinformatics,
vol. 11, p. 548, 2010.
[93] M. W. Pfaffl, "A new mathematical model for relative quantification in real-
time RT-PCR," Nucleic Acids Res, vol. 29, p. e45, May 2001.
[94] D. Hartl, M. Irmler, I. Römer, M. T. Mader, L. Mao, C. Zabel, et al.,
"Transcriptome and proteome analysis of early embryonic mouse brain
development," Proteomics, vol. 8, pp. 1257-65, Mar 2008.
[95] J. T. Eppig, J. A. Blake, C. J. Bult, J. A. Kadin, J. E. Richardson, and M. G. D.
Group, "The Mouse Genome Database (MGD): comprehensive resource for
genetics and genomics of the laboratory mouse," Nucleic Acids Res, vol. 40,
pp. D881-6, Jan 2012.

147
[96] d. W. Huang, B. T. Sherman, and R. A. Lempicki, "Bioinformatics enrichment
tools: paths toward the comprehensive functional analysis of large gene lists,"
Nucleic Acids Res, vol. 37, pp. 1-13, Jan 2009.
[97] d. W. Huang, B. T. Sherman, and R. A. Lempicki, "Systematic and integrative
analysis of large gene lists using DAVID bioinformatics resources," Nat
Protoc, vol. 4, pp. 44-57, 2009.
[98] O. Harismendy, P. C. Ng, R. L. Strausberg, X. Wang, T. B. Stockwell, K. Y.
Beeson, et al., "Evaluation of next generation sequencing platforms for
population targeted sequencing studies," Genome Biol, vol. 10, p. R32, 2009.
[99] C. Luo, D. Tsementzi, N. Kyrpides, T. Read, and K. T. Konstantinidis, "Direct
comparisons of Illumina vs. Roche 454 sequencing technologies on the same
microbial community DNA sample," PLoS One, vol. 7, p. e30087, 2012.
[100] G. P. Consortium, "A map of human genome variation from population-scale
sequencing," Nature, vol. 467, pp. 1061-73, Oct 2010.
[101] A. J. Iafrate, L. Feuk, M. N. Rivera, M. L. Listewnik, P. K. Donahoe, Y. Qi, et
al., "Detection of large-scale variation in the human genome," Nat Genet, vol.
36, pp. 949-51, Sep 2004.
[102] K. H. Cheung, P. L. Miller, J. R. Kidd, K. K. Kidd, M. V. Osier, and A. J.
Pakstis, "ALFRED: a Web-accessible allele frequency database," Pac Symp
Biocomput, pp. 639-50, 2000.
[103] A. Riva and I. S. Kohane, "A SNP-centric database for the investigation of the
human genome," BMC Bioinformatics, vol. 5, p. 33, Mar 2004.
[104] H. Haga, R. Yamada, Y. Ohnishi, Y. Nakamura, and T. Tanaka, "Gene-based
SNP discovery as part of the Japanese Millennium Genome Project:
identification of 190,562 genetic variations in the human genome. Single-
nucleotide polymorphism," J Hum Genet, vol. 47, pp. 605-10, 2002.
[105] P. H. Lee and H. Shatkay, "F-SNP: computationally predicted functional SNPs
for disease association studies," Nucleic Acids Res, vol. 36, pp. D820-4, Jan
2008.
[106] J. Amigo, A. Salas, C. Phillips, and A. Carracedo, "SPSmart: adapting
population based SNP genotype databases for fast and comprehensive web
access," BMC Bioinformatics, vol. 9, p. 428, 2008.

148
[107] L. A. Hindorff, P. Sethupathy, H. A. Junkins, E. M. Ramos, J. P. Mehta, F. S.
Collins, et al., "Potential etiologic and functional implications of genome-wide
association loci for human diseases and traits," Proc Natl Acad Sci U S A, vol.
106, pp. 9362-7, Jun 2009.
[108] J. Guan, Y. Luo, and B. M. Denker, "Purkinje cell protein-2 (Pcp2) stimulates
differentiation in PC12 cells by Gbetagamma-mediated activation of Ras and
p38 MAPK," Biochem J, vol. 392, pp. 389-97, Dec 2005.
[109] A. R. Mohn, R. M. Feddersen, M. S. Nguyen, and B. H. Koller, "Phenotypic
analysis of mice lacking the highly abundant Purkinje cell- and bipolar neuron-
specific PCP2 protein," Mol Cell Neurosci, vol. 9, pp. 63-76, Jan 1997.
[110] Y. Luo and B. M. Denker, "Interaction of heterotrimeric G protein Galphao
with Purkinje cell protein-2. Evidence for a novel nucleotide exchange factor,"
J Biol Chem, vol. 274, pp. 10685-8, Apr 1999.
[111] H. Saito, H. Tsumura, S. Otake, A. Nishida, T. Furukawa, and N. Suzuki,
"L7/Pcp-2-specific expression of Cre recombinase using knock-in approach,"
Biochem Biophys Res Commun, vol. 331, pp. 1216-21, Jun 2005.
[112] R. Echigo, K. Nakao, M. Fukaya, M. Watanabe, and A. Aiba, "Generation of
L7-tTA knock-in mice," Kobe J Med Sci, vol. 54, pp. E272-8, 2009.
[113] M. S. Halleck, J. R. Lawler JF, S. Blackshaw, L. Gao, P. Nagarajan, C. Hacker,
et al., "Differential expression of putative transbilayer amphipath transporters,"
Physiol Genomics, vol. 1, pp. 139-50, Nov 1999.
[114] P. Cacciagli, M. R. Haddad, C. Mignon-Ravix, B. El-Waly, A. Moncla, C.
Missirian, et al., "Disruption of the ATP8A2 gene in a patient with a t(10;13)
de novo balanced translocation and a severe neurological phenotype," Eur J
Hum Genet, vol. 18, pp. 1360-3, Dec 2010.
[115] F. D. Gibbons and F. P. Roth, "Judging the quality of gene expression-based
clustering methods using gene annotation," Genome Res, vol. 12, pp. 1574-81,
Oct 2002.
[116] M. Kato and W. B. Dobyns, "Lissencephaly and the molecular basis of
neuronal migration," Hum Mol Genet, vol. 12 Spec No 1, pp. R89-96, Apr
2003.

149
[117] F. Hildebrandt, S. F. Heeringa, F. Rüschendorf, M. Attanasio, G. Nürnberg, C.
Becker, et al., "A systematic approach to mapping recessive disease genes in
individuals from outbred populations," PLoS Genet, vol. 5, p. e1000353, Jan
2009.
[118] K. Bilgüvar, A. K. Oztürk, A. Louvi, K. Y. Kwan, M. Choi, B. Tatli, et al.,
"Whole-exome sequencing identifies recessive WDR62 mutations in severe
brain malformations," Nature, vol. 467, pp. 207-10, Sep 2010.
[119] H. H. Ropers, "New perspectives for the elucidation of genetic disorders," Am
J Hum Genet, vol. 81, pp. 199-207, Aug 2007.
[120] W. T. C. C. Consortium, "Genome-wide association study of 14,000 cases of
seven common diseases and 3,000 shared controls," Nature, vol. 447, pp. 661-
78, Jun 2007.
[121] L. Kruglyak and D. A. Nickerson, "Variation is the spice of life," Nat Genet,
vol. 27, pp. 234-6, Mar 2001.
[122] C. M. Dobson, "Protein folding and misfolding," Nature, vol. 426, pp. 884-90,
Dec 2003.
[123] A. Hamosh, A. F. Scott, J. S. Amberger, C. A. Bocchini, and V. A. McKusick,
"Online Mendelian Inheritance in Man (OMIM), a knowledgebase of human
genes and genetic disorders," Nucleic Acids Res, vol. 33, pp. D514-7, Jan 2005.
[124] Y. Zan, J. D. Haag, K. S. Chen, L. A. Shepel, D. Wigington, Y. R. Wang, et
al., "Production of knockout rats using ENU mutagenesis and a yeast-based
screening assay," Nat Biotechnol, vol. 21, pp. 645-51, Jun 2003.
[125] D. Aird, M. G. Ross, W. S. Chen, M. Danielsson, T. Fennell, C. Russ, et al.,
"Analyzing and minimizing PCR amplification bias in Illumina sequencing
libraries," Genome Biol, vol. 12, p. R18, 2011.
[126] T. R. Graham and M. M. Kozlov, "Interplay of proteins and lipids in generating
membrane curvature," Curr Opin Cell Biol, vol. 22, pp. 430-6, Aug 2010.
[127] C. F. Puts and J. C. Holthuis, "Mechanism and significance of P4 ATPase-
catalyzed lipid transport: lessons from a Na+/K+-pump," Biochim Biophys
Acta, vol. 1791, pp. 603-11, Jul 2009.
[128] J. H. Kaplan, "Biochemistry of Na,K-ATPase," Annu Rev Biochem, vol. 71, pp.
511-35, 2002.

150
[129] J. A. Coleman, F. Quazi, and R. S. Molday, "Mammalian P(4)-ATPases and
ABC transporters and their role in phospholipid transport," Biochim Biophys
Acta, 2002 [Epub ahead of print].
[130] J. A. Coleman and R.S. Molday, "Critical role of the beta-subunit CDC50A in
the stable expression, assembly, subcellular localization, and lipid transport
activity of the P4-ATPase ATP8A2," J Biol Chem, vol. 286, pp.17205-16,
2011.
[131] Q. Xu, G. Y. Yang, N. Liu, P. Xu, Y. L. Chen, Z. Zhou, Z. G. Luo, "Ding X
P4-ATPase ATP8A2 acts in synergy with CDC50A to enhance neurite
outgrowth," FEBS Lett, vol. 21, pp. 1803-12, 2012.
[132] L. N. Bull, M. J. van Eijk, L. Pawlikowska, J. A. DeYoung, J. A. Juijn, M.
Liao, et al., "A gene encoding a P-type ATPase mutated in two forms of
hereditary cholestasis," Nat Genet, vol. 18, pp. 219-24, Mar 1998.
[133] J. M. Stapelbroek, T. A. Peters, D. H. van Beurden, J. H. Curfs, A. Joosten, A.
J. Beynon, et al., "ATP8B1 is essential for maintaining normal hearing," Proc
Natl Acad Sci U S A, vol. 106, pp. 9709-14, Jun 2009.
[134] J. M. Schultz, Y. Yang, A. J. Caride, A. G. Filoteo, A. R. Penheiter, A. Lagziel,
et al., "Modification of human hearing loss by plasma-membrane calcium
pump PMCA2," N Engl J Med, vol. 352, pp. 1557-64, Apr 2005.
[135] E. Y. Gong, E. Park, H. J. Lee, and K. Lee, "Expression of Atp8b3 in murine
testis and its characterization as a testis specific P-type ATPase," Reproduction,
vol. 137, pp. 345-51, Feb 2009.
[136] L. Wang, C. Beserra, and D. L. Garbers, "A novel aminophospholipid
transporter exclusively expressed in spermatozoa is required for membrane
lipid asymmetry and normal fertilization," Dev Biol, vol. 267, pp. 203-15, Mar
2004.
[137] M. S. Dhar, C. S. Sommardahl, T. Kirkland, S. Nelson, R. Donnell, D. K.
Johnson, et al., "Mice heterozygous for Atp10c, a putative amphipath,
represent a novel model of obesity and type 2 diabetes," J Nutr, vol. 134, pp.
799-805, Apr 2004.
151
[138] S. Collins, T. L. Martin, R. S. Surwit, and J. Robidoux, "Genetic vulnerability
to diet-induced obesity in the C57BL/6J mouse: physiological and molecular
characteristics," Physiol Behav, vol. 81, pp. 243-8, Apr 2004.
[139] H. Li, S. Wetten, L. Li, P. L. St Jean, R. Upmanyu, L. Surh, et al., "Candidate
single-nucleotide polymorphisms from a genomewide association study of
Alzheimer disease," Arch Neurol, vol. 65, pp. 45-53, Jan 2008.
[140] A. Di Fonzo, H. F. Chien, M. Socal, S. Giraudo, C. Tassorelli, G. Iliceto, et al.,
"ATP13A2 missense mutations in juvenile parkinsonism and young onset
Parkinson disease," Neurology, vol. 68, pp. 1557-62, May 2007.
[141] M. Meguro, A. Kashiwagi, K. Mitsuya, M. Nakao, I. Kondo, S. Saitoh, et al.,
"A novel maternally expressed gene, ATP10C, encodes a putative
aminophospholipid translocase associated with Angelman syndrome," Nat
Genet, vol. 28, pp. 19-20, May 2001.
[142] M. De Fusco, R. Marconi, L. Silvestri, L. Atorino, L. Rampoldi, L. Morgante,
et al., "Haploinsufficiency of ATP1A2 encoding the Na+/K+ pump alpha2
subunit associated with familial hemiplegic migraine type 2," Nat Genet, vol.
33, pp. 192-6, Feb 2003.
[143] R. M. Empson, P. R. Turner, R. Y. Nagaraja, P. W. Beesley, and T. Knöpfel,
"Reduced expression of the Ca(2+) transporter protein PMCA2 slows Ca(2+)
dynamics in mouse cerebellar Purkinje neurones and alters the precision of
motor coordination," J Physiol, vol. 588, pp. 907-22, Mar 2010.
[144] G. Zanni, T. Calì, V. M. Kalscheuer, D. Ottolini, S. Barresi, N. Lebrun, et al.,
"Mutation of plasma membrane Ca2+ ATPase isoform 3 in a family with X-
linked congenital cerebellar ataxia impairs Ca2+ homeostasis," Proc Natl Acad
Sci U S A, vol. 109, pp. 14514-9, Sep 2012.
[145] K. Levano, V. Punia, M. Raghunath, P. R. Debata, G. M. Curcio, A. Mogha, et
al., "Atp8a1 deficiency is associated with phosphatidylserine externalization in
hippocampus and delayed hippocampus-dependent learning," J Neurochem,
vol. 120, pp. 302-13, Jan 2012.
[146] X. Zhu, R. T. Libby, W. N. de Vries, R. S. Smith, D. L. Wright, R. T. Bronson,
et al., "Mutations in a p-type ATPase gene cause axonal degeneration," PLoS
Genet, vol. 8, p. e1002853, Aug 2012.

152
[147] D. Cohen, U. Bar-Yosef, J. Levy, L. Gradstein, N. Belfair, R. Ofir, et al.,
"Homozygous CRYBB1 deletion mutation underlies autosomal recessive
congenital cataract," Invest Ophthalmol Vis Sci, vol. 48, pp. 2208-13, May
2007.
[148] T. Harel, R. Rabinowitz, N. Hendler, A. Galil, H. Flusser, J. Chemke, et al.,
"COL11A2 mutation associated with autosomal recessive Weissenbacher-
Zweymuller syndrome: molecular and clinical overlap with
otospondylomegaepiphyseal dysplasia (OSMED)," Am J Med Genet A, vol.
132A, pp. 33-5, Jan 2005.
[149] B. Markus, G. Narkis, D. Landau, R. Z. Birk, I. Cohen, and O. S. Birk,
"Autosomal recessive lethal congenital contractural syndrome type 4 (LCCS4)
caused by a mutation in MYBPC1," Hum Mutat, May 2012.
[150] A. Frattini, A. Pangrazio, L. Susani, C. Sobacchi, M. Mirolo, M. Abinun, et al.,
"Chloride channel ClCN7 mutations are responsible for severe recessive,
dominant, and intermediate osteopetrosis," J Bone Miner Res, vol. 18, pp.
1740-7, Oct 2003.
[151] C. G. Steward, "Neurological aspects of osteopetrosis," Neuropathol Appl
Neurobiol, vol. 29, pp. 87-97, Apr 2003.
[152] Z. Tümer and L. B. Møller, "Menkes disease," Eur J Hum Genet, vol. 18, pp.
511-8, May 2010.
[153] E. Sánchez-Ferrero, E. Coto, C. Beetz, J. Gámez, A. Corao, M. Díaz, et al.,
"SPG7 mutational screening in spastic paraplegia patients supports a dominant
effect for some mutations and a pathogenic role for p.A510V," Clin Genet,
May 2012.
[154] M. M. Dickie, J. Schneider, and P. J. Harman, "A juvenile wabbler lethal in
the house mouse " Journal of Heredity, vol. 43, p. 5, 1952.
[155] C. Olesen, M. Picard, A. M. Winther, C. Gyrup, J. P. Morth, C. Oxvig, et al.,
"The structural basis of calcium transport by the calcium pump," Nature, vol.
450, pp. 1036-42, Dec 2007.
[156] C. Wu, C. Orozco, J. Boyer, M. Leglise, J. Goodale, S. Batalov, et al.,
"BioGPS: an extensible and customizable portal for querying and organizing
gene annotation resources," Genome Biol, vol. 10, p. R130, 2009.

153
[157] R. L. Patterson, D. Boehning and S. H. Snyder, "Inositol 1,4,5-trisphosphate
receptors as signal integrators," Annu Rev Biochem, vol. 73, pp. 437–65, 2004.
[158] Y. Chen, U. Beffert, M. Ertunc, T. S. Tang, E. T. Kavalali, I. Bezprozvanny, J.
Herz, "Reelin modulates NMDA receptor activity in cortical neurons," J
Neurosci, vol. 25, pp. 8209-16, 2005.
[159] L. Fei and Z. T. Joe, "Clinical Implications of Basic Research: Memory and
the NMDA receptors," N Engl J Med, vol. 361, pp. 302, 2009
[160] S. Niu, A. Renfro, C. C. Quattrocchi, M. Sheldon, G. D’Arcangelo, "Reelin
promotes hippocampal dendrite development through the VLDLR/ApoER2-
Dab1 pathway", Neuron, vol. 41, pp. 71–84, 2004

154
Chapter 7
Appendices

155
Appendix A
Primer List
Table A.1: Primers for candidate gene sequencing
Locus D. Primer Tm Size
CENPJ gene sequencing
CN_1 F
R
CGCCTACGTCGACCACTG
TGAACGAAGCCACTGAACTG
61.5
60.0 477
CN_2 F
R
TATGCTGGGTTGAGGTTTGG
AAACAGAAACCTGCAATGACA
60.9
58.3 648
CN_3 F
R
AGGAGGGAGATGGGAGGAAT
GCATTATACTGAGGCCCTGTG
61.2
59.6 247
CN_4 F
R
CACTGTGGAGAAGTCTTTGTGG
GCTACCTGAGAGGCTGATGG
59.8
60.0 577
CN_5 F
R
TCCTGGCCTCAAGTGATTCT
CACCAAATGGGAGATGTCAA
59.8
59.3 502
CN_6 F
R
GGGTTTCTATACCAGGCACAC
TGGAGTTGCTGTCTATCCATTT
58.4
58.7 500
CN_7_1 F
R
TTTAGGAAGCAGAAGGACCA
AGCCAGTATCGCAAGGTTT
57.5
57.4 468
CN_7_2 F
R
TCTTTCTCCGTCAGGATTGA
GCCGGATTTGTCTTCTGTG
58.4
59.2 483
CN_7_3 F
R
CCATAAGGGAGACCATGAAA
CTCTCACTATTTGGAACACCTTC
57.5
57.0 484

156
CN_7_4 F
R
GAATTGAGGGAACAGCCTTG
GGCGTCCCATAAGTGGATT
59.7
59.8 470
CN_7_5 F
R
CACCAGGACCCAAGAAGATAA
GGGAAGAAAGGAAACGTAGAAG
59.0
58.5 697
CN_8 F
R
TTGCCATATTCTTGGCTCTT
GTCTTAAAGGTATAACTGAGTCACTGC
57.5
58.2 289
CN_9 F
R
GGATGAATGCTTTAGTGAGTGG
TTTCCAACTCCAGGCTTGTT
58.7
59.7 596
CN_10 F
R
TCATTGCTGGGTCTCTATTCTTC
TTCCCATTCTACTTTCTGACTCTATG
59.7
59.3 400
CN_11 F
R
AACCCACAGCATTCTTAGCAC
GATGCACAGGAGCTTCAATTAC
59.3
58.9 336
CN_12_13 F
R
AAGGACAGCAGTTCACAGGA
TCTGAACGAGAAATGGCAAC
58.4
58.9 627
CN_14_16 F
R
GTAGGCAGTTGGGAGGAGAA
ACATATCATCAGAAACGCAAGG
59.3
59.1 675
CN_17 F
R
GATAACCAAGGGATGTCTCCA
GTGCTCTACGGCTGATGTGT
58.8
58.9 679
MTMR6 gene sequencing
MTMR_1 F
R
TCCATTCTCACGCAGTCTTCC
CTTCGTCTCCTCCTGCCTCA
62.7
63.0 498
MTMR_2 F
R
TGCATGTAAGTCCTGGGCTA
GGCAGGAGTGATCTGGAGAC
59.3
59.8 341
MTMR_3 F
R
TGCTTTCCATGTTGATGACC
GGGGAGATAGAGTACAAAAGAACC
59.5
58.7 340
MTMR_4 F
R
TCAGGTATTAGCCATCTCTTTGAAG
CTGGGGTAAGTTTCACAAATCTG
60.2
59.9 488
MTMR_5 F
R
TGAAATGTGCTGTTCTTGCA
AAGCATCCTACCTCCTTATCTTGA
59.0
59.7 236
MTMR_6 F
R
GGATCTTAAAGTTAATGCCTCCTAA
AGAAGATGTAAGAAATCACCATGAG
58.4
57.9 479
MTMR_7 F
R
TTCCTTTAAACTGCCTCCTAGC
TGCCTGATTTCTAAGAGTTGATGA
59.1
60.3 477
MTMR_8 F
R
CGTATTTGGTTAGTGGCTGCT
ACTCCTTCCCAATCATTATAGACC
59.3
58.8 584
MTMR_9 F
R
ATTGCAGGCATAGCACTTC
TGCCAGTCTCATCATTTCCTT
56.5
59.7 355
MTMR_10 F
R
TCCACCTCAGTCTACCACCT
CATCACGCATGTGAGTTCAT
57.1
58.0 541
MTMR_11 F
R
CAATACCTGAACAATGGACCTT
AGCTTCACACTTAACGCTCTATG
58.0
57.9 519

157
MTMR_12_14 F
R
GAAGCCATCGCCTGATTTAT
GGGATGACCTGATTTTGAAGA
59.1
59.0 558
MTMR_15_1 F
R
TGTAACATATTGTGGCTTATGCAAT
CTGACCACAGCAGGTTCTGA
59.7
60.0 284
MTMR_15_2 F
R
CCCGGCAGATAATCGTTATAG
ATTCCTTGCTGGAAATGCAA
58.6
60.6 293
MTMR_15_3 F
R
GATGGTCTGTAAGCATAACCAAA
GCAGTAATGAGAGCACAATTCTTT
58.2
59.0 550
MTMR_15_4 F
R
TTCTTCTGGTCAGCCTTGTTT
CCAGGAACAGCAACTCATTG
59.0
59.3 431
MTMR_15_5 F
R
GTGGTTGGCTTTATTTCTTTCAC
GCCAGTTGGGTGATATTGCT
59.1
60.0 471
MTMR_15_6 F
R
GTGCATGGTTGCATGAATTT
AAGTTTCCATTCCCAGTGCTT
59.4
60.0 581
MTMR_15_7 F
R
GATTAACCAATCCTGCTTCCA
CTCCTCAAACCTTATGCTGTTATG
59.0
59.2 495
NUPL1 gene sequencing
NUPL1_1 F
R
AACTCTGGGAGCCTACTCCTTT
AGGCGAGAAAGTGCGGTTAC
59.8
61.7 465
NUPL1_2 F
R
ACCCAGCCTGAAATCTGGTA
TCCCAAGCCTACTCTCTGACA
59.6
60.0 485
NUPL1_3 F
R
CACATTTCACAGCCACATCT
TCTCCGATAAGTCACCATCTG
57.1
57.8 565
NUPL1_4 F
R
CTCTCACAGATACACCCTTCTTCT
ACAGCCTCTCCTGCTTCAAT
58.1
59.0 438
NUPL1_5 F
R
TACTCCTCAAAGCCCTTATTTCTG
AGAATCTCTCTTGAACCCTGGAG
60.1
60.2 635
NUPL1_6 F
R
CGCATCATCCAAACTGCATA
GCAACCTAGACATTCCCTCAAC
60.6
60.0 381
NUPL1_7 F
R
GGCAAGCAAAGAAATGCTTAAC
GAGAAATACCAAACACCTTTCCAG
60.3
60.3 394
NUPL1_8 F
R
GAAATCATCCAGAGAAGCCATAC
CTTGAACTTGTTTCTGCTCCTTC
59.1
59.6 557
NUPL1_9 F
R
GGGAGCATCTCTTCCTCCTA
TTCCTACCTTGTTGGGTCTTT
58.4
57.7 691
NUPL1_10 F
R
TCTTTGAAGTTTCAGTCCAGAG
GGCTCAGCCTTTCCACATAG
56.3
59.8 296
NUPL1_11 F
R
CTTCCTTTCCTTGGATAACCTTG
GCCCTAAGATTTCTGTCCTTGTT
60.3
60.0 452
NUPL1_12 F
R
CTGCTACTCTGTGTGTTCTCTGG
CGTTATGTCTGGGTATGTTATGGA
59.2
60.0 397

158
NUPL1_13 F
R
CCTACACCAAAGTGCATTATTAGC
TCAGTGCTCACACAAATGGA
59.2
58.8 449
NUPL1_14 F
R
AGACTGGAGAGACATCCTGAAA
TTGCCAGATGGAACCTTAACT
58.0
58.7 382
NUPL1_15 F
R
ACTTGTCCATATCCTTTAACCTGTG
GCACACTTCATCCAGGGAGTA
59.7
60.1 298
NUPL1_16_1 F
R
AATTTACTGCTCCTCCCTGTTT
GGCCCTAGAGTTCACACCA
58.3
58.7 627
NUPL1_16_2 F
R
TGTGTTGAGAGAATCCATAGCAG
AGTGCAGTGGTGTGATCTCG
59.4
59.9 545
NUPL1_16_3 F
R
GGTGGCTCACGCCTGTAATC
TCACAGAAGCAATGTAAGGACACA
62.9
62.0 495
NUPL1_16_4 F
R
TCAGTGCTTGTAGAATGATGAGC
ACATGCCTATGCGTTATTACCTG
59.5
60.3 598
NUPL1_16_5 F
R
GGCTTCTCAGCCTCTTAATGTC
AAGCCAACCACTGCTATATGC
59.5
59.3 533
NUPL1_16_6 F
R
AGCCATGATTTCGTTAGTAGACCT
CTAACTTCCCATGTTCTGGATCTG
59.6
61.2 424
NUPL1_16_7 F
R
GCATATAGCAGTGGTTGGCTTT
GGAAATGGAAGGGAATTAGGG
60.5
60.8 700
SACS gene sequencing
Sacs_1_2 F
R
GGCGGATCCCCAGCTAAC
AACGGAAAAGGCAAGTGATG
62.9
60.1 696
Sacs_3 F
R
TTCTCCAGACAACTTCCTTCA
GCCTGTAATCCGAACACTTTG
57.5
59.6 600
Sacs_4 F
R
TGCTTCGTCAGGTAGATTTCTG
GGAGCGACACTGCTGATTAC
59.5
58.5 496
Sacs_5 F
R
TGCAAATAGTGGGTTTCCTT
CAACTGGTGGAGACACCTTC
57.2
58.1 407
Sacs_6 F
R
GAGATAGAACAGAACACCCTGGTA
CATTGACATACCTCCTGCTACTG
58.7
58.8 352
Sacs_7_1 F
R
CCTGGCATTTGTTATTGGAT
TGAAGGTTGTAGGCGAAGAG
57.4
58.1 443
Sacs_7_2 F
R
CAGTTTGCACCATTTGTTGG
TGCTTCATCATCTCTGCTTGA
60.0
59.7 564
Sacs_7_3 F
R
GGGCGAGGGATCAGTAGTAA
AGCTCTGGAGGTAGTTGAGCA
59.1
59.2 592
Sacs_7_4 F
R
GTCAGGTTGGAGCAGGTGTA
GCTCACTGTAGGCTTGGTCA
58.7
59.0 280
Sacs_7_5 F
R
GCACAACACCTGTGAGGAAG
CTGGCCTTGTTATTATTTGCAC
59.3
58.7 532

159
Sacs_8 F
R
TGTGAGAGTCCTTTGTTGTGAA
CCATGCAGGTATAAGATGTTGA
58.4
57.7 932
Sacs_9_1 F
R
CCTTCCAGTACTGTGTTATTTGTGAG
CAAGAACTTCCTCAGGGCATC
60.4
61.1 623
Sacs_9_2 F
R
GATGCATCTATCCAACATCCGCT
GGGGTGGGAAATAGGTTCCTTC
64.5
64.0 602
Sacs_9_3 F
R
AAAAATGAGAATCCAAATGTGCT
GCACTAAGGCTAGGTTTTGTGAAG
59.1
60.7 599
Sacs_9_4 F
R
GCTCCTCACTTCCTCTTGTTG
CGTGAATTTGGCTTCATGATAA
59.1
60.0 601
Sacs_9_5 F
R
AGCAATCAGATTCCAGCAAGC
GATGGGAATGTCAGTGATATGG
61.8
59.1 612
Sacs_9_6 F
R
GGGAGAAGTTGACAAAGTTGGA
CTTTGGTTCATCACTGGGAAG
60.5
59.6 625
Sacs_9_7 F
R
TCCAAAGCATTGAACACACCT
CAGGTCCCGTAAGACACTCAG
60.5
59.8 633
Sacs_9_8 F
R
CAATGGGTGCTTTGCTGTTAC
CGAAGAACTCCCGAGAACTCA
60.5
61.8 621
Sacs_9_9 F
R
GCTGGCTGCAAACAGATACTAC
GCAAACATGGTTTCAGGCTTA
59.1
60.1 605
Sacs_9_9_2 F
R
AACTTCCTTCTTCGGTAAAAT
CAATGACACTGAACCACAA
54.0
53.5 746
Sacs_9_10 F
R
CAAACAATCCGCTTCCTTCCAT
ATTATTCGTCGGCAAAGCTGA
64.5
62.0 653
Sacs_9_11 F
R
TTCCGCGAACTTTTTTGAAACC
ACACAAAGTGCTGGCCCTTGC
64.4
66.9 601
Sacs_9_12 F
R
GATGCAAAGGCGACAGAAATC
ATACAGCACATTTAGAGCTCCAGT
62.0
58.6 627
Sacs_9_13 F
R
GCATCAGACAGAATGGTCCAG
GCAATTCAACATATGCAGGAG
60.7
58.3 625
Sacs_9_14 F
R
GTGAATGGCCACTTTGCACT
TGATATCAGCAGGGGTCACAT
61.1
60.4 649
Sacs_9_15 F
R
ACCACACGCAAAACAGTAGCA
GCCATGCATTCTTAAGCCAAG
61.7
62.0 610
Sacs_9_16 F
R
TGACATTTCCAGCTTTGCTGA
AGCGGCCACTGATGGATTTAT
61.9
62.9 632
Sacs_9_17 F
R
AAATGATTTTGAGGCAACTTTTG
TTCCACCCAGGATGTCATAAA
59.5
60.2 594
Sacs_9_17_2 F
R
AATATAGAGAGCCCCACAAGC
GTTTTCTGTATTAGCCCTCACAC
57.5
57.0 786

160
Sacs_9_18 F
R
ACAGTAGACTAAAGCAAGCAAAGC
ATCAAGAGGAGGATCCAGGTT
58.6
59.0 647
Sacs_9_19 F
R
CATCCTGCCCTATTCTTCCAG
TAAAGCGCAAGGTCTCGTACA
61.0
60.9 619
Sacs_9_20 F
R
TGAGGGCAAACAATTAGATCC
TCTGCTGTGGGGAATAGGATT
59.0
60.8 616
Sacs_9_21 F
R
GCAAAGCCCTAAGAGAAGGAT
TGCTTTGAGTAGCTTTCCTCAG
59.0
58.9 634
Sacs_9_22 F
R
TGAAAGAGAAGATGCTGACAATTC
GTAAGTCTGTCCGGCTGAAGG
59.9
61.2 655
Sacs_9_23 F
R
CATCCCGATTTCAGTCAGACA
TTCGTGCTACAACACATTCAAGA
61.1
60.7 639
Table A.2: Sanger sequencing primers for segregation analysis of protein altering
variants
Locus D. Primer Tm Size
ATP8A2 F
R
TCCACAGACACCACCTCAGA
AAATGCCAAAGGCTCTGAAA
60.3
59.8 197
APBA3 F
R
TTCAGGACCAGTCTGGGAAG
AGTCAAGCCTTCAGGAGCTG
60.2
59.7 227
MUC16_A6352V F
R
GTGCCTTGGATGGATGTTCT
ACCTCGGGGGACTCAATAGT
59.9
59.8 233
MUC16_T6290I F
R
TCGCAGAGGATCTAGGCATT
CCTGTGACTCGTTCACCTCA
59.9
59.9 247
ZNF823 F
R
GCTGAAGGCTTTCCCACATT
TTTGCACGAAAGAACACACA
61.5
58.9 235
SERINC3 F
R
TGCATCTGAGCCACTCATTT
TTGTGATGTGCTGGTTGGTT
59.4
60.0 250
PCP2 F
R
TACAGCCACAACTGGGTCAG
GAGGCCAGCAGAAAAGTGAC
59.7
60.0 214

161
Table A.3: AS-PCR primers for population screening
Locus D. Primer Tm Size
ATP8A2_AS1_WT F
R
CATGCAGGAGGTGCTCAATA
CTCAAGAGTCACCAACAGACTG
59.8
57.6 193
ATP8A2_AS1_Mut F
R
CATGCAGGAGGTGCTCAATA
CTCAAGAGTCACCAACAGACTC
59.8
56.6 193
APBA3_as2_wt F
R
GGAGCCCGTGGGCATCAGC
CCTCAGTCGGATGGAACTTG
70.8
60.6 170
APBA3_as2_mut F
R
GGAGCCCGTGGGCATCAGT
CCTCAGTCGGATGGAACTTG
68.1
60.6 170
Table A.4: Real time RT-PCR primers expression analysis
Locus D. Primer Tm Size
ATP8A2_RT F
R
GCACACTTCTGGTTGGGATT
CGAGACTTGGTTTCCAGCTC
60.0
60.0 131
GAPDH F
R
GGCTGAGAACGGGAAGCTTGTCAT
CAGCCTTCTCCATGGTGGTGAAGA
68.8
68.8 143
Table A.5: STR markers for haplotype construction of chromosome 13q12
Marker D. Primer Expected
Size
D13S787 F
R
ATCAGGATTCCAGGAGGAAA
ACCTGGGAGTCGGAGCTC
252
D13S1243 F
R
TGCTGACAGGCTACAGAACTTT
CTCTTGTGCAGGTATAGGGG
0
D13S742 F
R
TCCAGCCTGGTCAACACAG
TCCAGACTTCCCAATTCAGG
364
D13S283 F
R
TCTCATATTCAATATTCTTACTGCA
GCCATTCCAAGCGTGT
108
D13S1294 F
R
GACCCCAATTCTATGTGTTCAG
CAGGAGTTTTTATCTACTTTGTGCC
251
D13S221 F
R
TAGCCATGATAGGAAATCAACC
GAGATCGTGCAGCACTTGT
243

162
Appendix B
Candidate genes at the homozygous regions
Table B.1: Full list of the candidate genes located at the shared homozygous regions
Chr:Start-End (bp) Gene Name Gene Biotype Status
1:1152288-1167411 SDF4 protein_coding KNOWN
1:1167629-1170421 B3GALT6 protein_coding KNOWN
1:1177826-1182102 FAM132A protein_coding KNOWN
1:1189289-1209265 UBE2J2 protein_coding KNOWN
1:1214447-1227409 SCNN1D protein_coding KNOWN
1:1227756-1244989 ACAP3 protein_coding KNOWN
1:1243947-1247057 PUSL1 protein_coding KNOWN
1:1246965-1260071 CPSF3L protein_coding KNOWN
1:1260136-1264277 GLTPD1 protein_coding KNOWN
1:1266694-1270686 TAS1R3 protein_coding KNOWN
1:1270656-1284730 DVL1 protein_coding KNOWN
1:1288069-1297157 MXRA8 protein_coding KNOWN
1:1309110-1310875 AURKAIP1 protein_coding KNOWN
1:1321091-1334708 CCNL2 protein_coding KNOWN
1:1334902-1337426 RP4-758J18 protein_coding NOVEL
1:1337288-1342693 MRPL20 protein_coding KNOWN
1:1353800-1357149 ANKRD65 protein_coding KNOWN
1:1361508-1363167 TMEM88B protein_coding KNOWN
1:1370241-1378262 VWA1 protein_coding KNOWN
1:1385069-1405538 ATAD3C protein_coding KNOWN

163
1:1407143-1433228 ATAD3B protein_coding KNOWN
1:1447531-1470067 ATAD3A protein_coding KNOWN
1:1470554-1475833 TMEM240 protein_coding KNOWN
1:1477053-1510249 SSU72 protein_coding KNOWN
1:1510355-1511373 AL645728.1 protein_coding KNOWN
1:1533392-1535476 C1orf233 protein_coding KNOWN
1:1550795-1565990 MIB2 protein_coding KNOWN
1:1567474-1570639 MMP23B protein_coding KNOWN
1:1570603-1590473 CDK11B protein_coding PUTATIVE
1:1592939-1624167 SLC35E2B protein_coding KNOWN
1:1634169-1655777 CDK11A protein_coding KNOWN
1:1656277-1677431 SLC35E2 protein_coding KNOWN
1:1682671-1711896 NADK protein_coding KNOWN
1:1716725-1822502 GNB1 protein_coding KNOWN
1:1846266-1848735 CALML6 protein_coding KNOWN
1:1849029-1850712 TMEM52 protein_coding KNOWN
1:1853396-1935276 C1orf222 protein_coding KNOWN
1:1950780-1962192 GABRD protein_coding KNOWN
1:1981909-2116834 PRKCZ protein_coding KNOWN
1:2115903-2144159 C1orf86 protein_coding KNOWN
1:2143360-2145620 AL590822.1 protein_coding KNOWN
1:2160134-2241558 SKI protein_coding KNOWN
1:2252692-2323146 MORN1 protein_coding KNOWN
3:48509197-48542259 SHISA5 protein_coding KNOWN
3:48555117-48599448 PFKFB4 protein_coding KNOWN
3:48599160-48601206 UCN2 protein_coding KNOWN
3:48601506-48632700 COL7A1 protein_coding KNOWN
3:48636435-48648409 UQCRC1 protein_coding KNOWN
3:48658192-48659288 TMEM89 protein_coding KNOWN
3:48663156-48672926 SLC26A6 protein_coding KNOWN
3:48673902-48700348 CELSR3 protein_coding KNOWN
3:48701364-48723797 NCKIPSD protein_coding KNOWN
3:48725436-48777786 IP6K2 protein_coding KNOWN
3:48782030-48885279 PRKAR2A protein_coding KNOWN
3:48894369-48936426 SLC25A20 protein_coding KNOWN
3:48955221-48956818 C3orf71 protein_coding KNOWN
3:48956254-49023815 ARIH2 protein_coding KNOWN
3:49027319-49044587 P4HTM protein_coding KNOWN
3:49044495-49053386 WDR6 protein_coding KNOWN
3:49052921-49059726 DALRD3 protein_coding KNOWN
3:49057892-49060905 NDUFAF3 protein_coding KNOWN

164
3:49061758-49066841 IMPDH2 protein_coding KNOWN
3:49067140-49131796 QRICH1 protein_coding KNOWN
3:49133365-49142553 QARS protein_coding KNOWN
3:49145479-49158371 USP19 protein_coding KNOWN
3:49158547-49170551 LAMB2 protein_coding KNOWN
3:49199968-49203754 CCDC71 protein_coding KNOWN
3:49209044-49213917 KLHDC8B protein_coding KNOWN
3:49215065-49236502 RP11-694I15 protein_coding KNOWN
3:49235861-49295537 CCDC36 protein_coding KNOWN
3:49297518-49298749 RP11-3B7.1 protein_coding PUTATIVE
3:49306035-49315342 C3orf62 protein_coding KNOWN
3:49315264-49378145 USP4 protein_coding KNOWN
3:49394609-49396033 GPX1 protein_coding KNOWN
3:49396578-49450431 RHOA protein_coding KNOWN
3:49449639-49453908 TCTA protein_coding KNOWN
3:49454211-49460186 AMT protein_coding KNOWN
3:49460379-49466759 NICN1 protein_coding KNOWN
3:49506146-49573048 DAG1 protein_coding KNOWN
3:49591922-49708978 BSN protein_coding KNOWN
3:50400233-50541675 CACNA2D2 protein_coding KNOWN
3:50595462-50608458 C3orf18 protein_coding KNOWN
3:50606583-50622366 HEMK1 protein_coding KNOWN
3:50643921-50649262 CISH protein_coding KNOWN
3:50648951-50686720 MAPKAPK3 protein_coding KNOWN
3:50712672-51421329 DOCK3 protein_coding KNOWN
3:51422478-51426828 MANF protein_coding KNOWN
3:51428731-51435330 RBM15B protein_coding KNOWN
3:51433298-51534010 VPRBP protein_coding KNOWN
3:51575596-51697610 RAD54L2 protein_coding KNOWN
3:51696709-51738339 TEX264 protein_coding KNOWN
3:51741086-51752629 GRM2 protein_coding KNOWN
3:51812580-51813009 IQCF6 protein_coding KNOWN
3:51851620-51864876 IQCF3 protein_coding KNOWN
3:51895645-51897440 IQCF2 protein_coding KNOWN
3:51907737-51909600 IQCF5 protein_coding KNOWN
3:51928892-51937351 IQCF1 protein_coding KNOWN
3:51967446-51975957 RRP9 protein_coding KNOWN
3:51976361-51982883 PARP3 protein_coding KNOWN
3:51989330-51991509 GPR62 protein_coding KNOWN
3:51991470-52008032 PCBP4 protein_coding KNOWN
3:52002526-52017425 ABHD14B protein_coding KNOWN

165
3:52005442-52015212 ABHD14A protein_coding KNOWN
3:52009066-52023213 ACY1 protein_coding KNOWN
3:52009066-52023199 ACY1 protein_coding NOVEL
3:52027644-52029958 RPL29 protein_coding KNOWN
3:52082935-52090566 DUSP7 protein_coding KNOWN
3:52097076-52097567 C3orf74 protein_coding KNOWN
3:52109269-52188706 POC1A protein_coding KNOWN
3:52232102-52248343 ALAS1 protein_coding KNOWN
3:52255096-52260179 TLR9 protein_coding KNOWN
3:52255097-52265206 RP11-330H6.5 protein_coding NOVEL
3:52262626-52273177 TWF2 protein_coding KNOWN
3:52279841-52284613 PPM1M protein_coding KNOWN
3:52288437-52322036 WDR82 protein_coding KNOWN
3:52321105-52329272 GLYCTK protein_coding KNOWN
3:52350335-52434507 DNAH1 protein_coding KNOWN
3:52435029-52444366 BAP1 protein_coding KNOWN
3:52443510-52457657 PHF7 protein_coding KNOWN
3:155093369-155462856 PLCH1 protein_coding KNOWN
3:155459933-155461515 AC104472.1 protein_coding KNOWN
3:155480401-155524140 C3orf33 protein_coding KNOWN
3:155544305-155572218 SLC33A1 protein_coding KNOWN
3:155588325-155658457 GMPS protein_coding KNOWN
3:155755490-156256545 KCNAB1 protein_coding KNOWN
5:68646811-68665840 TAF9 protein_coding KNOWN
5:68665120-68710628 RAD17 protein_coding KNOWN
5:68710939-68740157 MARVELD2 protein_coding KNOWN
5:68788119-68853931 OCLN protein_coding KNOWN
5:68856035-68890550 GTF2H2C protein_coding KNOWN
5:69321074-69338940 SERF1B protein_coding KNOWN
5:69345350-69374349 SMN2 protein_coding KNOWN
5:70196492-70214357 SERF1A protein_coding KNOWN
5:70220768-70249769 SMN1 protein_coding KNOWN
5:70264310-70320941 NAIP protein_coding KNOWN
5:70330784-70363516 GTF2H2 protein_coding KNOWN
9:39072764-39288456 CNTNAP3 protein_coding KNOWN
9:39355699-39361956 FAM75A1 protein_coding KNOWN
9:39884975-39891210 FAM75A2 protein_coding KNOWN
9:39900338-39907240 FAM74A1 protein_coding KNOWN
9:40028620-40032417 AL353791.1 protein_coding PUTATIVE
9:40700291-40706537 FAM75A3 protein_coding KNOWN
9:40760700-40836415 ZNF658 protein_coding KNOWN

166
9:43624507-43630730 FAM75A6 protein_coding KNOWN
9:43684902-43924049 CNTNAP3B protein_coding KNOWN
12:123104824-123215390 HCAR1 protein_coding KNOWN
12:123185840-123187890 HCAR2 protein_coding KNOWN
12:123199303-123201439 HCAR3 protein_coding KNOWN
12:123237321-123255611 DENR protein_coding KNOWN
12:123258874-123312075 CCDC62 protein_coding KNOWN
12:123319000-123347507 HIP1R protein_coding KNOWN
12:123349882-123380991 VPS37B protein_coding KNOWN
12:123405498-123466196 ABCB9 protein_coding KNOWN
12:123459127-123464590 OGFOD2 protein_coding KNOWN
12:123464333-123467456 ARL6IP4 protein_coding KNOWN
12:123468027-123634562 PITPNM2 protein_coding KNOWN
12:123636867-123728561 MPHOSPH9 protein_coding KNOWN
12:123717463-123742506 C12orf65 protein_coding KNOWN
12:123745528-123756881 CDK2AP1 protein_coding KNOWN
12:123773656-123834988 SBNO1 protein_coding KNOWN
12:123868320-123893905 SETD8 protein_coding KNOWN
12:123899936-123921264 RILPL2 protein_coding KNOWN
12:123942188-123957701 SNRNP35 protein_coding KNOWN
12:123955925-124018265 RILPL1 protein_coding KNOWN
12:124069078-124083116 TMED2 protein_coding KNOWN
12:124086624-124105482 DDX55 protein_coding KNOWN
12:124104953-124118313 EIF2B1 protein_coding KNOWN
12:124118375-124146479 GTF2H3 protein_coding KNOWN
12:124155660-124192948 TCTN2 protein_coding KNOWN
13:24995064-25086948 PARP4 protein_coding KNOWN
13:25254549-25285921 ATP12A protein_coding KNOWN
13:25338290-25454059 RNF17 protein_coding KNOWN
13:25457171-25497018 CENPJ protein_coding KNOWN
13:25670006-25673392 PABPC3 protein_coding KNOWN
13:25735822-25746426 FAM123A protein_coding KNOWN
13:25802307-25862147 MTMR6 protein_coding KNOWN
13:25875662-25923938 NUPL1 protein_coding KNOWN
13:25946209-26599989 ATP8A2 protein_coding KNOWN
13:26442061-26455095 AL138815.1 protein_coding KNOWN
19:40267234-40276775 LEUTX protein_coding KNOWN
19:40315993-40324841 DYRK1B protein_coding KNOWN
19:40325094-40337054 FBL protein_coding KNOWN
19:40353964-40440533 FCGBP protein_coding KNOWN
19:40477073-40487351 PSMC4 protein_coding KNOWN

167
19:40502943-40523514 ZNF546 protein_coding KNOWN
19:40534167-40562116 ZNF780B protein_coding KNOWN
19:40575059-40596845 ZNF780A protein_coding KNOWN
19:40697651-40721481 MAP3K10 protein_coding KNOWN
19:40721965-40724306 TTC9B protein_coding KNOWN
19:40728115-40732597 CNTD2 protein_coding KNOWN
19:40736224-40791443 AKT2 protein_coding KNOWN
19:40825443-40854434 C19orf47 protein_coding KNOWN
19:40854491-40886346 PLD3 protein_coding KNOWN
19:40885179-40896094 HIPK4 protein_coding KNOWN
19:40899672-40919271 PRX protein_coding KNOWN
19:40927499-40931932 SERTAD1 protein_coding KNOWN
19:40946749-40950282 SERTAD3 protein_coding KNOWN
19:40953693-40971725 BLVRB protein_coding KNOWN
19:40973126-41082364 SPTBN4 protein_coding KNOWN
19:41082757-41097301 SHKBP1 protein_coding KNOWN
19:41099072-41135725 LTBP4 protein_coding KNOWN
19:41171810-41196556 NUMBL protein_coding KNOWN
19:41197434-41222790 ADCK4 protein_coding KNOWN
19:41223008-41246763 ITPKC protein_coding KNOWN
19:41246761-41256408 C19orf54 protein_coding KNOWN
19:41256759-41271296 SNRPA protein_coding KNOWN
19:41281300-41283392 MIA protein_coding KNOWN
19:41284171-41302847 RAB4B protein_coding KNOWN
19:41305048-41314336 EGLN2 protein_coding KNOWN
19:41349444-41356352 CYP2A6 protein_coding KNOWN
19:41381344-41388657 CYP2A7 protein_coding KNOWN
19:41396731-41406413 CYP2G1P protein_coding KNOWN
19:41414377-41416754 AC008537.1 protein_coding KNOWN
19:41497204-41524301 CYP2B6 protein_coding KNOWN
19:41530172-41533615 CYP2A7P1 protein_coding KNOWN
19:41594368-41602099 CYP2A13 protein_coding KNOWN
19:41620337-41634271 CYP2F1 protein_coding KNOWN
19:41699115-41713443 CYP2S1 protein_coding KNOWN
19:41725108-41767670 AXL protein_coding KNOWN
19:41768391-41813811 HNRNPUL1 protein_coding KNOWN
19:41816094-41830785 CCDC97 protein_coding KNOWN
19:41836813-41859831 TGFB1 protein_coding KNOWN
19:41856816-41889988 TMEM91 protein_coding KNOWN
19:41860322-41870078 B9D2 protein_coding KNOWN
19:41882662-41930906 CTC-435M10.3 protein_coding NOVEL
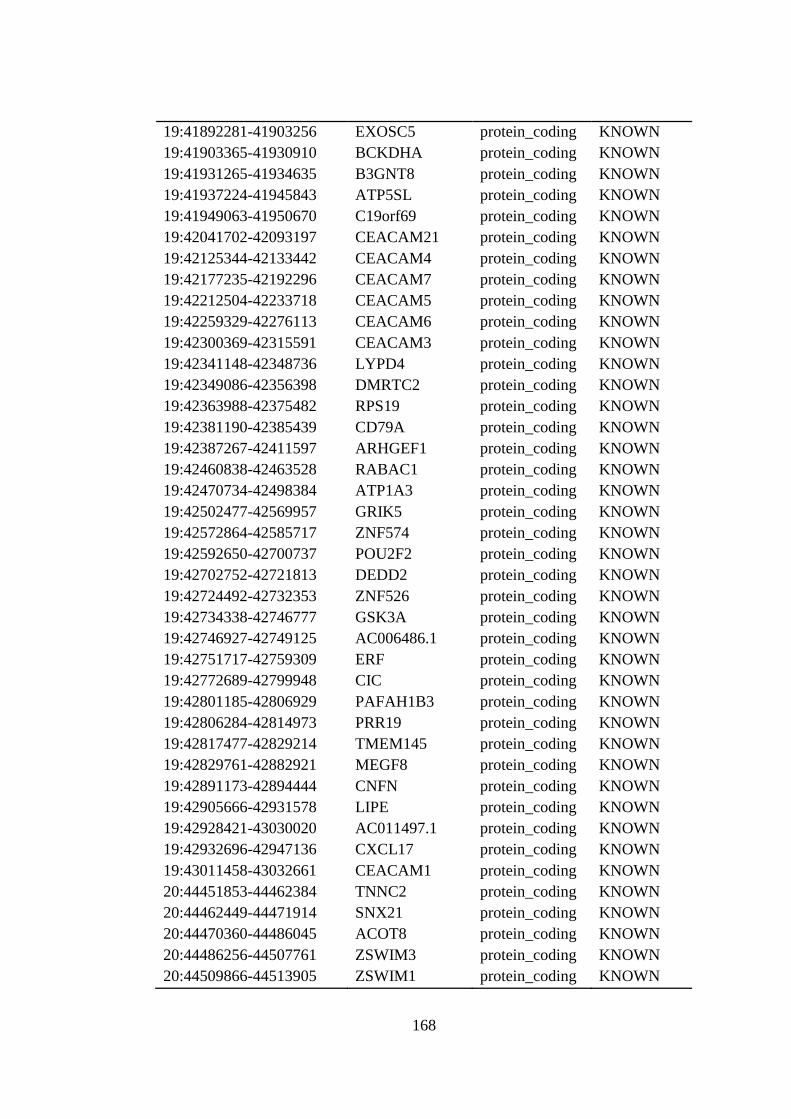
168
19:41892281-41903256 EXOSC5 protein_coding KNOWN
19:41903365-41930910 BCKDHA protein_coding KNOWN
19:41931265-41934635 B3GNT8 protein_coding KNOWN
19:41937224-41945843 ATP5SL protein_coding KNOWN
19:41949063-41950670 C19orf69 protein_coding KNOWN
19:42041702-42093197 CEACAM21 protein_coding KNOWN
19:42125344-42133442 CEACAM4 protein_coding KNOWN
19:42177235-42192296 CEACAM7 protein_coding KNOWN
19:42212504-42233718 CEACAM5 protein_coding KNOWN
19:42259329-42276113 CEACAM6 protein_coding KNOWN
19:42300369-42315591 CEACAM3 protein_coding KNOWN
19:42341148-42348736 LYPD4 protein_coding KNOWN
19:42349086-42356398 DMRTC2 protein_coding KNOWN
19:42363988-42375482 RPS19 protein_coding KNOWN
19:42381190-42385439 CD79A protein_coding KNOWN
19:42387267-42411597 ARHGEF1 protein_coding KNOWN
19:42460838-42463528 RABAC1 protein_coding KNOWN
19:42470734-42498384 ATP1A3 protein_coding KNOWN
19:42502477-42569957 GRIK5 protein_coding KNOWN
19:42572864-42585717 ZNF574 protein_coding KNOWN
19:42592650-42700737 POU2F2 protein_coding KNOWN
19:42702752-42721813 DEDD2 protein_coding KNOWN
19:42724492-42732353 ZNF526 protein_coding KNOWN
19:42734338-42746777 GSK3A protein_coding KNOWN
19:42746927-42749125 AC006486.1 protein_coding KNOWN
19:42751717-42759309 ERF protein_coding KNOWN
19:42772689-42799948 CIC protein_coding KNOWN
19:42801185-42806929 PAFAH1B3 protein_coding KNOWN
19:42806284-42814973 PRR19 protein_coding KNOWN
19:42817477-42829214 TMEM145 protein_coding KNOWN
19:42829761-42882921 MEGF8 protein_coding KNOWN
19:42891173-42894444 CNFN protein_coding KNOWN
19:42905666-42931578 LIPE protein_coding KNOWN
19:42928421-43030020 AC011497.1 protein_coding KNOWN
19:42932696-42947136 CXCL17 protein_coding KNOWN
19:43011458-43032661 CEACAM1 protein_coding KNOWN
20:44451853-44462384 TNNC2 protein_coding KNOWN
20:44462449-44471914 SNX21 protein_coding KNOWN
20:44470360-44486045 ACOT8 protein_coding KNOWN
20:44486256-44507761 ZSWIM3 protein_coding KNOWN
20:44509866-44513905 ZSWIM1 protein_coding KNOWN

169
20:44515128-44516274 SPATA25 protein_coding KNOWN
20:44517264-44519926 NEURL2 protein_coding KNOWN
20:44519591-44527459 CTSA protein_coding KNOWN
20:44527399-44540794 PLTP protein_coding KNOWN
20:44563267-44576662 PCIF1 protein_coding KNOWN
20:44577292-44600833 ZNF335 protein_coding KNOWN
20:44637547-44645200 MMP9 protein_coding KNOWN
20:44650329-44688789 SLC12A5 protein_coding KNOWN
20:44689624-44718591 NCOA5 protein_coding KNOWN
20:44746911-44758502 CD40 protein_coding KNOWN
20:44802372-44937137 CDH22 protein_coding KNOWN
20:44978167-44993043 SLC35C2 protein_coding KNOWN
20:44994688-45061704 ELMO2 protein_coding KNOWN
20:45129709-45142198 ZNF334 protein_coding KNOWN
20:45169585-45179213 OCSTAMP protein_coding KNOWN
20:45186463-45304714 SLC13A3 protein_coding KNOWN
20:45313004-45318418 TP53RK protein_coding KNOWN
20:45338126-45364965 SLC2A10 protein_coding KNOWN
20:45523263-45817492 EYA2 protein_coding KNOWN
20:45837859-45985567 ZMYND8 protein_coding KNOWN

170
Appendix C
Novel homozygous variants
Table C.1: Full list of novel homozygous variants at the homozygous regions
Chr:Start-End Func. Gene aa Change ExonicFunc
13:23363737-23363737 exonic C1QTNF9B p.F231F syn
13:24642937-24642937 exonic FAM123A p.D274A nonsyn
13:24643067-24643067 exonic FAM123A p.T231P nonsyn
13:24643068-24643068 exonic FAM123A p.L230delinsLP nonfr ins
13:24643070-24643070 exonic FAM123A p.L230fs fr ins
13:24643073-24643073 exonic FAM123A p.S229P nonsyn
13:25026001-25026001 exonic ATP8A2 p.I376M nonsyn
19:3551210-3551210 exonic TBXA2R p.P141P syn
19:3577742-3577742 exonic CACTIN p.S7A nonsyn
19:3703551-3703551 exonic APBA3 p.T450fs fr del
19:3710974-3710974 exonic APBA3 p.A97T nonsyn
19:4005416-4005416 exonic ZBTB7A p.Y272F nonsyn
19:4125809-4125809 exonic SIRT6 p.R264R syn
19:4125810-4125810 exonic SIRT6 p.R264H nonsyn
19:4188027-4188027 exonic EBI3 p.Y211C nonsyn
19:4462725-4462725 exonic PLIN4 p.Q735fs fr ins
19:4494834-4494834 exonic SEMA6B p.G816R nonsyn
19:4767464-4767464 exonic TICAM1 p.P642P syn
19:4905679-4905679 exonic UHRF1 p.A672fs fr ins
19:4905702-4905702 exonic UHRF1 p.P679P syn

171
19:4905706-4905706 exonic UHRF1 p.K681Q nonsyn
19:5180539-5180539 exonic PTPRS p.P758L nonsyn
19:5182618-5182618 exonic PTPRS p.A607T nonsyn
19:6326342-6326342 exonic PSPN p.P145H nonsyn
19:6326343-6326343 exonic PSPN p.P145A nonsyn
19:6375676-6375676 exonic KHSRP p.P13A nonsyn
19:6375677-6375677 exonic KHSRP p.G12G syn
19:6418744-6418744 exonic DENND1C p.F726S nonsyn
19:7007501-7007501 exonic MBD3L3 p.P153P syn
19:7007502-7007502 exonic MBD3L3 p.P153R nonsyn
19:6969691-6973065 exonic MBD3L3 p.V2502I nonsyn
19:7244837-7244837 exonic INSR p.L22L syn
19:7244859-7244859 exonic INSR p.L15R nonsyn
19:7604326-7604328 exonic PCP2 p.6_6del nonfr del
19:7840631-7840631 exonic FLJ22184 p.P1166P syn
19:7840639-7840639 exonic FLJ22184 p.E1164Q nonsyn
19:7840649-7840649 exonic FLJ22184 p.L1160L syn
19:8306001-8306001 exonic KANK3 p.A237G nonsyn
19:8470398-8470398 exonic PRAM1 p.P98P syn
19:8470404-8470404 exonic PRAM1 p.P96P syn
19:8470422-8470422 exonic PRAM1 p.D90E nonsyn
19:8470433-8470433 exonic PRAM1 p.E87K nonsyn
19:8929391-8929391 exonic MUC16 p.A6352V nonsyn
19:8929577-8929577 exonic MUC16 p.T6290I nonsyn
19:9223311-9223311 exonic OR7E24 p.D198fs fr del
19:9942658-9942658 exonic COL5A3 p.G1292V nonsyn
19:10063156-10063156 exonic C19orf66 p.W165G nonsyn
19:10268245-10268245 exonic ICAM5 p.S910P nonsyn
19:10268267-10268267 exonic ICAM5 p.F917C nonsyn
19:10268279-10268279 exonic ICAM5 p.L921P nonsyn
19:10292454-10292454 exonic RAVER1 p.P566P syn
19:10843437-10843437 exonic CARM1 p.P20R nonsyn
19:11477594-11477594 exonic ZNF653 p.E3G nonsyn
19:11694601-11694601 exonic ZNF823 p.C250R nonsyn
19:12357800-12376367 exonic ZNF443 p.V44G nonsyn
19:12618497-12618497 exonic MAN2B1 p.T991T syn
19:12661806-12661806 exonic FBXW9 p.R334R syn
19:12706132-12706132 exonic C19orf43 p.S114C nonsyn
19:12797543-12797543 exonic RTBDN p.S255G nonsyn
19:13270590-13270590 exonic CACNA1A p.G957R nonsyn
19:13270602-13270602 exonic CACNA1A p.T953P nonsyn
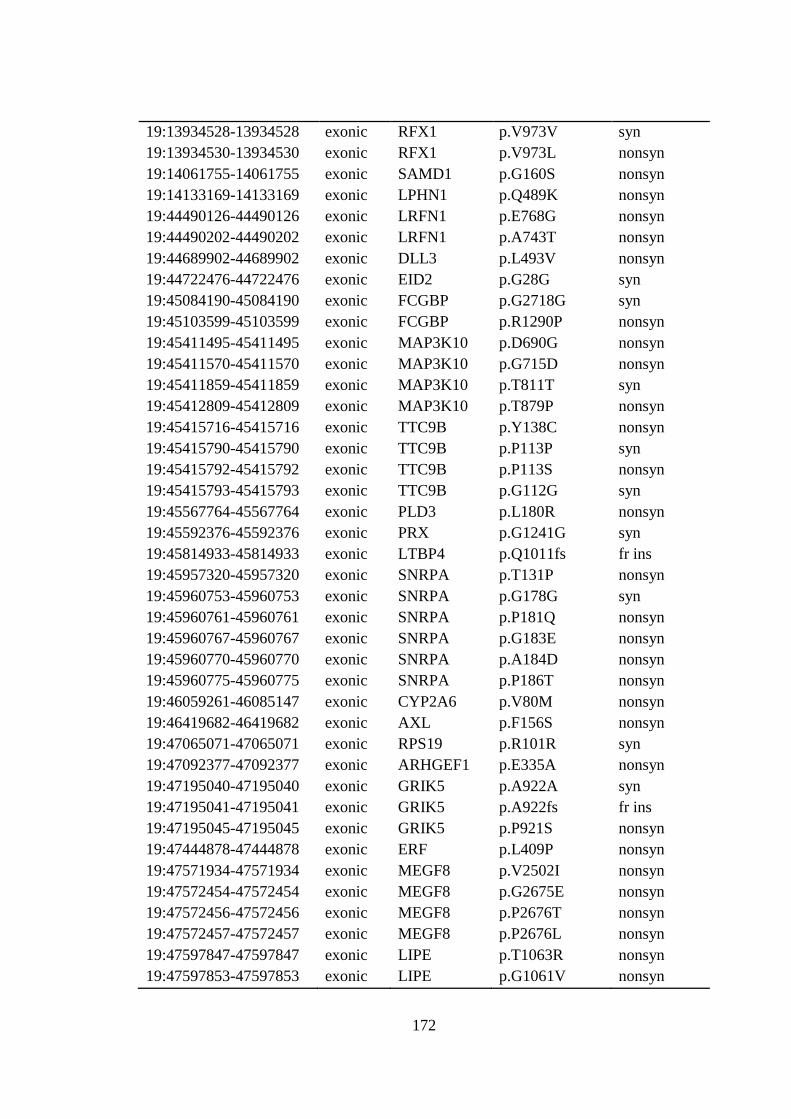
172
19:13934528-13934528 exonic RFX1 p.V973V syn
19:13934530-13934530 exonic RFX1 p.V973L nonsyn
19:14061755-14061755 exonic SAMD1 p.G160S nonsyn
19:14133169-14133169 exonic LPHN1 p.Q489K nonsyn
19:44490126-44490126 exonic LRFN1 p.E768G nonsyn
19:44490202-44490202 exonic LRFN1 p.A743T nonsyn
19:44689902-44689902 exonic DLL3 p.L493V nonsyn
19:44722476-44722476 exonic EID2 p.G28G syn
19:45084190-45084190 exonic FCGBP p.G2718G syn
19:45103599-45103599 exonic FCGBP p.R1290P nonsyn
19:45411495-45411495 exonic MAP3K10 p.D690G nonsyn
19:45411570-45411570 exonic MAP3K10 p.G715D nonsyn
19:45411859-45411859 exonic MAP3K10 p.T811T syn
19:45412809-45412809 exonic MAP3K10 p.T879P nonsyn
19:45415716-45415716 exonic TTC9B p.Y138C nonsyn
19:45415790-45415790 exonic TTC9B p.P113P syn
19:45415792-45415792 exonic TTC9B p.P113S nonsyn
19:45415793-45415793 exonic TTC9B p.G112G syn
19:45567764-45567764 exonic PLD3 p.L180R nonsyn
19:45592376-45592376 exonic PRX p.G1241G syn
19:45814933-45814933 exonic LTBP4 p.Q1011fs fr ins
19:45957320-45957320 exonic SNRPA p.T131P nonsyn
19:45960753-45960753 exonic SNRPA p.G178G syn
19:45960761-45960761 exonic SNRPA p.P181Q nonsyn
19:45960767-45960767 exonic SNRPA p.G183E nonsyn
19:45960770-45960770 exonic SNRPA p.A184D nonsyn
19:45960775-45960775 exonic SNRPA p.P186T nonsyn
19:46059261-46085147 exonic CYP2A6 p.V80M nonsyn
19:46419682-46419682 exonic AXL p.F156S nonsyn
19:47065071-47065071 exonic RPS19 p.R101R syn
19:47092377-47092377 exonic ARHGEF1 p.E335A nonsyn
19:47195040-47195040 exonic GRIK5 p.A922A syn
19:47195041-47195041 exonic GRIK5 p.A922fs fr ins
19:47195045-47195045 exonic GRIK5 p.P921S nonsyn
19:47444878-47444878 exonic ERF p.L409P nonsyn
19:47571934-47571934 exonic MEGF8 p.V2502I nonsyn
19:47572454-47572454 exonic MEGF8 p.G2675E nonsyn
19:47572456-47572456 exonic MEGF8 p.P2676T nonsyn
19:47572457-47572457 exonic MEGF8 p.P2676L nonsyn
19:47597847-47597847 exonic LIPE p.T1063R nonsyn
19:47597853-47597853 exonic LIPE p.G1061V nonsyn

173
19:47597854-47597854 exonic LIPE p.G1061R nonsyn
19:47597858-47597858 exonic LIPE p.P1059fs fr del
19:48064301-48064301 exonic PSG1 p.R345R syn
19:48064305-48064305 exonic PSG1 p.Y344F nonsyn
19:48551709-48551709 exonic CD177 p.T146A nonsyn
19:48803930-48803930 exonic ZNF428 p.A82A syn
19:48803931-48803931 exonic ZNF428 p.A82D nonsyn
19:49353814-49353814 exonic ZNF234 p.G602E nonsyn
19:49867907-49867907 exonic CEACAM19 p.Q85Q syn
19:49944090-49944090 exonic BCL3 p.A68G nonsyn
19:50104029-50104029 exonic APOE p.T212T syn
20:41976994-41976994 exonic TOX2 p.G17R nonsyn
20:41977001-41977001 exonic TOX2 p.E19A nonsyn
20:41977005-41977005 exonic TOX2 p.P20P syn
20:42574904-42574904 exonic SERINC3 p.M116T nonsyn
20:43953645-43953645 exonic CTSA p.L29M nonsyn
20:43953646-43953646 exonic CTSA p.L29Q nonsyn
20:43953647-43953647 exonic CTSA p.L29L syn
20:44097037-44097037 exonic SLC12A5 p.T55T syn
19:5182626-5182626 exonic;
splicing
PTPRS p.K604I nonsyn
19:7844306-7844306 exonic;
splicing
FLJ22184 p.L90fs fr ins
19:49708831-49708831 exonic;
splicing
CEACAM20 p.E390G nonsyn
19:8858187-8858187 splicing MUC16 - -
19:12741693-12741693 splicing HOOK2 - -

174
Appendix D
Exons of ATP8A2 isoform 1
Table D.1: Exons of longest transcript (ENST00000381655) of ATP8A2 isoform 1
(ENSP00000371070)
Exon
Rank
Ensembl Exon ID Exon Start/End (bp) CDS
Start/End
Length
(bp)
- 5' UTR 25946209-25946350 - 141
1 ENSE00001423490 25946209-25946426 1-76 217
2 ENSE00001719877 26043115-26043259 77-221 144
3 ENSE00001161731 26104137-26104236 222-321 99
4 ENSE00001002176 26104700-26104798 322-420 98
5 ENSE00001295032 26106410-26106455 421-466 45
6 ENSE00001335438 26107411-26107451 467-507 40
7 ENSE00001002184 26112126-26112199 508-581 73
8 ENSE00001002177 26114457-26114526 582-651 69
9 ENSE00001002183 26116057-26116184 652-779 127
10 ENSE00001002179 26117429-26117540 780-891 111
11 ENSE00001002181 26125476-26125641 892-1057 165
12 ENSE00001002182 26127931-26128058 1058-1185 127
13 ENSE00001002185 26129129-26129206 1186-1263 77
14 ENSE00001764388 26133111-26133199 1264-1352 88
15 ENSE00001144543 26133859-26133903 1353-1397 44
16 ENSE00001161708 26138094-26138169 1398-1473 75
17 ENSE00001144526 26144905-26145010 1474-1579 105

175
18 ENSE00001326309 26145748-26145830 1580-1662 82
19 ENSE00001144512 26148946-26148995 1663-1712 49
20 ENSE00001144505 26151207-26151276 1713-1782 69
21 ENSE00001144500 26152953-26153037 1783-1867 84
22 ENSE00001144494 26153946-26154085 1868-2007 139
23 ENSE00001144484 26155957-26156095 2008-2146 138
24 ENSE00001292904 26163773-26163837 2147-2211 64
25 ENSE00001144464 26273311-26273483 2212-2384 172
26 ENSE00001312575 26343184-26343367 2385-2568 183
27 ENSE00001002197 26348987-26349097 2569-2679 110
28 ENSE00001313811 26402256-26402330 2680-2754 74
29 ENSE00001714062 26411301-26411423 2755-2877 122
30 ENSE00001002198 26413684-26413762 2878-2956 78
31 ENSE00001002195 26434333-26434394 2957-3018 61
32 ENSE00001687596 26434942-26434998 3019-3075 56
33 ENSE00001771180 26436439-26436546 3076-3183 107
34 ENSE00001002200 26535713-26535801 3184-3272 88
35 ENSE00001161721 26542713-26542817 3273-3377 104
36 ENSE00001002199 26586669-26586760 3378-3469 91
37 ENSE00001489373 26594026-26599989 3470-3567 5963
- 3' UTR 26594124-26599989 - 5865

176
Appendix E
Functional Annotation Clusters
Table E.1: DAVID analysis to determine enrichment for genes whose expression
profiles correlated with ATP8A2
Annotation Cluster 1 (Enrichment Score: 3.73)
Catagory Term Count P_Value Benjamini
GOterm BP FAT neuron differentiation 18 1.8E-6 2.1E-3
GOterm BP FAT cell projection
morphogenesis
13 2.2E-6 1.4E-3
GOterm BP FAT neuron projection
morphogenesis
12 3.7E-6 1.5E-3
GOterm BP FAT cell morphogenesis
involved in differentiation
13 3.7E-6 1.1E-3
GOterm BP FAT cell part morphogenesis 13 3.7E-6 1.1E-3
GOterm BP FAT neuron projection
development
13 4.9E-6 1.2E-3
GOterm BP FAT cell morphogenesis
involved in neuron
differentiation
12 5.1E-6 1.0E-3
GOterm BP FAT cell projection
organization
15 1.1E-5 1.9E-3
GOterm BP FAT axonogenesis 11 1.2E-5 1.9E-3
GOterm BP FAT neuron development 14 2.0E-5 2.7E-3
GOterm BP FAT cell morphogenesis 14 3.5E-5 4.3E-3

177
GOterm BP FAT cellular component
morphogenesis
14 1.3E-4 1.0E-2
GOterm BP FAT developmental cell growth 4 2.6E-4 2.0E-2
GOterm BP FAT developmental growth 7 8.0E-4 4.4E-2
GOterm BP FAT growth 9 1.3E-3 5.5E-2
GOterm BP FAT axon extension 3 4.1E-3 1.1E-1
GOterm BP FAT cell growth 4 7.6E-3 1.5E-1
GOterm BP FAT regulation of cellular
component size
5 1.0E-1 6.5E-1
GOterm BP FAT regulation of cell size 4 1.2E-1 6.8E-1
GOterm BP FAT regulation of growth 6 1.5E-1 7.6E-1
GOterm BP FAT cell motion 5 5.8E-1 9.9E-1
Annotation Cluster 2 (Enrichment Score: 3.61)
Catagory Term Count P_Value Benjamini
SP PIR Keywords developmental protein 24 3.7E-5 4.0E-3
SP PIR Keywords neurogenesis 9 2.1E-4 1.5E-2
SP PIR Keywords differentiation 14 1.9E-3 6.7E-2
Annotation Cluster 3 (Enrichment Score: 3.01)
Catagory Term Count P_Value Benjamini
GOterm BP FAT neuron differentiation 18 1.8E-6 2.1E-3
GOterm BP FAT regulation of nervous
system development
10 3.6E-5 4.0E-3
GOterm BP FAT regulation of neurogenesis 9 1.0E-4 8.8E-3
GOterm BP FAT regulation of cell
development
9 3.6E-4 2.4E-2
GOterm BP FAT regulation of neuron
differentiation
7 8.9E-4 4.3E-2
GOterm BP FAT regulation of neuron
projection development
5 1.7E-3 6.5E-2
GOterm BP FAT forebrain development 8 2.4E-3 7.7E-2
GOterm BP FAT regulation of cell
projection organization
5 3.5E-3 9.4E-2
GOterm BP FAT regulation of cell
morphogenesis involved in
differentiation
4 1.7E-2 2.8E-1
GOterm BP FAT regulation of cell
morphogenesis
5 2.2E-2 3.2E-1
GOterm BP FAT regulation of axonogenesis 3 6.8E-2 5.5E-1
Annotation Cluster 4 (Enrichment Score: 2.8)
Category Term Count P_Value Benjamini
GOterm BP FAT regulation of transcription 45 4.1E-5 4.2E-3

178
GOterm MF FAT transcription regulator
activity
29 1.1E-4 2.9E-2
GOterm BP FAT regulation of RNA
metabolic process
32 3.1E-4 2.2E-2
GOterm BP FAT regulation of transcription,
DNA-dependent
31 5.3E-4 3.2E-2
SP PIR Keywords DNA-binding 30 8.4E-4 4.4E-2
SP PIR Keywords transcription regulation 32 8.9E-4 3.8E-2
GOterm MF FAT DNA binding 34 1.6E-3 1.9E-1
GOterm BP FAT transcription 32 5.2E-3 1.2E-1
SP PIR Keywords Transcription 32 7.0E-3 1.9E-1
GOterm MF FAT transcription factor activity 17 1.1E-2 6.4E-1
GOterm MF FAT sequence-specific DNA
binding
13 2.0E-2 6.6E-1
SP PIR Keywords nucleus 54 3.9E-2 4.6E-1
Annotation Cluster 5 (Enrichment Score: 2.78)
Catagory Term Count P_Value Benjamini
GOterm MF FAT transcription regulator
activity
29 1.1E-4 2.9E-2
GOterm BP FAT regulation of RNA
metabolic process
32 3.1E-4 2.2E-2
GOterm BP FAT regulation of transcription,
DNA-dependent
31 5.3E-4 3.2E-2
GOterm BP FAT positive regulation of
transcription
15 7.3E-4 4.2E-2
GOterm BP FAT positive regulation of gene
expression
15 9.5E-4 4.4E-2
GOterm BP FAT regulation of transcription
from RNA polymerase II
promoter
17 1.2E-3 5.2E-2
GOterm BP FAT positive regulation of
nucleobase, nucleoside,
nucleotide and nucleic
acid metabolic process
15 1.4E-3 5.9E-2
GOterm BP FAT positive regulation of
macromolecule metabolic
process
17 1.6E-3 6.2E-2
GOterm BP FAT positive regulation of
nitrogen compound
metabolic process
15 1.9E-3 7.1E-2
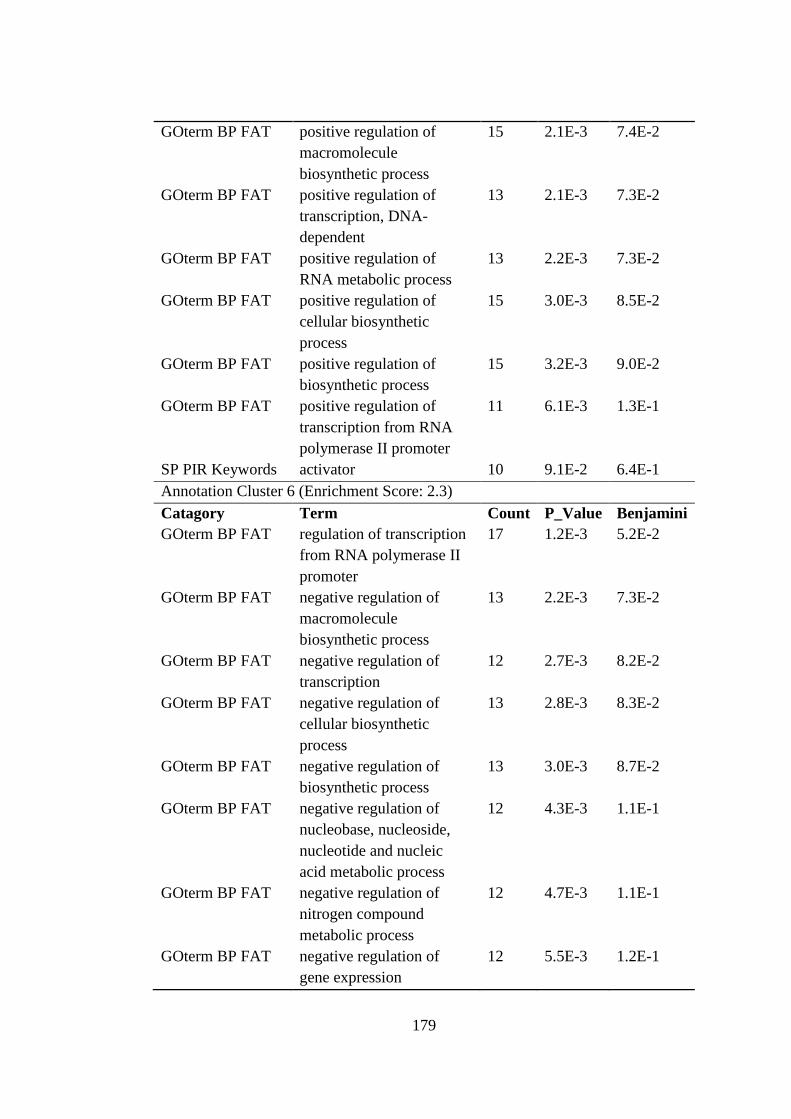
179
GOterm BP FAT positive regulation of
macromolecule
biosynthetic process
15 2.1E-3 7.4E-2
GOterm BP FAT positive regulation of
transcription, DNA-
dependent
13 2.1E-3 7.3E-2
GOterm BP FAT positive regulation of
RNA metabolic process
13 2.2E-3 7.3E-2
GOterm BP FAT positive regulation of
cellular biosynthetic
process
15 3.0E-3 8.5E-2
GOterm BP FAT positive regulation of
biosynthetic process
15 3.2E-3 9.0E-2
GOterm BP FAT positive regulation of
transcription from RNA
polymerase II promoter
11 6.1E-3 1.3E-1
SP PIR Keywords activator 10 9.1E-2 6.4E-1
Annotation Cluster 6 (Enrichment Score: 2.3)
Catagory Term Count P_Value Benjamini
GOterm BP FAT regulation of transcription
from RNA polymerase II
promoter
17 1.2E-3 5.2E-2
GOterm BP FAT negative regulation of
macromolecule
biosynthetic process
13 2.2E-3 7.3E-2
GOterm BP FAT negative regulation of
transcription
12 2.7E-3 8.2E-2
GOterm BP FAT negative regulation of
cellular biosynthetic
process
13 2.8E-3 8.3E-2
GOterm BP FAT negative regulation of
biosynthetic process
13 3.0E-3 8.7E-2
GOterm BP FAT negative regulation of
nucleobase, nucleoside,
nucleotide and nucleic
acid metabolic process
12 4.3E-3 1.1E-1
GOterm BP FAT negative regulation of
nitrogen compound
metabolic process
12 4.7E-3 1.1E-1
GOterm BP FAT negative regulation of
gene expression
12 5.5E-3 1.2E-1

180
GOterm BP FAT negative regulation of
transcription, DNA-
dependent
10 6.9E-3 1.4E-1
GOterm BP FAT negative regulation of
RNA metabolic process
10 7.2E-3 1.4E-1
GOterm BP FAT negative regulation of
macromolecule metabolic
process
13 9.8E-3 1.8E-1
GOterm BP FAT negative regulation of
transcription from RNA
polymerase II promoter
8 1.4E-2 2.3E-1
GOterm MF FAT transcription repressor
activity
7 2.9E-2 6.3E-1
Annotation Cluster 7 (Enrichment Score: 1.97)
Category Term Count P_Value Benjamini
INTERPRO Basic helix-loop-helix
dimerisation region bHLH
7 1.3E-3 4.5E-1
SMART HLH 7 3.1E-3 2.9E-1
UP SEQ Feature domain:Helix-loop-helix
motif
6 1.2E-2 8.3E-1
UP SEQ Feature DNA-binding region:Basic
motif
7 1.3E-2 8.0E-1
INTERPRO Helix-loop-helix DNA-
binding
3 2.3E-1 1.0E0
Annotation Cluster 8 (Enrichment Score: 1.69)
Category Term Count P_Value Benjamini
GOterm BP FAT negative regulation of
transcription from RNA
polymerase II promoter
8 1.4E-2 2.3E-1
GOterm BP FAT positive regulation of
mesenchymal cell
proliferation
3 2.4E-2 3.4E-1
GOterm BP FAT regulation of mesenchymal
cell proliferation
3 2.6E-2 3.6E-1

181
Chapter 8
Publications

Abstract. Recently, a functional T to G polymorphism atnucleotide 309 in the promoter region of the MDM2 gene (rs:2279744, SNP 309) has been identified. This polymorphismhas an impact on the expression of the MDM2 gene, which isa key negative regulator of the tumor suppressor molecule p53.The effect of T309G polymorphism of the MDM2 gene onbladder cancer susceptibility was investigated in a case-controlstudy of 75 bladder cancer patients and 103 controls fromTurkey. The G/G genotype exhibited an increased risk of 2.68(95% CI, 1.34-5.40) for bladder cancer compared with thecombination of low-risk genotypes T/T and T/G at this locus.These results show an association between MDM2 T309Gpolymorphism and bladder cancer in our study group. To thebest of our knowledge, this is the first study reporting thatMDM2 T309G polymorphism may be a potential geneticsusceptibility factor for bladder cancer.
Bladder cancer is a major cause of morbidity and mortality.In the Turkish population, it is the third most commoncancer in men and the eighth in women (1). Althoughmultiple environmental and host genetic factors are knownto be important in bladder cancer development, the exactmolecular mechanisms of genetic susceptibility andmolecular changes during malignant transformation are stillunder investigation.
Recently, a functional T to G polymorphism at nucleotide309 in the promoter region of the MDM2 gene (rs: 2279744)has been identified (2). We hypothesized that this genepolymorphism might be a critical predisposition factor forbladder cancer, as the MDM2 molecule is an importantplayer in bladder cancer pathogenesis, evidenced by its over-expression in 30% of urothelial carcinoma (3). This
oncoprotein attenuates p53 activity by promoting ubiquitin-mediated degradation (4). In addition to functionalinactivation by MDM2, structural TP53 mutations have beenobserved in 50% of urothelial cancer and these mutationswere associated with poor prognosis, advanced stage andhigher grade of the bladder cancer (3).
MDM2 T309G polymorphism is a functional polymorphismhaving an impact on the p53 protein level in the cell. The Gallele confers an increased binding affinity to the Sp1transcriptional activator, hence increased transcription of theMDM2 gene. Eventually, the relative increase in the level ofMDM2 protein causes a relative decrease in the level of thep53 protein (2).
It is recognized that host genetic factors modifying thegenotoxicity of carcinogens are important for the geneticsusceptibility to bladder cancer. For example, genepolymorphisms decreasing the carcinogen detoxificationactivity of glutathione S-tranferases and N-acetyltransferases are established predisposition factors for thiscancer (5). The p53 molecule is considered to be theguardian of the genome, since it plays a vital part in variousantineoplastic mechanisms such as cell cycle arrest,senescence and apoptosis, preventing the carcinogenic effectof mutagens (6). Therefore, it is conceivable that MDM2SNP 309, which has an effect on the level of p53, may alsobe a genetic predisposition factor for bladder cancer.
In order to investigate the role of MDM2 T309Gpolymorphism in bladder cancer, a case-control study wasperformed with 75 patients and 103 controls. Our resultsindicated an association between bladder cancer risk andMDM2 SNP309 polymorphism in the group indicated.
Patients and Methods
Peripheral blood samples were collected from 75 bladder cancerpatients and 103 age-matched controls (non-cancer) diagnosed atHacettepe University Medical School, and Ankara NumuneHospital, Turkey. The mean age of the bladder cancer patients was59.87 years, with a standard deviation of 12.54, range 25-87; themean age of the control group was 59.33 years, with a standarddeviation of 13.58, range 23-79. Genomic DNA was isolated from
3473
Correspondence to: Tayfun Özçelik, Department of MolecularBiology and Genetics, Bilkent University, Bilkent, Ankara 06800,Turkey. Fax: +90-312-266-5097, e-mail: [email protected]
Key Words: MDM2 polymorphism, bladder cancer, case-controlstudy, cancer predisposition.
ANTICANCER RESEARCH 26: 3473-3476 (2006)
MDM2 T309G Polymorphism is Associated with Bladder CancerONUR EMRE ONAT1, MESUT TEZ2, TAYFUN ÖZÇELIK1 and GÖKÇE A. TÖRÜNER3
1Department of Molecular Biology and Genetics, Bilkent University, Bilkent, Ankara 06800;2Department of Surgery, Ankara Numune Research and Teaching Hospital, Ankara 06100, Turkey;
3Center for Human and Molecular Genetics, UMDNJ–New Jersey Medical School, Newark, NJ 07103, U.S.A.
0250-7005/2006 $2.00+.40

200 Ìl blood by standard phenol-chloroform extraction. MDM2T309G polymorphism was determined by polymerase chain reaction(PCR) and restriction digestion. The PCR amplification was carriedout using primers: MDM2F (5’-GCTTTGCGGAGGTTTTGTT-3’)and MDM2R (5’-TCAAGTTCAGACACGTTCCG-3’). Afterconfirming the presence of the 304-bp amplicon on 2% agarose testgel, the PCR products were digested with MspA1I andelectrophoresed in 3% agarose gel for SNP 309 genotyping. The Tallele had a constitutional restriction site, which also served as aninternal control for restriction digestion. The G allele had anadditional restriction site to the constitutional restriction site. Afterdigestion, T allele yielded two fragments (193 bp and 111 bp), whereas the G allele yielded three fragments (147 bp, 111 bp and 46 bp)(Figure 1).
The G/G genotype was defined as the risk group for statisticalanalysis. Odds ratio (OD) tests with 95% confidence interval (CI)and ¯2 analysis were performed with the GraphPad Prism4statistical software.
Results and Discussion
The genotype frequencies of MDM2 T309G polymorphismin the bladder cancer patients and control groups aresummarized in Table I. The genotype frequency values forthe control group closely resembled the results from otherCaucasian populations (7-9) and were in Hardy Weinbergequilibrium. The comparison of the high-risk genotype(G/G) with the combination of the two low-risk alleles (G/Tand T/T) revealed that the G/G genotype conferred a risk of2.68 (95% CI 1.34-5.40) relative to the low-risk genotypes(Table I). The G allele frequency in the patient group was0.58 (T allele: 0.42), the control group it was 0.44 (T allele:0.56). There was a significant difference between the allelicfrequencies of the control (n=150 alleles) and patient groups(n=206 alleles) (¯2: 6.76, df: 1, p=0.0093). Odds ratioanalysis revealed that the G allele resulted in a 1.72-fold riskincrease (95% CI 1.14-2.60) compared to the T allele.
After the initial discovery of MDM2 T309G polymorphism,several reports were published with discordant resultsregarding the impact of this polymorphism on cancer risk. Intwo separate studies, it was shown that G/G genotype caused areduction in the age of onset of cancer in Li-Fraumenisyndrome patients (2, 10). However, no age of onset reductionwas observed for Lynch syndrome (7). The case-control studieson colorectal cancer (9), squamous cell carcinoma of the headand neck (9), uterine leiomyosarcoma (9), breast (8, 11) andovarian cancer (8) did not show an association. Interestingly,two lung cancer studies in the Chinese population reporteddiscordant results: in one study an association was observed(12), while in the other it was not (13).
Issues with sampling and population stratification havealways been cited for the lack of reproducibility betweendifferent case-control studies (14), but p53-related factorsmight also have contributed to such problems. It is intriguingthat MDM2 T309G polymorphism had an impact on ahereditary cancer syndrome (2, 10) characterized by germline p53 mutations (i.e., Li-Fraumeni syndrome), but had noeffect on another hereditary cancer such as lynch syndrome(7) with relatively rare somatic p53 mutations (15).
In conclusion, this study showed an association betweenMDM2 T309G polymorphism and bladder cancer in theTurkish population. The small sample size was a limitationof the study and the results should definitely be validatedon larger bladder cancer cohorts in different populations.That said, to our knowledge, the study is the first study toindicate that MDM2 T309G polymorphism could be apotential genetic susceptibility factor for bladder cancer.
References
1 Ozsari H and Atasever L: Cancer registry report of Turkey1993-1994. Turkish Ministry of Health, pp. 5-6, 1997.
2 Bond GL, Hu W, Bond EE, Robins H, Lutzker SG, Arva NC,Bargonetti J, Bartel F, Taubert H, Wuerl P, Onel K, Yip L,Hwang SJ, Strong LC, Lozano G and Levine AJ: A singlenucleotide polymorphism in the MDM2 promoter attenuatesthe p53 tumor suppressor pathway and accelerates tumorformation in humans. Cell 119: 591-602, 2004.
ANTICANCER RESEARCH 26: 3473-3476 (2006)
3474
Table I. Distribution of the MDM2 SNP 309 genotypes in the bladdercancer patient and control group.
Genotype Patient Control Odds ratio p valuegroup group (95% Cl)N=75 N=103 G/G vs.
(100%) (100%) T/T+T/G
T/T 13 (17.33) 29 (28.16)G/T 36 (48.00) 57 (55.34)G/G 26 (34.66) 17 (16.50) 2.68 (1.34-5.40) 0.0075
Figure 1. MDM2 T309G polymorphism genotyping. MspAI1 was used todigest PCR products and the products were electrophoresed on 3% agarosegel. T309G polymorphism produces one more restriction site (147 bp, 111bp, 46 bp), whereas the wild-type T allele produces two fragments (193 bp,111 bp). 97-571 and 97-572 are examples of G/T heterozygotes; 97-578and 97-601 are G/G homozygotes; and 97-603 is a T/T homozygote. M isthe pUC mix 8 (MBI Fermentas).

3 Wu XR: Urothelial tumorigenesis: a tale of divergent pathways.Nat Rev Cancer 9: 713-725, 2005.
4 Bond GL, Hu W and Levine A: A single nucleotidepolymorphism in the MDM2 gene from a molecular andcellular explanation to clinical effect. Cancer Res 65: 5481-5484,2005.
5 Garcia-Closas M, Malats N, Silverman D, Dosemeci M,Kogevinas M, Hein DW, Tardon A, Serra C, Carrato A,Garcia-Closas R, Lloreta J, Castano-Vinyals G,Yeager M,Welch R, Chanock S, Chatterjee N, Wacholder S, Samanic C,Tora M, Fernandez F, Real FX and Rothman N: NAT2 slowacetylation, GSTM1 null genotype, and risk of bladder cancer:results from the Spanish Bladder Cancer Study and meta-analyses. Lancet 26: 649-659, 2005.
6 Smith ND, Rubenstein JN, Eggener SE and Kozlowski JM: Thep53 tumor suppressor gene and nuclear protein: basic sciencereview and relevance in the management of bladder cancer. JUrol 169: 1219-1228, 2003.
7 Sotamaa K, Liyanarachchi S, Mecklin JP, Jarvinen H, AaltonenLA, Peltomaki P and de la Chapelle A: p53 codon 72 andMDM2 SNP309 polymorphisms and age of colorectal canceronset in lynch syndrome. Clin Cancer Res 11: 6840-6844, 2005.
8 Campbell IG, Eccles DM and Choong DY: No association ofthe MDM2 SNP309 polymorphism with risk of breast orovarian cancer. Cancer Lett, 2005 [Epub ahead of print].
9 Alhopuro P, Ylisaukko-Oja SK, Koskinen WJ, Bono P, ArolaJ, Jarvinen HJ, Mecklin JP, Atula T, Kontio R, Makitie AA,Suominen S, Leivo I, Vahteristo P, Aaltonen LM and AaltonenLA: The MDM2 promoter polymorphism SNP309T→G and therisk of uterine leiomyosarcoma, colorectal cancer, andsquamous cell carcinoma of the head and neck. J Med Genet42: 694-698, 2005.
10 Bougeard G, Baert-Desurmont S, Tournier I, Vasseur S, MartinC, Brugieres L, Chompret A, Bressac-de Paillerets B, Stoppa-Lyonnet D, Bonaiti-Pellie C and Frebourg T: Impact of theMDM2 SNP309 and TP53 Arg72Pro polymorphism on age oftumour onset in Li-Fraumeni syndrome. J Med Genet 43: 531-533, 2006.
11 Ma H, Hu Z, Zhai X, Wang S, Wang X, Qin J, Jin G, Liu J,Wang X, Wei Q and Shen H: Polymorphisms in the MDM2promoter and risk of breast cancer: a case-control analysis in aChinese population. Cancer Lett, 2005 [Epub ahead of print].
12 Hu Z, Ma H, Lu D, Qian J, Zhou J, Chen Y, Xu L, Wang X,Wei Q and Shen H: Genetic variants in the MDM2 promoterand lung cancer risk in a Chinese population. Int J Cancer 118:1275-1278, 2006.
13 Zhang X, Miao X, Guo Y, Tan W, Zhou Y, Sun T, Wang Yand Lin D: Genetic polymorphisms in cell cycle regulatorygenes MDM2 and TP53 are associated with susceptibility tolung cancer. Hum Mutat 27: 110-117, 2005.
14 Cardon LR and Bell JI: Association study designs for complexdiseases. Nat Rev Genet 2: 91-99, 2001.
15 Losi L, Di Gregorio C, Pedroni M, Ponti G, Roncucci L,Scarselli A, Genuardi M, Baglioni S, Marino M, Rossi G,Benatti P, Maffei S, Menigatti M, Roncari B and Ponz de LeonM: Molecular genetic alterations and clinical features in early-onset colorectal carcinomas and their role for the recognitionof hereditary cancer syndromes. Am J Gastroenterol 100: 2280-2287, 2005.
Received January 10, 2006Accepted May 16, 2006
Onat et al: MDM2 T309G Polymorphism is Associated with Bladder Cancer
3475

Mutations in the very low-density lipoproteinreceptor VLDLR cause cerebellar hypoplasiaand quadrupedal locomotion in humansTayfun Ozcelik*†‡, Nurten Akarsu§¶, Elif Uz*, Safak Caglayan*, Suleyman Gulsuner*, Onur Emre Onat*, Meliha Tan�,and Uner Tan**
*Department of Molecular Biology and Genetics, Faculty of Science and ‡Institute of Materials Science and Nanotechnology, Bilkent University,Ankara 06800, Turkey; §Department of Medical Genetics and ¶Gene Mapping Laboratory, Department of Pediatrics, Pediatric Hematology Unit,Ihsan Dogramaci Children’s Hospital, Hacettepe University Faculty of Medicine, Ankara 06100, Turkey; �Department of Neurology,Baskent University Medical School, Ankara 06490, Turkey; and **Faculty of Sciences, Cukurova University, Adana 01330, Turkey
Edited by Mary-Claire King, University of Washington, Seattle, WA, and approved January 16, 2008 (received for review October 22, 2007)
Quadrupedal gait in humans, also known as Unertan syndrome, isa rare phenotype associated with dysarthric speech, mental retar-dation, and varying degrees of cerebrocerebellar hypoplasia. Fourlarge consanguineous kindreds from Turkey manifest this pheno-type. In two families (A and D), shared homozygosity amongaffected relatives mapped the trait to a 1.3-Mb region of chromo-some 9p24. This genomic region includes the VLDLR gene, whichencodes the very low-density lipoprotein receptor, a component ofthe reelin signaling pathway involved in neuroblast migration inthe cerebral cortex and cerebellum. Sequence analysis of VLDLRrevealed nonsense mutation R257X in family A and single-nucleotide deletion c2339delT in family D. Both these mutationsare predicted to lead to truncated proteins lacking transmembraneand signaling domains. In two other families (B and C), thephenotype is not linked to chromosome 9p. Our data indicate thatmutations in VLDLR impair cerebrocerebellar function, conferringin these families a dramatic influence on gait, and that hereditarydisorders associated with quadrupedal gait in humans are genet-ically heterogeneous.
genetics � Unertan syndrome
Obligatory bipedal locomotion and upright posture of mod-ern humans are unique among living primates. Studies of
fossil hominids have contributed significantly to modern under-standing of the evolution of posture and locomotion (1–5), butlittle is known about the underlying molecular pathways fordevelopment of these traits. Evaluation of changes in brainactivity during voluntary walking in normal subjects suggests thatthe cerebral cortices controlling motor functions, visual cortex,basal ganglia, and the cerebellum might be involved in bipedallocomotor activities (6). The cerebellum is particularly impor-tant for movement control and plays a critical role in balance andlocomotion (7).
Neurodevelopmental disorders associated with cerebellar hy-poplasias are rare and often accompanied by additional neuro-pathology. These clinical phenotypes vary from predominantlycerebellar syndromes to sensorimotor neuropathology, ophthal-mological disturbances, involuntary movements, seizures, cog-nitive dysfunction, skeletal abnormalities, and cutaneous disor-ders, among others (8). Quadrupedal locomotion was firstreported when Tan (9, 10) described a large consanguineousfamily exhibiting Unertan syndrome, an autosomal recessiveneurodevelopmental condition with cerebellar and cortical hy-poplasia accompanied by mental retardation, primitive anddysarthric speech, and, most notably, quadrupedal locomotion.Subsequent homozygosity mapping indicated that the phenotypeof this family was linked to chromosome 17p (11). Thereafter,three additional families from Turkey (12–14) and another fromBrazil (15) with similar phenotypes have been described, andvideo recordings illustrating the quadrupedal gait have been
made (10–12). Here, we report that VLDLR is the gene respon-sible for the syndrome in two of these four Turkish families andreport additional gene mapping studies that indicate the disorderto be highly genetically heterogeneous.
Author contributions: T.O., N.A., and U.T. designed research; T.O., N.A., E.U., S.C., S.G., andO.E.O. performed research; T.O., N.A., E.U., S.C., S.G., and M.T. analyzed data; and T.O.,N.A., and U.T. wrote the paper.
The authors declare no conflict of interest.
This article is a PNAS Direct Submission.
†To whom correspondence should be addressed. E-mail: [email protected].
This article contains supporting information online at www.pnas.org/cgi/content/full/0710010105/DC1.
© 2008 by The National Academy of Sciences of the USA
Fig. 1. Phenotypic (A) and cranial radiologic (B) presentation of quadrupe-dal gait in families A and D. (A) Affected brothers VI:20 and VI:18 and cousinVI:25 in family A (Upper) and the proband II:2 in family D (Lower) displaypalmigrate walking. This is different from quadrupedal knuckle-walking ofthe great apes (2). The hands make contact with the ground at the ulnar palm,and consequently this area is heavily callused as exemplified by VI:20. Stra-bismus was observed in all affected individuals. (B) Coronal and midsagittalMRI sections of VI:20, demonstrating vermial hypoplasia, with the inferiorvermial portion being completely absent. Inferior cerebellar hypoplasia and amoderate simplification of the cerebral cortical gyri are noted. The brainstemand the pons are particularly small (Left and Center). Similar findings areobserved for II:2 (Right).
4232–4236 � PNAS � March 18, 2008 � vol. 105 � no. 11 www.pnas.org�cgi�doi�10.1073�pnas.0710010105

ResultsThe proband of Family A (12) is a 37-year-old male with habitualquadrupedal gait (Fig. 1A Upper Left and Fig. 2A, VI:20). He didnot make the transition to bipedality during his childhooddespite the efforts of his healthy parents. He has dysarthricspeech with a limited vocabulary, truncal ataxia, and profoundmental retardation. He was not aware of place or of the year,
month, or day. His MRI brain scan revealed inferior cerebellarand vermial hypoplasia, with the inferior vermial portion beingcompletely absent. Whereas corpus callosum appeared normal,a moderate simplification of the cerebral cortical gyri accom-panied by a particularly small brainstem and the pons wasobserved (Fig. 1 B Left and Center). Subsequently, we studied theproband’s affected brother and cousin (Fig. 1 A Upper Center and
Fig. 2. Homozygosity mapping of cerebellar hypoplasia and quadrupedal locomotion to chromosome 9p24 (A) and identification of the VLDLR c769C 3 Tmutation in family A (B) and of the VLDLR c2339delT mutation in family D (C). (A) Pedigree of family A; filled symbols represent the affected individuals. Squaresindicate males, and circles indicate females. Black bars represent the haplotype coinherited with the quadrupedal phenotype in the family. Recombination eventsin individuals VI:16 (obligate carrier) and VII:4 (normal sibling) positioned the disease gene between markers rs7847373 and rs10968723. Physical positions andpairwise lod scores for each marker are shown on the upper left. Zmax represents the maximum lod score obtained at � � 0.00 cM. (B and C) Sequences of criticalregions of VLDLR for wild-type and homozygous mutant genotypes.
Ozcelik et al. PNAS � March 18, 2008 � vol. 105 � no. 11 � 4233
GEN
ETIC
S

Upper Right and Fig. 2 A, VI:18 and VI:25) and other branchesof the family living in nearby villages in southeastern Turkey. Allaffected individuals were offspring of consanguineous marriages(Fig. 2 A). With the exception of one female (VII:1), who was anoccasional biped with ataxic gait, all affected persons in familyA had quadrupedal locomotion.
The proband of family D (14) is a 38-year-old male (Fig. 1 ALower Left and Center). Like all other quadrupedal individualsin these families, he did not make the transition to bipedalityduring his early childhood. He is profoundly retarded andexhibits dysarthric speech along with truncal ataxia. His MRIbrain scan images are consistent with moderate cerebral corticalsimplification and inferior cerebellar and vermial hypoplasia(Fig. 1B Right). The 65-year-old aunt and 63-year-old uncle of theproband are both mentally retarded and continue to walk ontheir wrists and feet despite their advanced ages. The family isconsanguineous; all relatives were raised in neighboring villageson the western tip of the Anatolian peninsula.
All patients in these four families had significant developmen-tal delay noted in infancy (Table 1). They sat unsupportedbetween 9 and 18 months, and began to crawl on hands and kneesor feet. Whereas normal infants make the transition to bipedalwalking in a short period, the affected individuals continued tomove on their palms and feet and never walked upright. Allpatients had severe truncal ataxia affecting their walking pat-terns. They can stand from a sitting position and maintain theupright position with flexed hips and knees. However, theyvirtually never initiate bipedal walking on their own and insteadambulate efficiently in a quadrupedal fashion. All patients hadhyperactive lower leg and vivid upper extremity reflexes. Normaltone and power were observed in motor examination. Allaffected persons were mentally retarded to the degree thatconsciousness of place, time, or other experience appeared to beabsent. However, no autistic features were expressed. Theaffected individuals all had good interpersonal skills, werefriendly and curious to visitors, and followed very simple ques-tions and commands. Additional clinical information on familiesA and D is provided in supporting information (SI) Table 2.
To identify the chromosomal locale of the gene or genesresponsible for this phenotype, we carried out genome-widelinkage analysis and homozygosity mapping in families A–C (see
Materials and Methods below). Although the families lived inisolated villages 200–300 km apart and reported no ancestralrelationship, the rarity of the quadrupedal gait in humans led usto expect a single locus shared by affected individuals in allfamilies. Instead, the trait mapped to three different chromo-somal locales. In family A, linkage analysis and homozygositymapping positioned the critical gene on chromosome 9p24between rs7847373 and rs10968723 in a 1.032-Mb region (Fig.2A and SI Fig. 4). In family B, the trait mapped to chromosome17p13, confirming a previous study (11). In family C, highlynegative logarithm of odds (lod) scores were obtained for bothchromosomes 9p24 and 17p13 (SI Figs. 5 and 6); gene mappingin this family is ongoing. In family D, polymorphic markers fromthe critical intervals of chromosomes 9p24 and 17p13 weregenotyped, and homozygosity was detected with markers on9p24. Together, these results indicate that the syndrome includ-ing quadrupedal gait, dysarthric speech, mental retardation, andcerebrocerebellar hypoplasia is genetically heterogeneous.
The chromosome 9p24 region linked to the trait in families Aand D includes VLDLR, the very low-density lipoprotein recep-tor. We hypothesized that a gene involved in neural develop-ment, cell positioning in brain, and cerebellar maturation couldbe involved in the pathogenesis of quadrupedal gait. In addition,cerebellar hypoplasia with cerebral gyral simplification wasshown to be associated with a genomic deletion that includesVLDLR (16). We therefore considered VLDLR (17) to be aprime positional candidate for our phenotype and sequenced thegene in genomic DNA from probands of the four families (SITable 3). The VLDLR sequence of affected members of familyA was homozygous for a nonsense mutation in exon 5 (c769C3T; R257X) (Fig. 2B). The VLDLR sequence of the proband offamily D was homozygous for a single-nucleotide deletion inexon 17 resulting in a stop codon (c2339delT; I780TfsX3) (Fig.2C). VLDLR sequences excluded the possibility of compoundheterozygosity in families B and C (SI Fig. 7). In families A andD, homozygosity for the VLDLR mutations was perfectly coin-herited with quadrupedal gait (SI Figs. 8 and 9). Both mutationswere absent from 100 unaffected individuals who live in the samelocal areas of southeastern and western Turkey as families A andD (SI Fig. 10).
Table 1. Physical, radiological, and genetic characteristics of the Turkish families in this study and of Hutterite family DES-H (27)
Characteristic Family A Family B Family C Family D DES-H
Chromosomal location 9p24 17p Not 9p or 17p 9p24 9p24Gene and mutation VLDLR
(c769C3 T)Unknown Unknown VLDLR
(c2339delT)Deletion including VLDLR
and LOC401491Gait Quadrupedal Quadrupedal Quadrupedal Quadrupedal BipedalSpeech Dysarthric Dysarthric Dysarthric Dysarthric DysarthricHypotonia Absent Absent Absent Absent PresentBarany caloric nystagmus Normal Cvs defect Pvs defect Not done Not doneMental retardation Profound Severe to profound Profound Profound Moderate to profoundAmbulation Delayed Delayed Delayed Delayed DelayedTruncal ataxia Severe Severe Severe Severe SevereLower leg reflexes Hyperactive Hyperactive Hyperactive Hyperactive HyperactiveUpper extremity reflexes Vivid Vivid Vivid Vivid VividTremor Very rare Mild Present Absent PresentPes-planus Present Present Present Present PresentSeizures Very rare Rare Rare Absent Observed in 40% of casesStrabismus Present Present Present Present PresentInferior cerebellum Hypoplasia Hypoplasia Mild hypoplasia Hypoplasia HypoplasiaInferior vermis Absent Absent Normal Absent AbsentCortical gyri Mild simplification Mild simplification Mild simplification Mild simplification Mild simplificationCorpus callosum Normal Reduced Normal Normal Normal
Cvs, central vestibular system; Pvs, peripheral vestibular system.
4234 � www.pnas.org�cgi�doi�10.1073�pnas.0710010105 Ozcelik et al.

VLDLR�R257X is in the ligand-binding domain, andVLDLR�I780TfsX3 is in the O-linked sugar domain of theVLDLR protein (Fig. 3 A and B). Mutant VLDLR transcriptswere expressed in endothelial cells from blood of affectedindividuals (Fig. 3C), and in these cells, levels of mutant andwild-type transcript expression appeared approximately equal(Fig. 3D; please also see SI Text). Because the stop codons ofboth mutations are located in the extracellular domain ofVLDLR (Fig. 3B), the encoded mutant proteins could not beinserted into the membrane and could not function as receptorsfor reelin.
We propose VLDLR-associated Quadrupedal Locomotion(VLDLR-QL) or Unertan Syndrome Type 1 to describe thephenotype of families A and D.
DiscussionThe identification of these VLDLR mutations provides molec-ular insight into the pathogenesis of neurodevelopmental move-ment disorders and expands the scope of diseases caused bymutations in components of the reelin pathway (18). Reelin is asecreted glycoprotein that regulates neuronal positioning incortical brain structures and the migration of neurons along theradial glial fiber network by binding to lipoprotein receptorsVLDLR and APOER2 and the adapter protein DAB1 (19). Inthe cerebellum, reelin regulates Purkinje cell alignment (20),which is necessary for the formation of a well defined corticalplate through which postmitotic granual cells migrate to form theinternal granular layer (21). Homozygous mutations in the reelingene (RELN) cause the Norman–Roberts type lissencephalysyndrome, associated with severe abnormalities of the cerebel-lum, hippocampus, and brainstem (OMIM 257320) (22). Muta-tion of Reln in the mouse results in the reeler phenotype anddisrupts neuronal migration in several brain regions and givesrise to functional deficits such as ataxic gait and trembling (23).In contrast, mice deficient for Vldlr appear neurologically normal
(24), but the cerebellae of these mice are small, with reducedfoliation and heterotopic Purkinje cells (17).
In humans, homozygosity for either of two VLDLR truncatingmutations leads to cerebrocerebellar hypoplasia, specificallyvermial hypoplasia, accompanied by mental retardation, dysar-thric speech, and quadrupedal gait. In the Hutterite populationof North America, homozygosity for a 199-kb deletion encom-passing the VLDLR gene leads to a form of DisequilibriumSyndrome (DES-H, OMIM 224050), characterized by nonpro-gressive cerebellar hypoplasia with moderate-to-profound men-tal retardation, cerebral gyral simplification, truncal ataxia, anddelayed ambulation (16). The designation Disequilibrium Syn-drome was originally given to cerebral palsy characterized by avariety of congenital abnormalities, including mental retarda-tion, disturbed equilibrium, severely retarded motor develop-ment, muscular hypotonia, and perceptual abnormalities (25,26). Neither DES-H nor other disequilibrium syndromes havebeen reported to include quadrupedal gait. The movement ofmost DES-H patients was so severely affected that independentwalking was not possible. Those who could walk had a wide-based, nontandem gait (27).
The neurological phenotypes in the Turkish families and in theHutterite families appear similar, with the most striking differ-ence being the consistent adoption of efficient quadrupedallocomotion by the affected Turkish individuals (Table 1). In ourview, the movement disorder described for the Hutterite patientsmay be a more profound deficit, with the patients perhapslacking the motor skills for quadrupedal locomotion. The 199-kbdeletion in DES-H encompasses the entire VLDLR gene andpart of a hypothetical gene. LOC401491, the hypothetical gene,is an apparently noncoding RNA that shares a CpG island andlikely promoter with VLDLR, and is represented by multiplealternative transcripts expressed in brain. It has been suggestedthat the DES-H phenotype could be the result of deletion ofVLDLR or both VLDLR and the neighboring gene (16).
Fig. 3. Functional domains of VLDLR with positions of the mutations relative to the exons (A), domains (B), and the analysis of VLDLR transcript (C and D).(A) The gene consists of 19 exons. Arrows indicate the locations of the mutations. (B) VLDLR consists of ligand-binding type repeat (LBTR), epidermal growthfactor repeat (EGFR) I–III, YWTD �-propeller (YWTD), O-linked sugar domain (OLSD), transmembrane domain (TD), and cytoplasmic domain (CD) (34)(www.expasy.org/uniprot/P98155). (C) Restriction-based analysis with HphI revealed the presence of only the mutant (347 bp) and both the mutant and wild type(396 and 347 bp; please note that the 49-bp fragment is not visible) VLDLR transcripts in patient VI:20 and carrier V:18 (both from family A), respectively. M isa DNA size marker. (D) Quantitative RT-PCR analysis of VLDLR transcript from peripheral blood samples of all probands in families A and D and controls wasperformed. Relative expression ratios were normalized according to the housekeeping gene GAPDH (glyceraldehyde-3-phosphate dehydrogenase) and theendothelial marker KDR (kinase insert domain receptor). �Ct values were calculated from duplicate samples and were converted to linear scale (35). Controldenotes ‘‘VLDLR expression in controls,’’ VLDLR-GAPDH denotes ‘‘VLDLR expression in patients normalized to GAPDH,’’ and finally VLDLR-KDR denotes ‘‘VLDLRexpression in patients normalized to KDR.’’
Ozcelik et al. PNAS � March 18, 2008 � vol. 105 � no. 11 � 4235
GEN
ETIC
S

It has been suggested that in the Turkish families, lack ofaccess to proper medical care exacerbated the effects of cere-bellar hypoplasia, leading to quadrupedality. Although it may betrue that family B lacked proper medical care, families A and Dhad consistent access to medical attention, and both familiesactively sought a correction of quadrupedal locomotion in theiraffected children. An unaffected individual in family A is aphysician who was actively involved in the medical interventions.In family D, the proband’s mother sought a definitive diagnosisand correction of the proband’s quadrupedal locomotion fromprivate medical practices and from two major academic medicalcenters. The parents in family A discouraged quadrupedalwalking of their affected children, but without success. Weconclude that social factors were highly unlikely to contribute tothe quadrupedal locomotion of the affected individuals.
In conclusion, we suggest that VLDLR-deficiency in the brainat a key stage of development leads to abnormal formation of theneural structures that are critical for gait. Given the heteroge-neity of causes of quadrupedal gait, identification of the genes infamilies B and C promises to offer insights into neurodevelop-mental mechanisms mediating gait in humans.
Materials and MethodsStudy Subjects. Parents of patients and other unaffected individuals gaveconsent to the study by signing the informed consent forms prepared accord-ing to the guidelines of the Ministry of Health in Turkey. The Ethics Commit-tees of Baskent and Cukurova Universities approved the study (decisionKA07/47, 02.04.2007 and 21/3, 08.11.2005, respectively).
Genome-Wide Linkage Analysis. Linkage analysis was performed by SNP geno-typing with the commercial release of the GeneChip 250K (NspI digest) or 10K
Affymetrix arrays as described (28). In addition, genotype data were analyzedby hand to identify regions of homozygosity. The parametric component ofthe Merlin package v1.01 was used for the multipoint linkage analysis assum-ing autosomal recessive mode of inheritance with full penetrance (29, 30). Theanalysis was carried out along a grid of locations equally spaced at 1 cM.Haplotype analysis was performed on chromosomal regions with positive lodscores (Fig. 2A and SI Figs. 4–6). Pairwise linkage was analyzed by using theMLINK component of the LINKAGE program (FASTLINK, version 3) (31–33).Markers D17S1298 (3.51 Mb) and D9S1779 (0.4 Mb), D9S1871 (3.7 Mb) wereused to test for homozygosity to chromosomes 17p13 and 9p24, respectively.
Mutation Search. Sequencing primers were designed for each VLDLR exon byusing Primer3, BLAST, and the sequence of NC�000009. DNA from all of theprobands was sequenced in both directions by using standard methods. Themutations in exons 5 (c769C 3 T) and 17 (c2339delT) were detected in allaffected (homozygous) and carrier (heterozygous) individuals of families Aand D, respectively. The c769C3 T mutation creates a restriction site for theenzyme HphI (5�-GGTGA(N)82 3�), and the c2339delT mutation abolishes arestriction site for the enzyme MboI (5�-G2 ATC-3�). Assays using theserestriction enzymes were developed to test for the mutations in all fourfamilies and in 200 healthy controls from the Turkish population. Restrictionbased mutation and quantitative RT-PCR analyses of VLDLR transcript inpatients and controls was also performed (please see SI Text relating to Fig. 3C and D).
ACKNOWLEDGMENTS. We thank the patients and family members for theirparticipation in this study, E. Tuncbilek and M. Alikasifoglu for providing themicroarray facility at Hacettepe University, Iclal Ozcelik for help in writing themanuscript, and Mehmet Ozturk for support. This work was supported by theScientific and Technological Research Council of Turkey Grant TUBITAK-SBAG3334, International Centre for Genetic Engineering and Biotechnology GrantICGEB-CRP/TUR04-01 (to T.O.), and by Baskent University Research Fund KA07/47 and TUBITAK-SBAG-HD-230 (to M.T.).
1. Spoor F, Wood B, Zonneveld F (1994) Nature 369:645–648.2. Richmond BG, Strait DS (2000) Nature 404:382–385.3. Bramble DM, Lieberman DE (2004) Nature 432:345–352.4. Alemseged Z, Spoor F, Kimbel WH, Bobe R, Geraads D, Reed D, Wynn JG (2006) Nature
443:296–301.5. Wood B (2006) Nature 443:278–281.6. Fukuyama H, Ouchi Y, Matsuzaki S, Nagahama Y, Yamauchi H, Ogawa M, Kimura J,
Shibasaki H (1997) Neurosci Lett 228:183–186.7. Morton SM, Bastian AJ (2007) Cerebellum 6:79–86.8. Fogel BL, Perlman S (2007) Lancet Neurol 6:245–257.9. Tan U (2005) Neuroquantology 4:250–255.
10. Tan U (2006) Int J Neurosci 116:361–369.11. Turkmen S, Demirhan O, Hoffmann K, Diers A, Zimmer C, Sperling K, Mundlos S (2006)
J Med Genet 43:461–464.12. Tan U, Karaca S, Tan M, Yilmaz B, Bagci NK, Ozkur A, Pence S (2008) Int J Neurosci
118:1–25.13. Tan U (2006) Int J Neurosci 116:763–774.14. Tan U (2008) In J Neurosci 118:211–225.15. Garcias GL, Roth MG (2007) Int J Neurosci 117:927–933.16. Boycott KM, Flavelle S, Bureau A, Glass HC, Fujiwara TM, Wirrell E, Davey K, Chudley AE,
Scott JN, McLeod DR, Parboosingh JS (2005) Am J Hum Genet 77:477–483.17. Trommsdorff M, Gotthardt M, Hiesberger T, Shelton J, Stockinger W, Nimpf J, Hammer
RE, Richardson JA, Herz J (1999) Cell 97:689–701.18. Tissir F, Goffinet AM (2003) Nat Rev Neurosci 4:496–505.
19. Hiesberger T, Trommsdorff M, Howell BW, Goffinet A, Mumby MC, Cooper JA, Herz J(1999) Neuron 24:481–489.
20. Miyata T, Nakajima K, Mikoshiba K, Ogawa M (1997) J Neurosci 17:3599–3609.21. Wechsler-Reya RJ, Scott MP (1999) Neuron 22:103–114.22. Hong SE, Shugart YY, Huang DT, Shahwan SA, Grant PE, Hourihane JO, Martin ND,
Walsh CA (2000) Nat Genet 26:93–96.23. D’Arcangelo G, Miao GG, Chen SC, Soares HD, Morgan JI, Curran T (1995) Nature
374:719–723.24. Frykman PK, Brown MS, Yamamoto T, Goldstein JL, Herz J (1995) Proc Natl Acad Sci
92:8453–8457.25. Hagberg B, Sanner G, Steen M (1972) Acta Paediat Scand 61(Suppl. 226):1–63.26. Sanner G (1973) Neuropaediatrie 4:403–413.27. Glass HC, Boycott KM, Adams C, Barlow K, Scott JN, Chudley AE, Fujiwara TM, Morgan
K, Wirrell E, McLeod DR (2005) Dev Med Child Neurol 47:691–695.28. Matsuzaki H, Dong S, Loi H, Di X, Liu G, Hubbell E, Law J, Berntsen T, Chadha M, Hui H,
et al. (2004) Nat Methods 1:109–111.29. Abecasis GR, Cherny SS, Cookson WO, Cardon LR (2002) Nat Genet 30:97–101.30. Abecasis GR, Wigginton JE (2005) Am J Hum Genet 77:754–767.31. Lathrop GM, Lalouel JM (1984) Am J Hum Genet 36:460–465.32. Cottingham RW, Jr, Idury RM, Schaffer AA (1993) Am J Hum Genet 53:252–263.33. Schaffer AA, Gupta SK, Shriram K, Cottingham RW, Jr (1994) Hum Hered 44:225–237.34. Herz J, Bock HH (2002) Annu Rev Biochem 71:405–434.35. Pfaffi MW (2004) in A-Z of Quantitative PCR, ed Bustin S (International University Line,
La Jolla, CA), pp 89–120.
4236 � www.pnas.org�cgi�doi�10.1073�pnas.0710010105 Ozcelik et al.

LETTER
Reply to Herz et al. and Humphreyet al.: Genetic heterogeneity ofcerebellar hypoplasia withquadrupedal locomotion
Mutations in the very low-density lipoprotein receptorVLDLR are responsible for cerebellar hypoplasia with qua-drupedal gait (1). The most likely mechanism leading to thisphenotype is that VLDLR deficiency in the brain at a keystage of development precludes the normal formation of neu-ral structures critical for gait. Quadrupedal gait is an integralpart of VLDLR-associated cerebellar hypoplasia syndrome inthese families (1, 2). It is not necessary to invoke an ‘‘epiphe-nomenon’’ or ‘‘unfavorable environmental conditions’’ to ex-plain the phenotype (3), but rather simply considering clinicalheterogeneity in the context of genomic understanding ofcomplex traits is sufficient.
Disequilibrium syndrome was first described by the Swedishneuropediatrician Bengt Hagberg and colleagues (4) as aform of cerebral palsy characterized by a variety of congenitalabnormalities. Subsequently, Schurig et al. (5) described, inthe North American Hutterite population, inherited cerebellardisorder with mental retardation, the genetic basis of whichproved to be homozygous deletion of the VLDLR gene andthe adjacent noncoding LOC401491 sequence (6). Based onthe phenotypic similarities of the Swedish and Hutterite pa-tients, the acronym DES-H [disequilibrium syndrome-Hutterites, Online Mendelian Inheritance in Man (OMIM)accession no. 224050] was adopted for this syndrome (6).
Our results (1) and those of others (7) extend these find-ings to different VLDLR mutations leading to cerebellar hyp-oplasia and related disequilibrium features, including in somefamilies bipedal gait (5, 6), in other families quadrupedal gait(1, 8), and in another family ‘‘gait ataxia’’ (7). Additional kin-dreds with disequilibrium syndrome and quadrupedal gaithave been described in Brazil (9) and Iraq (10). It will be in-teresting to know whether mutations responsible for the phe-notype in these families lie in the VLDLR gene or in oneof the other loci linked to this genetically heterogeneousphenotype (1).
The comments of Humphrey et al. (11) address three fun-damental features of genomic analysis of human traits: allelicheterogeneity, genotype–phenotype correlations, and variableexpression.
Allelic heterogeneity—the expression of the same pheno-type due to different mutations in a gene—is characteristic ofvirtually all human genetic disease. For example, homozygos-ity for any of �300 different mutations in the LDL receptorleads to hypercholesterolemia. It was to be expected, there-fore, that in different families different mutations in VLDLRwould lead to a phenotype comprising cerebellar hypoplasiawith quadrupedal gait. It would not be expected that quadru-
pedalism would be present only in the presence of one ‘‘spe-cific mutation.’’
The converse observation, of a correlation between geno-type and phenotype, is also characteristic of inherited humandisease. Different mutations in the same gene frequently leadto different clinical phenotypes. Contrary to the statement ofHumphrey et al. (11), the Hutterite families in North Americaand families A and D in Turkey do not carry ‘‘the same ho-mozygous mutation.’’ The Hutterite mutation is a completegenomic deletion of VLDLR; the mutations in Turkish fami-lies A and D are, respectively, a nonsense mutation and asingle-base-pair deletion leading to a frame shift in VLDLR.It is not surprising, therefore, that features of the cerebellarhypoplasia syndrome, including presence or absence of qua-drupedal walking, differ among families with different muta-tions in the gene.
Third, variable expression of a phenotype is frequently ob-served even among persons with the same mutation in a criti-cal gene. Variable expression may be due to differences ingenetic background of the individual, to differences in envi-ronmental exposures, or to chance. Among affected individu-als in families A and D, none displays exclusively bipedallocomotion; two affected individuals can walk bipedally forshort distances but prefer quadrupedal locomotion (1, 8).
Finally, the use of a walking frame to assist bipedalism inaffected individuals (12) does not demonstrate that the causeof quadrupedalism was ‘‘local cultural environment.’’ Wear-ing eyeglasses assists persons with myopia. Should we thenconclude that near-sightedness is caused by ‘‘local culturalenvironment’’?
Some descriptions by the press of Turkish families with cer-ebellar hypoplasia and quadrupedal gait have portrayed theaffected individuals as doomed to quadrupedal gait by thereligious beliefs of their parents (13). We hope that futuredescriptions of these families will conform to standards re-f lected in recent genomic analyses of their disorder.
Tayfun Ozcelik*†‡, Nurten Akarsu§¶, Elif Uz*, Safak Caglayan*,Suleyman Gulsuner*, Onur Emre Onat*, Meliha Tan�, andUner Tan***Department of Molecular Biology and Genetics, Faculty of Sci-ence, and †Institute of Materials Science and Nanotechnology,Bilkent University, Ankara 06800, Turkey; §Department of MedicalGenetics and ¶Gene Mapping Laboratory, Department of Pediat-rics, Pediatric Hematology Unit, Ihsan Dogramaci Children’sHospital, Hacettepe University Faculty of Medicine, Ankara 06100,Turkey; �Department of Neurology, Baskent University MedicalSchool, Ankara 06490, Turkey; and **Faculty of Sciences, Cuku-rova University, Adana 01330, Turkey
1. Ozcelik T, et al. (2008) Mutations in the very low-density lipoprotein receptor VLDLR causecerebellar hypoplasia and quadrupedal locomotion in humans. Proc Natl Acad Sci USA105:4232–4236.
2. Tan U (2005) A new theory on the evolution of human mind. Unertan syndrome: Quadrupe-dality, primitive language, and severe mental retardation. NeuroQuantology 4:250–255.
3. Herz J, Boycott KM, Parboosingh JS (2008) ‘‘Devolution’’ of bipedality. Proc Natl AcadSci USA 105:E25.
4. Hagberg B, Scanner G, Steen M (1972) The dysequilibrium syndrome in cerebral palsy.Clinical aspects of treatment. Acta Paediatr Scand 61(Suppl 226):1–63.
5. Schurig V, Van Orman A, Bowen P (1981) Nonprogressive cerebellar disorder with mentalretardation and autosomal recessive inheritance in Hutterites. Am J Med Genet 9:43–53.
E32–E33 � PNAS � June 10, 2008 � vol. 105 � no. 23 www.pnas.org�cgi�doi�10.1073�pnas.0804078105

6. Boycott KM, et al. (2005) Homozygous deletion of the very low density lipoproteinreceptor gene causes autosomal recessive cerebellar hypoplasia with cerebral gyralsimplification. Am J Hum Genet 77:477–483.
7. Moheb LA, et al. (2008) Identification of a nonsense mutation in the very low-densitylipoprotein receptor gene (VLDLR) in an Iranian family with dysequilibrium syndrome.Eur J Hum Genet 16:270–273.
8. Turkmen S, et al. (March 26, 2008) Cerebellar hypoplasia, with quadrupedal locomo-tion, caused by mutations in the very low-density lipoprotein receptor gene. Eur J HumGenet, 10.1038/ejhg.2008.73.
9. Garcias GL, Roth MG (2007) A Brazilian family with quadrupedal gait, severe mentalretardation, coarse facial characteristics, and hirsutism. Int J Neurosci 117:927–933.
10. Fletcher M (October 17, 2007) Life on all fours. Times Online. Available at www.time-sonline.co.uk/tol/life�and�style/health/article2671426.ece.
11. Humphrey N, Mundlos S, Turkmen S (2008) Genes and quadrupedal locomotion inhumans. Proc Natl Acad Sci USA 105:E26.
12. Harrison J, Holt S (2006) The Family That Walks on All Fours (BBC, London).13. Ahuja A (2007) We’re all made with quadrupedal walking ability. Times Online. Available
at http://women.timesonline.co.uk/tol/life�and�style/women/the�way�we�live/article2671044.ece.
Author contributions: T.O., N.A., E.U., S.C., S.G., O.E.O., M.T., and U.T. wrote the paper.
The authors declare no conflict of interest.
‡To whom correspondence should be addressed. E-mail: [email protected].
© 2008 by The National Academy of Sciences of the USA
Ozcelik et al. PNAS � June 10, 2008 � vol. 105 � no. 23 � E33

10.1101/gr.126110.111Access the most recent version at doi: published online September 1, 2011Genome Res.
Suleyman Gulsuner, Ayse Begum Tekinay, Katja Doerschner, et al. locomotion in a consanguineous kindredthe gene responsible for cerebellar hypoplasia and quadrupedal Homozygosity mapping and targeted genomic sequencing reveal
MaterialSupplemental http://genome.cshlp.org/content/suppl/2011/08/26/gr.126110.111.DC1.html
P<P Published online September 1, 2011 in advance of the print journal.
Related Content
Genome Res. May , 2011 21: xi
Scope note
Genome Res. May , 2011 21: 658-664Yaniv Erlich, Simon Edvardson, Emily Hodges, et al.
in hereditary spastic paraparesisKIF1Amutation in Exome sequencing and disease-network analysis of a single family implicate a
Genome Res. May , 2011 21: 643-644Aravinda ChakravartiGenomic contributions to Mendelian disease
serviceEmail alerting
click heretop right corner of the article orReceive free email alerts when new articles cite this article - sign up in the box at the
object identifier (DOIs) and date of initial publication. by PubMed from initial publication. Citations to Advance online articles must include the digital publication). Advance online articles are citable and establish publication priority; they are indexedappeared in the paper journal (edited, typeset versions may be posted when available prior to final Advance online articles have been peer reviewed and accepted for publication but have not yet
http://genome.cshlp.org/subscriptions go to: Genome ResearchTo subscribe to
Copyright © 2011 by Cold Spring Harbor Laboratory Press
Cold Spring Harbor Laboratory Press on November 17, 2011 - Published by genome.cshlp.orgDownloaded from

Research
Homozygosity mapping and targeted genomicsequencing reveal the gene responsible for cerebellarhypoplasia and quadrupedal locomotionin a consanguineous kindredSuleyman Gulsuner,1 Ayse Begum Tekinay,2 Katja Doerschner,3,4 Huseyin Boyaci,3,4
Kaya Bilguvar,5,6,7 Hilal Unal,2 Aslihan Ors,4 O. Emre Onat,1 Ergin Atalar,4,8
A. Nazli Basak,9 Haluk Topaloglu,10 Tulay Kansu,11 Meliha Tan,12 Uner Tan,13
Murat Gunel,5,6,7 and Tayfun Ozcelik1,2,14
1Department of Molecular Biology and Genetics, Faculty of Science, Bilkent University, Ankara 06800, Turkey; 2Institute of Materials
Science and Nanotechnology, Bilkent University, Ankara 06800, Turkey; 3Department of Psychology, Faculty of Economics,
Administrative and Social Sciences, Bilkent University, Ankara 06800, Turkey; 4National Research Center for Magnetic Resonance,
Bilkent University, Ankara 06800 Turkey; 5Department of Neurosurgery, Yale University School of Medicine, New Haven, Connecticut
06510, USA; 6Department of Neurobiology, Yale University School of Medicine, New Haven, Connecticut 06510, USA; 7Department of
Genetics, Center for Human Genetics and Genomics and Program on Neurogenetics, Yale University School of Medicine, New Haven,
Connecticut 06510, USA; 8Department of Electrical and Electronics Engineering, Faculty of Engineering, Bilkent University, Ankara
06800, Turkey; 9NDAL Laboratory, School of Arts and Sciences, Bogazici University, Istanbul 34342, Turkey; 10Department of Pediatric
Neurology, Ihsan Dogramaci Children’s Hospital, Ankara 06100, Turkey; 11Department of Neurology, Hacettepe University Faculty of
Medicine, Ankara 06100, Turkey; 12Department of Neurology, Baskent University Faculty of Medicine, Ankara 06490, Turkey;13Department of Physiology, Cukurova University Faculty of Medicine, Adana 01330, Turkey
The biological basis for the development of the cerebro-cerebellar structures required for posture and gait in humans ispoorly understood. We investigated a large consanguineous family from Turkey exhibiting an extremely rare phenotypeassociated with quadrupedal locomotion, mental retardation, and cerebro-cerebellar hypoplasia, linked to a 7.1-Mb regionof homozygosity on chromosome 17p13.1–13.3. Diffusion weighted imaging and fiber tractography of the patients’ brainsrevealed morphological abnormalities in the cerebellum and corpus callosum, in particular atrophy of superior, middle,and inferior peduncles of the cerebellum. Structural magnetic resonance imaging showed additional morphometric ab-normalities in several cortical areas, including the corpus callosum, precentral gyrus, and Brodmann areas BA6, BA44,and BA45. Targeted sequencing of the entire homozygous region in three affected individuals and two obligate carriersuncovered a private missense mutation, WDR81 p.P856L, which cosegregated with the condition in the extended family.The mutation lies in a highly conserved region of WDR81, flanked by an N-terminal BEACH domain and C-terminalWD40 beta-propeller domains. WDR81 is predicted to be a transmembrane protein. It is highly expressed in the cere-bellum and corpus callosum, in particular in the Purkinje cell layer of the cerebellum. WDR81 represents the third gene,after VLDLR and CA8, implicated in quadrupedal locomotion in humans.
[Supplemental material is available for this article.]
Developmental abnormalities of the cerebellum are a rare and ge-
netically heterogeneous group of disorders characterized by loss of
balance and coordination. Identification of the genes responsible
for these disorders provides mechanistic insights into the regulation
of neuronal development, differentiation, morphogenesis, migra-
tion, and organization (Fogel and Perlman 2007). These genes can
be identified by exploiting targeted genomic sequencing in com-
bination with linkage analysis and homozygosity mapping (Ropers
2007; Bilguvar et al. 2010). We applied this approach to the analysis
of cerebellar hypoplasia and quadrupedal locomotion in an ex-
tended consanguineous family from southern Turkey.
Multiple families have been reported with cerebellar ataxia,
mental retardation, and disequilibrium syndrome (CAMRQ ) (Tan
2006; Turkmen et al. 2006, 2009; Moheb et al. 2008; Ozcelik et al.
2008; Kolb et al. 2010). All the reported CAMRQ families are con-
sanguineous with recessive inheritance of their condition. Clinical
characteristics vary slightly among the families. In four families
from Turkey and Iran, the condition is due to homozygosity for
mutations in the VLDLR gene encoding the very low density lipo-
protein receptor (CAMRQ1 [MIM 224050]). Each of these four
families harbors a different VLDLR mutation. In a fifth family, from
Iraq, the condition is due to homozygosity for a missense mutation
in the CA8 gene encoding carbonic anhydrase VIII (CAMRQ3 [MIM
613227]). In Family B, the first family described in the literature
14Corresponding author.E-mail [email protected] published online before print. Article, supplemental material, and pub-lication date are at http://www.genome.org/cgi/doi/10.1101/gr.126110.111.
21:000–000 � 2011 by Cold Spring Harbor Laboratory Press; ISSN 1088-9051/11; www.genome.org Genome Research 1www.genome.org
Cold Spring Harbor Laboratory Press on November 17, 2011 - Published by genome.cshlp.orgDownloaded from

and also referred to as Uner Tan syndrome (Tan 2006), homozy-
gosity mapping revealed a 7.1-Mb interval on chromosome 17p13,
containing 192 genes and at least 20 pseudogenes, that segre-
gates with the disease (CAMRQ2 [MIM 610185]) (Turkmen et al.
2006; Ozcelik et al. 2008). In order to identify the mutation re-
sponsible for CAMRQ2 in Family B, we targeted and fully se-
quenced the 7.1-Mb genomic interval and evaluated all variation
in the region.
Results
Description of the affected family
Family B came to medical attention because of the unusual form of
locomotion in five of the 19 siblings. A detailed clinical description,
including video recordings and genetic mapping, was published
elsewhere (Tan 2006; Turkmen et al. 2006; Ozcelik et al. 2008).
Pedigree analysis suggested autosomal recessive inheritance. Link-
age analysis and homozygosity mapping revealed a single locus on
chromosome 17p between D17S1866 and D17S960. Illumina 300
Duo v2 BeadChip SNP genotype data of two of the affected in-
dividuals (05-984 and 05-987) revealed a single 6.8-Mb homozy-
gous stretch between markers rs4617924–rs7338 (chr17: 114,669–
6,917,703) and confirmed that chromosome 17p is the only region
of interest (Supplemental Fig. 1).
The phenotype was further characterized by magnetic reso-
nance imaging (MRI) and morphometric analyses (Fig. 1). The
most dramatic morphological differences were significant re-
ductions in volume in the cerebellum and corpus callosum of the
patient’s brain (Fig. 1A). Both the cortex and the white matter of
the cerebellum were significantly smaller in the patients. In con-
trast, the volume occupied by the caudate nucleus was signifi-
cantly larger. Significant structural differences were also detected
in the motor areas precentral gyrus and BA6 (increased mean
curvature and gray matter volume) and motor speech areas pars
opercularis and pars triangularis (increased cortical thickness and
mean curvature) (Fig. 1B). A detailed account of the morphometric
analyses is presented in Supplemental Figure 2 and Supplemental
Table 1. Diffusion tensor imaging (DTI) and fiber tractography
revealed moderate to high atrophy in superior, middle, and in-
ferior cerebellar peduncles (Supplemental Fig. 3).
Targeted next-generation sequencing of the critical region
The critical region at chr17: 82,514–7,257,922 (hg19) was captured
by NimbleGen 385K microarrays and sequenced with 454 Life
Sciences (Roche) GS FLX in DNA of two of the affected individuals
(05-985, 05-987) and two of the unaffected obligate carrier parents
(05-981 father, 05-982 mother). An average of ;400 Mb, yielding
46.33 haploid coverage, was sequenced from the captured DNA of
each individual. An average of 79% of all reads from each sample
mapped to the target region, representing 1275-fold to 2247-fold
enrichment (Supplemental Table 2). On average, 99.4% of all targeted
bases were covered by at least four reads (Supplemental Table 3).
In a parallel experiment, the same region from the DNA of
another affected sibling (05-984) was captured with NimbleGen
HD2 2.1M sequence capture microarrays and sequenced on an
Illumina Genome Analyzer IIx. The captured region was enriched
123-fold, with 2.98 billion bases and 40.3 million reads obtained
and 28% of reads mapped to the targeted region; 99.6% of targeted
bases were covered by at least four reads. Combined sequence data
for the three affected siblings yielded at least a fourfold coverage of
99.78% of all coding base pairs, 95.32% of intronic and UTR base
pairs, and 91.36% of intergenic base pairs. The remaining 0.22% of
coding regions with less than fourfold coverage was analyzed by
Sanger sequencing (Supplemental Table 4).
With the 454 GS FLX platform, a total of 18,410 different
variants were detected at high confidence (defined as in Hedges
et al. 2009) in at least one sample (Supplemental Table 2). No ad-
ditional functional variants were detected with the Illumina se-
quencing platform. Comparison of the sequence data from both
platforms with Illumina 300 Duo v2 SNP genotype data indicated
that the alleles were detected with sensitivity and specificity >99%.
Heterozygous SNPs detected at the borders of the homozygous
blocks of the affected individuals narrowed the region of homo-
zygosity to 6.74 Mb (Supplemental Table 5). The Mendelian error
rate, an indicator of call errors (Hedges et al. 2009), was calculated
as 0.3%.
Of the 18,410 high-confidence variants, 17,281 were reported
by dbSNP. For each nonsynonymous SNP compatible with the
Mendelian transmission of the disease allele, the frequencies of
homozygotes for each allele were accessed from public databases.
With one exception, homozygosity at both alleles had been reported
in control populations. The one exception, rs55916885, was at a
nonconserved site and was predicted as tolerated by SIFT (Ng and
Henikoff 2001) and Polyphen-2 (Sunyaev et al. 2001). Based on
these observations, all previously reported nonsynonymous vari-
ants were excluded (Supplemental Table 6).
Of the 18,410 high-confidence variants, 1119 variants were
both novel vis-a-vis dbSNP132 and present in both the affected
siblings and their obligate carrier parents. These 1119 novel shared
variants were classified by genomic context: coding sequence or
flanking splice junctions (n = 20), 59 UTR or 39 UTR (n = 15),
intronic (n = 689), or intergenic (n = 395). The 20 variants in the
Figure 1. MRI-based morphological analysis of brain from affected andunaffected individuals. (A) Midsagittal MRI scans of a healthy control in-dividual (left) and affected relative from Family B (right). The highlightedregions show areas where volumetric differences are readily visible: corpuscallosum (1), third ventricle (2), fourth ventricle (3), and cerebellum (4).(B) Cortical regions with significant differences in morphometric param-eters are displayed on a reference cortex, from lateral and medial view:BA45 (5), BA44 (6), BA6 (7), precentral (8), superior temporal (9), superiorparietal (10), lateral occipital (11), fusiform (12), isthmus cingulated (13),posterior cingulated (14), frontal pole (15), medial orbitofrontal (16), andtemporal pole (17). Additional details are provided in SupplementalFigure 2 and Supplemental Table 1.
2 Genome Researchwww.genome.org
Gulsuner et al.
Cold Spring Harbor Laboratory Press on November 17, 2011 - Published by genome.cshlp.orgDownloaded from

coding sequence or flanking splice junctions were genotyped in the
family to evaluate cosegregation with the phenotype (Supplemental
Table 7). Genotypes of three missense variants were consistent with
the recessive inheritance of the disease allele in Family B: WDR81
p.P856L, MYBBP1A p.R671W, and ZNF594 p.L639F (Table 1). Of the
15 59/39 UTR variants, five cosegregated with the disease phenotype.
Therefore, they were carried to a more detailed analysis, including
evaluation of the protein interactions. None was found to interact
with previously identified genes with cerebellar phenotypes, in-
cluding CAMRQ-associated VLDLR and CA8 (Supplemental Table 8).
Identification of disease causing variant
MYBBP1A p.R671W could be excluded as the causal mutation for the
disorder of Family B based on the genotypes of controls (Supple-
mental Table 9). In 214 unrelated healthy controls (428 chromo-
somes), 50 of whom were sampled from the same region of Turkey as
Family B, 13 individuals were heterozygous for MYBBP1A p.R671W.
This carrier frequency yields an allele frequency of 0.016 and an
expected frequency of homozygotes of about one in 4000, far higher
than the frequency of CAMRQ2, which occurs in only one extended
family. In a second, independent series of 400 individuals of various
European and Middle Eastern ancestries, MYBBP1A was fully se-
quenced in the context of whole-exome sequencing. Of these 400
individuals, two were homozygous for MYBBP1A p.R671W. Neither
of these two homozygotes had any signs consistent with CAMRQ2.
MYBBP1A p.R671W was therefore excluded as the allele responsible
for the disorder of Family B.
ZNF594 p.L639F could be excluded as the causal mutation for
the disorder based on conservation considerations. Residue 639 of
ZNF594 is not well conserved: Two of 16 species sequenced have
phenylalanine (F) at the orthologous site, strongly suggesting that
phenylalanine at this site would also not be damaging in humans. A
negative GERP score (�0.665) for the mutated nucleotide indicates
that this site is probably evolving neutrally (Davydov et al. 2010).
The variant is predicted as ‘‘benign’’ (PSIC score difference, 0.301) by
PolyPhen (Sunyaev et al. 2001) and ‘‘damaging low confidence’’
(SIFT score, 0.04) by SIFT (Supplemental Table 10; Ng and Henikoff
2001). In addition, the human ZNF594 gene harbors polymorphic
nonsense mutations at sites near the missense at L639F. ZNF594
p.E684X appeared in four of 118 Yoruban controls (rs114754534;
allele frequency, 0.034), and ZNF594 p.Q681X appeared in one of
120 CEU controls (rs116878311; allele frequency, 0.0083) in the
HapMap series.
In contrast, WDR81 p.P856L (Fig. 2A,B; Supplemental Fig. 4) is
both rare and alters a highly conserved site. This missense did not
appear in any of the 549 individuals of the control series. WDR81 is
a highly conserved protein throughout vertebrates, with no poly-
morphic stops in any sequenced species. In particular, proline at
residue 856 is completely conserved in all known sequences of the
WDR81 protein (Fig. 2C).
The extended genealogy of Family B revealed consanguinity
in several branches of the kindred (Fig. 2D), whose ancestors have
migrated from a village on the Syrian side of the border with Hatay,
Turkey, in the early 1950s. Approximately 240 individuals span-
ning seven generation could be ascertained. WDR81 p.P856L was
genotyped in 177 members of the kindred spanning five genera-
tions. A single union of heterozygous carriers, 05-981 3 05-982,
was observed whose children include the affected individuals of
this study. None of the 172 unaffected individuals in the kindred is
homozygous for WDR81 p.P856L. Genetic counseling is in prog-
ress for the 27 members of the family who are heterozygous carriers
of the mutation. The status of WDR81 was evaluated in two dif-
ferent cohorts of the patients with neurodevelopmental/cerebellar
phenotypes for whom the underlying genetic cause is still un-
known. The first cohort consisted of 750 patients with structural
cortical malformations or degenerative neurological disorders. By
using the whole-genome genotyping data based on Illumina Hu-
man 370 Duo or 610K Quad BeadChips, we did not identify any
patient with a cerebellar phenotype or ataxia phenotype to harbor
a homozygous interval ($2.5 cM) surrounding the WDR81 locus.
Exome sequencing of the same group did not reveal any muta-
tions, including compound heterozygous substitutions. In the
second cohort of 58 probands, 12 had cerebellar hypoplasia with or
without quadrupedal gait. No additional mutations in WDR81
were identified by Sanger sequencing of the entire coding regions.
Characterization of WDR81
WDR81 p.P856L at chr17: 1,630,820 (hg19) lies in exon 1 of
WDR81 isoform 1 (ENST00000409644, NM_001163809.1, NP_
001157281.1), the longest isoform of WDR81, containing 10
exons and encoding 1941 amino acids (Fig. 2A). Proline at this site
was present in all species analyzed (Fig. 2C), including the most
distantly related sequenced ortholog, the Tetraodon nigroviridis
WDR81 protein, which is 47.8% identical and 57.2% similar and
has a distance score of 0.76 compared with the human protein.
WDR81 p.P856L was predicted to be ‘‘damaging’’ (SIFT score, 0) by
SIFT (Ng and Henikoff 2001), ‘‘probably damaging’’ (PSIC score
difference, 2.724) by PolyPhen (Sunyaev et al. 2001), and ‘‘under
evolutionary constraint’’ (GERP score, 5.68) by GERP (Davydov
et al. 2010).
The function of WDR81 is unknown, but clues can be derived
from its structure. The conserved region of WDR81 that includes
P856 is flanked on the N-terminal side by a BEACH (Beige and
Chediak-Higashi) domain at amino acids 352–607. BEACH proteins
Table 1. Missense variants co-inherited with cerebellar hypoplasia and quadrupedal locomotion in Family Ba
No. and percentage of variant reads
Gene Position (hg19) Ref Var Effect 05-981b 05-982b 05-985c 05-987c
WDR81 chr17: 1,630,820 C T P856L 41 (51%) 33 (52%) 40 (97%) 53 (100%)MYBBP1A chr17: 4,448,967 G A R671W 29 (52%) 21 (48%) 32 (97%) 29 (100%)ZNF594 chr17: 5,085,637 G A L639F 39 (54%) 50 (56%) 38 (97%) 37 (100%)
Ref indicates reference nucleotide; Var, variant nucleotide.aCoding regions, consensus splices-sites, and RNA genes.bCarrier.cAffected individual.
WDR81 is associated with CAMRQ2
Genome Research 3www.genome.org
Cold Spring Harbor Laboratory Press on November 17, 2011 - Published by genome.cshlp.orgDownloaded from
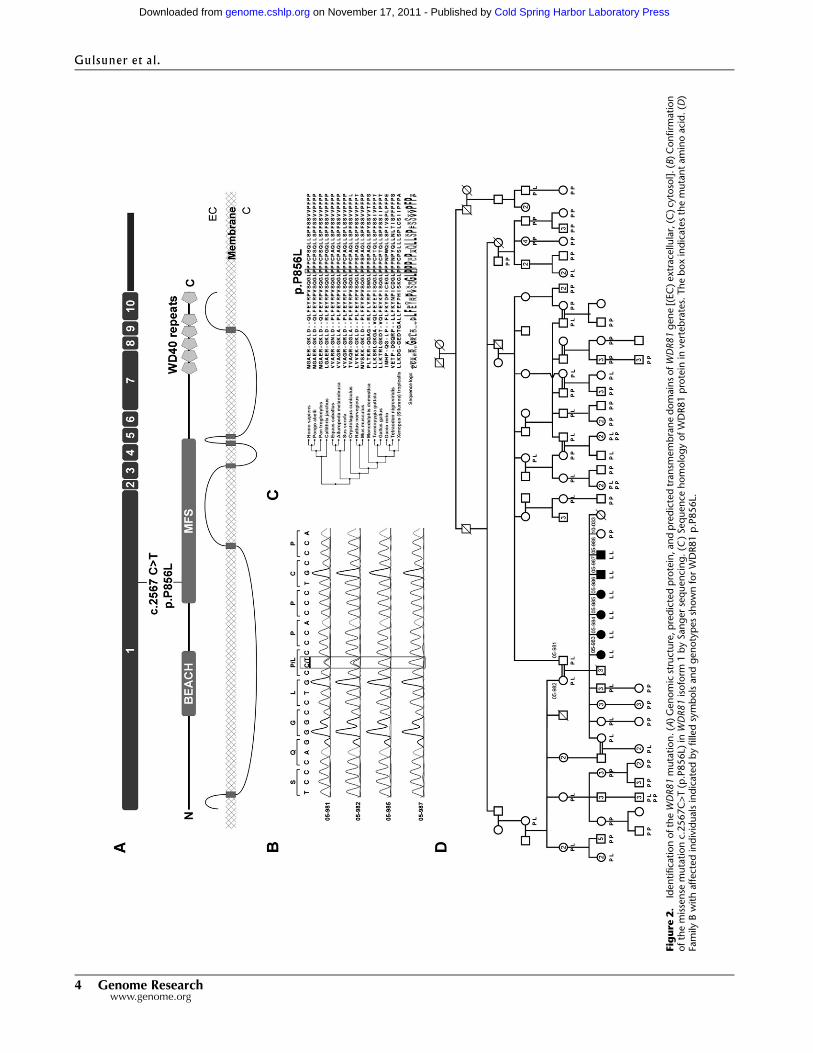
Fig
ure
2.
Iden
tifica
tion
ofth
eW
DR8
1m
uta
tion
.(A
)G
en
om
icst
ruct
ure
,p
red
icte
dp
rote
in,an
dp
red
icte
dtr
an
smem
bra
ne
dom
ain
sofW
DR8
1g
en
e[(
EC
)extr
ace
llula
r,(C
)cy
toso
l].(B
)C
on
firm
ati
on
ofth
em
isse
nse
muta
tion
c.2567C
>T
(p.P
856L)
inW
DR8
1is
ofo
rm1
by
San
ger
seq
uen
cin
g.(C
)Seq
uen
ceh
om
olo
gy
ofW
DR81
pro
tein
inve
rteb
rate
s.Th
eb
ox
ind
icate
sth
em
uta
nt
am
ino
aci
d.(D
)Fa
mily
Bw
ith
affect
ed
ind
ivid
uals
ind
icate
db
yfille
dsy
mb
ols
an
dg
en
oty
pes
show
nfo
rW
DR81
p.P
856L.
Gulsuner et al.
4 Genome Researchwww.genome.org
Cold Spring Harbor Laboratory Press on November 17, 2011 - Published by genome.cshlp.orgDownloaded from

have been implicated in membrane trafficking (Wang et al. 2000),
synapse morphogenesis (Khodosh et al. 2006), and lysosomal axon
transport (Lim and Kraut 2009). A BEACH domain is the major
structural feature of neurobeachin, a scaffolding protein disrupted in
a patient with autism (Volders et al. 2011). WDR81 p.P856L lies in
a major facilitator superfamily (MFS) domain, a region characteristic
of solute carrier transport proteins (Saier et al. 1999). The C terminus
of WDR81 is composed of six WD-repeats that are likely constituents
of a beta-propeller. Based on analysis by TMpred (www.ch.embnet.
org/software/TMPRED_form.html), WDR81 is a transmembrane
protein with six membrane-spanning domains, the most N-terminal
at amino acids 45–66 and the other five at the C terminus of the
protein, between amino acids 980 and 1815 (Fig. 2A). Supporting
the likelihood that WDR81 is a transmembrane protein is the
observation that WDR81 transcript expression is increased in
membrane-associated RNA in contrast to cytoplasmic RNA (4.14
folds, P = 0.03, and 1.78 folds, P = 0.0002 in Gene Expression Om-
nibus [GEO] [http://www.ncbi.nlm.nih.gov/geo/] data set GSE4175)
(Diehn et al. 2006).
In order to assess a possible role for WDR81 in regulating
motor behavior, we evaluated the expression profiles of human
and mouse WDR81/Wdr81 isoform 1 in the brain. Human WDR81
isoform 1 transcript was expressed in all the tissues evaluated
(Supplemental Fig. 5). In particular, all the brain tissues were pos-
itive for the transcript, with highest levels of expression in the
cerebellum and corpus callosum (Fig. 3A). In the mouse brain at
post-partum day P7, Wdr81 expression was observed in Purkinje
cell layer in the cerebellum (Fig. 3B,C). The cerebellum is a crucial
regulatory center for motor function.
We examined the expression of WDR81 in the context of ex-
pression profiles of the early embryonic mouse brain (GSE8091)
(Hartl et al. 2008). Differentially expressed genes within the day
groups were filtered (one-way ANOVA test Bonferroni-corrected P <
0.001, n = 3611). From these profiles, we identified the subset of
genes whose expression was highly correlated with that of WDR81
(R > 0.95, n = 670) and then used DAVID tools (Huang et al. 2009) to
evaluate the predicted functions of this subset of genes. The subset
of genes coexpressed with WDR81 was enriched for those involved
in neuronal differentiation and neuronal projection, axonogenesis,
and cell morphogenesis (Bonferroni-corrected P-values 2.3 3
10�11, 1.3 3 10�9, and 3.7 3 10�9, respectively). Among the genes
coexpressed with WDR81 were those encoding prion protein,
doublecortin (responsible for lissencephaly), and L1CAM (re-
sponsible for MASA syndrome) (Supplemental Table 11). WDR81
is not coexpressed with VLDLR and CA8, raising the possibility
that WDR81 represents a different developmental regulatory
pathway.
DiscussionThe identification of genes responsible for human disease has been
greatly facilitated with new technologies, particularly the targeted
enrichment of the genome by solution capture, followed by geno-
mic sequencing (Bilguvar et al. 2010). Despite these advances,
demonstrating the causality for a mutation in the absence of two or
more independent cases remains a challenge. This is particularly
true when multiple variants, none of them with obvious effect on
protein function, cosegregate with the phenotype in the family; the
candidate gene encodes a previously uncharacterized protein with
multiple isoforms, of which the critical mutation is on only one; and
the candidate mutation is a missense. However, unique families and
uncharacterized proteins exist, and precisely because of this reason,
it becomes imperative to fully exploit genetics and genomics ap-
proaches to distinguish the causative mutation.
We describe here the discovery of a mutation associated with
an extremely rare and genetically heterogeneous autosomal re-
cessive phenotype in a unique consanguineous family (Tan 2006).
The putative causative mutation could be distinguished from pre-
viously unknown rare polymorphisms in the same genomic region
by analysis of conservation at all candidate variant sites, by the
presence of polymorphic stops in the critical region of another
candidate gene, and by genotyping ethnically matched unaffected
individuals who would not be expected to carry homozygous mu-
tations at the mutant site. We conclude that the WDR81 p.P856L
mutation is the cause of cerebellar hypoplasia associated with qua-
drupedal locomotion in Family B.
WDR81 is an uncharacterized gene. It shows similarity with
a host of genes, including NSMAF (neutral sphyngomyelinase ac-
tivation associated factor), NBEA (neurobeachin), and LYST (lyso-
somal trafficking regulator). The LYST gene contains HEAT/ARM
repeats, a BEACH domain, and seven WD40 repeats (Ward et al.
2000). Nearly all reported LYST mutations result in protein trun-
cation and lead to Chediak-Higashi syndrome (CHS), which is
characterized by accumulation of giant intracellular vesicles lead-
ing to defects in the immune and blood systems (Rudelius et al.
2006). Two patients with missense LYST mutations have been
reported (Karim et al. 2002). Interestingly, these patients presented
with neurological symptoms without immunological involvement.
The LystIng3618/LystIng3618 mutant mouse harbors a missense mu-
tation in the WD40 domain. Purkinje cell degeneration accom-
panied by age-dependent impairment of motor coordination without
Figure 3. Expression pattern of WDR81 in brain. (A) Expression in hu-man brain with highest levels in cerebellum and corpus callosum. (B) Insitu hybridization of mouse embryonic brain revealing increased expres-sion of Wdr81 in purkinje cells and molecular layer of cerebellum. (C ) Nohybridization was observed with the sense probe. (ML) Molecular layer,(GL) granular layer.
WDR81 is associated with CAMRQ2
Genome Research 5www.genome.org
Cold Spring Harbor Laboratory Press on November 17, 2011 - Published by genome.cshlp.orgDownloaded from

signs of lysosomal deficiency in immunological organs were charac-
teristics of these animals (Rudelius et al. 2006).
Expression of WDR81 at high levels in the human cerebellum
and corpus callosum and in the Purkinje cell layer of the mouse
cerebellum is consistent with our observations of major structural
abnormalities in these regions of the brain of affected individuals.
Together, these observations suggest a possible role for WDR81 in
motor behavior. Further work will be required to understand the
normal biological function of WDR81 and the role of the mutation
in causing cerebellar hypoplasia and quadrupedal locomotion.
Genomic analysis of Family B demonstrates that WDR81 is highly
likely to be critical to these developmental processes.
Methods
Human subjectsThe institutional review boards of Bilkent, Hacettepe, Baskent,and Cukurova Universities approved the study (decisions: BEK02,28.08.2008; TBK08/4, 22.04.2008; KA07/47, 02.04.2007; and 21/3,08.11.2005, respectively). Written informed consent, preparedaccording to the guidelines of the Ministry of Health in Turkey, wasobtained from all family members and control group subjects priorto the study. A total of 18 subjects participated in MRI scans. Six ofthem were from Family B, including four affected siblings (05-984,05-986, 05-987, 05-988), one normal female sibling homozygousfor the wild-type allele of the WDR81 p.P856L variant (10-033),and their carrier father (05-981). The remaining 14 participantswere age- and sex-matched healthy controls. The two male pa-tients (age, mean 6 SD = 37.00 6 4.24) were matched to seven malecontrols (age, mean 6 SD = 35.14 6 5.76), and the two femalepatients (age, mean 6 SD=27.00 6 4.24) were matched to sevenfemale controls (age, mean 6 SD = 28.57 6 3.64). Family B mem-bers were scanned under sedation. For the healthy controls, nosedation was performed. Sedation was achieved by initial admin-istration of midazolam (2 mg per subject), which was followed bypropofol (120 mg) and fentanyl (50 mcg) administration in-travenously. Hypnosis level was adjusted by 20 mg injectionsof propofol approximately every 10 min to eliminate somatic re-sponses such as slight movements. Blood oxygen level and heartrate were monitored during the entire procedure. Eyelash reflexeswere absent at all times. Neuromuscular blockade was not used.
Next-generation sequencing
NimbleGen 385K microarrays were produced to capture the criti-cal region at chr17: 82,514–7,257,922 (hg19) using 7464 uniqueprobes with a total probe length of 4,853,455 bp. Sequence Searchand Alignment by Hashing Algorithm (SSAHA) (Ning et al. 2001)was used to determine probe uniqueness by NimbleGen (RocheNimbleGen). Sequence capture was conducted by the NimbleGenfacility using 25 mg of input DNA. Captured DNA samples weresubjected to standard sample preparation procedures for 454 GSFLX sequencing with Titanium series reagents. Four full 454 GSFLX runs were conducted for two affected individuals (05-985, 05-987) and their unaffected obligate carrier parents (05-981 father,05-982 mother). Sequence data were initially mapped to humangenome reference sequence and annotated using the GSMappersoftware package (Roche). Fold enrichment of the target region wascalculated with the formula +REMTrm/STrm: +RMG/SG as de-scribed previously (REMTrm, number of reads mapped to targetregion; STrm, size of target region; RMG, number of reads mappedoutside of the target region; SG, size of human genome) (Rehmanet al. 2010). Variants were identified with ALLDiff and more strin-
gent HCDiff approaches (Hedges et al. 2009). Annotation of variantswas made by GSMapper software using the refGene table of theUniversity of California, Santa Cruz (UCSC) Genome Browser(Fujita et al. 2010). Ensembl 62 genome annotation data for hg19human genome assembly were extracted using the BIOMART data-mining tool for further analysis of intronic and intergenic variantsin terms of hypothetical genes and splicing variants (Flicek et al.2011). Novel variants were reported based on the SNPs includedin the reference SNP database. For Illumina sequencing, a total of6,184,539-bp-long unique probes were designed to target a 9-Mbgenomic region spanning the disease locus (chr17:0–9,059,276;hg19) using a custom NimbleGen HD2 2.1M sequence capturemicroarray. Another affected individual was sequenced with theIllumina Genome Analyzer IIx. Illumina sequence data were map-ped to the reference genome using MAQ tools (Li et al. 2008), andsingle nucleotide variants were determined with Samtools (Li et al.2009). To determine indels, data were mapped with BWA (Li andDurbin 2010) and analyzed with Samtools. Sequence data werevisually analyzed using the Integrative Genomics Viewer (IGV)(Robinson et al. 2011).
Array based genotyping
We conducted Illumina 300 Duo v2 BeadChip for two affectedindividuals (05-984, 05-987) according to the manufacturer’s rec-ommendations (Illumina). The image data were normalized, andthe genotypes were called using data analysis software (Bead Stu-dio, Illumina). Sex, inbreeding, and sibship were confirmed.The Mendelian compatibility of sequence variants was analyzedwith PLINK (Purcell et al. 2007).
DNA sequencing
Confirmation of novel variants identified by next-generation se-quencing was done with conventional capillary sequencing. ThePrimer3 software (Rozen and Skaletsky 2000) was used to designPCR primers for the amplification of candidate variants (Supple-mental Table 12). Products were analyzed via gel electrophoresisand were sequenced using forward and reverse primers on an ABI3130 XL capillary sequencing instrument (Applied Biosystems).Sanger sequence trace files were analyzed with the CLCBio MainWorkbench software package (CLCBio Inc.).
Population screening
To distinguish the disease-causing variant from novel polymor-phisms, a population screening approach was conducted for eachcandidate variant. Allele-specific PCR (AS-PCR) and restriction frag-ment length polymorphism (RFLP) analyses were performed (Sup-plemental Table 12) on 1098 chromosomes from a healthy controlpopulation. In addition, the first-, second-, and third-degree rela-tives of the affected family, amounting to 177 individuals, weresampled for genotype analysis. Sanger sequencing was performed toconfirm all of the variants detected in the normal population usingthe above-mentioned methods. Racial distribution of the controlgroup was 100% Caucasian, including 22% from southeastern Turkey.
Quantitative real-time RT-PCR analysis of WDR81 expression
First-strand cDNA was prepared from multi-tissue RNA panels(Clontech: 636567, 636643; Agilent: 540007, 540117, 540137,540157, 540053, 540005, 540143, 540135) with RevertAid kit andrandom hexamer primers (Fermentas; K1622) after DNase I (Fer-mentas; EN0521) digestion. The PCR primers located in exon 1and flanking the mutation site were designed using Primer3 soft-
Gulsuner et al.
6 Genome Researchwww.genome.org
Cold Spring Harbor Laboratory Press on November 17, 2011 - Published by genome.cshlp.orgDownloaded from

ware (Supplemental Table 13; Rozen and Skaletsky 2000). SYBRGreen real-time PCR were realized according to standard protocols(BioRad; 170-8882) with 100% PCR efficiency. Each assay includedminus RT and nontemplate controls. Ct values were normalized toGAPDH as an internal control. The data were analyzed using thePfaffl method (Pfaffl 2001).
In situ hybridization
In order to examine the specific expression pattern of Wdr81 genein the mouse brain, probes that contain the mutated region inhuman patients were prepared by PCR amplification of the regionfrom mouse genomic DNA and subsequent cloning into plasmids.The riboprobes were synthesized by using Dig-labeled NTPs, andin situ hybridization experiments were performed as described(Tekinay et al. 2009). The Animal Ethics Committee of BilkentUniversity approved procedures for the tissue extraction and for insitu hybridization tests. Animals were group housed in a 12-h dark,12-h light cycle. Embryo and P7 brain sections were prepared asdescribed (Gong et al. 2003). Twenty-micrometer sagittal sectionswere taken with a cryostat (Leica). The antisense probe was preparedby PCR amplification from the mouse genomic DNA and sub-sequent cloning into pCR4-TOPO vector (Invitrogen). A modifiedversion of pSK vector was used for cloning the sense probe of thesame region. Digoxigenin (Dig)-labeled riboprobe was transcribedusing Dig-NTP in the transcription reaction. Riboprobes were pu-rified with Mini Quick Spin DNA columns (Roche) prior to hy-bridization. Sections were incubated at 60°C overnight in hybrid-ization buffer containing 50% formamide, 53 SSC, 53 Denhardt’sreagent, 50 mg/mL heparin, 500 mg/mL herring sperm DNA, and250 mg/mL yeast tRNA. Hybridized sections were washed for 90 minwith 50% formamide and 23 SSC at 60°C. Probes were detectedwith anti-Dig Fab fragments conjugated to alkaline phosphataseand NBT/BCIP substrate mixture (Tekinay et al. 2009).
Bioinformatics analyses
Homozygosity mapping analysis was performed using Homo-zygosityMapper software (Seelow et al. 2009). SIFT (Ng and Henikoff2001) and PolyPhen (Sunyaev et al. 2001) tools were used to pre-dict the functional impact of the variants. Genomic EvolutionaryRate Profiling (GERP) scores for each variant were obtained fromthe UCSC Genome Browser allHg19RS_BW track (Davydov et al.2010). The PFAM protein domain search module of CLCMainWorkbench V5.0 (CLCBio, Inc.) and ScanProsite (Gattiker et al.2002) tools were used to predict domains and possible effects of thevariant on protein product. Membrane spanning domains werepredicted using TMpred software (www.ch.embnet.org/software/TMPRED_form.html). Homology searches were performed withCLCMain Workbench using appropriate modules (reference se-quence accession codes for WDR81 orthologs are Ailuropodamelanoleuca, XP_002918082; Callithrix jacchus, XP_002747874; Daniorerio, XP_001921778; Equus caballus, XP_001502383; Gallus gallus,XP_415806; Monodelphis domestica, XP_001371487; Mus musculus,NP_620400; Oryctolagus cuniculus, XP_002718930; Pan troglodytes,XP_523527; Pongo abelii, XP_002826860; Rattus norvegicus, NP_001127832; Sus scrofa, XP_003131868; Taeniopygia guttata, XP_002194363; Tetraodon nigroviridis, CAG08933; Xenopus [Silurana]tropicalis, XP_002937192). Published microarray data sets of E9.5,E11.5, and E13.5 mouse brain tissue (GSE8091) were downloadedfrom the GEO database (http://www.ncbi.nlm.nih.gov/projects/geo/query/acc.cgi) (Hartl et al. 2008) and processed with GeneSpringGX V11.1 software (Agilent Technologies). Data sets were groupedwithin day groups, and standard quality control and filteringanalysis were performed (http://www.chem.agilent.com/cag/bsp/
products/gsgx/manuals/GeneSpring-manual.pdf). Differentially ex-pressed genes within the day groups were filtered using a one-wayANOVA test (Bonferroni-corrected P < 0.001). Genes that corre-lated with Wdr81 (R = 0.95 � 1.0) were obtained using the ‘‘FindSimilar Entity Lists’’ module of the software. Functional annota-tion clustering was performed using the obtained gene list byDAVID tools (Huang et al. 2009). WDR81 differential expression in theGEO data sets was further investigated using the NextBio System,a web-based data-mining engine (Kupershmidt et al. 2010), and theGSE4175 (Diehn et al. 2006) data set was selected as a significant dif-ference in membrane-associated RNA versus cytoplasmic RNA com-parisons. Ensembl identifiers of the candidate genes and transcriptsare as follows: WDR81 [ENSG00000167716; ENST00000409644],MYBBP1A [ENSG00000132382; ENST00000254718], and ZNF594[ENSG00000180626; ENST00000399604].
MRI data acquisition and structural analysis procedures
MRI data were acquired using a three Tesla scanner (MagnetomTrio, Siemens AG) with a 12-channel phase-array head coil. A high-resolution T1-weighted three-dimensional (3D) anatomical-vol-ume scan was acquired for each participant (single-shot turboflash; voxel size = 1 3 1 3 1 mm3; repetition time [TR] = 2600 msec;echo time[TE] = 3.02 msec; flip angle = 8°; field of view [FOV] = 256 3
224 mm2; slice orientation = sagittal; phase encode direction =
anterior-posterior; number of slices = 176; acceleration factor[GRAPPA] = 2). DTI data were acquired using a single-shot spin-echoEPI with a parallel imaging technique GRAPPA (acceleration factor2). The sequence was performed with 30 gradient directions, and thediffusion weighting b-factor was set to 800 sec/mm2 (TR, 6400msec; TE, 88 msec; in-plane resolution, 1 mm 3 1 mm; slice thick-ness, 3.0 mm; 50 transverse slices; base resolution, 128 3 128).Structural analyses were performed with the Freesurfer image anal-ysis package (http://surfer.nmr.mgh.harvard.edu/). The analysesinvolved intensity normalization, removal of nonbrain tissue, sub-cortical segmentation (Fischl et al. 2002), and identification of thewhite matter/gray matter boundary upon which cortical re-construction and volumetric parcellation were performed. Thecortex was then registered to a spherical atlas and parceled into unitsaccording to the gyral and sulcal structure based on the Desikan-Kilinay Atlas (Desikan et al. 2006) and the Destrieux Atlas (Destrieuxet al. 2010). Next, using the same software, we performed mor-phometric analyses of cortical thickness, mean curvature, surfacearea, and volume for each unit of parcellation and computed thegroup differences. Significant differences between the groups aredetermined using two-tailed unpaired t-tests at an alpha level of0.05. Fiber tracking was performed in MedINRIA (Toussaint et al.2007). Fibers with FA < 0.3 were excluded from the analysis. Regionof interests (ROIs) were drawn manually over cross-sections of su-perior, middle, and inferior cerebellar peduncles, using the MRIAtlas of Human White Matter as a reference (Oishi et al. 2010). ROIswere drawn at approximately corresponding locations for the pa-tients and healthy controls. Fiber tracts were first limited to passthrough these ROIs and were then subsequently refined using a re-cursive tracking technique (Toussaint et al. 2007). T1-weightedimages were coregistered with DWI data using FSL (Smith et al.2004; Woolrich et al. 2009). Final tracts were manually overlaid ontohigh-resolution T1-weighted images for illustration purposes.
Data accessSequence data of the homozygous region has been deposited at theDNA Data Bank of Japan (DDBJ; http://www.ddbj.nig.ac.jp/) underaccession no. DRA000432. SNP genotype data have been depositedat the European Genome-Phenome Archive (EGA; http://www.
WDR81 is associated with CAMRQ2
Genome Research 7www.genome.org
Cold Spring Harbor Laboratory Press on November 17, 2011 - Published by genome.cshlp.orgDownloaded from
ebi.ac.uk/ega/), which is hosted at the EBI, under accession no.EGAS00000000099.
AcknowledgmentsWe thank Dr. Mary-Claire King for innumerable discussions, sug-gestions, and critical reading of the manuscript. We also thank themembers of Family B and their relatives for cooperation in thisstudy. Dr. Alper Iseri and Dr. Bayram Kerkez kindly provided tech-nical and logistic support. This work was supported by the Scientificand Technological Research Council of Turkey (TUBITAK-SBAG108S036 and 108S355) and the Turkish Academy of Sciences (TUBAresearch support) to T.O., and the European Commission (PIRG-GA-2008-239467) and TUBA-GEBIP award to H.B.
Authors’ contributions: S.G., A.B.T., K.D., H.B., and T.O. con-ceived and designed the experiments. S.G., H.U., K.D., and H.B.performed the experiments. S.G., A.B.T., K.D., H.B., K.B., H.U.,A.O., E.A., T.K., M.G., and T.O. analyzed the data. O.E.O., A.N.B.,H.T., M.T., and U.T. contributed patient materials. S.G. and T.O.wrote the paper.
References
Bilguvar K, Ozturk AK, Louvi A, Kwan KY, Choi M, Tatli B, Yalnizoglu D,Tuysuz B, Caglayan AO, Gokben S, et al. 2010. Whole-exomesequencing identifies recessive WDR62 mutations in severe brainmalformations. Nature 467: 207–210.
Davydov EV, Goode DL, Sirota M, Cooper GM, Sidow A, Batzoglou S. 2010.Identifying a high fraction of the human genome to be under selectiveconstraint using GERP++. PLoS Comput Biol 6: e1001025. doi: 10.1371/journal.pcbi.1001025.
Desikan RS, Segonne F, Fischl B, Quinn BT, Dickerson BC, Blacker D, BucknerRL, Dale AM, Maguire RP, Hyman BT, et al. 2006. An automated labelingsystem for subdividing the human cerebral cortex on MRI scans intogyral based regions of interest. Neuroimage 31: 968–980.
Destrieux C, Fischl B, Dale A, Halgren E. 2010. Automatic parcellation ofhuman cortical gyri and sulci using standard anatomical nomenclature.Neuroimage 53: 1–15.
Diehn M, Bhattacharya R, Botstein D, Brown PO. 2006. Genome-scaleidentification of membrane-associated human mRNAs. PLoS Genet 2:e11. doi: 10.1371/journal.pgen.0020011.
Fischl B, Salat DH, Busa E, Albert M, Dieterich M, Haselgrove C, van derKouwe A, Killiany R, Kennedy D, Klaveness S, et al. 2002. Whole brainsegmentation: Automated labeling of neuroanatomical structures in thehuman brain. Neuron 33: 341–355.
Flicek P, Amode MR, Barrell D, Beal K, Brent S, Chen Y, Clapham P, Coates G,Fairley S, Fitzgerald S, et al. 2011. Ensembl 2011. Nucleic Acids Res 39:D800–D806.
Fogel BL, Perlman S. 2007. Clinical features and molecular genetics ofautosomal recessive cerebellar ataxias. Lancet Neurol 6: 245–257.
Fujita PA, Rhead B, Zweig AS, Hinrichs AS, Karolchik D. 2010. The UCSCGenome Browser database: update 2011. Nucleic Acids Res 39: D876–D882.
Gattiker A, Gasteiger E, Bairoch A. 2002. ScanProsite: a referenceimplementation of a PROSITE scanning tool. Appl Bioinformatics 1: 107–108.
Gong S, Zheng C, Doughty ML, Losos K, Didkovsky N, Schambra UB, NowakNJ, Joyner A, Leblanc G, Hatten ME, et al. 2003. A gene expression atlasof the central nervous system based on bacterial artificial chromosomes.Nature 425: 917–925.
Hartl D, Irmler M, Romer I, Mader MT, Mao L, Zabel C, de Angelis MH,Beckers J, Klose J. 2008. Transcriptome and proteome analysis of earlyembryonic mouse brain development. Proteomics 8: 1257–1265.
Hedges DJ, Burges D, Powell E, Almonte C, Huang J, Young S, Boese B,Schmidt M, Pericak-Vance MA, Martin E, et al. 2009. Exome sequencingof a multigenerational human pedigree. PLoS ONE 4: e8232. doi:10.1371/journal.pone.0008232.
Huang DW, Sherman BT, Lempicki RA. 2009. Systematic and integrativeanalysis of large gene lists using DAVID bioinformatics resources. NatProtoc 4: 44–57.
Karim MA, Suzuki K, Fukai K, Oh J, Nagle DL, Moore KJ, Barbosa E, Falik-Borenstein T, Filipovich A, Ischida Y, et al. 2002. Apparent genotype–phenotype correlation in childhood, adolescent, and adult Chediak–Higashi syndrome. Am J Med Genet 108: 16–22.
Khodosh R, Augsburger A, Schwarz TL, Garrity PA. 2006. Bchs, a BEACHdomain protein, antagonizes Rab11 in synapse morphogenesis andother developmental events. Development 133: 4655–4665.
Kolb LE, Arlier Z, Yalcinkaya C, Ozturk AK, Moliterno JA, Erturk O, Bayrakli F,Korkmaz B, DiLuna ML, Yasuno K, et al. 2010. Novel VLDLRmicrodeletion identified in two Turkish siblings with pachygyria andpontocerebellar atrophy. Neurogenetics 11: 319–325.
Kupershmidt I, Su Q J, Grewal A, Sundaresh S, Halperin I, Flynn J, Shekar M,Wang H, Park J, Cui W, et al. 2010. Ontology-based meta-analysis ofglobal collections of high-throughput public data. PLoS ONE 5: e13066.doi: 10.1371/journal.pone.0013066.
Li H, Durbin R. 2010. Fast and accurate long-read alignment with Burrows-Wheeler transform. Bioinformatics 26: 589–595.
Li H, Ruan J, Durbin R. 2008. Mapping short DNA sequencing reads andcalling variants using mapping quality scores. Genome Res 18: 1851–1858.
Li H, Handsaker B, Wysoker A, Fennell T, Ruan J, Homer N, Marth G,Abecasis G, Durbin R, Genome Project Data Processing Subgroup. 2009.The Sequence Alignment/Map format and SAMtools. Bioinformatics 25:2078–2079.
Lim A, Kraut R. 2009. The Drosophila BEACH family protein, blue cheese,links lysosomal axon transport with motor neuron degeneration.J Neurosci 29: 951–963.
Moheb LA, Tzschach A, Garshasbi M, Kahrizi K, Darvish H, Heshmati Y,Kordi A, Najmabadi H, Ropers HH, Kuss AW. 2008. Identification ofa nonsense mutation in the very low-density lipoprotein receptor gene(VLDLR) in an Iranian family with dysequilibrium syndrome. Eur J HumGenet 16: 270–273.
Ng PC, Henikoff S. 2001. Predicting deleterious amino acid substitutions.Genome Res 11: 863–874.
Ning Z, Cox A, Mullikin J. 2001. SSAHA: A fast search method for large DNAdatabases. Genome Res 11: 1725–1729.
Oishi K, Faria AV, van Zijl PCM, Mori S. 2010. MRI atlas of human whitematter, 2nd ed. Elsevier, Amsterdam.
Ozcelik T, Akarsu N, Uz E, Caglayan S, Gulsuner S, Onat OE, Tan M, Tan U.2008. Mutations in the very low-density lipoprotein receptor VLDLRcause cerebellar hypoplasia and quadrupedal locomotion in humans.Proc Natl Acad Sci 105: 4232–4236.
Pfaffl MW. 2001. A new mathematical model for relative quantification inreal-time RT-PCR. Nucleic Acids Res 29: e45. doi: 10.1093/nar/29.9.e45.
Purcell S, Neale B, Todd-Brown K, Thomas L, Ferreira MA, Bender D, Maller J,Sklar P, de Bakker PI, Daly MJ, et al. 2007. PLINK: a tool set for whole-genome association and population-based linkage analyses. Am J HumGenet 81: 559–575.
Rehman AU, Morell RJ, Belyantseva IA, Khan SY, Boger ET, Shahzad M,Ahmed ZM, Riazuddin S, Khan SN, Riazuddin S, et al. 2010. Targetedcapture and next-generation sequencing identifies C9orf75, encodingTaperin, as the mutated gene in nonsyndromic deafness DFNB79. Am JHum Genet 86: 378–388.
Robinson JT, Thorvaldsdottir H, Winckler W, Guttman M, Lander ES, Getz G,Mesirov JP. 2011. Integrative genomics viewer. Nat Biotechnol 29: 24–26.
Ropers HH. 2007. New perspectives for the elucidation of the geneticdisorders. Am J Hum Genet 81: 199–207.
Rozen S, Skaletsky HJ. 2000. Primer3 on the WWW for general users and forbiologist programmers. In Bioinformatics methods and protocols: Methodsin molecular biology (ed. S Krawetz, S Misener), p. 365. Humana Press,Totowa, NJ.
Rudelius M, Osanger A, Kohlmann S, Augustin M, Piontek G, Heinzmann U,Jennen G, Russ A, Matiasek K, Stumm G, et al. 2006. A missensemutation in the WD40 domain of murine Lyst is linked to severeprogressive Purkinje cell degeneration. Acta Neuropathol 112: 267–276.
Saier MH Jr, Beatty JT, Goffeau A, Harley KT, Heijne WH, Huang SC, Jack DL,Jahn PS, Lew K, Liu J, et al. 1999. The major facilitator superfamily. J MolMicrobiol Biotechnol 1: 257–279.
Seelow D, Schuelke M, Hildebrandt F, Nurnberg P. 2009.HomozygosityMapper: an interactive approach to homozygositymapping. Nucleic Acids Res 37: W593–W599.
Smith SM, Jenkinson M, Woolrich MW, Beckmann CF, Behrens TE,Johansen-Berg H, Bannister PR, De Luca M, Drobnjak I, Flitney DE, et al.2004. Advances in functional and structural MR image analysis andimplementation as FSL. Neuroimage 23: S208–S219.
Sunyaev S, Ramensky V, Koch I, Lathe W 3rd, Kondrashov AS, Bork P. 2001.Prediction of deleterious human alleles. Hum Mol Genet 10: 591–597.
Tan U. 2006. A new syndrome with quadrupedal gait, primitive speech, andsevere mental retardation as a live model for human evolution. Int JNeurosci 116: 361–369.
Tekinay AB, Nong Y, Miwa JM, Lieberam I, Ibanez-Tallon I, Greengard P,Heintz N. 2009. A role for LYNX2 in anxiety-related behavior. Proc NatlAcad Sci 106: 4477–4482.
Toussaint N, Souplet JC, Fillard P. 2007. MedINRIA: Medical imagenavigation and research tool by INRIA. In Proceedings of MICCAI’07
Gulsuner et al.
8 Genome Researchwww.genome.org
Cold Spring Harbor Laboratory Press on November 17, 2011 - Published by genome.cshlp.orgDownloaded from

Workshop on Interaction in Medical Image Analysis and Visualization.Brisbane, Australia. Lecture Notes in Computer Science, Vol. 4791.Springer, Berlin.
Turkmen S, Demirhan O, Hoffmann K, Diers A, Zimmer C, Sperling K,Mundlos S. 2006. Cerebellar hypoplasia and quadrupedal locomotion inhumans as a recessive trait mapping to chromosome 17p. J Med Genet43: 461–464.
Turkmen S, Guo G, Garshasbi M, Hoffmann K, Alshalah AJ, Mischung C,Kuss A, Humphrey N, Mundlos S, Robinson PN. 2009. CA8 mutationscause a novel syndrome characterized by ataxia and mild mentalretardation with predisposition to quadrupedal gait. PLoS Genet 5:e1000487. doi: 10.1371/journal.pgen.1000487.
Wang X, Herberg FW, Laue MM, Wullner C, Hu B, Petrasch-Parwez E,Kilimann MW. 2000. Neurobeachin: a protein kinase A-anchoring,
beige/Chediak-higashi protein homolog implicated in neuronalmembrane traffic. J Neurosci 20: 8551–8565.
Ward DM, Griffiths GM, Stinchcombe JC, Kaplan J. 2000. Analysis of thelysosomal storage disease Chediak–Higashi syndrome. Traffic 1: 816–822.
Woolrich MW, Jbabdi S, Patenaude B, Chappell M, Makni S, Behrens T,Beckmann C, Jenkinson M, Smith SM. 2009. Bayesian analysis ofneuroimaging data in FSL. Neuroimage 45: S173–S186.
Volders K, Nuytens K, Creemers JW. 2011. The autism candidate geneneurobeachin encodes a scaffolding protein implicated in membranetrafficking and signaling. Curr Mol Med 11: 204–217.
Received May 11, 2011; accepted in revised form August 23, 2011.
WDR81 is associated with CAMRQ2
Genome Research 9www.genome.org
Cold Spring Harbor Laboratory Press on November 17, 2011 - Published by genome.cshlp.orgDownloaded from

ARTICLE
Missense mutation in the ATPase, aminophospholipidtransporter protein ATP8A2 is associated withcerebellar atrophy and quadrupedal locomotion
Onur Emre Onat1,10, Suleyman Gulsuner1,10, Kaya Bilguvar2,3,4, Ayse Nazli Basak5, Haluk Topaloglu6,Meliha Tan7, Uner Tan8, Murat Gunel2,3,4 and Tayfun Ozcelik*,1,9
Cerebellar ataxia, mental retardation and dysequilibrium syndrome is a rare and heterogeneous condition. We investigated a
consanguineous family from Turkey with four affected individuals exhibiting the condition. Homozygosity mapping revealed that
several shared homozygous regions, including chromosome 13q12. Targeted next-generation sequencing of an affected
individual followed by segregation analysis, population screening and prediction approaches revealed a novel missense variant,
p.I376M, in ATP8A2. The mutation lies in a highly conserved C-terminal transmembrane region of E1 E2 ATPase domain. The
ATP8A2 gene is mainly expressed in brain and development, in particular cerebellum. Interestingly, an unrelated individual has
been identified, in whom mental retardation and severe hypotonia is associated with a de novo t(10;13) balanced translocation
resulting with the disruption of ATP8A2. These findings suggest that ATP8A2 is involved in the development of the cerebro-
cerebellar structures required for posture and gait in humans.
European Journal of Human Genetics advance online publication, 15 August 2012; doi:10.1038/ejhg.2012.170
Keywords: ATP8A2; cerebellar hypoplasia; targeted next-generation sequencing; quadrupedal locomotion; CAMRQ
INTRODUCTION
Cerebellar ataxia, mental retardation and dysequilibrium syndrome(CAMRQ) is a rare and genetically heterogeneous autosomal recessivedisorder characterized by mental retardation, cerebellar ataxia anddysarthric speech with or without quadrupedal gait.1–8 Multipleconsanguineous families have been reported with autosomalrecessive inheritance of the condition. The first locus was mappedto a 7.1-Mb region on chromosome 17p13 and a missense mutationwas reported on WDR81 (WD repeat domain 81; CAMRQ2; MIM:610185; also referred to as Uner Tan syndrome).1,2,7 Linkage mappingfollowed by candidate gene sequencing also led to the identification ofmutations in very low-density lipoprotein receptor (CAMRQ1; MIM:224050)3–5 and carbonic anhydrase VIII (CAMRQ3; MIM: 613227).6
In another consanguineous family (Family C)3,9 from Turkey, theinvolvement of VLDLR, WDR81 and CA8 genes were excluded, andfour shared-homozygous regions on chromosomes 13, 19 and 20 wereuncovered by homozygosity mapping. To identify the culprit gene, weutilized targeted next-generation sequencing of all homozygousregions and evaluated all co-segregated variants using functionaland structural predictions and population screening. We report hereinthat a recessive missense mutation in ATP8A2, encoding ATPase,aminophospholipid transporter, class I, type 8A, member 2, isassociated with the phenotype in Family C. In an independent
study, a de novo t(10;13) balanced translocation disrupting thecoding sequence of ATP8A2 on 13q12 was observed in a patientwith severe mental retardation and major hypotonia, raising thepossibility that haploinsufficiency of this gene could be implicated inneurodevelopmental phenotypes.10 On the basis of these observations,we suggest that ATP8A2 could be critically important in thedevelopment of the nervous system.
SUBJECTS AND METHODS
PatientsThe consanguineous family analyzed in this study has four members affected
by mental retardation, mild cerebellar and cerebral atrophy and truncal ataxia
(Figure 1). The index case was a 27-year-old man exhibiting total inability to
walk (05-993). Briefly, patients share the following clinical features: truncal
ataxia with/without quadrupedal gait, mental retardation and dysarthric
speech. MRI results revealed mild atrophy of cerebral cortex, corpus callosum
and inferior cerebellum. Clinical description of Family C was published
elsewhere.3,9 The only affected female in the family could not be included in
the study, as her parents did not give consent for DNA analysis. Case 05-993
recently died secondary to a respiratory infection. The study was approved by
the institutional review boards at the Baskent and Cukurova Universities
(decision KA07/47, 02.04.2007 and 21/3, 08.11.2005, respectively). Written
informed consent was obtained from all participants or their parents before
the study.
1Department of Molecular Biology and Genetics, Faculty of Science, Bilkent University, Ankara, Turkey; 2Department of Neurosurgery, Yale University School of Medicine,New Haven, CT, USA; 3Department of Neurobiology, Yale University School of Medicine, New Haven, CT, USA; 4Department of Genetics, Center for Human Genetics andGenomics and Program on Neurogenetics, Yale University School of Medicine, New Haven, CT, USA; 5Department of Molecular Biology and Genetics, NDAL Laboratory, Schoolof Arts and Sciences, Bogazici University, Istanbul, Turkey; 6Department of Pediatric Neurology, Ihsan Dogramaci Children’s Hospital, Hacettepe University Faculty of Medicine,Ankara, Turkey; 7Department of Neurology, Baskent University Faculty of Medicine, Ankara, Turkey; 8Department of Physiology, Cukurova University Faculty of Medicine, Adana,Turkey; 9Institute of Materials Science and Nanotechnology (UNAM), Bilkent University, Ankara, Turkey*Correspondence: Dr T Ozcelik, Department of Molecular Biology and Genetics, Faculty of Medicine, Bilkent University, Ankara 06800, Turkey. Tel: +90 312 290 2139;Fax: +90 312 266 5097; E-mail: [email protected] first two authors are regarded as joint first authors.
Received 9 March 2012; revised 3 July 2012; accepted 6 July 2012
European Journal of Human Genetics (2012), 1–5& 2012 Macmillan Publishers Limited All rights reserved 1018-4813/12
www.nature.com/ejhg

Homozygosity mapping analysisParticipants’ DNA from peripheral blood samples were genotyped using 10 K
Affymetrix SNP chips. Experiments were performed according to the
manufacturer’s instructions (Affymetrix, Santa Clara, CA, USA). DNA of
two affected individuals (05-994 and 05-996) was genotyped using Illumina
Human610-Quad BeadChip according to manufacturer’s recommendations
(Illumina, Inc., San Diego, CA, USA). The image data were normalized and the
genotypes were called using data analysis software (Bead Studio, Illumina).
Homozygosity mapping analysis was performed using HomozygosityMapper
software.11 Homozygosity was ruled out for the previously reported loci.
Markers D13S787, D13S1243, D13S742, D13S283, D13S1294 and D13S221
were used to test homozygosity for the most likely candidate locus,
chromosome 13q12. Haplotype analysis was carried out by hand.
Mutation analysisA total of 16 711 445 base long unique probes were designed to target
homozygous regions (Supplementary Table 1) using a custom-designed
Nimblegen Human Sequence Capture HD2 microarray (Roche NimbleGen,
Madison, WI, USA). DNA sample from an affected individual (05-996) was
captured using 3mg input DNA. Captured DNA sample was sequenced with
Illumina Genome Analyzer IIx. Illumina sequence data were mapped to
reference genome (hg18) using Maq12 and single-nucleotide variants were
determined with Samtools.13 To determine indels, data were mapped with
BWA14 and analyzed with Samtools. Variant coordinates were converted to
hg19 before publication by liftOver tool (http://genome.ucsc.edu/cgi-bin/
hgLiftOver). Coverage calculations of coding regions were done with
mpileup module of Samtools13 and intersectBED command of BEDTools.15
Novel variants were determined based on SNPs reported in dbSNP database
and further analyzed in 1000 genome data sets (http://www.1000genomes.org),
NHLBI Exome Sequencing Project (http://evs.gs.washington.edu/EVS/, data
release ESP5400) and exome sequencing data of 2400 individuals with non-
neurological disorders generated at Yale University. Common variants were
excluded if minor allele frequency was lower than 0.1%. Novel variants were
confirmed by Sanger sequencing. Segregation analysis of the variants in the
pedigree and its presence in healthy population were carried out using allele-
specific PCR analysis (Supplementary Table 2). Racial distribution of control
group was 100% Caucasian, including 22% from southeastern Turkey.
Bioinformatics analysisDNA and protein sequences were obtained from ENSEMBL database.16 SIFT,17
PolyPhen218 and MutationTaster19 tools were used to predict causative
variants. Genomic evolutionary rate profiling (GERP) and phylogenetic
P-value (phyloP) conservation scores for each variant were extracted
seperately from the UCSC Genome Browser allHg19RS_BW track20 and
phyloP46wayall track,21 respectively. Functional and transmembrane domains
of the ATP8A2 protein were predicted using Pfam database22 and TmPred
prediction tool (www.ch.embnet.org/software/TMPRED_form.html),
respectively. Homology searches were performed with CLCMain Workbench
(CLC Bio, Aarhus, Denmark) using appropriate modules. CLCMain
Workbench also generates phylogenetic tree using UPGMA algorithm that is
evaluated by bootstrap analysis. Possible effects of the variant on protein
secondary structure were predicted using PSIPRED server.23 Published
microarray data sets of E9.5, E11.5 and E13.5 mouse brain tissue
(GSE8091)24 were obtained from the GEO database (http://
www.ncbi.nlm.nih.gov/projects/geo/query/acc.cgi) and analyzed with
GeneSpring GX V11.1 software (Agilent Technologies, Santa Clara, CA,
USA). Differentially expressed genes within day groups were filtered (one-
way ANOVA test Bonferroni-corrected Po0.001) and genes that correlated
with Atp8a2 (R¼ 0.95–1.0) were functionally annotated using DAVID tools.25
Primers used in this study were designed with Primer326 software and are listed
in Supplementary Table 2.
Quantitative real-time RT-PCRFirst-strand cDNAs were prepared from human RNA samples (Clontech,
Mountain View, CA, USA: 636567 (corpus callosum); Agilent: 540007
(cerebellum), 540117 (frontal cortex), 540137 (occipital cortex), 540157 (fetal
brain), 540053 (brain stem), 540005 (total brain), 540143 (parietal cortex),
540135 (striatum)) using RevertAid First Strand cDNA Synthesis kit with
random hexamer primers (Fermentas, now Thermo Fisher Scientific, Waltham,
MA, USA; K1622) after DNaseI (Fermentas EN0521) digestion. Real-time RT-
PCR was performed using IQ SYBR Green Supermix according to standard
protocols (BioRad, Hercules, CA, USA; 170-8882). Ct values were normalized
to GAPDH as an internal control. The data were analyzed using the Pfaffl
method.27
RESULTS
We identified four common homozygous regions in two affectedindividuals (05-994 and 05-996) using Ilumina Human610-QuadBeadChip. Targeted next-generation sequencing of all homozygousregions (Supplementary Figure 1 and Supplementary Table 1) wascarried out using DNA of one affected individual (05-996). Thisregion was enriched 629-fold in the capture experiment. In total,48.62 million single-end 75 bp reads were obtained and 29.2% of thereads mapped to the targeted regions. This in turn provided a meancoverage depth of 62.96-fold across the targeted homozygosityintervals with 97.41% of the targeted bases being covered by at leastfour reads (Supplementary Table 3). Next, the constitutive exons inthe homozygous intervals were analyzed and 99.51% of the proteincoding regions was found to be covered by at least four reads. Whenthe genes encoding for the constitutive exons in the low- or zero-coverage regions were analyzed, they either do not have cerebellarexpression or do not display a phenotype compatible with cerebellarinvolvement in mouse knockouts (Supplementary Table 4). On thebasis of these results, we find it highly unlikely that a causativemutation is missed.
Figure 1 Pedigree of Family C with haplotype structure of the disease
interval on chromosome 13q12. Haplotype segregating with the disease is
boxed. ATP8A2 c.1128 C4G mutation is bold. Please note that the DNA of
one affected individual is not available for the study.
ATP8A2 is associated with CAMRQOE Onat et al
2
European Journal of Human Genetics

A total of 14 103 homozygous variants (13 394 single-nucleotidevariants and 709 indels) were detected by next-generation sequencing.Of these, 13 528 variants were reported by dbSNP132. Remaining 575novel variants were classified by genomic context: protein altering orflanking splice junctions (n¼ 11), coding synonymous (n¼ 4),50-UTR (n¼ 44), 30-UTR (n¼ 30), intronic (n¼ 224) and intergenic(n¼ 262). Of the 11 protein-altering variants, four were excludedbased on the comparison for novelty with 1000 genomes data, NHLBIExome Sequencing Project and the exome sequence data of 2400individuals with non-neurological diseases. The remaining sevenvariants in the coding regions of homozygous blocks were verifiedby Sanger sequencing and four of them were excluded by segregationanalysis (Supplementary Figures 2–3). Two missense variants (ATP8A2p.I376M and APBA3 p.A97T) and a 3-bp in-frame deletion (PCP2p.E6del) were consistent with the recessive inheritance of the diseaseallele in Family C (Table 1, Figure 1 and Supplementary Figure 2).
APBA3 p.A97T variant was excluded based on the conservationconsiderations and prediction analyses. Four of 20 species sequencedhave threonine (T) at the orthologous site (Supplementary Figure 4),suggesting that this variant would be a polymorphism and notdamaging to humans. A negative GERP score (�4.11) for themutated nucleotide suggests that this site is probably evolvingneutrally.20 PhyloP score of the variant (�0.308) suggests a fasterevolution than expected for this site.21 Furthermore, the variant waspredicted as ‘tolerated’ by SIFT17 (SIFT score, 0.16), ‘benign’ byPolyPhen218 (PSIC score difference, 0.0) and ‘polymorphism’ byMutationTaster19 (P-value, 0.999) (Table 1).
PCP2 p.E6del was excluded based on population screening. In 360healthy chromosomes, four heterozygous individuals were identified(Supplementary Figure 5), yielding an expected homozygote fre-quency of approximately 1 in 8000. The region containing themutation is not conserved among species, and the deletion waspredicted as ‘polymorphism’ by MutationTaster19 (P-value, 0.717;Table 1 and Supplementary Figure 6).
The remaining variant at chr13:26128001 (hg19; c.1128 C4G)is located in exon 12 of ATP8A2 (ENSG00000132932,ENST00000381655) and results in an isoleucine (I) to methionine(M) substitution at residue 376. The mutation co-segregated with thedisease in Family C (Figure 1) lies in the C-terminal-predictedtransmembrane site of the E1 E2 ATPase domain (Figure 2a) and ishighly conserved across species (Figure 2b and SupplementaryFigure 7). Screening of 1210 control chromosomes, including 300individuals from the same geographic region as Family C, excludedpresence of the variant in this control population. SIFT,17 PolyPhen218
and MutationTaster19 tools predicted the ATP8A2 p.I376M as acausative mutation (scores: 0.0, 1.0 and 0.955, respectively).Consequences of the amino acid change in protein structure were
evaluated by comparing the predicted secondary structures of wild-type and mutant protein sequences. The wild-type protein ispredicted to contain 27 b-strands and 32 a-helices. I376 residue islocated at the N terminus of the 11th a-helix. The mutation enlargesthe 11th and 12th a-helices and creates an additional a-helix atresidue 401 (Figure 2c).
The status of ATP8A2 was evaluated in a cohort of 750 patientswith structural cortical malformations or degenerative neurologicaldisorders, and the underlying genetic cause is still unknown. Whole-genome genotyping data generated by Illumina Human 370 Duo or610K Quad BeadChips is available for this cohort. None of thepatients were found to harbor a homozygous interval (Z2.5 cM)surrounding the ATP8A2 locus. Exome sequencing of the same groupdid not reveal any mutations, including compound heterozygoussubstitutions, in ATP8A2.
The transmembrane protein, ATP8A2, consists of four protein-coding isoforms. The longest isoform (ENST00000381655) contains37 exons and encodes a 112 kDa protein. The protein is highlyexpressed in newborn and embryonic tissues, with strongest expres-sion in mouse heart, brain and testis.10,28 RT-PCR analysis revealedsimilar expression in different regions of the human brain.10 Toevaluate the possible involvement of ATP8A2 in motor functions, weexamined its expression profile in different human brain regions byquantitative real-time RT-PCR. Human ATP8A2 is expressed in allbrain regions with the highest level of expression in cerebellum(Figure 3). ATP8A2 expression in the patients cannot be evaluated, asthe gene is not expressed in lymphocytes.
To further investigate the role of ATP8A2 in brain development, weexamined the expression profiles of early embryonic mouse brain(GSE8091)24 and identified genes with significantly correlatedexpression profiles (R40.95, n¼ 218) with that of ATP8A2.Functional clustering analysis suggested that positively correlatedgenes were enriched for those involved in neuron differentiation,cell, and neuron projection morphogenesis and axonogenesis(Bonferroni-corrected P-values: 2.1E-3, 2.7E-3, 4.5E-3 and 1.5E-2respectively). ATP8A2 is co-expressed with doublecortin responsiblefor lissencephaly and WDR81 associated with CAMRQ2,7 suggestingthat these genes could represent similar developmental pathways.
DISCUSSION
CAMRQ is a rare genetically heterogeneous cerebellar ataxia withmental retardation and dysarthric speech, with or without quad-rupedal gait. Since the first mapping of the gene locus on chromo-some 17p13, two additional loci on chromosomes 9p24 and 8q12have been reported, and causative mutations have been identified inVLDLR, CA8 and WDR81.2,3,6,7 Here we present the identification ofa fourth gene locus in a consanguineous family of two affected
Table 1 Novel coding variants identified by targeted next-generation sequencing of 05-996
Gene Position (hg19) Ref Var Effect GERP (score) PhyloP (score) SIFT (score) Polyphen2 (score) M. Taster (P-value) Segregation
ATP8A2 chr13:26,128,001 C G I376M 2.18 1.091 D. (0.02) P.D. (1.00) D.C. (0.995) Yes
APBA3 chr19:3,759,974 C T A97T �4.11 �0.308 T. (0.16) B. (0.14) P. (0.999) Yes
MUC16 chr19:9,068,391 G A A6352V �1.45 �0.803 n.a. n.a. P. (0.999) No
MUC16 chr19:9,068,577 G A T6290I 2.35 2.273 n.a. n.a. P. (0.999) No
ZNF823 chr19:11,833,601 A G C250R 0.632 1.532 D. (0.00) P.D. (1.00) P. (0.994) No
SERINC3 chr20:43,141,490 A G M116T 3.98 2.524 T. (0.34) B. (0.13) D.C. (0.999) No
PCP2 chr19:7,698,326 CTC — E6del n.a. 0.168 n.a. n.a. P. (0.717) Yes
Abbreviations: Ref, reference allele; Var, variant allele; M.Taster, Mutation Taster, D., damaging; T., tolerated; P.D., probably damaging; B., benign; n.a., not available; D.C., disease causing;P., polymorphism.
ATP8A2 is associated with CAMRQOE Onat et al
3
European Journal of Human Genetics

siblings and an affected nephew. Using whole-genome homozygositymapping followed by targeted next-generation sequencing, severalmissense variants were observed. Filtering the variants byco-segregation analysis, population screening, protein conservationand disease gene prediction approaches revealed a novel missensevariant in ATP8A2 (c.1128 C4G; p.I376M) that segregates with thephenotype. The mutation is located inside a transmembrane domainand is predicted to change secondary structure of the protein.
ATP8A2 belongs to the P4-ATPases subfamily of P-type ATPases,which are involved in the transport of aminophospholipids.Biochemical studies have shown that P4-ATPases determine thecurvature of the phospholipid bilayer by flipping aminophospholipidsfrom the exoplasmic to the cytoplasmic leaflet.29,30 ATPases have beenimplicated in human diseases such as ATP10C in Angelmansyndrome,31 ATP8B1 in hearing loss32 and hereditary cholestasis,33
and ATP8A2 in a severe neurological phenotype.10
ATP8A2 is involved in the transport of aminophospholipids towardthe cytoplasmic leaflet in brain cells, retinal photoreceptors andtestis.34 In humans, ATP8A2 is mainly expressed in brain tissues, withhighest levels in cerebellum, as well as in retina and testis.10
Cerebellum is a crucial regulatory organ for motor coordinationand this expression pattern is consistent with CAMRQ. The fact thatCAMRQ-associated genes have retinal expression34,35 raises thepossibility that eye abnormalities may be an additional clinicalfeature of the phenotype. Strabismus has been observed in almostall affected individuals in all the families reported thus far.1–8 Inaddition, homozygous WDR81 mutation carriers display downbeatnystagmus, temporal disk pallor and macular atrophy.36 However,retinopathy is not a feature of WDR81-, VLDLR- and CA8-associatedCAMRQ.6,36 With respect to ATP8A2, further information is notavailable, as Family C declined neuro-ophthalmological investigations.
Documentation of a de-novo-balanced translocation leading toATP8A2 haploinsufficiency10 brings into attention the clinical findingsof carriers in Family C. Whereas 05-992 and 05-995 did notshow neurological abnormalities, the t(10;13) de-novo-balancedtranslocation carrier presented with a severe neurological phenotype
Figure 2 Graphical representation of the predicted functional and structural elements of ATP8A2 protein. (a) ATP8A2 is composed of an E1 E2 ATPase
domain and a haloacid dehalogenase-like hydrolase (HAD) domain. Ten transmembrane domains were predicted by TMPRED. The mutation lies in the
transmembrane region of C-terminal end of E1 E2 ATPase domain (dot). (b) Multiple amino acid sequence alignments show the sequence homology of
ATP8A2 protein in vertebrates. I376 residue is indicated with a box. (c) Graphical representation of secondary structural elements as predicted by
PSIPRED. The predicted elements (Pred) are indicated above the amino acid (AA) sequences (straight lines: coils; cylinders: helices; arrows: strands). The
mutation is predicted to alter the secondary structure of the protein. Transmembrane region is represented within the Pred graphs of wild-type (WT) and
mutant (Mut) proteins. EC, extracellular; IC, intracellular.
Figure 3 Expression pattern of ATP8A2 in nine different regions of human
brain. Real-time RT-PCR analysis showed that ATP8A2 is expressed in all
regions of the brain with the highest levels in the cerebellum.
ATP8A2 is associated with CAMRQOE Onat et al
4
European Journal of Human Genetics

that partially overlaps with the phenotype of the affected members ofFamily C. The possibility of a chimeric protein was ruled out, leavinghaploinsufficiency of ATP8A2 as the most likely explanation for thephenotype. This suggests that ATP8A2 mutations represent yetanother example of clinical heterogeneity in the context of genomicunderstanding of complex traits in humans and demonstratesfundamental features of genomic analysis of human traits such asvariable expression, allelic heterogeneity and genotype–phenotypecorrelations. Other examples include CRYBB1 in congenital cataract,37
COLL11A2 in Zweymuller Weissenbacher syndrome38 and MYBPC1in arthrogryposis.39
These findings suggest that ATP8A2 could be critical for thedevelopmental processes of central nervous system, and alterationsof this gene may lead to severe neurological phenotypes.
CONFLICT OF INTEREST
The authors declare no conflict of interest.
ACKNOWLEDGEMENTSWe are grateful to Dr Mary-Claire King for innumerable discussions and
suggestions. We also thank the members of Family C for cooperation in this
study. This work was supported by the Scientific and Technological Research
Council of Turkey (TUBITAK-SBAG 108S036 and 108S355) and Turkish
Academy of Sciences (TUBA research support) to TO; Yale Program on
Neurogenetics, the Yale Center for Human Genetics and Genomics and
National Institutes of Health grants RC02 NS070477 to MG.
1 Tan U: A new syndrome with quadrupedal gait, primitive speech, and severemental retardation as a live model for human evolution. Int J Neurosci 2006; 116:361–369.
2 Turkmen S, Demirhan O, Hoffmann K et al: Cerebellar hypoplasia and quadrupedallocomotion in humans as a recessive trait mapping to chromosome 17p. J Med Genet2006; 43: 461–464.
3 Ozcelik T, Akarsu N, Uz E et al: Mutations in the very low-density lipoprotein receptorVLDLR cause cerebellar hypoplasia and quadrupedal locomotion in humans. Proc NatlAcad Sci USA 2008; 105: 4232–4236.
4 Moheb LA, Tzschach A, Garshasbi M et al: Identification of a nonsense mutation in thevery low-density lipoprotein receptor gene (VLDLR) in an Iranian family withdysequilibrium syndrome. Eur J Hum Genet 2008; 16: 270–273.
5 Kolb LE, Arlier Z, Yalcinkaya C et al: Novel VLDLR microdeletion identified in twoTurkish siblings with pachygyria and pontocerebellar atrophy. Neurogenetics 2010; 11:319–325.
6 Turkmen S, Guo G, Garshasbi M et al: CA8 mutations cause a novel syndromecharacterized by ataxia and mild mental retardation with predisposition to quadrupedalgait. PLoS Genet 2009; 5: e1000487.
7 Gulsuner S, Tekinay AB, Doerschner K et al: Homozygosity mapping and targetedgenomic sequencing reveal the gene responsible for cerebellar hypoplasia andquadrupedal locomotion in a consanguineous kindred. Genome Res 2011; 21:1995–2003.
8 Boycott KM, Flavelle S, Bureau A et al: Homozygous deletion of the very low densitylipoprotein receptor gene causes autosomal recessive cerebellar hypoplasia withcerebral gyral simplification. Am J Hum Genet 2005; 77: 477–483.
9 Tan U: Evidence for ‘Unertan Syndrome’ and the evolution of the human mind. Int JNeurosci 2006; 116: 763–774.
10 Cacciagli P, Haddad MR, Mignon-Ravix C et al: Disruption of the ATP8A2 gene in apatient with a t(10;13) de novo balanced translocation and a severe neurologicalphenotype. Eur J Hum Genet 2010; 18: 1360–1363.
11 Seelow D, Schuelke M, Hildebrandt F et al: HomozygosityMapper—an interactiveapproach to homozygosity mapping. Nucleic Acids Res 2009; 37: W593–W599.
12 Li H, Ruan J, Durbin R: Mapping short DNA sequencing reads and calling variantsusing mapping quality scores. Genome Res 2008; 18: 1851–1858.
13 Li H, Handsaker B, Wysoker A et al: The Sequence Alignment/Map format andSAMtools. Bioinformatics 2009; 25: 2078–2079.
14 Li H, Durbin R: Fast and accurate long-read alignment with Burrows-Wheelertransform. Bioinformatics 2010; 26: 589–595.
15 Quinlan AR, Hall IM: BE DTools: a flexible suite of utilities for comparing genomicfeatures. Bioinformatics 2010; 26: 841–842.
16 Flicek P, Amode MR, Barrell D et al: Ensembl 2011. Nucleic Acids Res 2011; 39:D800–D806.
17 Ng PC, Henikoff S: Predicting deleterious amino acid substitutions. Genome Res2001; 11: 863–874.
18 Adzhubei IA, Schmidt S, Peshkin L et al: A method and server for predicting damagingmissense mutations. Nat Methods 2010; 7: 248–249.
19 Schwarz JM, Rodelsperger C, Schuelke M et al: MutationTaster evaluates disease-causing potential of sequence alterations. Nat Methods 2010; 7: 575–576.
20 Davydov EV, Goode DL, Sirota M et al: Identifying a high fraction of the human genome tobe under selective constraint using GERPþ þ. PLoS Comput Biol 2010; 6: e1001025.
21 Cooper GM, Stone EA, Asimenos G et al: Distribution and intensity of constraint inmammalian genomic sequence. Genome Res, 2005; 15: 901–913.
22 Finn RD, Mistry J, Tate J et al: The Pfam protein families database. Nucleic Acids Res2010; 38: D211–D222.
23 Bryson K, McGuffin LJ, Marsden RL et al: Protein structure prediction servers atUniversity College London. Nucleic Acids Res 2005; 33: W36–W38.
24 Hartl D, Irmler M, Romer I et al: Transcriptome and proteome analysis of earlyembryonic mouse brain development. Proteomics 2008; 8: 1257–1265.
25 Huang da W, Sherman BT, Lempicki RA: Systematic and integrative analysis of largegene lists using DAVID bioinformatics resources. Nat Protoc 2009; 4: 44–57.
26 Rozen S, Skaletsky H: Primer3 on the WWW for general users and for biologistprogrammers. Methods Mol Biol 2000; 132: 365–386.
27 Pfaffl MW: A new mathematical model for relative quantification in real-time RT-PCR.Nucleic Acids Res 2001; 29: e45.
28 Halleck MS, Lawler JFJR, Blackshaw S et al: Differential expression of putativetransbilayer amphipath transporters. Physiol Genomics 1999; 1: 139–150.
29 Graham TR, Kozlow MM: Interplay of proteins and lipids in generating membranecurvature. Curr Opin Cell Biol 2010; 22: 430–436.
30 Puts CF, Holthuis JC: Mechanism and significance of P4 ATPase-catalyzed lipidtransport: Lessons from a Naþ /Kþ -pump. Biochim Biophys Acta 2009; 1791: 603–611.
31 Meguro M, Kashiwagi A, Mitsuya K et al: A novel maternally expressed gene, ATP10C,encodes a putative aminophospholipid translocase associated with Angelmansyndrome. Nat Genet 2001; 28: 19–20.
32 Stapelbroek JM, Peters TA, vanBeurden DH et al: ATP8B1 is essential for maintainingnormal hearing. Proc Natl Acad Sci USA 2009; 106: 9709–9714.
33 Klomp LWJ, Vargas JC, van Mil SWC et al: Characterization of mutations in ATP8B1associated with hereditary cholestasis. Hepatology 2004; 40: 27–38.
34 Coleman JA, Kwok MC, Molday RS: Localization, purification, and functionalreconstitution of the P4-ATPase Atp8a2, a phosphatidylserine flippase in photorecep-tor disc membranes. J Biol Chem 2009; 284: 32670–32679.
35 Wu C, Orozco C, Boyer J et al: BioGPS: an extensible and customizable portal forquerying and organizing gene annotation resources. Genome Biol 2009; 10: R130.
36 Sarac O, Gulsuner S, Yildiz-Tasci Y et al: Neuro-opthalmologic findings in humans withquadrupedal locomotion. Ophthalmic Genet 2012; e-pub ahead of print 11 June2012; PMID: 22686558.
37 Cohen D, Bar-Yosef U, Levy J et al: Homozygous CRYBB1 deletion mutation underliesautosomal recessive congenital cataract. Invest Ophthalmol Vis Sci 2007; 48:2208–2213.
38 Harel T, Rabinowitz R, Hendler N et al: COL11A2 mutation associated with autosomalrecessive Weissenbacher-Zweymuller syndrome: molecular and clinical overlap withotospondylomegaepiphyseal dysplasia (OSMED). Am J Med Genet A 2005; 132: 33–35.
39 Markus B, Narkis G, Landau D et al: Autosomal recessive lethal congenital contracturalsyndrome type 4 (LCCS4) caused by a mutation in MYBPC1. Hum Mutat 2012;e-pub ahead of print 18 May 2012; doi:10.1002/humu.22122; PMID: 22610851.
Supplementary Information accompanies the paper on European Journal of Human Genetics website (http://www.nature.com/ejhg)
ATP8A2 is associated with CAMRQOE Onat et al
5
European Journal of Human Genetics

207
Permissions to the Copyrighted
Material

Dear Dr. Onat, Permission is granted for your use of the figure as described in your message below. Please cite the full journal references. Please let us know if you have any questions. Thanks! Best regards,Audrey Springer forDiane SullenbergerExecutive EditorPNAS
From: Onur Emre Onat [mailto:[email protected]] Sent: Tuesday, October 02, 2012 6:42 PMTo: PNAS PermissionsSubject: Permission to Use Copyrighted Material in a Doctoral Thesis
Dear sir/madam,
I am a graduate student Bilkent University (Ankara, Turkey) completing myDoctoral thesis on Molecular Biology and genetics.
I would like permission to allow inclusion of the following material in my thesisand dissertation:
PNAS January 26, 2010 vol. 107no. suppl 1 1779-1786
“Consanguinity, human evolution, and complex diseases”
A. H. Bittles and M. L. Black
Fig. 1. Global distribution of marriages between couples related as secondcousins or closer (F ≥ 0.0156).
This request is for a non-exclusive, nonprofit, irrevocable, and royalty-freepermission, and it is not intended to interfere with other uses of the same work. I would be pleased toinclude a full citation to this work and other acknowledgement as you might request. I would greatly appreciate your permission. If you require any additional

I would greatly appreciate your permission. If you require any additionalinformation, do not hesitate to contact me at the address and number below.
Please confirm in writing or by email that these arrangements meet with yourapproval.
Sincerely
Onur Emre Onat
-- MSc. Onur Emre OnatPhD CandidateDepartment of Molecular Biology and GeneticsBilkent University, Main CampusScience Faculty, B BlockWork: (90) (312) 2902510Fax: (90) (312) 2665097Home: (90) (312) 2858496Cell: (90) (505) 3778936

From: "Alaimo, Stefanie" <[email protected]>Subject: RE: Permission to Use Copyrighted Material in a Doctoral ThesisDate: Thu, December 27, 2012 18:30To: "[email protected]" <[email protected]>Cc: "Kelly Lyons" <[email protected]>
Dear Dr. Onat,
Use of the requested material in your doctoral thesis is considered fair use underthe terms of your copyright agreement—just be sure to cite the journal for allmaterial that is used.
Best regards,
Stefanie Alaimo
Stefanie Alaim o
Managing Editor, Journals
/src/[email protected]
212.520.27 80
informahealthcare
52 Vanderbilt Avenue, 16th Floor
New Y ork, NY 10017
www.informahealthcare.com
Interested in the latest COPD research?
Register for a free subscription to COPD at www.copdjournal.com !

From: Kelly Lyons [/src/[email protected]] Sent: Wednesday, December 26, 2012 11:07 AMTo: Alaimo, StefanieSubject: Fwd: Permission to Use Copyrighted Material in a Doctoral Thesis
Hi Stefanie,
Is this something you can respond to? Thank you. Kelly
Begin forwarded message:
From: Onur Emre Onat <[email protected]>
Date: December 26, 2012 5:20:41 AM CST
To: <[email protected]>
Subject: Permission to Use Copyrighted Material in aDoctoral Thesis
Dear sir/madam,
I am a graduate student Bilkent University (Ankara, Turkey) completing myDoctoral thesis on Molecular Biology and genetics.

I am the first auther of the paper "Missense mutation in the ATPase,aminophospholipid transporter protein ATP8A2 is associated with cerebellaratrophy and quadrupedal locomotion".
The clinical description of our patients were published on your journal:
Intern. J. Neuroscience, 116:763–774, 2006Copyright C 2006 Taylor & Francis Group, LLCISSN: 0020-7454 / 1543-5245 onlineDOI: 10.1080/00207450600588733EVIDENCE FOR “UNERTAN SYNDROME” AND THE EVOLUTIONOF THE HUMAN MINDUNER TAN
I would like permission to allow inclusion of the following material in my thesis anddissertation:
Figure 1. Family tree of the affected individuals.Open circles and open squares:unaffectedwomenand unaffected men, being with a crossed line deceased, without a crossed linealive. Filled square:quadrupedal man (V2); filled circle: quadrupedal woman (V3); V1: most severelyaffected manwith inability to walk at all; VI1: the man who walked quadrupedally as a child,became bipedal inhis adulthood, showing ataxic gait (drunk-like), and dysmetria.
Figure 3. Standing postures in the quadrupedal (left) and bipedal-ataxic man(right).
Figure 5. Habitual walking patterns in quadrupedal male (left) and female (right)patients.
This request is for a non-exclusive, nonprofit, irrevocable, and royalty-freepermission, and it is not intended to interfere with other uses of the same work. I would be pleased toinclude a full citation to this work and other acknowledgement as you might request. I would greatly appreciate your permission. If you require any additional
information, do not hesitate to contact me at the address and number below.

Please confirm in writing or by email that these arrangements meet with yourapproval.
Sincerely
Onur Emre Onat
--
MSc. Onur Emre Onat
PhD Candidate
Department of Molecular Biology and Genetics
Bilkent University, Main Campus
Science Faculty, B Block
Work: (90) (312) 2902510
Fax: (90) (312) 2665097
Home: (90) (312) 2858496
Cell: (90) (505) 3778936
Attachments:
untitled-[1].plain
Size:3.3 k
Type:text/plain

Title: Missense mutation in theATPase, aminophospholipidtransporter protein ATP8A2 isassociated with cerebellaratrophy and quadrupedallocomotion
Author: Onur Emre Onat, SuleymanGulsuner, Kaya Bilguvar, AyseNazli Basak, Haluk Topaloglu etal.
Publication: European Journal of HumanGenetics
Publisher: Nature Publishing Group
Date: Aug 15, 2012
Copyright © 2012, Rights Managed by NaturePublishing Group
Logged in as:
Onur Onat
Account #: 3000606339
Author Request
If you are the author of this content (or his/her designated agent) please read the following. Ifyou are not the author of this content, please click the Back button and select an alternativeRequestor Type to obtain a quick price or to place an order.
Ownership of copyright in the article remains with the Authors, and provided that, whenreproducing the Contribution or extracts from it, the Authors acknowledge first and referencepublication in the Journal, the Authors retain the following non-exclusive rights:
a) To reproduce the Contribution in whole or in part in any printed volume (book or thesis) ofwhich they are the author(s).
b) They and any academic institution where they work at the time may reproduce the Contributionfor the purpose of course teaching.
c) To reuse figures or tables created by them and contained in the Contribution in other workscreated by them.
d) To post a copy of the Contribution as accepted for publication after peer review (in Word orText format) on the Author's own web site, or the Author's institutional repository, or the Author'sfunding body's archive, six months after publication of the printed or online edition of the Journal,provided that they also link to the Journal article on NPG's web site (eg through the DOI).
NPG encourages the self-archiving of the accepted version of your manuscript in your fundingagency's or institution's repository, six months after publication. This policy complements therecently announced policies of the US National Institutes of Health, Wellcome Trust and otherresearch funding bodies around the world. NPG recognises the efforts of funding bodies toincrease access to the research they fund, and we strongly encourage authors to participate insuch efforts.
Authors wishing to use the published version of their article for promotional use or on a web sitemust request in the normal way.
If you require further assistance please read NPG's online author reuse guidelines.
For full paper portion: Authors of original research papers published by NPG are encouraged tosubmit the author's version of the accepted, peer-reviewed manuscript to their relevant fundingbody's archive, for release six months after publication. In addition, authors are encouraged to
archive their version of the manuscript in their institution's repositories (as well as their personalWeb sites), also six months after original publication.
v2.0
Copyright © 2012 Copyright Clearance Center, Inc. All Rights Reserved. Privacy statement. Comments? We would like to hear from you. E-mail us at [email protected]