Embed Size (px)
Citation preview

New Jersey Agricultural Experiment Station P-02275-1-06
December 2005
Identification and Evaluation of Viable Market Opportunities
for Organically-Grown Aquatic Products: Results from the Focus Group Meetings
Linda J. O’Dierno Sho Islam
Ramu Govindasamy Joseph J. Myers Venkata Puduri
Rutgers Cooperative Extension Department of Agricultural, Food and Resource Economics
N.J. Agricultural Experiment Station Rutgers, The State University of New Jersey, New Brunswick, New Jersey 08901
and
New Jersey Department of Agriculture
Fish & Seafood Program PO Box 330
Trenton, NJ 08625-0330

Identification and Evaluation of Viable Market Opportunities
for Organically-Grown Aquatic Products: Results from the Focus Group Meetings
Linda J. O’Dierno Sho Islam
Ramu Govindasamy Joseph J. Myers Venkata Puduri
Linda J. O’Dierno, Coordinator, Fish & Seafood Development, New Jersey Department of Agriculture, Trenton; Shofiul Islam Business Development Associate, Food Innovation Centre, Rutgers University; Ramu Govindasamy is Associate Professor, Department of Food and Resource Economics, Rutgers University, New Brunswick, New Jersey; Trenton, , Joseph J. Myers. Aquaculture Development Specialist Fish & Seafood Development, Office of Aquaculture Coordination, New Jersey Department of Agriculture, Trenton; Venkata Puduri is a Post Doctoral Associate, Department of Food and Resource Economics, Rutgers University, New Brunswick, New Jersey
Correspondence Address
Ramu Govindasamy, Associate Professor
Department of Agricultural, Food and Resource Economics Cook College
Rutgers, The State University of New Jersey 55 Dudley Road, New Brunswick, New Jersey 08901-8520
Phone: (732) 932-9171 ext. 254

Acknowledgements
The authors would like to thank the following individuals for their assistance in providing direction and support for this project: Mr. Gary Jensen of USDA, Mr.Robert Collette of the National Fisheries Institute, Mr. George Lockwood, Mr. Richard Nelson of Silvercup Feeds, Ms. Deborah Brister of the University of Minnesota, Mr. William Carroll of Gleneagles Inc., Mr. Robert Rheault of Moonstone Oysters, Ms. Robin Downey of the Pacific Coast Shellfish Growers Association, Mr. Sherman Wilhelm of the Florida Department of Agriculture and Consumer Services. Special thanks to the following retailers who provided enormous assistance to the project:
Wegman’s Wild Oats Foodtown
Stop and Shop King’s Sooper
Funding for this project was matched with Federal funds under the Federal-State Marketing Improvement Program of the Agricultural Marketing Service, U.S. Department of Agriculture Grant # 12-25-G-0420.
i

Table of Contents Page Acknowledgements.............................................................................................................. i Table of Contents................................................................................................................ ii List of Tables ..................................................................................................................... iii List of Figures.................................................................................................................... iv Executive Summary............................................................................................................ v 1. Introduction..................................................................................................................... 1 2. Research Objectives........................................................................................................ 4 3. Methodology................................................................................................................... 5 4. Focus Group Results....................................................................................................... 7
4.1. The Seafood Shopping Experience........................................................................ 9 4.2. Product Labeling.................................................................................................. 11 4.3. Country of Origin................................................................................................. 16 4.3B. Eco-Friendly Labeling......................................................................................... 17 4.4. Organic Labeling ................................................................................................. 18 4.5. Consumer Perceptions of Organic Foods ............................................................ 19 4.6. Consumer Perceptions of Organically – Grown Seafood .................................... 20 4.7. Most Commonly Consumed Seafood Products ................................................... 23 4.8. Pricing .................................................................................................................. 24 4.9. Seafood Inspection............................................................................................... 25 4.10. Trying New Species............................................................................................. 25 4.11. Seafood and Health .............................................................................................. 26 4.12. Seafood and Food Information ............................................................................ 28 4.13. Food Miles ........................................................................................................... 28
5. Conclusions................................................................................................................... 30 6. References..................................................................................................................... 32 7. Bibliography ................................................................................................................. 33 8. Focus Group Questionnaire .......................................................................................... 36
ii
List of Tables
Page Table 1: Consumer Sales and Growth Rates of Organic Foods, 1997-2003 .................... 3 Table 2: Response to Terms Identifying Farm-Raised Seafoods.................................... 12 Table 3: Consumer Perceptions about Seafood Type that Conveys the Highest Quality13 Table 4: Consumer Preference for Domestic and Imported Seafood ............................. 16 Table 5: Perceptions about Country of Origin that Convey the Highest Quality ........... 17 Table 6: Effect of Eco-Friendly Labeling on Purchasing Decision(s)............................ 17 Table 7: Consumer Perceptions about Ecologically Sound Seafood Production Methods that Convey the Highest Quality....................................................................... 17 Table 8: Organically Grown Terminology that Conveys the Highest Quality ............... 18 Table 9: Statement that Best Describes Consumer Attitude towards Organic Foods..... 19 Table 10: Statement that Best Describes Attitude towards Organic Seafood................... 20 Table 11: Reasons for Wanting to Purchase Organic Seafood ......................................... 22 Table 12: Reasons for Not Wanting to Purchase Organic Seafood .................................. 23 Table 13: Most Commonly Consumed Seafoods ............................................................. 24 Table 14: Package Label that Consumers Would Most likely Select in the Supermarket.
......................................................................................................................... 26 Table 15: Consumers Likelihood of Purchase if They Were Informed About Regions that are Known for High Quality and Availability .................................................. 27 Table 16: Perceptions about Seafood Origin that Convey the Highest Quality ............... 28
iii

List of Figures
Page
Figure 1: Locations of Target Markets ............................................................................... 6 Figure 2: Primary Location of Seafood Purchase for Home Consumption ...................... 10 Figure 3: Frequency of Seafood Purchase ........................................................................ 11 Figure 4: Consumer Preference for Wild and Farm-Raised ............................................. 12 Figure 5: Seafood Production Terminology that Conveys the Highest Quality ............... 14 Figure 6: If Available, Would Consumers Purchase Organic Seafood?........................... 21
iv

Executive Summary Phase I-Consumer Focus Groups
The United States aquatic farming community has expressed a keen interest in the
development of long-term sustainable organic farming systems. This interest was clearly
demonstrated by the draft organic standards that have been provided to the National
Organic Standards Board by the National Organic Aquaculture Working Group. Organic
production offers tremendous potential for small farmers who would like to differentiate
their products and develop viable markets for premium products. Select premium price
markets are especially vital to the survival of the small farmer since cost of production is
generally higher and the output is lower for this producer segment.
For the consumer, the availability of organically grown aquatic products will
increase their comfort level and could, possibly, increase their willingness to purchase
and prepare seafood products for their families. This shift would greatly add to the
quality of the American diet.
Currently, there are no accepted standards in the United States for the production
of organic seafood. This lack of standards means that imported product can bear the seal
of the foreign certifying agency and be sold as organic in all states with the exception of
California. The long-term goal of this project is to develop a better understanding of
potential market opportunities for organically grown fish and shellfish products in the
United States.
Availability of such market intelligence will assist farmers in meeting the
challenges of a global market. It will allow industry to adjust business and market
planning to develop innovative strategies that can support viable price structures over the
long term.
To best achieve the goals of the overall project and develop a meaningful survey
instrument to be utilized with a larger sample (800 respondents) during Phase II of the
project, focus groups were held in four locations: Central New Jersey; Boston,
v

Massachusetts; Chicago, Illinois; and Colorado Springs, Colorado. In addition to gaining
qualitative insight into consumer attitudes and perceptions regarding organically farmed
aquatic products, a short questionnaire was administered at the completion of each focus
group to gather quantitative information. Respondents’ views on seafood varied often
depending on their geographic location of residence.
Overall, respondents were enthusiastic about the availability of organic seafood.
A large majority (72 percent) indicated they would purchase organic seafood if presented
with the opportunity (Figure 6). However, there was reluctance to totally commit. Fifty-
two percent of the participants felt that they would purchase those products from time to
time, while 28 percent were not convinced of the value of the products and would not
purchase them (Table 10). A major concern was the cost of an organic product since
many consumers already view seafood as an expensive alternative.
Aquaculture production systems raised additional concerns about the use of
synthetic hormones and genetically modified organisms. Ninety-five percent of the
consumers in the focus groups felt that a major advantage of organic fish/shellfish was
that it was chemical/pesticide free and this was a major force driving interest in the
purchase of organic products. Other reasons for wanting to purchase organic seafood
were that it: is antibiotic free (87 percent); has superior flavor (62 percent); is
ecologically sound (59 percent); and has better quality (59 percent). (Table 11).
Reasons for not wanting to purchase organic seafood were that it: is too expensive
(67 percent); has no credible standards (53 percent); is not worth the price differential (40
percent); and has limited availability (13 percent). Thirteen percent of those surveyed
indicated that they were not concerned about additives, chemicals or residues (Table 12).
Because they are not concerned, most felt that purchasing organic product was not worth
the price differential.
Consumers showed an overall preference for wild-caught seafood products as
many felt it is superior in quality and taste compared to farm-raised. Fifty-one percent
vi

indicated that they strongly prefer wild and 27 percent indicated that they somewhat
prefer wild-caught seafood (Figure 4). Respondents also indicated preference for
domestic seafood products. Fifty-nine percent indicated that they strongly prefer
domestic and 21 percent indicated that they somewhat prefer domestic while 14 percent
had no preference (Table 4). However, in the broader telephone survey, when asked
about whether country of origin would influence the purchase decision, only 60 percent
said yes.
Most people continue to consume less seafood than is recommended for a well
balanced diet. To change this dynamic will require a well-directed consumer education
campaign especially in terms of farm-raised and organically-grown seafood products.
vii

1. Introduction For the purposes of this report, the term seafood is used to characterize all freshwater and saltwater finfish and shellfish used for food. The inclusion of bivalve molluscan shellfish raised on leased beds as a farm-raised product differs from state to state, but for the purposes of this report, those products are considered farm-raised. Numerous groups have voiced concerns about the deteriorating American diet
especially among young people. Poor diet has led to an increase in diabetes, coronary
heart disease, obesity, and escalating health care costs. Although dietary strategies are in
place that could significantly change this statistic, the number one cause of death in the
United States remains coronary heart disease. Numerous groups including the American
Heart Association, the American Cancer Society, the American Academy of Natural
Sciences, the American Diabetes Association, and the United States Department of
Agriculture all recommend that Americans significantly increase their consumption of
seafood products to maintain good health.
Although consumers have generally positive attitudes toward seafood, its
consumption in the United States has remained relatively static over the past fifty years.
Per capita annual consumption reached a record 16.6 pounds in 2004 (National Marine
Fisheries Service). The top ten products consumed in 2004 were shrimp, canned tuna,
salmon, pollock, catfish, tilapia, crab, cod, clams and flatfish. (National Fisheries
Institute). The list reflects the growing importance of aquaculture in supplying the
American market. The fish farming community increasingly supplies shrimp, salmon,
catfish, tilapia and clams. Many speculate that this increase in consumption of farm-
raised products may be due to decreasing prices and increasing supply among those
commodities.
Fish and shellfish account for less than 8 percent of the total for all high protein
animal foods consumed in the United States and, for centuries, wild harvesting of fish
and shellfish provided the bulk of the seafood supply. Blake (2000) discusses how the
century old practice of harvesting fish from the wild is in jeopardy due to over-fishing.
According to Blake, in 2000; there were 96 species of fish that were classified as
1
“threatened” and it is estimated that by 2010 there will be 125. Although the United
States has developed an extensive fisheries management program designed to
significantly reduce by-catch, allow species to rebuild, and establish maximum
sustainable yields to help ensure the future of fishery stocks, the vast majority of seafood
consumed in the United States is imported. These imports often originate in countries
that do not have management programs for their wild catch and do not practice
environmentally sound aquaculture.
Although aquaculture is increasingly supplying the American market, many
consumers do not have a clear understanding of fish farming. This is further exacerbated
by misinformation and agenda-driven disinformation that is routinely provided to and
reported by the media. Robertson et al. (1999) conducted a survey of New England
residents to understand consumers’ knowledge and attitudes towards marine aquaculture
and found that most respondents (53.6 percent) were unfamiliar with aquaculture.
Currently aquaculture is the fastest growing food producing sector and in 2002,
FAO reported that world aquaculture production of fish, crustaceans, and mollusks,
totaled 39.8 million metric tons in comparison to captured production of 93.2 million
metric tons; (Chan 2005). There are, however, concerns relating to aquaculture that have
put the industry under the intense scrutiny. Examples of health concerns that have been
widely reported in the media are levels of PCBs and use of colorants in farmed salmon.
Concerns relating to health and the environment have led to an increased
consumer desire to purchase “natural,” “hormone-free”, and “antibiotic-free” fish and
shellfish (Boehmer at el., 2005). Consumers have come to recognize organic farming as
a production method that can satisfy that desire. Consumers view organic food as being
produced without synthetic pesticides, unnatural fertilizers, added growth hormones,
antibiotics, artificial additives, food coloring, ionizing radiation, and not genetically
modified in any way. The United States Department of Agriculture (USDA) Organic
Food Production Act defines an organic production system as “a production system that
is managed in accordance with the Act and regulations in this part to respond to site-
2

specific conditions by integrating cultural, biological, and mechanical products that foster
cycling of resources, promote ecological balance and conserve biodiversity”
(www.ams.usda.gov/nop/NOP/standards.html). The USDA focus is the production
system not the resultant product.
The sale of organic food grew by more then 20 percent year after year in the
1990’s and in 2002 the organic food market was estimated to be at $11 billion (Willer
and Yussefi, 2004). Although the total percentage of the food supply produced using
organic methods in the United States is only between 1 and 2 percent, that number is on
the rise as a result of the demand from consumers (Whole Foods Market, Wild Oats,
Trader Joe’s).
Table 1: Consumer Sales and Growth Rates of Organic Foods, 1997-2003
Year Sales (Billion dollars) Growth Rate (percent) 1997 $3.6 1998 $4.3 19.7 1999 $5.0 18.2 2000 $6.1 21.0 2001 $7.4 20.7 2002 $8.6 17.3 2003 $10.4 20.2
Source: Nutrition Business Journal, 2004
Although relatively new to organic production principles, there have been efforts
to begin applying organic principles to aquaculture. When compared to other organic
foods, organic aquaculture is still in its infancy worldwide. According to figures released
by FAO on the status of organic aquaculture, as of June 2004, worldwide production in
2000 was estimated at approximately 5,000 metric tons (Franz, 2004). For the year 2003
the report uses data from Naturland, a German organic certifier, to estimate that
worldwide organic aquaculture production reached a total of about 7,500 metric tons, the
bulk of which is from the production of organic salmon.
3

A study funded by the EU FAIR Programme (Aarset, 2000) to understand
European consumers perception of organic salmon production; revealed that the term
‘organic’ as it applies to salmon rendered a great deal of confusion. In general,
respondents indicated an expectation that organic salmon should be environmentally
friendly and be produced in a sustainable manner. In addition to leaving consumers
confused about the terminology, organic aquaculture is a tough sell among many
consumers in Europe. A study done by Seafish Research and Information (Gross, 2001)
surveyed housewives in the UK to understand consumer attitudes and concluded that the
concept of organic seafood did not resonate among highly committed organic food
consumers. These consumers believe that “the concept of organic seafood lacks
credibility.” This lack of credibility existed even though there is an established organic
seal developed by the UK Soils Association.
In the U.S., a survey of seafood consumers conducted by the Seafood Choices
Alliance (2001) indicates interest by a sizable number of respondents in consuming
organic seafood. When respondents were asked how likely they would be to purchase
fish labeled “organic” over a fish of the same species or a similar tasting fish, 36 percent
indicated at least somewhat more likely to purchase the product labeled organic
compared to 16 percent who responded less likely. This study looked only at label
considerations and did not include a price component.
2. Research Objectives The long-term goal of this project is to develop a better understanding of potential
market opportunities for organically grown fish and shellfish products in the United
States. Organic production offers tremendous potential for small farmers who would like
to differentiate their products and develop viable markets for premium products.
Segmented premium price markets are especially vital to the survival of the small farmer
since cost of production is generally higher and the output is lower for this producer
segment.
4

Availability of appropriate market intelligence will assist farmers in meeting the
challenges of a global market. It will allow industry to adjust business and market
planning to develop innovative strategies that can support viable price structures over the
long term.
Marketability of organically grown fish and shellfish is a national priority
supported by the National Organic Aquaculture Working Group, which operates under
the auspices of the USDA Agriculture Marketing Service National Organic Program and
the National Fisheries Institute, a Washington-based industry trade group. This group
provided a draft set of Organic Standards to the National Organic Standards Board for
review. Currently, there are no accepted standards in the United States for the production
of organic seafood. The lack of standards means that imported product can bear the seal
of a foreign certifying agency and be sold as organic in all states except California.
Numerous European certifying agencies have adopted standards for specific aquacultured
products and labeled product is making its way into the United States market and
potentially capturing long-term market share.
The project identifies those components of “brand” (organically-grown) utility
that are most potent in developing and increasing market share. It provides an in-depth
analysis of consumer and retailer perceptions of seafood, farm-raised seafood and
organically grown seafood in four target markets. The project identifies barriers to
consumer acceptance and suggests possible remedies to lower these barriers. It provides
insights into the most viable markets and market penetration strategies for organically
grown seafood products. The potency of descriptors such as “natural”, “environmentally
friendly”, and “sustainable” that could be used on product labels in addition to the
federally mandated term “farm-raised” is explored. The influence of the recently adopted
requirement for country of origin and method of production labeling on purchase decision
is evaluated.
3. Methodology
The methodology employed was a compilation of qualitative and quantitative data
collection in four target markets that were identified as representative of specific
5
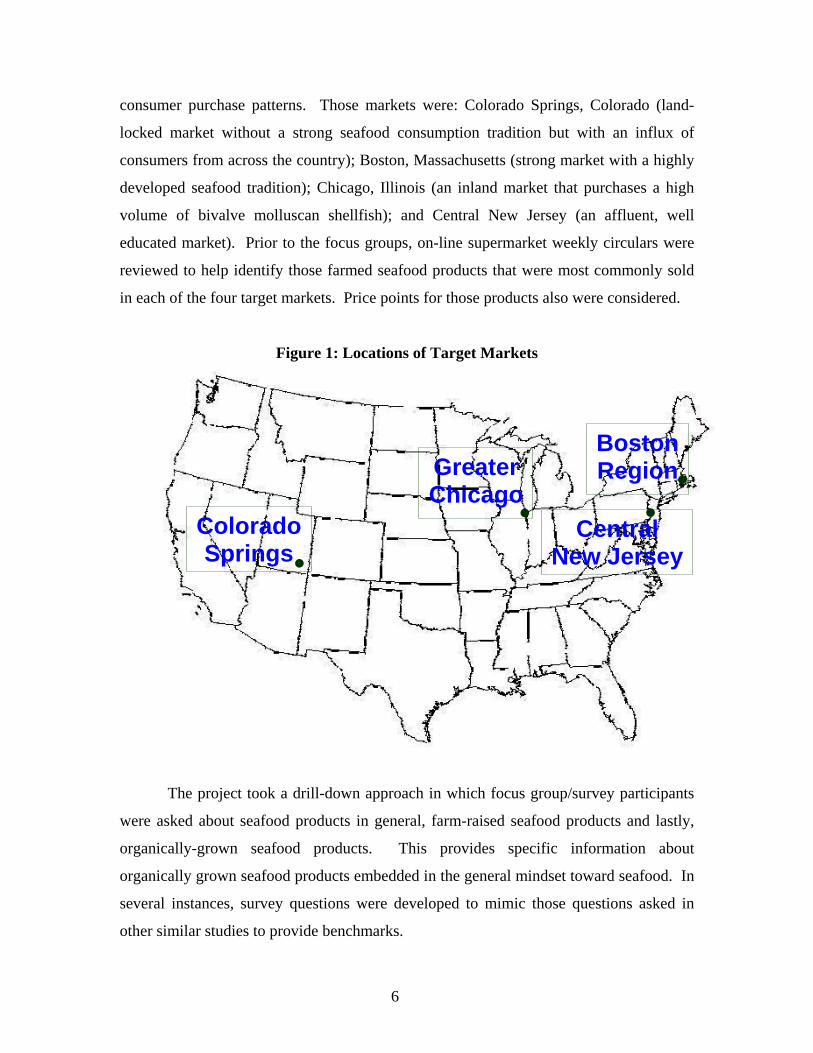
consumer purchase patterns. Those markets were: Colorado Springs, Colorado (land-
locked market without a strong seafood consumption tradition but with an influx of
consumers from across the country); Boston, Massachusetts (strong market with a highly
developed seafood tradition); Chicago, Illinois (an inland market that purchases a high
volume of bivalve molluscan shellfish); and Central New Jersey (an affluent, well
educated market). Prior to the focus groups, on-line supermarket weekly circulars were
reviewed to help identify those farmed seafood products that were most commonly sold
in each of the four target markets. Price points for those products also were considered.
Figure 1: Locations of Target Markets
• Colorado Springs
• BostonRegion
•Central New Jersey
•Greater Chicago
The project took a drill-down approach in which focus group/survey participants
were asked about seafood products in general, farm-raised seafood products and lastly,
organically-grown seafood products. This provides specific information about
organically grown seafood products embedded in the general mindset toward seafood. In
several instances, survey questions were developed to mimic those questions asked in
other similar studies to provide benchmarks.
6

Local supermarkets in each of the target markets hosted focus groups. Sites
included both upscale stores that carry a broad range of organic products and cater to a
health-conscious consumer as well as more generic stores. Participants in the focus
groups received dinner and a $20 store gift card. The focus groups were conducted in the
evening to allow participation by a greater range of shoppers. Most participants enjoyed
the opportunity to share their views and were forthcoming in their answers. At the
conclusion of each focus group, participants were asked to complete a short
questionnaire. The questionnaire helped to verify their answers especially about
willingness to pay. Consumers were more apt to indicate greater willingness to pay
during group discussions but then reconsidered when completing the questionnaire.
The focus groups provided direction for a larger telephone survey in each of the
target markets. Two hundred telephone surveys were completed in each of the four target
markets for a total of 800 surveys. The telephone surveys were limited to individuals
who actually purchase seafood for home consumption.
At the completion of the consumer portion of the project, a nationwide survey of
retailers was undertaken. Two hundred and fifty-seven questionnaires were mailed to
retail seafood executives. Each survey was accompanied by a postage paid return
envelope. The return was better than expected (13 percent) and many respondents were
extremely forthcoming about their attitudes and concerns regarding seafood products
including aquacultured and organically grown products.
4. Focus Group Results The first phase of the project included a series of consumer focus groups held in
four target markets-Central New Jersey, Boston, Chicago and Colorado Springs. The
focus groups included upscale, health-conscious and more generic shoppers. A portion of
the focus group interaction was devoted to developing a better understanding of those
terms and labels that conveyed quality in the minds of the consumer. This information
7

can be used in developing product-positioning strategies, packaging, and marketing
materials.
The focus groups were composed of a diverse population. Twenty-five percent
reported annual household incomes over $100,000, 20 percent between $50,000 and
$75,000, and 14 percent between $75,000 and $99,999. Twenty percent chose not to
answer. Forty-seven percent had children living at home. Forty-one percent had a
household size of 3, while 23 percent had households of 5. Seventy-seven percent of the
participants were female and 23 percent male. Twenty-seven percent were between 55
and 64 years of age, 23 percent between 35 and 44, 21 percent between 45 and 49 and 16
percent between 50 and 54. When asked about average monthly expenditures on
seafood, 42 percent estimated between $25 and $50, 37 percent between $50 and $100, 7
percent more than $150 and 5 percent between $100 and $150.
Since most of the consumers in the focus groups were recruited at the seafood
counter, almost all felt comfortable preparing seafood at home and purchased seafood at
least once a week. The shoppers from the upscale stores were more familiar with organic
products and most felt that those products had a high intrinsic value. Shoppers from the
more generic markets were unconvinced. Almost all of the participants were eager to
learn more about seafood. Several even arrived at the focus group meetings armed with
written lists of questions.
Consumers in each of the groups had distinct attitudes and purchase habits. The
Boston participants viewed seafood as a traditional dish. Almost all participants
indicated that they had grown up eating fish and that it was part of their family
background. A number indicated that they purchased fish at the supermarket but also
went to a local fish market where the fish was “fresh off the boat.” Retail chain
executives and seafood counter associates actively participated in the Boston focus
groups.
8

Colorado Springs consumers were concerned about how the product reaches
inland markets. Many were transplants from other parts of the country and wanted to see
a greater variety of products available in the marketplace. This group expressed major
concerns about freshness most likely as a result of the inland location.
The Chicago participants were very health conscious but expressed concerns
about the price of seafood and felt that price limited their ability to purchase more
seafood.
The New Jersey groups were the most diverse. One group clearly saw an
advantage to organic labeling while the second group felt that it wasn’t worth the extra
cost. Participants had a very good idea of the price of seafood products and could
provide an accurate range of price for a particular species. This was especially true for
the more exotic and higher priced species most likely as result of “sticker shock”.
4.1. The Seafood Shopping Experience Most consumers continue to purchase seafood as part of their regular grocery
shopping at the supermarket. The Colorado group was evenly divided between natural
food stores and supermarkets. This might be a factor of the fewer number of food outlets
in the area which would limit place of purchase options. Many indicated that they
purchase seafood on the reputation of the store. The reputation of the store essentially
becomes the brand. The counterperson and his/her interaction with the customer
continue to be a driving force behind seafood purchase. A comment that reverberated
was, “I trust what the sales associate suggests.” In almost all of the focus groups,
consumers mentioned knowledgeable sales associates as an important consideration in
making seafood purchases. People relied heavily on the expertise of those individuals
and it is an important area where stores might consider increased training to boost sales.
Many consumers indicated that they shopped once a week and this limited their
ability to purchase seafood since they use it on the day of purchase or the next day.
9

There remains a major bias against frozen seafood products. Many consumers do not
understand that some products sold at the fresh counter are previously frozen. Even
when the product was clearly labeled as “previously frozen,” as in the case of shrimp, the
majority of the participants felt that this practice was deceptive.
It is interesting to note that in at least one upscale store that featured
organic/natural products, there was a great deal of consumer interest in the opening of a
national chain known for both natural/organic foods and lower prices in their
neighborhood. Clearly, price is a major consideration for many seafood users. Although
many participants expressed an interest in purchasing seafood at a natural foods/upscale
market, many felt that the prices were prohibitive for routine purchases.
Some of the inland participants felt that they would like to see “fresher fish” and a
better variety at the seafood counter. Several commented that they were tired of seeing
the same old catfish, salmon and rainbow trout with a smattering of mussels and hard
clams that did not look appetizing. There was some concern about seeing previously
frozen products in the fresh case.
Figure 2: Primary Location of Seafood Purchase for Home Consumption
28%
6%
29%
50%
25%
59%
50%
83%
11% 11%21%
2%0%
10%
20%
30%
40%
50%
60%
70%
80%
90%
Average New Jersey Massachusetts Colorado Illinois
Natura Food Store Supermarket Fish Store Other
10

Most participants purchase seafood in conventional supermarkets. This is
especially the case for many of the respondents in New Jersey. In New Jersey, over 83
percent of the respondents indicated that they purchase seafood in supermarkets. It is
interesting to note that, on average, only 11 percent shopped at fish stores even though
the area has a large number of small fish markets. Those participants that did shop at a
fish store felt that the product was fresher and better than at the supermarket (Figure 2).
Figure 3: Frequency of Seafood Purchase
22%
39%
10%10%
17%
11%
25%32%
23%
50%
33% 32%
23%
35% 33%
54%
25%26%
0%
10%
20%
30%
40%
50%
60%
Average New Jersey Massachusetts Colorado IllinoisOnce a month Twice a Month Once a Week Twice a Week or More
Since focus group participants were recruited at the seafood counter, most were
frequent purchasers of seafood for home consumption. Sixty-eight percent of the
participants purchased seafood at least once a week for home consumption (Figure 3).
During the focus group sessions, many of the participants indicated that they purchased a
wide variety of seafoods. People were excited about seafood and talked about calamari,
escargot and other more exotic species.
4.2. Product Labeling Seventy-eight percent of the participants indicated that they preferred wild
seafood, only 9 percent preferred farm-raised, and 13 percent had no preference (Figure
4). Although this is a strongly expressed preference, price is an important determining
factor in actual purchase decision. Generally, prices for farmed seafood are lower than
11

those for wild caught product. The term farm-raised conjured up antibiotics, hormones,
GMOs, and all the negative issues that have been raised about other farm-raised products.
Typical comments were;
“I prefer wild. I don’t understand why farm-raised salmon lose their color and have to
be dyed to be sold. Are the fish okay?”
Figure 4: Consumer Preference for Wild and Farm-Raised
5%
51%61%
36%42%
100%
27%17%
43%31%
4% 5% 5%7%11%13% 17% 14% 11%
0%
20%
40%
60%
80%
100%
120%
Average New Jersey Massachusetts Colorado Illinois
Strongly Prefer Wild Somew hat Prefer Wild Strongly Prefer Farm-Raised
Somew hat Prefer Farm-raised No Preference
The next set of questions dealt with terms that are commonly used to describe
aquacultured products.
Table 2: Response to Terms Identifying Farm-Raised Seafoods
Percentage Fish/Shellfish Production Process Average New Jersey Massachusetts Colorado Illinois
Aquacultured 54% 66% 50% 35% 100% Cultured 20% 17% 25% 25% 0 Farm-Raised 26% 17% 25% 40% 0 Total 100% 100% 100% 100% 100%
Although it might be thought that the term “farm-raised” would have a better
resonance with the consumer, there was actually a preference for the term “aquacultured”
12

in the focus groups. USDA country of origin labeling requirements use the term farm-
raised. In the Gross; 2001 study, active environmentally-concerned consumers viewed
the term “farmed” as implying too much human intervention, but overall it received a
positive response. Farm-raised might imply more of an active involvement with the
animals and most people don’t make this association with fish. “Cultured” is a term often
used by the molluscan shellfish industry. Many industry members believe that it conveys
an up-market image, however this was the least popular term in the focus group
component of the project.
In the next set of questions, the terms organically grown and natural were added
to the mix.
Table 3: Consumer Perceptions about Seafood Type that Conveys the Highest Quality
Percentage Fish/Shellfish Type
Average New Jersey Massachusetts Colorado IllinoisOrganically grown 24% 28% 20% 25% 25% Harvested from the Wild
53% 50% 47% 60% 50%
All Natural 23% 22% 33% 15% 25% Total 100% 100% 100% 100% 100%
When asked which term conveys the highest quality, consumers in each of the
focus groups preferred “harvested from the wild.” This may be a reflection of the food
press that tends to promote the idea that wild harvest is preferable to farm-raised product
because it is perceived to have a more distinct taste. Since consumers in coastal states
might hear more about marine recreational fishing advisories issued based on the level of
contaminants in sportfish, there could be some transference between those advisories and
consumption of commercial fish. Concerns about those contaminants might be expected
to drive sales toward organic products; however, this wasn’t evident in the responses.
Although there are freshwater advisories in inland states, much of the seafood sold at
retail is comprised of marine species (Table 3).
13

When asked what the term organic means, consumers responded with natural,
whole, unprocessed, no pesticides, natural fertilizers, and no sprays. About seventy-eight
percent of the consumers polled indicated that they had purchased organic products
(Table 9). All agreed that organic products cost more. There were differing opinions
about whether or not they were worth the price differential. Most had never seen a
seafood product labeled organic, although in several of the stores in which focus groups
were conducted such products were on display at the seafood case.
Figure 5: Seafood Production Terminology that Conveys the Highest Quality
45%41% 43%
50% 50%
40%35% 36%
45%50%
15%
24%21%
5%
0%
10%
20%
30%
40%
50%
60%
Average New Jersey Massachusetts Colorado Illinois
Raised in the Wild Raised in Pristine Waters Raised in Controlled Conditions
Again in this triplet, consumers preferred the term wild, however, using the adjective
pristine to describe the growing waters considerably improved consumer perceptions
(Figure 5). This is similar to the strategies employed by bottlers of spring water. Using
this type of positive terminology may be an important consideration in positioning farm-
raised seafood products in the marketplace. The Chicago consumers, now that the term
“raised” was added to the wild connotation, were now equally divided between “raised in
the wild” and “raised in pristine waters.” Consumers did not like the term “raised in
controlled conditions”. This is similar to the 1992, Gall and O’Dierno study, in which
consumers indicated that they felt raising fish in aquaculture facilities was somehow
artificial and carried too much of a factory connotation. During the discussion portion of
the focus groups, there were numerous concerns about the quality of the water in
aquaculture operations. This is clearly an area where consumer education is required and
14

the use of labeling that reinforces the idea of clean water may influence purchase
decisions.
Many consumers continue to have a bias against farm-raised. They were
concerned about the use of antibiotics, drugs, and hormones in the production of seafood
in aquaculture facilities. Most were familiar with concerns about color additives.
Negative press on color additives and presence of PCBs in farmed salmon has had a
lasting impact on consumers especially those heavy users of seafood. In several groups,
consumers expressed concerns about “genetically altered” foods.
“It’s not what nature intended”.
“Wild is better because of the lack of human involvement.”
“Chickens are not housed in containers.”
“Wild seems more natural. Less contrived.”
To gain mainstream acceptance, the aquaculture industry will have to undertake
an educational campaign to make consumers feel more comfortable with the product.
Many consumers expressed concerns about the crowded conditions in aquaculture
facilities and the quality of the water.
“I’ve seen those facilities and the fish are swimming in dirty water. It’s unhealthy” There were also concerns about the fish feed. A number of people said that the
feeds were unnatural. At least three people felt that fish-eating fish was unnatural. It was
somehow cannibalistic. Others were concerned about diets comprised of soy meal and
corn as being unnatural. There was no discussion of possible implications for marine
ecosystems of feeding fish to higher-level predators although this issue is often a major
criticism of aquaculture practices raised by environmental groups. Discussions centered
entirely on the diets being unnatural.
15

4.3. Country of Origin Consumers had strong positive reactions to product that was labeled with a USA
origin. Fifty-nine percent strongly preferred domestic product. Twenty-one percent
preferred imported while 14 percent had no preference (Table 4). However, during the
discussion, most consumers had not noticed country of origin labeling at the seafood
counter although the stores in which the participants were recruited clearly labeled their
products. In spite of a clear bias toward purchasing USA product, the vast majority of the
seafood sold in this country is imported.
Table 4: Consumer Preference for Domestic and Imported Seafood
Percentage Preference
National Average New Jersey Massachusetts Colorado IllinoisStrongly prefer domestic
59% 55% 86% 37% 75%
Somewhat prefer domestic
21% 17% 7% 42%
0% No preference 14% 22% 7% 16% 0% Somewhat prefer import
4% 6% 0% 0% 25%
Strongly prefer import
2% 0% 0% 5% 0%
Total 100% 100% 100% 100% 100%
In this set of questions, major seafood farming countries were used as production
locations. When presented with specific country of origin options, 95 percent of the
respondents selected farm-raised in the USA (Table 5). However, in Table 16, when
individual local production areas within the United States were identified, 32 percent felt
that imported product was higher quality. The brand of preference seems to be “USA”.
16

Table 5: Perceptions about Country of Origin that Convey the Highest Quality Percentage Fish/Shellfish Country of Origin
Average New Jersey Massachusetts Colorado IllinoisFarm-Raised in Chile 5% 0 7% 5% 25% Farm-Raised in China 0 0 0 0 0 Farm-Raised in the USA 95% 100% 93% 95% 75% Total 100% 100% 100% 100% 100%
4.3B. Eco-Friendly Labeling
Table 6: Effect of Eco-Friendly Labeling on Purchasing Decision(s) Percentage Effect
Average New Jersey Massachusetts Colorado IllinoisMore likely to purchase 71% 83% 73% 53% 100% Less likely to purchase 4% 0 7% 5% 0 No effect 25% 17% 20% 42% 0 Total 100% 100% 100% 100% 100% Seventy-one percent of those surveyed indicated that they would be more likely to purchase product that carried an eco-friendly label (Table 6). Many were familiar with
the issue of dolphin safe tuna and made a concerted effort to change their purchase
patterns when the concern was prominent in the media. As media attention for the issue
diminished, those labels are no longer prominent. Twenty-five percent said that eco-
labeling would have no effect on purchase decision (Table 6).
Table 7: Consumer Perceptions about Ecologically Sound Seafood Production
Methods that Convey the Highest Quality Percentage Term
Average New Jersey Massachusetts Colorado IllinoisHarvested from a Sustainable resource 21% 18% 20% 25% 25%
Farm-raised in an ecologically-sound manner
41% 29% 47% 50% 25%
Harvested in an ecologically-sound manner
38% 53% 33% 25% 50%
Total 100% 100% 100% 100% 100%
17

The term ecologically sound had more resonance with the participants than
sustainability probably because of the lack of familiarity with the concept of sustainable
resources. Since both “farm-raised in an ecologically-sound manner” (41 percent) and
“harvested in an ecologically-sound manner” (38 percent) were weighted about equally,
there seems to be little distinction between farmed and wild harvest in this context (Table
7).
4.4. Organic Labeling
Consumers expressed a clear interest in the purchase of organic seafood. When
asked about organic labeling, consumers preferred the term “organically grown” (Table
8). This may reflect the current labeling for fruits and vegetables. Although it might be
thought that farmed or farming has a resonance with the consumer, for aquatic products,
this did not seem to hold true. “Organically aquacultured” (34 percent) was favored over
“organically farmed” (12 percent). This is reflective of the results in Table 2. where
consumers preferred the term aquacultured (56%) over farm-raised (26%).
Table 8: Organically Grown Terminology that Conveys the Highest Quality
Percentage Types of Organically Grown Average New Jersey Massachusetts Colorado Illinois
Organically Farmed 12% 12% 13% 15% 0 Organically Aquacultured 34% 35% 27% 30% 75% Organically Grown 54% 53% 60% 55% 25% Total 100% 100% 100% 100% 100%
18
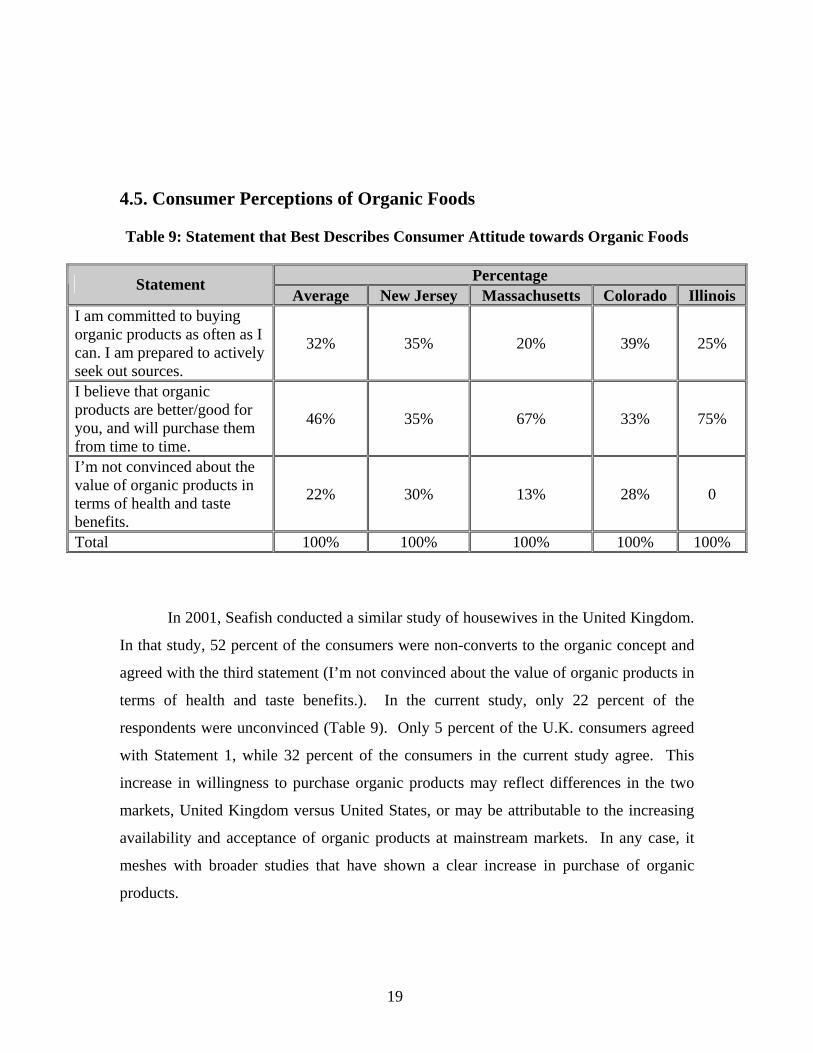
4.5. Consumer Perceptions of Organic Foods Table 9: Statement that Best Describes Consumer Attitude towards Organic Foods
Percentage Statement
Average New Jersey Massachusetts Colorado Illinois I am committed to buying organic products as often as I can. I am prepared to actively seek out sources.
32% 35% 20% 39% 25%
I believe that organic products are better/good for you, and will purchase them from time to time.
46% 35% 67% 33% 75%
I’m not convinced about the value of organic products in terms of health and taste benefits.
22% 30% 13% 28% 0
Total 100% 100% 100% 100% 100%
In 2001, Seafish conducted a similar study of housewives in the United Kingdom.
In that study, 52 percent of the consumers were non-converts to the organic concept and
agreed with the third statement (I’m not convinced about the value of organic products in
terms of health and taste benefits.). In the current study, only 22 percent of the
respondents were unconvinced (Table 9). Only 5 percent of the U.K. consumers agreed
with Statement 1, while 32 percent of the consumers in the current study agree. This
increase in willingness to purchase organic products may reflect differences in the two
markets, United Kingdom versus United States, or may be attributable to the increasing
availability and acceptance of organic products at mainstream markets. In any case, it
meshes with broader studies that have shown a clear increase in purchase of organic
products.
19

4.6. Consumer Perceptions of Organically – Grown Seafood
Table 10: Statement that Best Describes Attitude towards Organic Seafood
Percentage Statement Average New Jersey Massachusetts Colorado Illinois
I am committed to buying organic fish/shellfish as often as I can. I am prepared to actively seek out sources.
20% 18% 13% 28% 25%
I believe that organic fish/seafood are better/good for you, and will purchase them from time to time.
52% 47% 60% 44% 75%
I’m not convinced about the value of organic fish/shellfish in terms of health and taste benefits.
28% 35% 27% 28% 0
Total 100% 100% 100% 100% 100%
Commitment to purchasing organically grown seafood was not as high (20%
Table 10) as commitment to purchasing organic products (32% -Table 9). This may be a
factor of the greater availability of organic produce and dairy products. The consumer
has seen those products over a period of years and familiarity/acceptance has grown as a
result of advertising and educational efforts. Although several of the stores that hosted
the focus groups had imported seafood product that was labeled organic, the
overwhelming majority of shoppers had not noticed the label. However, 52 percent felt
those organic fish/seafood are better and would purchase the product from time (Table
10). This demonstrates a willingness on the part of the consumer to begin purchasing
organic seafood products.
Consumers in the focus groups were reluctant to fully commit to purchasing
organic seafoods. Fifty-two percent of the participants felt that they would purchase
those products from time to time while 28 percent were not convinced of the value of the
products (Table 10). Chicago consumers were most convinced of the value of such
20
products, but many of those consumers were also interested in purchasing from stores
that carry a wide range of frozen seafood products at a moderate price. Pricing strategies
will be important in building market share.
Many consumers in the focus groups had heard negative stories about
aquacultured seafood and felt that, specifically in this category, it was important to have
some third party guarantees on the safety of the product. Several individuals reiterated
the importance of the store reputation in ensuring the safety of the product. Most had
specific stores in which they purchased seafood because they felt the quality and safety of
the product was better.
Consumers in New Jersey and Massachusetts were least convinced about the
benefits of organic production. This might be attributed to the idea that they had grown
up with wild caught seafood.
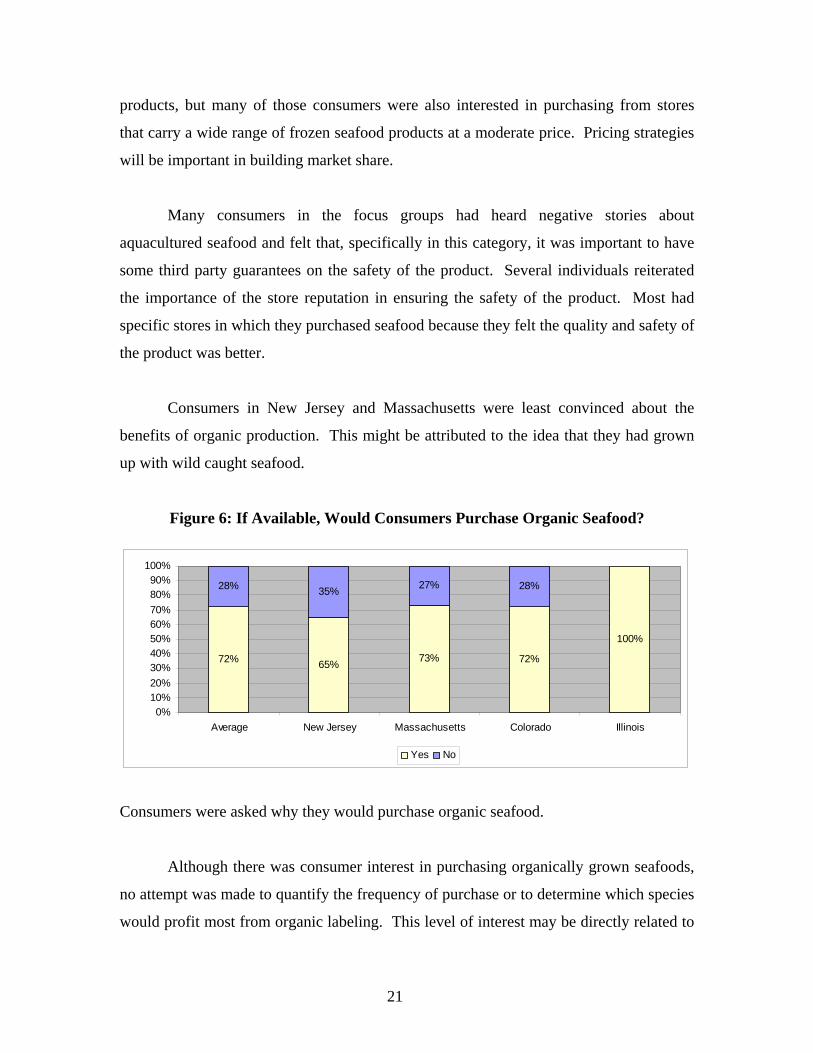
Figure 6: If Available, Would Consumers Purchase Organic Seafood?
72% 65% 73% 72%
100%
28% 35% 27% 28%
0%10%20%30%40%50%60%70%80%90%
100%
Average New Jersey Massachusetts Colorado Illinois
Yes No
Consumers were asked why they would purchase organic seafood.
Although there was consumer interest in purchasing organically grown seafoods,
no attempt was made to quantify the frequency of purchase or to determine which species
would profit most from organic labeling. This level of interest may be directly related to
21
concerns about the safety of the product. Media coverage of negative stories about
farmed seafood may increase demand for products that are labeled organic but this
demand may be short-lived. Twenty-eight percent of the shoppers were not interested in
an organic product and most did not see any value in purchasing it (Figure 6).
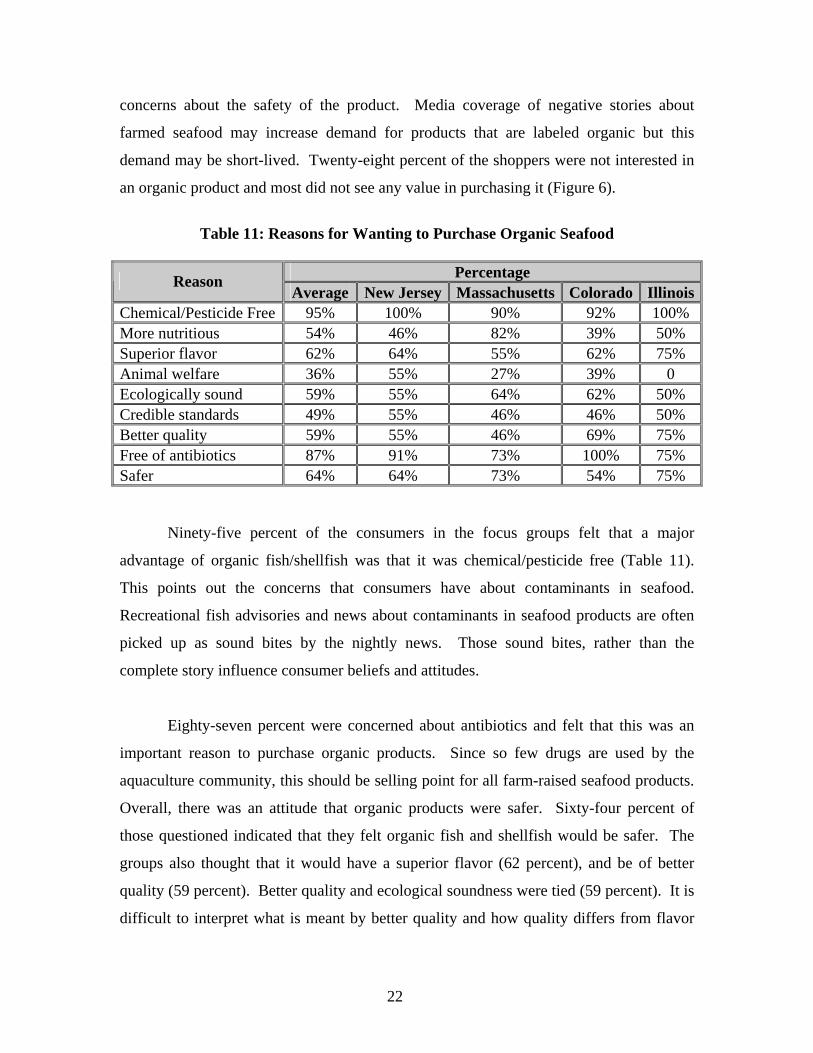
Table 11: Reasons for Wanting to Purchase Organic Seafood
Percentage Reason
Average New Jersey Massachusetts Colorado IllinoisChemical/Pesticide Free 95% 100% 90% 92% 100% More nutritious 54% 46% 82% 39% 50% Superior flavor 62% 64% 55% 62% 75% Animal welfare 36% 55% 27% 39% 0 Ecologically sound 59% 55% 64% 62% 50% Credible standards 49% 55% 46% 46% 50% Better quality 59% 55% 46% 69% 75% Free of antibiotics 87% 91% 73% 100% 75% Safer 64% 64% 73% 54% 75%
Ninety-five percent of the consumers in the focus groups felt that a major
advantage of organic fish/shellfish was that it was chemical/pesticide free (Table 11).
This points out the concerns that consumers have about contaminants in seafood.
Recreational fish advisories and news about contaminants in seafood products are often
picked up as sound bites by the nightly news. Those sound bites, rather than the
complete story influence consumer beliefs and attitudes.
Eighty-seven percent were concerned about antibiotics and felt that this was an
important reason to purchase organic products. Since so few drugs are used by the
aquaculture community, this should be selling point for all farm-raised seafood products.
Overall, there was an attitude that organic products were safer. Sixty-four percent of
those questioned indicated that they felt organic fish and shellfish would be safer. The
groups also thought that it would have a superior flavor (62 percent), and be of better
quality (59 percent). Better quality and ecological soundness were tied (59 percent). It is
difficult to interpret what is meant by better quality and how quality differs from flavor
22
and the other components of wholesomeness. Quality may involve an appearance
component (Table 11).
Superior flavor was also viewed to be a major attribute of organic seafood,
however, this is in juxtaposition to the identification of wild harvest as having superior
flavor to aquacultured products.
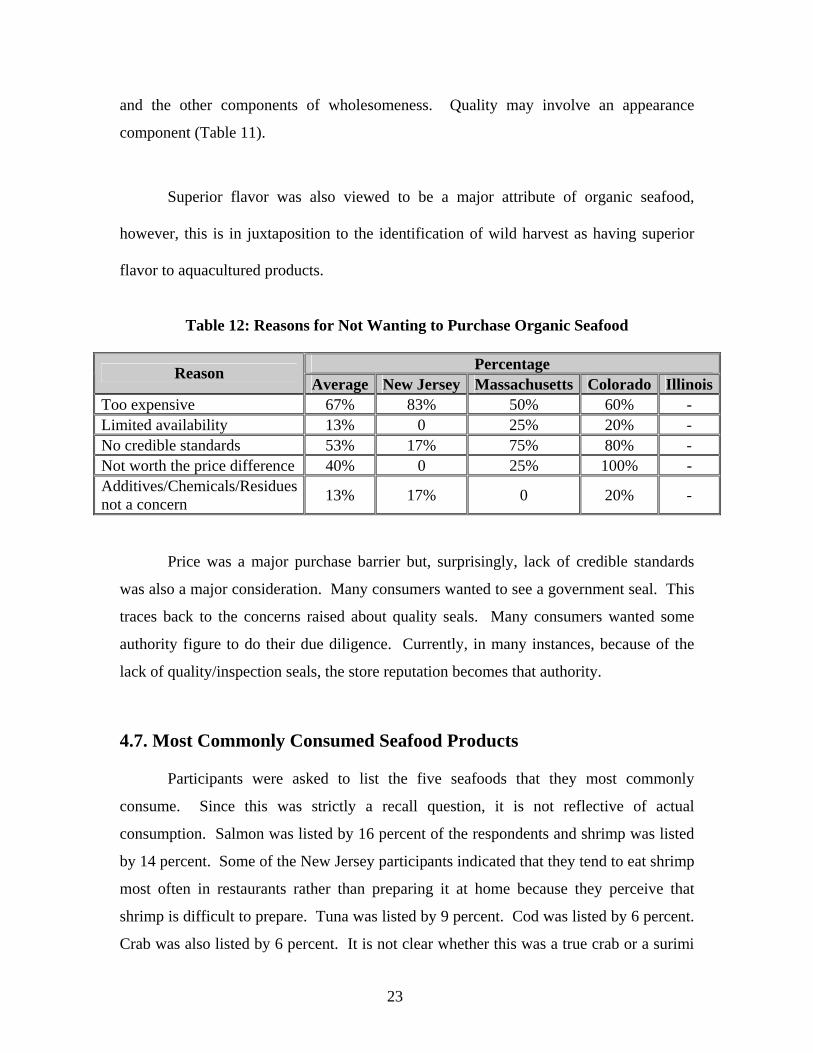
Table 12: Reasons for Not Wanting to Purchase Organic Seafood
Percentage Reason
Average New Jersey Massachusetts Colorado IllinoisToo expensive 67% 83% 50% 60% - Limited availability 13% 0 25% 20% - No credible standards 53% 17% 75% 80% - Not worth the price difference 40% 0 25% 100% - Additives/Chemicals/Residues not a concern 13% 17% 0 20% -
Price was a major purchase barrier but, surprisingly, lack of credible standards
was also a major consideration. Many consumers wanted to see a government seal. This
traces back to the concerns raised about quality seals. Many consumers wanted some
authority figure to do their due diligence. Currently, in many instances, because of the
lack of quality/inspection seals, the store reputation becomes that authority.
4.7. Most Commonly Consumed Seafood Products Participants were asked to list the five seafoods that they most commonly
consume. Since this was strictly a recall question, it is not reflective of actual
consumption. Salmon was listed by 16 percent of the respondents and shrimp was listed
by 14 percent. Some of the New Jersey participants indicated that they tend to eat shrimp
most often in restaurants rather than preparing it at home because they perceive that
shrimp is difficult to prepare. Tuna was listed by 9 percent. Cod was listed by 6 percent.
Crab was also listed by 6 percent. It is not clear whether this was a true crab or a surimi
23

based product (Table 13). Tilapia, although it was not in the top five species, was listed
by 4 percent of those surveyed.
Table 13: Most Commonly Consumed Seafoods
Top 5 Most Commonly Consumed Seafood Listed by Focus Group Participants National
Rank (NFI) Average New Jersey Massachusetts Colorado Illinois
1. Shrimp Salmon (16%) Shrimp (17%) Scallops (14%) Salmon (20%) Salmon (22%) 2. Canned tuna Shrimp (14%) Salmon (16%) Shrimp (12%) Shrimp (13%) Shrimp (17%) 3. Salmon Tuna (9%) Scallops (8%) Lobster (11%) Tuna (11%) Tuna (17%) 4. Pollock Cod (6%) Tuna (7%) Haddock (8%) Trout (9%) Cod (11%) 5. Catfish Crab (6%) Tilapia (7%) Salmon (8%) Halibut (8%) Haddock (1%)
In all markets, shrimp and salmon were best sellers. Species selection had a
regional nature. No consumers in the coastal markets, Massachusetts and New Jersey,
mentioned catfish among their list of top five species. Catfish was mentioned by 3
percent of the Colorado respondents. Many of the species, such as scallops (14 percent),
lobster (11 percent), haddock (8 percent), and clams (8 percent) mentioned in the
Massachusetts groups were traditional New England harvests. In Colorado Springs, since
many consumers were transplants, they were looking for species that they consumed back
home. Trout (9 percent) ranked highly among this group.
4.8. Pricing Most consumers had a good idea of seafood prices, however, the focus groups
were composed of people who regularly purchase seafood. Many quoted prices for very
expensive species. Clearly, they had at least looked at those products and the prices
made an impression. New Jersey consumers listed Chilean sea bass at $18.99 a pound.
In almost all of the focus groups, consumers felt that the price of seafood was too
high. However, in some instances, that did not affect purchase. In at least one upscale
store, the frequent response was “I want what I want and am willing to pay for it”. This
24

group was comprised primarily of dual-income, no kids at home families. A number of
people in that group indicated that their households were small, generally two person, and
since they didn’t need to buy much, cost wasn’t that much of an issue. One woman with
several children said that she sometimes purchases farm-raised fish since the price is
more affordable. In an upscale store group, most participants felt that the price of
seafood was about three times the price of meat. There was consensus that organic meat
was priced 30-40 percent higher and organic poultry was priced 20-25 percent higher
than non-organic products in the same category. For those consumers interested in
organic seafood products, most indicated that they were willing to pay between $3 and $5
more per pound for organic seafood.
4.9. Seafood Inspection When asked about seafood inspection, consumers had varying opinions. Many
felt that there was no inspection. Several mentioned size regulations and were familiar
with conservation issues in the recreational harvest but were unsure of commercial
harvest. Most felt that meat and poultry inspection was more strenuous. When asked
about the inspecting agency, the most common consumer response was USDA as a result
of their knowledge of meat and poultry inspection. Several mentioned that there was no
“seal” on the products.
Several felt that if government provides the standards, there is less of an onus on
the consumer. Government certification was an important consideration in the purchase
decision and labeling coupled with an education program might help to increase sales.
Many people indicated that they trust the store to inspect the product and offer
wholesome, good quality seafoods. This reinforces the idea of the store reputation being
a driving factor in seafood purchase.
4.10. Trying New Species In most of the focus groups, consumers felt that they would try a new product if it
were on sale. Others were interested in product samples. Many said that they try new
25

seafoods and new preparations in restaurants and then try to recreate the dish at home.
Almost all indicated that they would not purchase a new species unless they tasted it first.
Several indicated that store associates had been instrumental in getting them to try
something new.
4.11. Seafood and Health Quality and safety of the product were often viewed as a function of where the
fish was caught. Alaska and Hawaii were deemed safe harvest areas. It is interesting to
note, that in the questionnaire portion, many consumers were swayed by the simple use of
an adjective. A number of consumers selected the pristine waters of the Gulf of Mexico
as the point of origin label that they most likely select (Table 14). Consumers were also
swayed by what they perceived as vacation or “romantic” locations such as Cape Cod.
The concept of water quality seems to be directly tied to a region’s image.
Table 14: Package Label that Consumers’ Would Most likely Select in the Supermarket
Percentage Label Average New Jersey Massachusetts Colorado Illinois
Jersey Shore 17% - - -
Virginia Shore
- 0 - -
Colorado - - 37% - Farm-
Raised in: Great Lakes Region
18%
- - - 0
Farm-Raised on Cape Cod 61% 55% 80% 47% 75%
Farm-Raised in Chile 9% 0 7% 16% 25% Farm-Raised in the Pristine Waters of the Gulf of Mexico
12% 28% 13% 0 0
Total 100% 100% 100% 100% 100%
Seventy-five percent of the participants indicated that they be much more likely to
purchase particular seafood products if they were informed about regions that are known
for high quality and availability. This reinforces the need for greater consumer
education.
26
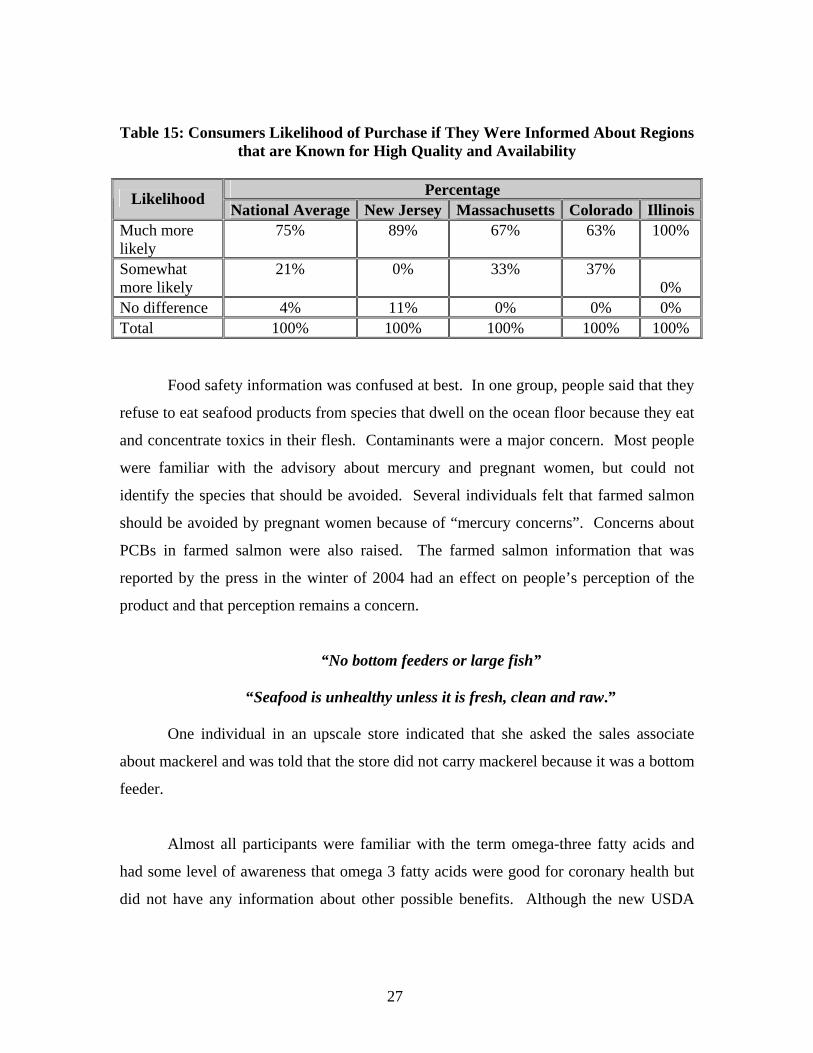
Table 15: Consumers Likelihood of Purchase if They Were Informed About Regions that are Known for High Quality and Availability
Percentage Likelihood
National Average New Jersey Massachusetts Colorado IllinoisMuch more likely
75% 89% 67% 63% 100%
Somewhat more likely
21% 0% 33% 37% 0%
No difference 4% 11% 0% 0% 0% Total 100% 100% 100% 100% 100%
Food safety information was confused at best. In one group, people said that they
refuse to eat seafood products from species that dwell on the ocean floor because they eat
and concentrate toxics in their flesh. Contaminants were a major concern. Most people
were familiar with the advisory about mercury and pregnant women, but could not
identify the species that should be avoided. Several individuals felt that farmed salmon
should be avoided by pregnant women because of “mercury concerns”. Concerns about
PCBs in farmed salmon were also raised. The farmed salmon information that was
reported by the press in the winter of 2004 had an effect on people’s perception of the
product and that perception remains a concern.
“No bottom feeders or large fish”
“Seafood is unhealthy unless it is fresh, clean and raw.”
One individual in an upscale store indicated that she asked the sales associate
about mackerel and was told that the store did not carry mackerel because it was a bottom
feeder.
Almost all participants were familiar with the term omega-three fatty acids and
had some level of awareness that omega 3 fatty acids were good for coronary health but
did not have any information about other possible benefits. Although the new USDA
27

Food Pyramid was announced on the day of the Colorado Springs focus groups, there
was no mention of it.
Almost all of the participants agreed that in order to maintain good health, you
should eat seafood at the very least twice a week. Many thought three times would be the
ideal. However, when this was compared to average monthly expenditures for seafood, it
did not seem that they were actually following this advice.
4.12. Seafood and Food Information Many consumers receive health and food information from television often as part
of local or national news broadcasts. It was obvious that often this was a sound bite and
many of the participants did not get a clear, complete message. A number of people said
that they regularly look for health information on the web. Many were devoted “foodies”
and watched the “Food Network” on a daily basis. Local cooking shows were also
mentioned.
4.13. Food Miles
Table 16: Perceptions about Seafood Origin that Convey the Highest Quality
Percentage Fish/Shellfish Origin Average New Jersey Massachusetts Colorado Illinois
Imported 32% 28% 0 60% 25% New Jersey 17% - - - Cape Cod - 100% - - Colorado - - 35% -
Locally Grown
In: Great Lakes
47%
- - - 50% Cape Cod 55% - - - Virginia - 0 - - California - - 5% -
Grown in
California
21%
- - - 25% Total 100% 100% 100% 100% 100%
The importance of local production, often referred to as “food miles”, has been
touted by the food press and is considered an important factor in food selection among
28

health conscious consumers. This was of special concern to the Colorado participants.
To test how this concept relates to seafood purchase, focus group participants were asked
to select the term that conveyed the highest quality. On average, locally grown was
selected by 47 percent of the participants. New Jersey, although it is a coastal state and
many residents regularly visit the Jersey Shore, did not score well with the participants.
Only 17 percent of the New Jersey respondents selected locally grown as an indicator of
quality. Twenty-eight percent of New Jersey participants selected imported as being of
higher quality. The locally grown connotation seems to vary in potency from location to
location (Table 16).
Both Colorado groups had a higher acceptance of imported products than the
other groups. Overall 32 percent of those in the focus groups felt that imported product
was higher quality than local production. This represents a disconnect between opinions
that were voiced in the focus group about the relationship of quality to the distance that
product had to travel to reach the market. Massachusetts participants, probably because
of their close association with the sea and the high quality reputation of the region as a
seafood harvesting area, preferred local production unanimously.
Other studies (Gross, 2001) have shown that the geographic descriptors (the
Scottish Coast) that romanticize the production location can sway consumers. New
Jersey consumers chose Cape Cod (55 percent) over locally grown on the Jersey Shore
(17 percent). A similar study conducted for the Southeastern Massachusetts Aquaculture
Center (Barnes, 2003), sampled consumers in New York, New Jersey, Massachusetts,
Connecticut, New Hampshire and Vermont and found that 26 percent would definitely
pay more for farm-raised clams branded from Cape Cod, 51 percent probably would, 16
percent probably would not and 6 percent definitely would not.
29

5. Conclusions
Effective marketing strategies can be developed to better position organically-
grown seafood products in the marketplace when marketers have an understanding of:
1) Which attributes of organically-grown seafood products are important
to consumers;
2) The mechanisms or factors that consumers use to decide to purchase
seafood;
3) What products they currently purchase;
4) Where they purchase seafood; and
5) The intrinsic dollar value that they place on organically grown
seafood.
Qualitative information gathered during the focus group portion of the project
provided a clearer understanding of how consumers make their purchase decision, their
general knowledge and understanding of seafood, farm-raised seafoods and organically-
grown seafoods. It also provided a qualitative understanding of the inherent values that
they place on farm-raised and organically-grown seafoods
Because clear distinctions emerged between upscale, health conscious consumers
and the more generic consumer, especially in terms of willingness to pay, organic
products will require a very specific market placement. In general, price is a limiting
factor in frequency of seafood purchase and this will extend to the purchase of
organically-grown products. Product safety rather than environmental considerations is
the major driving force behind organic purchase. A higher value is placed on products
that are more “natural” and have less “human intervention”.
There are five important issues that need to be addressed to improve the
marketability and sale of seafood as a category.
1) Consumers continue to have a bias against previously frozen products.
This indicates that freshness of seafood is an important attribute that
consumers look for as they make purchasing decisions.
30
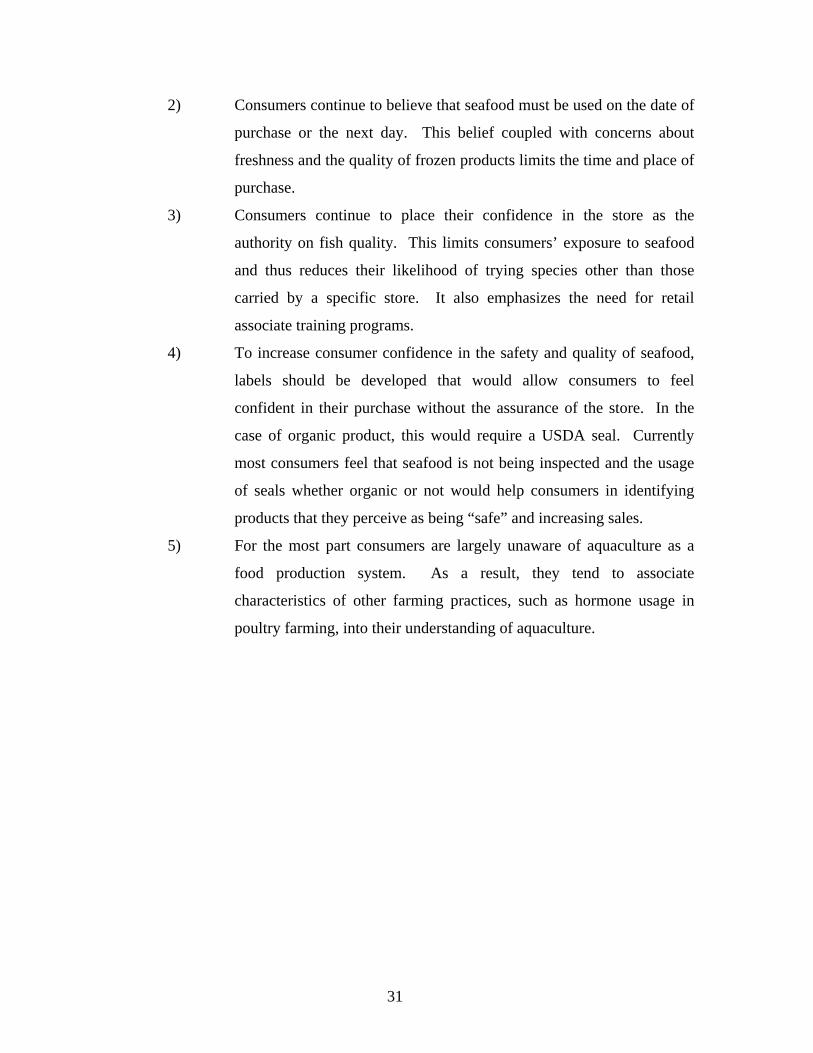
2) Consumers continue to believe that seafood must be used on the date of
purchase or the next day. This belief coupled with concerns about
freshness and the quality of frozen products limits the time and place of
purchase.
3) Consumers continue to place their confidence in the store as the
authority on fish quality. This limits consumers’ exposure to seafood
and thus reduces their likelihood of trying species other than those
carried by a specific store. It also emphasizes the need for retail
associate training programs.
4) To increase consumer confidence in the safety and quality of seafood,
labels should be developed that would allow consumers to feel
confident in their purchase without the assurance of the store. In the
case of organic product, this would require a USDA seal. Currently
most consumers feel that seafood is not being inspected and the usage
of seals whether organic or not would help consumers in identifying
products that they perceive as being “safe” and increasing sales.
5) For the most part consumers are largely unaware of aquaculture as a
food production system. As a result, they tend to associate
characteristics of other farming practices, such as hormone usage in
poultry farming, into their understanding of aquaculture.
31

6. References Aarset B., Beckmann S., Bigne J., Beveridge M., Bjorndal T., Bunting, M J., McDonagh, P., Mariojouls C., Muir J F., Prothero A., Reisch, L A., Smith A P., Tveteras R. and Young J A., “The European Consumers’ Understanding and Perceptions of Organic Salmon Production”, IIFET 2000 Proceedings, European Union FAIR Programme. Barnes, Nora Ganim " Marketing Opportunities in the Shellfish Industry Based on Perceptions, Preferences and Practices of Consumers in New England”, Slade’s Ferry Bank Center for Business Research, the University of Massachusetts Dartmouth, Charlton College of Business, Spring 2003. Blake, Joe C. “Alternative Farming Methods.” Industry Studies – Agribusiness, The Industrial College of the Armed Forces, 2000. http://www.ndu.edu/icaf/industry/2000/agribusiness/agribusiness.htm Boehmer, Stephanie; Gold, Mary; Hauser, Stephanie; Thomas, Bill and Young, “Ann. Organic Aquaculture”, AFSIC Notes #5, USDA. January 2005. Chan, Tak-chuen T., “Study of Current Status and Potential Sustainable Development of the Aquaculture Industry in Hong Kong”, Civic Exchange, July 2005 Franz, Nicole, “GLOBEFISH”, Organic Aquaculture Production, June 2004. http://www.globefish.org/index.php?id=2181&easysitestatid=701823204 Gall, Ken and Linda O’Dierno, “ Aquaculture Marketing Survey: Consumers, Retail Stores, and Food Service in New York and New Jersey’, Northeastern Regional Aquaculture Center 1992. Gross, Tania. “Consumer Attitudes towards Farmed Seafood”, Seafish Research and Information, April 2001. Nutrition Business Journal, “The U.S. Organic Food Industry”, March 2004. . Robertson, Roberta A., Carlsen, Erika L., Lindsay and Bruce E. ‘Taste Test: Summary Report. University of New Hampshire Sea Grant College Program. 1999. NHU-S-99-001 Seafood Choices Alliance, “The Marketplace for Sustainable Seafood: Growing Appetites and Shrinking Seas”, June 2003. http://www.seafoodchoices.com/pdf/SCA_report_final.pdf Whole Foods Market. Frequently Asked Questions. August 2002 http://www.wholefoodsmarket.com/issues/org_questions.html.
32

Willer, Helga and Yussefi, Minou, “The World of Organic Agriculture - Statistics and Emerging Trends – 2004”, International Federation of Organic Agriculture Movements, 2004. ISBN 3-934055-33-8. 7. Bibliography DiPietro, Ben“The Public Opinion of Organic Fish”, IntraFish 2, no. 8 (August 2004): 8. Full-text online: Http://www/intrafish.com/pdf/download/6a2daf07c3abc 1068e430b217b62e/2004/8/08.pdf DiPietro, Ben “Organic Tilapia: Will it Sell?” IntraFish 2, no. 7 (July 2004): 10-12. Biling-Hwan Lin, Jayachandran N. Variyam, Jane Allshouse, and John Cromartie,”Food and Agricultural Commodity Consumption in the United States: Looking ahead to 2020”, Agricultural Economic Report, no. AER820. Washington, DC: U.S. Department of Agriculture, Economic Research Service, February 2003. Charles, E. and P. Paquotte, “Product Differentiation, Labeling and Quality Approach: Developments and Stakes in the French Shellfish Market”, Aquaculture Economics and Management 3, no. 2 (Aug 1999): 121-129. Cherry, Drew “Swiss Retailer Begs for More Organic Seafood”, IntraFish 2, no. 4 (April 2004): 4. Cho, G.K. and J.W. Heath, “Market Assessment for Organic Salmon in British Columbia,” Proceedings of the 14th IFOAM organic World Congress, “Cultivating Communities, August 21 – 24, 2002, Victoria Conference Centre, Canada, compiled by Robert Thompson. Ottowa, Canada: Canadian Organic Growers, 2002. 130. Dimitri, Carolyn,Catherine Greene, and U.S. Department of Agriculture, Economic Research Service, “Recent Growth patterns in the U.S. Organic Foods Market”, Agriculture Information Bulletin, no. 777. Washington, DC: U.S. Department of Agriculture, Economic Research Service, September 2002. Full-text online:http://www.ers.usda.gov. Franz, Nicole and Food and Agriculture Organization (FAO) of the United Nations, “Organic Aquaculture Production”, Fisheries Industry Division. June 2004. Full-text online: http://www.globefish.org Franz, Nicole and Food and Agriculture Organization (FAO) of the United Nations, “Organic Aquaculture Production”, Fisheries Industry division. May 2004. Full-text online: http://www.globefish.org
33

Goldburg , Rebecca J. “Comments of Rebecca Goldburg, PH.D, Concerning Organic Certification of Aquaculture Products Presented to the National Organic Standards Board”, National Organic Standards Board Meeting, June 8-10, 1999, Washington, DC, and environmental Defense fund June 8, 1999. Full-text online: http://www.ams.usda.gov/nosb/archives/minutes/June 99 attachments/12.pdf Handley, S., “Organic Oyster Production: a Marketing Opportunity for New Zealand?” Aquaculture Update (NIWA) 27, no. ½ (Summer 2000): 1-2. Harvey, David J “Aquaculture Outlook”, Semi-Annual Publication. Full-text online: http://usda.mannlib.cornell.edu/reports/erssor/livestock/ldp-aqs/ (accessed Dec. 15, 2004.) Johnston, R.J., Cathy R. Wessells, H. Donath, and F. Asche, “Measuring Consumer Preferences for Ecolabeled Seafood: an International Comparison,” Journal of Agricultural and Resource Economics 26, no. 1 (2001): 20-39. Lockwood, G. S. “Organic Aquaculture-Are There Interested Growers?” Aquaculture Magazine 27, no 3 (May/June 2001) Lockwood, G.S., “Organic Fish: a Major Market Opportunity”, Aquaculture Magazine 26, no.6 (November-December 2001): 24-28. Mansfield, B., “From Catfish to Organic fish: Making Distinctions about Nature as Cultural Economic Practice,” Geoforum 34, no. 3 (2003): 329-342. Maunder, R., B. Kennard, and D. McCrea, “Organic Meat and Fish: Production, Processing and Marketing”, Handbook of Organic Food Processing and Production, edited by S. Wright. 2nd ed. Oxford, UK: Blackwell Science, 2000. pp. 92-105. Mayk, Lauren. “Demand Pushes Organic Foods into the Mainstream,” Herald Tribune, April 28, 2003. McGovern, Dan, “Growing Organic Seafood Sales,” IntraFish 2, no. 5 (August 1997): 14, 16-19. Myrland, O. and H.W. Kinnucan, “Direct and Indirect Effects of Generic Advertising: A Model with Application to Salmon”, Aquaculture Economics and Management 5, no. 5/6 (2001): 273-288. Naturland “Aquaculture”, edition.V. Full-text online:http://www.naturland.de/englisch/n4/ seite4_5.html (accessed Dec.15, 2004).
34
Organic Farming Research Foundation, “Frequently Asked Questions about Organic Farming”. Full-text online:http://www.ofrf.org/general/about_organic/ Schettler, Renee and Drica Marcus, “Organic Isn’t Always Best Label for Salmon”, Newsday.Com, April 13, 2004. Full-text online:http://www.organicconsumers.org/Toxic/organic-salmon.cfm Seafood International 18, no. 2, “French Trout Certified Organic”, (2003):7 Scheel, Joan “Market Trends: The Health of Organic Foods,” Prepared Foods (May 2003). Staniford, D., “Organically Farmed Salmon is an Oxymoron”, The Organic Standard 3 (July 2001): 14. Stern, M. “Organic Seafood – Gaining Prominence in Europe”, INFOFISH International 2 (2002): 8-11. Sutherland, R.M., “Organic Salmon Production: a Preliminary Analysis of the Economics”, Aquaculture Economics and Management 5, no. ¾ (2001: 191-210. Teisl, M.F., B. Roe, and R.L. Hicks, “Can Eco-Labels Tune a Market? Evidence from Dolphin-Safe Labeling”, Journal of Environmental Economics and Management 43, no. 3 (2002): 339-359. Tournay, Bernadette, “Farms Go Organic”, Fish Farming International 29, no 9 (2002): 10. U.S. Department of Agriculture, “Briefing Room: Organic Farming and Marketing”, Economic Research Service. Updated April 22, 2004. Full-text online:http://www.ers.usda.gov/Briefting/Organic/index.htm Wessells, Cathy R. and D. Holland, “Predicating Consumer Choices for Farmed and Wild Salmon”, Aquaculture Economics and Management 2, no. 2 (1998) 48-59. Wessells, Cathy R. “Ecolabeling and International Seafood Trade: The Roles of Certification Costs and Consumers’ Willingness to Pay”, Fisheries Economics Newsletter 50 (2000): 44-49. Wessells, Cathy R. R.J. Johnston, and H. Donath, “Assessing Consumer Preferences for Ecolabeled Seafood: the Influence of Species, Certifier, and Household Attributes”,. Proceedings From the annual Meeting of the American Agricultural Economics Association, Nashville, Tennessee, 8-11 August 1999 81, American Journal of Agricultural Economics no 5 (1999): 1084-1089.
35

8. Focus Group Questionnaire
36

37
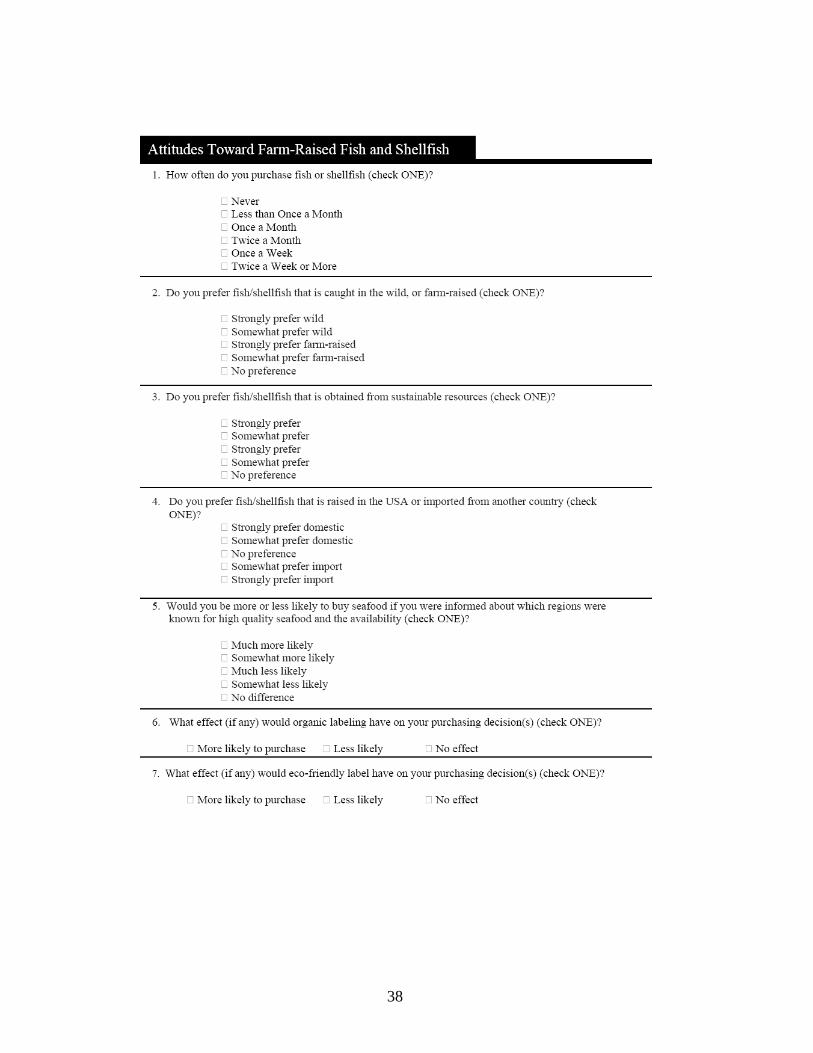
38

39

Rutgers Cooperative Extension
Department of Agricultural, Food and Resource Economics N.J. Agricultural Experiment Station
Rutgers, The State University of New Jersey, New Brunswick
and
New Jersey Department of Agriculture Fish & Seafood Program
© Rutgers, The State University of New Jersey, an equal opportunity, affirmative action institution.