Embed Size (px)
Citation preview

Biotechnology Explorer™ explorer.bio-rad.com
IDEA KitInquiry Dye Electrophoresis Activity
Instruction Manual
Catalog #166-5075EDU
Duplication of any part of this document is permitted for classroom use only.Please visit explorer.bio-rad.com to access our selection of language translations for Biotechnology Explorer™ kit curricula.
For technical service call your local Bio-Rad office, or in the US, call 1-800-424-6723


Dear Educator,
What does electrophoresis mean to students? The concept of separating materials into their constituent parts may not seem relevant or important to them. But we live in a world where we are constantly mixing and separating materials to our liking or to fit a need. When the question of “How do I make A and B from AB” comes up, what do you do? For example, separating an egg can be done by gently moving the yolk back and forth in its shell halves over a bowl to catch the whites. There are also tools that allow you to crack your egg over a sieve that lets the whites strain through holes too small for the intact yolk. This is a simple separation but necessary to achieve certain culinary products (meringue, crème anglaise). In the wider world, materials are constantly being mixed and separated to develop specific products:
• Crude oil is separated into various grades, which then serve as the basis for automobile gasoline, aviation fuel, or the raw materials for plastics and chemicals. Those raw materials are then converted into their final products by blending them with other elements
• Pharmaceutical ingredients are highly purified by various separation techniques and then blended together with an extraordinary degree of homogeneity to ensure patient safety and precise dosages
• Packaged foods undergo intense product development to integrate a series of separate parts into the most appealing texture, flavor, smell, and look
In bioscience research, electrophoresis is a core separation technique for studying nucleic acids and proteins. How do we introduce the concept and make it engaging and relevant to students?
Food for Thought
There is growing public awareness about nutritional information on food labels as we consider the fats, sugars, and salt we ingest more carefully. But have you ever looked to see what food dyes are in your food? The appearance of food is a major component of our perception of it as desirable or not. Which is more appealing to you, a nice green M&M or one that has had its candy coating removed?
In this lab your students will have the opportunity to deconstruct ways candy has been manipulated to make it more visually appealing. They can investigate the nature of food dyes, discover some of their chemical properties, and think critically about their use — all while learning how to use gel electrophoresis to separate the dyes from other ingredients. Students can put their thinking caps on to figure out how the coloring on their candies (or other food items) behaves compared to reference dyes. This core biotechnology process and its complementary skills are critical to research, so introducing these concepts in a fun and relevant way can help engage students early and connect science with the real world.
If you’d like to expand on the concept of engineering tools to separate materials, you may wish to explore our STEM Electrophoresis Kit (catalog #166-5080EDU, 166-5090EDU), which gives students the tools and knowledge to build their own gel electrophoresis chamber to separate the food dyes they’ve extracted.
This curriculum was developed in collaboration with Dr. Kristi DeCourcy at the Fralin Biotechnology Center in Virginia. We would like to thank Dr. DeCourcy for her invaluable guidance and contribution to this curriculum.
Biotechnology Explorer TeamBio-Rad Laboratories6000 James Watson DriveHercules, CA [email protected]

Create context. Reinforce learning. Stay current.New scientific discoveries and technologiescreate more content for you to teach,but not more time. BiotechnologyExplorer kits help you teach moreeffectively by integrating multiplecore content subjects into a single lab. Connect conceptswith techniques and put them into context with real-world scenarios.
Inquiry Dye
Electrophoresis Acitivity Kit
Chemistry of Life
Genetics
Evolution
Cell and Molecular Biology
Environmentaland Health
Science
ScientificInquiry
• Coupled reactions and free energy changes
• Chemical properties of molecules
• Buffers, solubility and pH
Food allergies
• Role, place, limits and possibilities of science and technology
• Nutrition• Populations, ecosystems
and human impacts• Biodiversity
Gel electrophoresis
• Use of sophisticated laboratory techniques
• Evaluation of hypothesis• Interpretation of
experimental results• Independent student
research projects
Perception of color

Table of Contents
Page
Kit Summary . . . . . . . . . . . . . . . . . . . . . . . . . . . . . . . . . . . . . . . . . . . . . . . . . . . . . . . . . . . . . . . . . . . . . 1
Kit Inventory Checklist . . . . . . . . . . . . . . . . . . . . . . . . . . . . . . . . . . . . . . . . . . . . . . . . . . . . . . . . . . 2
Background for Instructors . . . . . . . . . . . . . . . . . . . . . . . . . . . . . . . . . . . . . . . . . . . . . . . . . . . . . . . . . . 4
Experimental Design . . . . . . . . . . . . . . . . . . . . . . . . . . . . . . . . . . . . . . . . . . . . . . . . . . . . . . . . . . . . . . . 7
Electrophoresis . . . . . . . . . . . . . . . . . . . . . . . . . . . . . . . . . . . . . . . . . . . . . . . . . . . . . . . . . . . . . . . . 8
Typical Classroom Results . . . . . . . . . . . . . . . . . . . . . . . . . . . . . . . . . . . . . . . . . . . . . . . . . . . . . . . 9
Recommended Candies . . . . . . . . . . . . . . . . . . . . . . . . . . . . . . . . . . . . . . . . . . . . . . . . . . . . . . . . . 9
Frequently Asked Questions . . . . . . . . . . . . . . . . . . . . . . . . . . . . . . . . . . . . . . . . . . . . . . . . . . . . . . . . 10
Instructor’s Advance Preparation. . . . . . . . . . . . . . . . . . . . . . . . . . . . . . . . . . . . . . . . . . . . . . . . . . . . . 11
Workstation Checklist for Dye Extraction From Candies . . . . . . . . . . . . . . . . . . . . . . . . . . . . . . . . 11
Workstation Checklist for Agarose Gel Electrophoresis. . . . . . . . . . . . . . . . . . . . . . . . . . . . . . . . . 12
1x TAE Electrophoresis Buffer Preparation . . . . . . . . . . . . . . . . . . . . . . . . . . . . . . . . . . . . . . . . . . 13
Agarose Preparation . . . . . . . . . . . . . . . . . . . . . . . . . . . . . . . . . . . . . . . . . . . . . . . . . . . . . . . . . . . 13
Procedure for Casting Gels. . . . . . . . . . . . . . . . . . . . . . . . . . . . . . . . . . . . . . . . . . . . . . . . . . . . . . 14
Student Manual . . . . . . . . . . . . . . . . . . . . . . . . . . . . . . . . . . . . . . . . . . . . . . . . . . . . . . . . . . . . . . . . . . 18 Dye Extraction from Candies . . . . . . . . . . . . . . . . . . . . . . . . . . . . . . . . . . . . . . . . . . . . . . . . . . . . 20
Agarose Gel Electrophoresis. . . . . . . . . . . . . . . . . . . . . . . . . . . . . . . . . . . . . . . . . . . . . . . . . . . . . 21
Focus Questions . . . . . . . . . . . . . . . . . . . . . . . . . . . . . . . . . . . . . . . . . . . . . . . . . . . . . . . . . . . . . . . . . 23
Appendix A: Extension Activities . . . . . . . . . . . . . . . . . . . . . . . . . . . . . . . . . . . . . . . . . . . . . . . . . . . 25
Appendix B: Glossary of Terms . . . . . . . . . . . . . . . . . . . . . . . . . . . . . . . . . . . . . . . . . . . . . . . . . . . . 27
Appendix C: Instructor’s Answer Guide. . . . . . . . . . . . . . . . . . . . . . . . . . . . . . . . . . . . . . . . . . . . . . 28
Appendix D: References and Additional Resources. . . . . . . . . . . . . . . . . . . . . . . . . . . . . . . . . . . . 30

1
Kit SummaryDyes are added to many of the foods we eat and beverages we drink. The dyes that are used by the food industry can be any one or a combination of the seven FD&C dyes approved by the United States Food and Drug Administration (FDA) or natural dyes that are not regulated. In this experiment, food dyes will be extracted from candies then analyzed using agarose gel electrophoresis. Four reference dyes are provided in the kit to be run on the gel with the student-prepared samples. This laboratory exercise is an excellent way to introduce students to such basic techniques as pipetting, pouring gels, and running gel electrophoresis. It also provides opportunities for student inquiry into dyes present in everyday foods.
Timeline 1: Instructor prepares agarose gels or precast gels are used.
Pre-lab activities Discussion of electrophoresisDiscussion of food dyes and their uses
1–2 class periods
Teacher’s advance preparation
Preparing agarose gels 1 hr
Activity 1 Extraction of dyes from candy 15 min in lab
Activity 2 Agarose gel electrophoresis 30 min in lab
Post-lab activity Discussion of results 1–2 class periods
Timeline 2: Students prepare agarose gels.
Pre-lab activities Discussion of electrophoresisDiscussion of food dyes and their uses
1–2 class periods
Activity 1 Preparing agarose gels 30 min in lab
Activity 2* Extraction of dyes from candy 15 min in lab
Activity 3 Agarose gel electrophoresis 30 min in lab
Post-lab activity Discussion of results 1–2 class periods
*Extraction of dyes from candy (Activity 2) can be completed in the same class period while the agarose gel is solidifying (Activity 1).
Lesson Extensions
Appendix A
• Paper chromatography of food dyes• Spectroscopic analysis of food dyes• Do food dyes affect perception of taste?
Storage InstructionsAll stock reagents are stable at room temperature.

2
Kit Inventory ChecklistThis section lists the components provided in the IDEA kit – Inquiry Dye Electrophoresis Activity. It also lists the required accessories. Each kit is sufficient to outfit eight complete student workstations (four students per workstation). As soon as your kit arrives, open it and check off the listed components to familiarize yourself with the kit.
Kit Components Quantity ()Store at room temperature
Dye extraction solution, 25 ml 1 bottle
Blue 1 reference dye, 150 µl 1 vial
Yellow 5 reference dye, 150 µl 1 vial
Yellow 6 reference dye, 150 µl 1 vial
Red 40 reference dye, 150 µl 1 vial
Electrophoresis buffer, 50x TAE, 100 ml 1 bottle
Molecular biology grade agarose, 5 g 1 bottle
2 ml microcentrifuge tubes 72 tubes
Required Accessories (Not Included) Quantity ()2–20 µl adjustable-volume micropipet (catalog #166-0551EDU or 166-0506EDU)
or 10 µl fixed-volume micropipet (catalog #166-0512EDU) 8
2–200 µl pipet tips, 1,000/bag (catalog #223-9035EDU) 1 bag Mini-Sub® Cell GT electrophoresis chamber with 7 x 10 cm gel tray, two 8-well combs
(catalog #166-4000EDU) 8
Eyedroppers 8 PowerPac™ Mini power supply (catalog #165-5048EDU), or
PowerPac Basic power supply (catalog #164-5050EDU) 2–8
Permanent markers 8
Plastic cups or small beakers 32
Microwave oven or hot plate 1
Distilled water 3 liters
500 ml Erlenmeyer flask for microwaving agarose 1
Laboratory tape 1
Candies with a variety of color coatings variable Balance 1
Optional Accessories Quantity per Kit ()
Microcentrifuge (catalog #166-0602EDU)
or Mini Centrifuge (catalog #166-0603EDU) 1 ReadyAgarose™ Precast Mini Gels, TAE, 7 x 10 cm
1%, 1 x 8-well (catalog #161-3015EDU) 8

3
Optional Accessories (cont.) Quantity per Kit ()
100–1,000 µl adjustable-volume micropipet
(catalog #166-0553EDU or 166-0508EDU) 8 or disposable plastic transfer pipettes (DPTPs)
(catalog #166-0480EDU) 1 box
100–1,000 µl pipet tips* (catalog #223-9350EDU) 1 bag
Microcentrifuge tube racks (catalog #166-0481EDU) 8
Digital camera for imaging gels 1
* Not needed if using DPTPs or eyedroppers instead of 100–1,000 µl adjustable-volume micropipets
Refills Available SeparatelyIDEA Kit Reagent Refill Pack, catalog #166-5076EDU (includes Blue 1 reference dye, Yellow 5
reference dye, Yellow 6 reference dye, Red 40 reference dye, dye extraction solution, and 72 microcentrifuge tubes)
IDEA Kit Starter Pack, catalog #166-5077EDU (includes Blue 1 reference dye, Yellow 5 reference dye, Yellow 6 reference dye, Red 40 reference dye, dye extraction solution, 72 microcentrifuge tubes, agarose, TAE, eight 10 µl fixed volume pipets, 1 bag of 20–200 µl pipet tips (qty 1,000), and IDEA instruction manual)
Molecular biology agarose, 5 g, catalog #161-3116EDU
Molecular biology agarose, 25 g, catalog #161-3100EDU
Electrophoresis buffer, 50x TAE, 100 ml, catalog #166-0742EDU
Electrophoresis buffer, 50x TAE, 1 L, catalog #166-0743EDU
STEM Electrophoresis Engineering Module, catalog #166-5085EDU (2 workstations; includes one hinged plastic box, 2 pairs of leads, 4 paper clips, and 2 combs)
STEM Electrophoresis Demo Kit, catalog #166-5080EDU (includes Blue 1 reference dye, Yellow 5 reference dye, Yellow 6 reference dye, Red 40 reference dye, dye extraction solution, 72 microcentrifuge tubes, agarose, TAE, one plastic hinged box, 2 pairs of leads, 4 paper clips, 2 combs, and STEM instruction manual)
STEM Electrophoresis Classroom Kit, catalog #166-5090EDU (includes Blue 1 reference dye, Yellow 5 reference dye, Yellow 6 reference dye, Red 40 reference dye, dye extraction solution, 72 microcentrifuge tubes, agarose, TAE, four plastic hinged boxes, 8 pairs of leads, 16 paper clips, 8 combs, and STEM instruction manual)
STEM Electrophoresis Starter Pack, catalog #166-5095EDU (includes Blue 1 reference dye, Yellow 5reference dye, Yellow 6 reference dye, Red 40 reference dye, dye extraction solution, 72 microcentrifuge tubes, agarose, TAE, eight 10 µl fixed volume pipets, 1 bag of 20–200 µl pipet tips (qty 1,000), four plastic hinged boxes, 8 pairs of leads, 16 paper clips, 8 combs, and STEM instruction manual)

4
Background for InstructorsFood DyesHow often do you look at nutrition labels for the food and drinks that you consume? The next time you open a bottle of soda or a pack of candy, look at the list of ingredients and do not be surprised if you see “FD&C” followed by a color and a number. This means that what you are about to eat contains one or more of the color additives approved by the U.S. Federal Food, Drug, and Cosmetic Act (FD&C) for use in food.
Why Do We Dye Our Food?
How do consumers choose food? There are a variety of factors to consider when buying food, including price, nutritional data, sell-by date, and ingredients, but one of the first considerations is appearance. For many foods, it’s all about packaging, but for others it is the appearance of the actual food that is important. Will you choose a head of lettuce if the leaf edges are brown or a loaf of bread with green mold on it? In these examples, the quality of the food is evaluated by its color.
In other cases, our expectation of food is determined by its color. In the 1990s, consumers, encouraged by marketing and advertisements, began equating the clarity of products with their purity, and companies began making clear versions of existing products such as soft drinks. The products did not sell well — the public wanted caramel colored Coke and Pepsi. The lack of coloring affected consumer perception of the taste of the food.
The primary reasons foods are artificially colored are perception and expectation of the consumer. When you eat a purple-colored candy, you don’t expect lemon flavor, you expect to taste grape. Our previous experiences lead us to expect margarine to be yellow, pickles to be green, and maraschino cherries to be red, but those colors are usually provided or enhanced by coloring agents (ß-carotene, FD&C Yellow 5, and FD&C Red 40 for margarine, pickles, and cherries, respectively).
HistoryFood dye agents have been around for a long time. References to adding coloring agents to food can be found in literature dating back thousands of years. Many colors were available from natural sources, such as yellow from saffron or egg yolks, red from huckleberries or beet juice, and green from spinach juice or parsley. Other colors were obtained by adding inorganic salts to foods, such as copper sulfate (blue), lead chromate (yellow), and mercury sulfide (red). Early consumers of purchased food had no knowledge of how the food had been prepared or what it contained, whether they were buying bread from the neighborhood baker or tea imported by the merchant across town.
In 1820, Frederick Accum published A Treatise on Adulterations of Food, and Culinary Poisons. In the preface he stated, “There is death in the pot.” The treatise listed foods and beverages and the common additives for each. For example, he found cheese and cayenne pepper colored with red lead (lead tetroxide), pickles with copper sulfate, and green tea with copper carbonate. Despite the publicity garnered by Accum’s work, food additives were largely unregulated until the 20th century.
In the U.S., the Pure Food and Drug Act of 1906 (also known as the Wiley Act, because of the work done by U.S. Department of Agriculture chemist Harvey Wiley to improve food safety) restricted the use of food additives and named seven dyes that were safe to be used in foods. Interestingly, two of these dyes are still on the approved list today.

5
Modern Food DyesIn 1856, William Perkins, an English chemist, synthesized the first organic dye from coal tar, mauveine, which produced a purple color. This was the first of many organic dyes discovered. The synthetic food dyes used today are also coal tar or petroleum derivatives. Currently, there are seven synthetic dyes approved for use in the U.S. (the FD&C colors; see Table 1), although other countries permit the use of more dyes. For example, the UK, France, and Spain allow the use of 15 dyes, six of the FD&C dyes plus nine more.
Some synthetic dyes have been removed from approved lists when they were found to be harmful, but controversy is not limited to synthetic dyes. Such natural food colors as carminic acid (red), which is used in popsicles, candies, yogurt, and other foods, are derived from the bodies of crushed insects. People who follow vegan or vegetarian diets have pushed for the presence of this dye to be indicated on the labels of products where it is used. Starbucks removed carminic acid from its Strawberry Frappucinos, upon pressure from customers, and is replacing it with a dye extracted from tomatoes. Another concern about some natural dyes is the level of purity obtained when separating the dye compound from all the other compounds that make up the source. It can be easier to separate a synthetic dye to very high purity from the five to ten different molecules used to make the dye. It can be much more difficult to separate a natural dye from all the other molecules that make up, for example, the abdomen of a beetle from which carminic acid is extracted. It also can be quite expensive to extract enough dye to color items from natural sources if a product sells worldwide in large amounts. For example, for a red candy, a large number of beets would need to be grown and processed in order to isolate as much of the dye molecule as would be obtained with a smaller amount of Red 40 dye synthesized and purified in a lab.
Synthetic food dyes come in two forms, dyes and lakes. Dyes are water-soluble. Lakes are dyes that have been combined with salts to make them insoluble. Lakes can be used to color foods containing fats. The water-soluble FD&C dyes are used in the “food colors” found at the grocery store. Some “food colors” contain single dyes and others use combinations of dyes.

6
Tab
le 1
. Fo
od
dye
s ap
pro
ved
by
the
FD
A f
or
use
in t
he U
.S.
Dye
N
ame
Als
o C
alle
dC
AS
N
umb
er1
EE
C N
umb
er2
Co
lor
in
So
lutio
nU
sed
in
Max
imum
A
bso
rban
ce3
Mo
lecu
lar
Wei
ght
Net
Cha
rge
at p
H 8
Blu
e 1
Bril
liant
Blu
e FC
F,
Aci
d B
lue
9,
Food
Blu
e 2
3844
-45-
9E
133
Brig
ht b
lue
Sof
t drin
ks, i
ce c
ream
, ca
nned
and
bak
ed p
rodu
cts,
da
iry p
rodu
cts,
can
dy
630
nm79
2.86
–2
Blu
e 2
Indi
gotin
e, In
digo
C
arm
ine,
Food
Blu
e 1
860-
22-0
E13
2D
eep
blue
Pet
food
, can
dy, b
aked
go
ods
610
nm46
6.36
–2
Gre
en 3
Fast
Gre
en F
CF,
Fo
od G
reen
323
53-4
5-9
Not
app
rove
d fo
r us
e in
the
EE
C
Brig
ht
blui
sh-g
reen
Sof
t drin
ks, c
anne
d ve
g-et
able
s, fi
sh p
rodu
cts,
bak
ed
prod
ucts
, can
dy
625
nm80
8.86
–2
Red
3E
ryth
rosi
ne,
Food
Red
14
1642
3-68
-0E
127
Brig
ht
blui
sh-r
edC
ockt
ail c
herr
ies,
pop
sicl
es,
cand
y, p
ista
chio
she
lls52
6 nm
879.
86–1
Yello
w 5
Tart
razi
ne,
Food
Yel
low
4
1834
-21-
0E
102
Brig
ht le
mon
ye
llow
Can
ned
peas
, sof
t drin
ks,
jelly
, ice
cre
am, p
ickl
es,
popc
orn,
spo
rts
drin
ks, c
orn
chip
s, c
andy
426
nm53
4.37
– 3
Yello
w 6
Sun
set Y
ello
w F
CF,
Fo
od Y
ello
w 3
2783
-94-
0E
110
Brig
ht y
ello
w
to o
rang
eS
oft d
rinks
, ice
cre
am, j
ams,
fru
it pr
oduc
ts, w
ine,
che
ese
sauc
e, in
stan
t noo
dles
, can
dy
485
nm45
2.37
– 2
Red
40
Allu
ra R
ed,
Food
Red
17
2595
6-17
-6E
129
Brig
ht re
dS
oft d
rinks
, ice
cre
am, m
eat
and
fish
prod
ucts
, des
sert
s,
cand
y
504
nm49
6.43
– 2
1 CA
S R
egis
try
num
bers
are
uni
que
num
bers
ass
igne
d to
eve
ry c
hem
ical
des
crib
ed in
the
scie
ntifi
c lit
erat
ure.
2 EE
C n
umbe
rs a
re a
ssig
ned
to th
e dy
es a
ppro
ved
for
use
in fo
od b
y th
e E
urop
ean
Eco
nom
ic C
omm
unity
.3 A
bsor
banc
e at
pH
7 w
hen
diss
olve
d in
wat
er.

7
Experimental DesignIn this experiment, students will extract the food colors from candies and analyze the dyes using agarose gel electrophoresis. The kit contains the four food dyes most commonly used in the U.S. These reference dyes will be analyzed on the gels along with the student samples. The reference dyes are:
• Blue 1
• Yellow 5
• Yellow 6
• Red 40
Structurally, these dyes are similar, all negatively charged at pH 8, with aromatic rings and sulfate groups.
N
-O3SSO3
-
N+
SO3-
NN
-OOC
NN
-O3SOH
SO3-
Blue 1 Yellow 5
-O3S
NN
HO
SO3-
SO3-
OHN
NO
SO3-
Yellow 6 Red 40
Fig. 1. Structures of the reference dyes, the four most commonly used food dyes.

8
ElectrophoresisMolecules can be separated by size using a process known as agarose gel electrophoresis. The term electrophoresis means to carry with electricity. Samples are placed in a gel matrix, which is put into a chamber filled with a conductive buffer solution. A direct current is passed between wire electrodes at each end of the chamber. All charged molecules will migrate in an electric field; negatively charged molecules will migrate toward the positive pole (anode). The matrix of the agarose gel acts as a molecular sieve through which smaller molecules can move more easily than larger ones. Therefore, the rate at which a molecule migrates through the gel is inversely proportional to its size. Over a period of time, smaller molecules will travel farther than larger ones. Molecules of the same size stay together and migrate in single bands.
There are several components of this system:
• AgaroseAgarose is a polysaccharide derived from red algae. It is the most commonly used matrix for separating molecules in horizontal gel electrophoresis. Agarose is purchased as a powder that is placed in a buffer solution and heated until it dissolves. The agarose solution is then poured into a mold and allowed to cool and solidify to form a slab gel. The solution is clear, but the gel turns cloudy or opaque as it cools and solidifies
• Gel CombA gel comb (also called a well former) is inserted into the agarose solution before it cools to make slots where the samples will be placed or “loaded.” After the agarose has solidified, the well former is removed, leaving small slots in the gel
• Electrophoresis BufferThe solution used in electrophoresis is buffered to maintain pH 8. The concentration of the buffer is also important. The buffer must contain enough ions to carry the current, but not so many that the solution generates too much heat. Tris-acetic acid-EDTA (TAE) is a commonly used electrophoresis buffer
• ElectricityPower for electrophoresis can come from a commercial power supply or from alkaline batteries. The direct current moves from the power supply to electrodes submerged in electrophoresis buffer at either end of the gel box. The current is carried by the ions in the buffer and gel; if they’re negatively charged, they’ll move from negative electrode to positive electrode
• Percentage of AgaroseThe gel acts as a molecular sieve to separate molecules by size, and the sizes of the molecules that will be separated by the gel depend on the amount (percentage) of agarose in the gel. For example, high concentrations of agarose are used to separate small molecules and low concentrations to separate larger molecules

9
Typical Classroom ResultsThe gel below represent a typical classroom result. It is a 1% agarose gel run at 100 V for 15 min in 1x TAE buffer.
Fig. 2. Electrophoretic separation of standard dyes and color coatings extracted from standard U.S.-manufactured candies.
Recommended CandiesThe candies that worked best in testing were candies with hard-shell color coatings such as M&M’S and Skittles. The brighter the color, the better the results. Candies with light pastel colors, such as some jelly beans, do not work as well. In order to get strong bands, more than one piece of candy can be used. For candies such as plain M&M’S and Skittles, extracting the dye from two candy pieces of the same color is enough to produce bright bands. For smaller candies such as Red Hots, four or five candy pieces might be needed. Some recommended candies are listed in Table 2. Alternatively, students can experiment using candies that have not been tested.
Table 2. Recommended candies and products.
Best Results Acceptable Results Too Faint to See
M&M’S (regular or peanut) Mike and Ikes Gummy bears
Skittles Jelly beans Jujyfruits
Kool-Aid drink mixes Gum balls Peeps
Jawbreakers Jolly Ranchers
Red Hots
Hot Tamales
Runts
Reese’s Pieces
Lane Sample1 10 µl blue 1 reference dye2 10 µl yellow 5 reference dye3 10 µl yellow 6 reference dye4 10 µl red 40 reference dye5 10 µl green Skittle 6 10 µl orange M&M7 10 µl Hot Tamale8 10 µl brown M&M

10
Frequently Asked Questions1. I don’t have commercial electrophoresis equipment. Is it still possible to teach electrophoresis in
my classroom?
Yes. Bio-Rad also sells a STEM Electrophoresis Engineering Module (catalog #166-5085EDU) that allows students to build their own basic electrophoresis apparatus. This system uses 9-volt batteries as the power supply. While this home-built system cannot product enough voltage to separate DNA molecules, it works quite well with the small molecular weight dyes in the IDEA — Inquiry Dye Electrophoresis Activity kit.
2. My students saw color bands that do not match any of the four standards. What might those be?
In the U.S., the FDA currently approves seven dyes as food color additives. We have included the four most commonly used dyes as references in this kit. The other three FD&C dyes used are Blue 2, Green 3, and Red 3. Check the ingredients list from the sample to see if these dyes are present. Alternately, a natural food color could be on the list, such as ß-carotene or carmine. Researching natural food colors is a good extension activity for this experiment.
3. My students used a sample that contained both FD&C Red 40 and Yellow 6, but they saw only a single band on their gel. Why didn’t the colors separate?
Red 40 and Yellow 6 cannot be separated using 1% agarose gel electrophoresis because they are too alike in charge and molecular weight. The mass-to-charge ratio of molecules determines their rate of migration in electrophoresis. Both Red 40 and Yellow 6 have a charge of –2 (see Table 1) and they are similar in molecular weight, so their mass-to-charge ratio is too close for them to separate on the gel. The same is true for Red 40 and Blue 2 (purple Skittles).
4. My students used a sample that contained a dye that is not on the FD&C list, and the dye migrated toward the negative electrode. Why did this happen?
Many candies manufactured outside of the U.S. do not contain any of the FD&C dyes. Instead, they contain synthetic and natural dyes approved for use in their country of origin. Also, some U.S.-made candies use natural dyes. These other dyes may have either a positive or a negative charge, or they may be uncharged (neutral). Hence, they could migrate toward either the cathode or anode, or, if the dye is neutral, not migrate at all. Determining the charge of these dyes is an excellent inquiry experiment for students.
5. The list of ingredients has both Blue 1 and Blue 1 Lake. What is the difference?
The FD&C dyes are prepared in two forms: water-soluble and insoluble. When the water-soluble forms of the dyes are reacted with aluminum hydroxide, the reaction products are insoluble and are known as lakes or lake dyes or pigments. As food ingredients, they may be listed either as lakes or as aluminum lakes. Since lakes don’t dissolve in 1x TAE buffer or dye extraction solution, they will not migrate during electrophoresis.
6. Are there extension activities that I can do with this laboratory?
Potential extensions to this laboratory include paper chromatography of food dyes, spectroscopic analysis of food dyes, and taste tests. Refer to Appendix A for more information.
7. How long will the bands be visible after running?
The molecules are fairly small and diffuse quickly so images should be taken within 30 minutes of completion of the run.

11
Instructor’s Advance PreparationThis section outlines the recommended schedule for advance preparation on the part of the instructor.Advance preparation details follow on pages 13–17.
Activity When Time required
Read manual Immediately 1 hour
Prepare the molten agarose Prior to Activity 2 15 min
Prepare the casting trays and pour agarose gels*
Prior to or during Activity 2 15–45 min
Aliquot dye extraction solution Prior to Activity 1 15 min
Aliquot reference dyes Prior to Activity 2 30 min
Set up workstations The day of student labs 10 minutes/day
* These steps can be performed ahead of time by the educator or during a laboratory period by the students.
Workstation ChecklistStudent Workstations. Materials and supplies that should be present at each student workstation prior to beginning each laboratory experiment are listed below. The components provided in this kit are sufficient for eight student workstations (we recommend two to four students per workstation).
Teacher’s (Common) Workstation. A list of materials, supplies, and equipment that should be present at a common location, which can be accessed by all student groups, is also listed below. It is up to the discretion of the teacher whether students should access common buffer solutions and equipment, or whether the teacher should aliquot solutions and operate equipment.
Activity 1 Dye Extraction From CandiesStudent Workstation
Material Quantity ()
Dye extraction solution 2 ml
2 ml microcentrifuge tubes 4 Microcentrifuge tube racks 1
Marking pen 1
Plastic cups or small beakers 4
Eyedropper 1
Colored candies* 4 varieties
*Candy example: 3 green Skittles, 3 orange jelly beans, 4 Red Hots, 1 brown gumball.

12
Activity 2 Agarose Gel ElectrophoresisStudent Workstation
Material Quantity ()
Agarose gel electrophoresis system 1 Agarose gel 1 Power supply 1 1x TAE buffer 275 ml Blue 1 reference dye 15 µl Yellow 5 reference dye 15 µl Yellow 6 reference dye 15 µl Red 40 reference dye 15 µl Dyes extracted from candies from Activity 1 4 samples 20–200 µl adjustable-volume micropipet
or 10 µl fixed-volume pipet and 8 tips 1 Marking pen 1
Common Workstation
Material Quantity ()
Gel documentation system (optional) 1 Microcentrifuge or mini centrifuge (optional) 1
Protective eye goggles should be worn in the laboratory at all times.
Proper safety precautions, such as no eating or drinking, should always be practiced.

13
Activity 1 Prepare the molten agarose, and pour the agarose gels
Advance PreparationObjectives: Prepare the molten agarose
Pour agarose gels to prepare for activity 2 If you prefer to have your students pour their own gels during the lab, prepare the molten agarose ahead of time. If prepared in advance, molten agarose should be kept in a water bath set at 50–55°C until gels are pouredSet up student and instructor workstations
Prepare agarose gels.* The recommended agarose concentration for gels in this classroom application is 1%. This concentration of agarose provides good resolution and minimizes run time required for electrophoretic separation of the dyes. The recommended thickness for the gels for easy sample loading and gel handling is 0.75–1.0 cm. Be sure to use 1x TAE electrophoresis buffer, not water, to prepare agarose gels.
1. 1x TAE electrophoresis buffer preparation TAE (Tris-acetate-EDTA) electrophoresis buffer is provided as a 50x concentrated solution. In addition to the 1x TAE buffer needed to prepare the agarose gels, approximately 275 ml is also required for each electrophoresis chamber. Three liters of 1x TAE buffer will be sufficient to run eight electrophoresis chambers and prepare eight agarose gels. To make 3 L of 1x TAE buffer from 50x TAE concentrate, add 60 ml of 50x concentrate to 2.94 L of distilled water and mix thoroughly.
2. Agarose preparation These procedures may be carried out one to two days ahead of time by the teacher or done during class by the individual student teams.
i. To make a 1% agarose solution, add 1 g of agarose per 100 ml of 1x TAE electrophoresis buffer. Be sure to use 1x TAE electrophoresis buffer, not water.
Use this guide for gel volume requirements when casting single or multiple gels.
Volume of 1% agarose needed for:
Number of gels 7 x 10 cm tray 1 50 ml 2 100 ml 4 200 ml 8 400 ml
ii. Add the agarose powder to a suitable container with plenty of extra room (for example, use a 500 ml Erlenmeyer flask for 200 ml or less). Add the appropriate amount of 1x TAE electrophoresis buffer. If clumps of agarose are visible, swirl the flask to mix.
iii. While heating the solution, some of the volume will be lost to evaporation. Prior to heating, mark the volume level on the flask or weigh the flask plus contents and record the weight.
iv. Dissolve the agarose by heating in a microwave oven. If a microwave is not available, the solution can be heated on a magnetic hot plate.
Caution: Always wear protective gloves, goggles, and lab coat while preparing and casting agarose gels. Molten agarose or the flasks containing hot agarose can cause severe burns if allowed to contact skin.

14
a. Microwave oven methodThis technique is the fastest and safest way to dissolve agarose. Place the gel solution in an appropriate bottle or flask into the microwave. If you are using a bottle, be sure to loosen the cap before heating. The ideal microwave setting will depend on the volume of agarose solution that you are preparing and on the power of the microwave oven. For small volumes, microwave the solution for 1 min, swirl the solution, then microwave in 20–30 sec intervals, swirling after each interval, until all of the small transparent agarose particles are dissolved. For larger volumes (e.g. 400 ml), heat initially for 2–3 min, swirl the solution, then microwave in 30–45 sec intervals, swirling after each interval, until all of the small transparent agarose particles are dissolved.
Add water to the agarose solution to bring it back to the original volume and swirl to mix completely. Allow the agarose solution to cool to 55–60˚C before pouring gels. Make sure to swirl the agarose solution to mix it thoroughly immediately before the gels are poured.
b. Magnetic hot plate method Add a stir bar to the undissolved agarose solution. Heat the solution to boiling while stirring on a magnetic hot plate. Boil the solution until all of the small transparent agarose particles are dissolved.
Add water to the agarose solution to bring it back to the original volume and swirl to mix completely. Allow the agarose solution to cool to 55–60˚C before pouring gels. Make sure to mix the agarose solution thoroughly by swirling or stirring on the magnetic hot plate immediately before the gels are poured.
* Convenient precast agarose gels (catalog #161-3015EDU) are available from Bio-Rad. These are 1 x 8-well, 1% TAE gels and fit into Bio-Rad’s Mini-Sub® Cell GT cells.
3. Procedure for casting gelsThis laboratory activity requires that each gel have at least eight wells. Follow the instructions above to prepare the agarose and to determine what volume of 1% agarose will be needed for your class(es). Pour enough agarose to cover the gel comb teeth or to make a gel with a depth of 0.75–1.0 cm. Do not move or handle the gel tray until the gel has solidified. Solidified gels can be stored in sealable bags at room temperature for 1 day or in the refrigerator for up to 1 week before use. If possible, pour one or two extra gels for backup.
Alternatively, students can prepare and pour their own gels. The time needed for an entire class to pour gels is approximately 30 minutes. If gels are being stored after preparation, have students label their plastic bags with their names.
This section outlines the tape-the-tray method for casting gels. Other methods are detailed in the Mini-Sub cell GT cell (electrophoresis chamber) instruction manual.
i. Seal the ends of the tray securely with strips of laboratory tape. Press the tape firmly to the edges of the gel tray to form a fluid-tight seal.

15
ii. Level the gel tray on a leveling table or workbench using the leveling bubble provided with the chamber.
iii. Prepare the desired concentration and amount of agarose in 1x TAE electrophoresis buffer.
iv. Place the comb in the appropriate slot of the gel tray. Gel combs should be placed in the slot nearest the end of the casting tray. The comb will form the wells into which the samples will be loaded.
v. Cool the agarose to at least 60˚C before pouring.
vi. Pour the agarose solution into the gel tray until it covers the gel comb teeth or until the gel is 0.75–1.0 cm thick.
vii. Allow the gel to solidify at room temperature for 10 to 20 min. It will appear cloudy or opaque when ready to use.
viii. Carefully remove the comb from the solidified gel by pulling gently in an upward direction.

16
ix. Remove the tape from the edges of the gel tray.
You now have two options:
Option 1: If you do not have sufficient time to proceed to electrophoresis, store the gels in a sealable plastic bag with 1–2 ml of 1x TAE buffer at room temperature for 1 day, or store in the refrigerator (4°C) for up to 1 week before using them. Have your students label their plastic bags.
Option 2: If there is sufficient time to proceed to electrophoresis, place the tray onto the leveled electrophoresis chamber so that the sample wells are at the black (cathode) end of the chamber.
Activity 2 Dye Extraction From Candies
Advance Preparation
Objectives: Aliquot dye extraction solution Set up student and instructor workstations
Material Needed for Advance Preparation QuantityDye extraction solution 25 ml2 ml microcentrifuge tubes 8Marking pen 1100–1,000 µl adjustable-volume micropipet and tips or DPTPs 1Colored candies*
*Candy example: 3 green skittles, 3 green orange jelly beans, 4 Red Hots, 1 brown gumball
Procedure (estimated time: 15 min)
1. Aliquot dye extraction solutionLabel eight clean 2 ml microcentrifuge tubes Extraction and aliquot 2 ml of dye extraction solution into each tube.

17
Activity 3 Agarose Gel Electrophoresis
Advance Preparation
Objectives: Aliquot reference dyesSet up student and instructor workstations
Material Needed for Advance Preparation QuantityBlue 1 reference dye 150 µlYellow 5 reference dye 150 µlYellow 6 reference dye 150 µlRed 40 reference dye 150 µl2 ml microcentrifuge tubes 322–20 µl adjustable-volume micropipet and tips 1 Marking pen 1Mini centrifuge or microcentrifuge 1
Procedure (Estimated time: 30 min)
1. If you have a centrifuge, pulse spin the reference dyes to pool the solutions at the bottom of the tubes.
2. Aliquot Blue 1 reference dye Label eight clean 2 ml microcentrifuge tubes Blue 1 and aliquot 15 µl of Blue 1 reference dye into each tube.
3. Aliquot Yellow 5 reference dye Label eight clean 2 ml microcentrifuge tubes Yellow 5 and aliquot 15 µl of Yellow 5 reference dye into each tube.
4. Aliquot Yellow 6 reference dye Label eight 2 ml clean microcentrifuge tubes Yellow 6 and aliquot 15 µl of Yellow 6 reference dye into each tube.
5. Aliquot Red 40 reference dye Label eight clean 2 ml microcentrifuge tubes Red 40 and aliquot 15 µl of Red 40 reference dye into each tube.
Note: Power requirements vary depending on gel thickness and length, agarose concentration, and the type of electrophoresis buffer used. For this exercise we recommend using a constant voltage of 100 V for 15 min.

18
Student Manual
Background
How do you pick the foods you eat? The appearance of the food is a major deciding factor. For example, color can tell you whether a fruit is ripe or whether meat has spoiled. But the effect of food color goes much further than just helping to choose which food is fresh. Color affects our perception of how food tastes. For example, in taste tests, consumers may think that purple colored grape soda tastes better than uncolored grape soda, even though the two sodas are identical except for their color.
Use of artificial colors in food and drink has been around for thousands of years. What is new, however, is that governments now control the substances that can be used to color foods. Before food colors were regulated, many foods were colored with substances that were not safe to consume, such as bread whitened with chalk or cheese made yellow by lead tetroxide. Candy was one of the worst offenders. Because children gravitated to brightly colored sweets (something that has not changed through the years), vivid colors were produced with heavy metal salts, such as copper sulfate (blue), lead chromate (yellow), and mercury sulfide (red).
In the U.S., the Food and Drug Administration oversees the use of artificial coloring agents in food. They currently approve seven food color additives, all of which are petroleum derivatives. In addition, there are a number of natural food colors in use, such as caramel, beet juice, and carmine.
In this experiment, you will extract the food coloring from various candies and then analyze the dyes using agarose gel electrophoresis. In addition to your samples, you will run the four most commonly used artificial food dyes on your gel. The reference dyes are Blue 1, Red 40, Yellow 5, and Yellow 6. The four dyes are similar (see Figure 3), and all are negatively charged at pH 8.
N
-O3SSO3
-
N+
SO3-
NN
-OOC
NN
-O3SOH
SO3-
Blue 1 Yellow 5
-O3S
NN
HO
SO3- SO3
-
OHN
NO
SO3-
Yellow 6 Red 40
Fig. 3. Reference dyes used in this experiment.

19
Molecules can be separated by size using a process known as gel electrophoresis. The term electrophoresis means to carry with electricity. The mixture of molecules is placed in a small well formed in an agarose gel, which has a texture similar to that of gelatin. A buffer is then poured to cover the gel. When an electric current is applied to the gel, the molecules move in the gel depending on their charge. The negatively charged molecules move toward the positive electrode (red) and the positively charged molecules move toward the negative electrode (black). Any molecules with no charge will not leave the well.
The gel acts as a strainer with tiny pores that allows the smallest molecules to move through it very quickly. The larger the molecules, however, the more slowly they move through the gel. So the electrical charge causes molecules to move depending on their charge and the gel slows down bigger molecules relative to smaller molecules. This allows us to separate them.

20
Dye Extraction From Candies
Student Workstation QuantityDye extraction solution 2 ml2 ml microcentrifuge tubes 4Microcentrifuge tube rack 1Marking pen 1Plastic cups or small beakers 4Eyedropper 1Colored candies 4 varieties, 1–4 candies per variety*
*Candy example: 3 green Skittles, 3 orange jelly beans, 4 Red Hots, 1 brown gumball
Protocol
1. Label the four microcentrifuge tubes with your initials and the names and colors of the candies you are using.
2. Label four cups with your initials and the names and colors of the candies you are using.
3. Using an eyedropper or pipet, add 0.5 ml of dye extraction solution to each cup. Use the volume marks on the 2 ml microcentrifuge tube to measure the correct volume.
4. Place your candy into the appropriately labeled cup and swirl the candy in the dye extraction solution. If using a candy such as M&M’S or Skittles, just dissolve the color coating off until you get to the white layer of the candy. For all other candies, try to get as dark a solution of dye as possible.
5. Remove your candy from the cup. Pour the solution containing the dissolved colored candy coating into the appropriately labeled microcentrifuge tube.

21
Agarose Gel Electrophoresis
Student Workstation QuantityAgarose gel electrophoresis system 1 Agarose gel 1 Power supply (may be shared by multiple workstations) 1 Electrophoresis buffer, 1x TAE 275 ml Blue 1 reference dye 15 µl Yellow 5 reference dye 15 µl Yellow 6 reference dye 15 µl Red 40 reference dye 15 µlDyes extracted from candies from Lesson 1 4 labeled tubes2–20 µl adjustable-volume micropipet
or 10 µl fixed-volume micropipet and 8 tips 1 Marking pen 1
Protocol
1. Prepare your extracted candy dye samples. If a centrifuge is available, pulse spin the microcentrifuge tubes in the centrifuge to bring all the liquid to the bottom of the tube and to settle any insoluble particles. Spin down your dye standard samples as well, if necessary.
2. Obtain a prepoured agarose gel from your teacher or, if your teacher instructs you to do so, prepare your own gel.
3. Place the casting tray with the solidified gel in it into the platform in the gel box. The wells should be at the (–) cathode end of the box, where the black lead is connected. If the comb is still in the tray, remove it very carefully from the gel by pulling it straight up.
4. Fill the electrophoresis chamber with 1x TAE buffer to cover the gel, using approximately 275 ml of buffer.

22
Protocol (cont.)
5. Using a separate tip for each sample, load 10 µl of your reference dyes and candy dye extracts into the gel, with one sample per well. The first sample is loaded in the well at the left hand corner of the gel.
Lane 1: Blue 1 reference dye Lane 2: Yellow 5 reference dye Lane 3: Yellow 6 reference dye Lane 4: Red 40 reference dye Lane 5: Candy 1 dye extract Lane 6: Candy 2 dye extract Lane 7: Candy 3 dye extract Lane 8: Candy 4 dye extract
6. Place the lid on the electrophoresis chamber. The lid will attach to the base in only one orientation. The red and black jacks on the lid will align with the red and black jacks on the base. Plug the electrodes into the power supply.
7. Turn on the power supply. Set it for 100 V and electrophorese your samples for 15 min.
8. When the electrophoresis is complete, turn off the power and remove the top of the gel box. Carefully remove the gel and tray from the gel box. Be careful — the gel is very slippery!
9. Take a photograph of the gel for your records immediately.
23
Focus Questions1. When you analyzed the results of your gel, did any of your experimental samples contain dyes that did
not match the four reference dyes? For example, did any of your samples produce:
a. Dye bands that are a different size than any of the reference bands?b. Dyes that are a different color than any of the reference bands?c. More than one color band?d. Dyes that you observed moving in the “wrong” direction (toward the cathode)?
What might these dyes be?
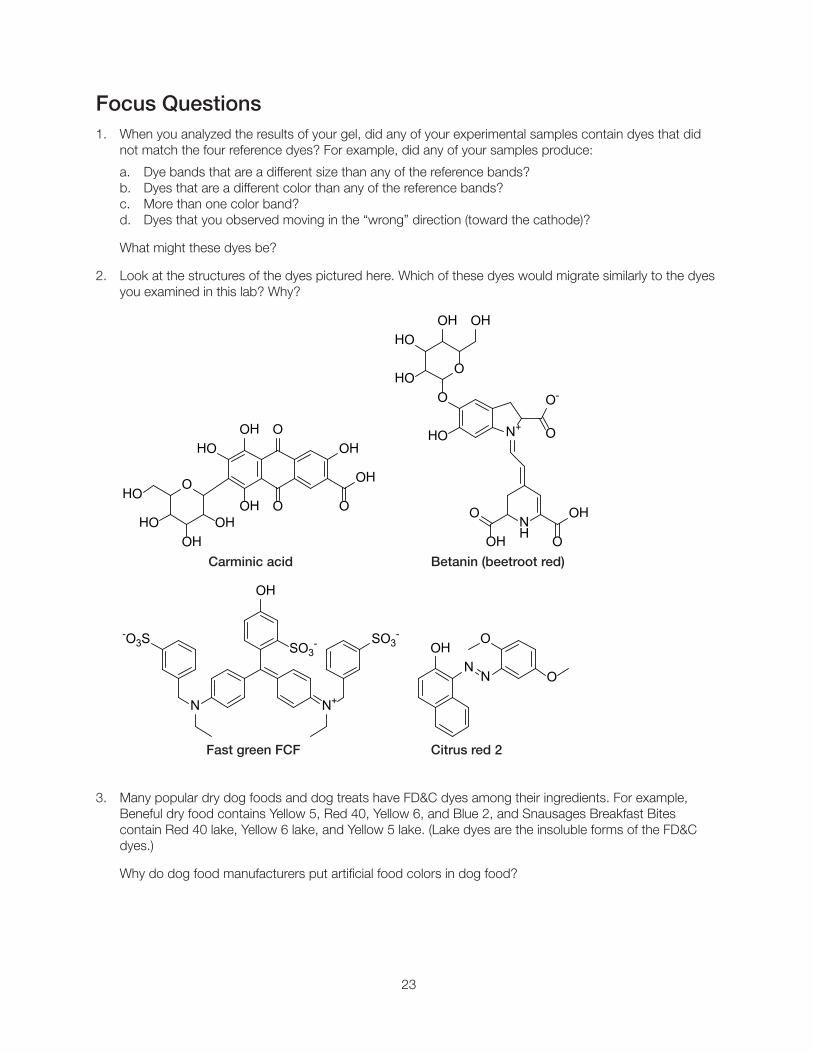
2. Look at the structures of the dyes pictured here. Which of these dyes would migrate similarly to the dyes you examined in this lab? Why?
O
O
O
OHOH
HO
HO
OH
O
OH
OHHO
OH
N+
NH O
OH
O
O-
OH
O
O
O
OHOHHO
HO
HO
Carminic acid Betanin (beetroot red)
N
-O3SSO3
-
N+
SO3-
OH
OHN
N O
O
Fast green FCF Citrus red 2
3. Many popular dry dog foods and dog treats have FD&C dyes among their ingredients. For example, Beneful dry food contains Yellow 5, Red 40, Yellow 6, and Blue 2, and Snausages Breakfast Bites contain Red 40 lake, Yellow 6 lake, and Yellow 5 lake. (Lake dyes are the insoluble forms of the FD&C dyes.)
Why do dog food manufacturers put artificial food colors in dog food?

24
4. Keep a log of the coloring agents in the foods you consume for a 1-week period. What are the most common dyes on your list? Are there any natural dyes on your list?
List the artificial dyes in a table, and look up natural food dyes that would produce the same color.
FD&C Dye Color Natural Alternative Source of Natural Dye
Are there any reasons why artificial food colors might be preferable to natural food colors?
5. What two factors control the distance the colored dye solutions migrate?
6. What force helps move the dyes through the gel?
7. What component of the electrophoresis system causes the molecules to separate by size? Explain
8. Agarose electrophoresis is commonly used to separate molecules of DNA. Explain how you expect DNA molecules with molecular weights of 600, 1000, 2000, and 5000 daltons to separate.

25
Appendix A Extension Activities
Paper Chromatography of Food Dyes
Chromatography separates molecules based on their physical characteristics, such as size, charge, and polarity. Chromatography involves a mobile phase flowing over a stationary phase. Paper chromatography can be used to identify the dyes in student samples or to determine the dyes used in food colors purchased at the grocery store. In paper chromatography, dye samples are spotted on chromatography paper (the stationary phase) and capillary action of a solvent (the mobile phase) carries the dyes up the paper. The distance that the dyes migrate is determined by their affinity for the two phases; the dye that has the least affinity for the stationary phase (the paper) will migrate the greatest distance up the paper.
To carry out a paper chromatography experiment:
• Prepare a beaker with 20 mM NaCl approximately 1 cm deep in the bottom of the beaker. Cover with plastic wrap or Parafilm
• Pencil a line 2 cm from the bottom of a strip of chromatography paper or filter paper and mark sample names in pencil below the line
• Spot 0.5–1 µl of each reference dye and test sample on the line using a micropipet, spacing the spots so that they do not touch. (If micropipets are not available, the dyes can be spotted using toothpicks.) Allow each dye spot to dry on the paper. Repeat spotting and drying on the same spot 2–3 times (or more, for a very lightly colored sample). The goal is to concentrate the dye in a very small spot. A hair drier can be used to dry the spots to speed up the process
• Place or suspend the filter paper into the prepared beaker. The solvent in the beaker should not touch the sample spots and the filter should not touch the sides of the beaker. Cover the beaker again
• The solvent will migrate up the filter paper through capillary action, and the dyes will migrate in the solvent. Allow the solvent front to reach 1–2 cm from the top of the paper
• Remove the paper from the beaker and mark how far the solvent front moved. Allow the filter paper to dry on paper towels
• For analysis, measure the distance that each dye migrated from the starting line. Measure the distance the solvent moved from the starting line (the penciled line, not the bottom of the paper)
• Calculate the retention factor (Rf) for each dye spot by dividing the dye migration distance by the solvent migration distance
• Analyze the results by comparing colors and Rf values for the dye spots. If the Rf and the colors are the same, then the dyes are likely the same. Unknowns with multiple dyes should produce distinct color spots
Spectroscopic Analysis of Food Colors
Spectral analysis of food colors can be used to demonstrate the linear relationship between concentration and absorbance (Beer-Lambert law), and the resulting data can be used to quantify the dyes in the student unknowns. Students can determine the wavelength of maximum absorbance for each of the reference dyes by spectroscopic scanning through the visible wavelengths of light (or you can give them the maximum absorbance from Table 1).
Once they know the maximum absorbance, students can:
• Prepare a series of dilutions of the reference dyes. (The reference dyes in the IDEA kit are 0.5 mg/ml)
• Determine the absorbance of each dilution at the absorbance maximum for that dye
• Plot concentration (x-axis) against absorbance (y-axis). For an example, see Figure 4

26
Fig. 4. Graph of absorbance at 600 nm against concentration for FD&C Blue 1.
There are several ways to investigate the dyes in the student samples. First, a dye’s absorption spectrum can be determined and compared to the spectra of the reference dyes. If the sample’s spectrum is identical to one of the reference dye’s spectrum, the dyes are the same. Second, if the student sample contains only a single known dye, the concentration of that dye can be calculated.
Determine the absorbance at the wavelength of the maximum absorbance for the dye (the wavelength used to get data for the plot). Then look at the graph for that dye. Find the absorbance value of the sample on the y-axis, draw a straight line across the graph until it intersects with the line, then drop straight down to read the dye concentration on the x-axis. The results can be complicated if the student unknowns contain dyes with overlapping absorbance spectra. See Appendix E, Further Resources, for more information.
Do Food Dyes Affect Perception of Taste?
In the U.S., most cheddar cheese is colored bright orange through the use of natural and artificial coloring agents. In other countries, cheddar is usually a much paler color. The orange color has been added because American consumers have become accustomed to orange cheddar cheese. Design a taste test to see if the color of cheddar cheese affects the perception of the taste of the cheese. To do this, choose an orange cheddar cheese and a white cheddar cheese. Both should be the same variety, such as mild or sharp. Cut into small cubes and ask friends or family members to try the two cheeses and tell you which cheddar cheese they prefer. Now, try the same experiment again, without letting them see the color of the two cheeses. Are the results the same? Do your results support the idea that color affects perception of taste? Another possible experiment would be running blind taste tests of colored candies like Skittles or M&M’S. Can students “tell” what color each one is by taste? Alternative experiment: Do the different colors of coated candies like Skittles and M&M’S taste the same? Have your test subjects try different colors of the same candies, and ask them which color or colors they prefer. Next, do a blind test so that your testers cannot see the candies before tasting them. Do they still have a color preference?

27
Appendix B Glossary of Terms
Agarose — a polysaccharide derived from red algae. It has a neutral charge and is the most commonly used matrix for separating DNA by electrophoresis.
Aliquot — the division of a quantity of material into smaller, equal parts.
Anode — a positive electrode in an electrical device. The anode is the positively charged (red or +) electrode toward which the negative ions (anions) flow.
Buffer — an aqueous solution that contains acid/base pairs (either a weak acid with its conjugate base or a weak base with its conjugate acid) that serve to keep the pH of the solution constant.
CAS number — the number assigned to each chemical described in the scientific literature by the Chemical Abstracts Service. Also called the CAS Registry Number.
Cathode — a negative electrode in an electrical device. The cathode is the negatively charged (black or –) electrode toward which the positive ions (cations) flow.
Electrophoresis — a technique that uses electricity to separate molecules by their physical characteristics, usually size and charge. In DNA agarose gel electrophoresis, DNA molecules are separated by size in an agarose matrix.
EEC number — the designation given by the European Union to food dyes approved for food use in the European Economic Community. Also called the E Number.
FD&C dye — dyes approved for use as food coloring agents by the U.S. Food and Drug Administration. FD&C stands for the Federal Food, Drug, and Cosmetic Act. There are currently seven FD&C dyes approved for use in the U.S.
Food coloring — solutions of soluble dyes that can be purchased at the grocery store and are used to color food. These products may be made from a single FD&C dye or from a combination of dyes.
Lake dye — the insoluble forms of the FD&C food dyes. The soluble forms react with aluminum hydroxide to form lake dyes, which are insoluble in aqueous solutions and will not migrate during electrophoresis. Lake dyes color foods by dispersing dye particles throughout the food. Some uses for lakes include coloring pet foods, pill coatings, cake mixes, and some candies.

28
Appendix C Instructor’s Answer Guide
Focus Questions
1. The four reference dyes included in the IDEA kit are the most commonly used artificial dyes in the U.S. There are a number of other dyes that students might encounter. Have your students check the ingredient lists from their candies to see what other dyes are present. Possible explanations for seeing bands of different sizes and colors from the control dyes include:
a. There are three other FD&C dyes (see Table 1). All are negatively charged and of similar size to the four control dyes.
b. Student samples may contain natural dyes, such as carmine or beetroot red. (Discussion of the sources and pros and cons of natural dyes is a good extension activity. See Focus Question 4.)
c. Several dyes are too close in size and charge to separate on a 1% agarose gel, so students may see a single band for the two colors. For example, Yellow 6 and Red 40 will not separate, so students will see a single orange band if those two dyes are present in their sample. (Paper chromatography will separate those colors. See Appendix A.)
d. If the candy is from outside the U.S, it may contain dyes other than the FD&C-approved dyes.
e. Although they are not common, some food dyes may be positively charged and will migrate toward the negative (cathode or –) electrode.
f. Many food colors are obtained by combining multiple food dyes, so some samples may produce more than a single dye band. For example, brown color is frequently a combination of Blue 1 and Red 40.
2. The four dyes pictured are:
a. Carminic acid is a colored molecule extracted from beetles. Some of the substances colored with carminic acid dyes include cosmetics, paint, candy, juices, and yogurt. The molecular weight of carminic acid is 492.38 and it has no net charge.
b. Betanin or beetroot red is a red dye derived from beets. Some of the foods colored by betanin include candies, ice cream, powdered drink mixes, sausages, and soups. The molecular weight of betanin is 551.48 and it has no net charge.
c. Fast Green FCF is also called Food Green 3 and FD&C Green 3. It is a petroleum-based dye used in soft drinks, canned vegetables, fish products, baked products, and jellies. It is approved for use in the U.S, Canada, and Japan, but banned as a food dye in the European Union. The molecular weight of FD&C Green 3 is 765.89 and it has a negative charge.
d. Citrus Red 2 is a food dye that is approved for use in the U.S. only to color the skin of oranges. It is a possible carcinogen. The molecular weight of Citrus Red 2 is 308.33 and it has no charge.
Of these four dyes, Fast Green FCF is most likely to migrate in a pattern similar to those of the dyes used in this experiment. The sulfate groups mean that it will be negatively charged at pH 8. It also has the same aromatic rings as the other FD&C dyes, and the molecular weight is similar to those of the dyes used in this kit.
3. Dogs don’t buy dog food and dog treats — their owners buy them! As with the other foods that we buy, appearance is very important in our decision-making, and the marketing departments of dog food companies know that. Colorful food is more appetizing to us, so we are more likely to buy it for our pets. Note how many dog foods have kibbles the colors (and shapes) of vegetables, so consumers are likely to associate the food with healthy eating.

29
Even if dogs did take the time to note their colorful kibbles, remember that their vision is not like ours. Dogs have only two types of color receptors, so their vision is similar to that of humans with red-green color blindness.
4. Students will likely have four or five of the FD&C food dyes on their lists. They may also have some natural colors. For instance, cola drinkers will have caramel on their list. They may also encounter carmine in candy or yogurt. If they eat many foods from natural food stores, they may encounter other natural dyes made from sources such as beets and carrots.
An Internet search will produce lists of natural food colors that can be prepared from plant materials, such as red from beets or cranberries, yellow from onion skins or daffodil blooms, purple from blackberries, blue from red cabbage, and green from spinach leaves.
If none of your students has carminic acid on their list, assigning this dye to students to research for extra credit will result in interesting discussion points, as this dye is considered “natural” and is derived from the powdered bodies of insects. In the U.S, food manufacturers were not required to identify this dye except as “natural color” until January 2011. Since then, the dyes must be listed by name (but not by origin) on food labels.
Reasons artificial dyes might be preferable to natural dyes include that the chemistry of the FD&C dyes is well known, they are manufactured to food grade standards, and they are very strong dyes, so very little is needed to color food.
There is a demand for all things natural, so some natural food dyes are being produced commercially to food grade standards. Some natural dyes being manufactured include caramel from caramelized sugar, annatto from the seeds of the achiote tree, cochineal from Dactylopius coccus insects, and betanin from beets. In general, it takes a larger quantity of natural dyes to get strong colors and some of these natural dyes can impart flavor to the item being colored.
5. The two factors that control the distance colored dye solutions migrate are:
a. Size of the dye molecule — the bigger the molecular weight/size of the dye molecule, the slower it will move through the 1% agarose matrix.
b. Charge of the molecule — the reference dye molecules and all FD&C dyes have a negative charge. The negatively charged molecules are attracted to the positively charged electrode of the electrophoresis tank.
6. The electrical current set up by the power supply forces negatively charged dyes to move toward the positively charged electrode. If the dye has no charge, then it should not move. If it has a positive charge, it should move toward the negatively charged electrode.
7. The agarose helps separate the molecules by size. The agarose is like a sieve and larger molecules have a harder time moving through than smaller molecules.
8. DNA is negatively charged. As do the reference dyes, it will move towards the positive electrode when an electrical current is applied. The agarose should separate the molecules based on size for DNA with the 600 MW DNA moving the farthest and the 5000 MW DNA moving the least. These DNA molecules are all a lot bigger than the dyes so they will take longer to move through the agarose.

30
Appendix D References and Additional Resources
Accum F (1820). A Treatise on Adulterations of Food, and Culinary Poisons Exhibiting the Fraudulent Sophistications of Bread, Beer, Wine, Spiritous Liquors, Tea, Coffee, Cream, Confectionery, Vinegar, Mustard, Pepper, Cheese, Olive Oil, Pickles, and Other Articles Employed in Domestic Economy (Philadelphia, PA: Ab’M Small). http://www.gutenberg.org/files/19031/19031-h/19031-h.htm, Accessed January 22, 2012.
Burrows A (2009). Palette of Our Palates: A Brief History of Food Coloring and Its Regulation. Comp Rev Food Sci Food Saf 8, 394–408.
Hawcroft DM (1997). Electrophoresis: The Basics (Ithaca, NY: IRL Press).
Sharma V et al (2011). A global perspective on the history, use, and identification of synthetic food dyes. J Chem Educ 88, 24–28.
Sigmann SB and Wheeler DE (2004). The quantitative determination of food dyes in powdered drink mixes. J Chem Educ 81, 1475–1478.
The fight against food adulteration, education in chemistry (2005). http://www.rsc.org/education/eic/issues/2005mar/thefightagainstfoodadulteration.asp, Accessed February 05, 2012.
Coke is a trademark of The Coca-Cola Company.
Pepsi is a trademark of PepsiCo Inc.
M&M’S is a trademark of Mars, Inc.
Skittles is a trademark of the Wm. Wrigley Jr. Company.
Beneful and Runts are trademarks of Société des Produits Nestlé S.A.
Snausages Breakfast Bites is a trademark of Del Monte Corp.
Kool-Aid is a trademark of Kraft Foods, Inc.
Red Hots is a trademark of Ferrara Pan Candy Company.
Hot Tamales, Mike and Ike, and Peeps are trademarks of Just Born, Inc.
Jujyfruits is a trademark of Farley’s & Sathers Candy Company, Inc.
Reese’s and Jolly Ranchers are trademarks of The Hershey Company.
Frappucino is a trademark of the Starbucks Company.

Life ScienceGroup
Sig 12111665078EDU Rev A US/EG
Bio-Rad Laboratories, Inc.
Web site www.bio-rad.com USA 800 424 6723 Australia 61 2 9914 2800 Austria 01 877 89 01 Belgium 09 385 55 11 Brazil 55 11 5044 5699 Canada 905 364 3435 China 86 21 6169 8500 Czech Republic 420 241 430 532 Denmark 44 52 10 00 Finland 09 804 22 00 France 01 47 95 69 65 Germany 089 31 884 0 Greece 30 210 9532 220 Hong Kong 852 2789 3300 Hungary 36 1 459 6100 India 91 124 4029300 Israel 03 963 6050 Italy 39 02 216091 Japan 03 6361 7000 Korea 82 2 3473 4460 Mexico 52 555 488 7670 The Netherlands 0318 540666 New Zealand 64 9 415 2280 Norway 23 38 41 30 Poland 48 22 331 99 99 Portugal 351 21 472 7700 Russia 7 495 721 14 04 Singapore 65 6415 3188 South Africa 27 861 246 723 Spain 34 91 590 5200 Sweden 08 555 12700 Switzerland 061 717 95 55 Taiwan 886 2 2578 7189 Thailand 800 88 22 88 United Kingdom 020 8328 2000