Embed Size (px)
Citation preview

IDA15
IDA’s Performance-Based Allocation System: Simplification of the Formula and Other Outstanding Issues
International Development Association Resource Mobilization (FRM)
September 2007
Abbreviations and Acronyms
ARPP Annual Review of Portfolio Performance CPIA Country Policy and Institutional Assessment GNI Gross National Income HIPC Heavily Indebted Poor Countries IBRD International Bank for Reconstruction and Development IDA International Development Association IEG Independent Evaluation Group LAC Latin America and Caribbean MDRI Multilateral Debt Relief Initiative ODA Official Development Assistance PBA Performance-Based Allocation SDR Special Drawing Rights

TABLE OF CONTENTS Executive Summary ..........................................................................................................................i I. Introduction .........................................................................................................................1 II. IDA’s Current PBA System ................................................................................................1 A. Components of the Current PBA formula ......................................................................1 B. Stressing Country Performance and Accounting for Needs ...........................................4 C. Managing IDA Resources Within a Replenishment Period ..........................................7 III. Simplifying the PBA Formula.............................................................................................8 IV. Small States and IDA’s Financial Assistance ...................................................................11 A. Challenges Faced by Small States ................................................................................11 B. What do These Challenges Mean for Small States.......................................................13 C. IDA’s Role in Small States...........................................................................................13 D. IDA’s Financing in Small States ..................................................................................14 E. Strengthening IDA’s Financial Assistance to small states...........................................15 V. Regional Projects...............................................................................................................16 VI. Issues for Discussion .........................................................................................................18 Figures Figure 1: IDA Country Performance Rating, FY08 .......................................................................2 Figure 2: Estimated Flow of IDA Resources by Income Groups in IDA15....................................5 Figure 3: Estimated Flows of IDA Resources by Region in IDA15 ...............................................6 Figure 4: Estimated Grant Element of Regional Flows Including MDRI and HIPC Transfers in
IDA15 ..............................................................................................................................6 Figure 5: Projected Impact of a Ceiling of 20 percent on Country Contributions to Regional
Projects...........................................................................................................................18 Tables Table 1: Estimated Flows of IDA Resources by Eligibility Criteria in IDA14...............................5 Table 2: Small States are, on Average, Subject to Greater Volatility than Other Countries .........13 Table 3: How Much Infrastructure Does the Current Minimum Allocation Buy? .......................15 Annexes Annex 1: Evolution of the IDA Performance Based Allocation Formula (IDA 11-13)................19 Annex 2: IDA15 Projections Under the Current PBA Formula and Simplification Options........22 Annex 3: Simulated Impact of a Floor and Base on Country Allocations ....................................25 Annex 4: Pipeline of Regional Projects for the IDA15 Period......................................................28 Annex 5: Share of Country Allocations to Finance Regional Projects in IDA15 ..........................29

EXECUTIVE SUMMARY
1. Background. Each year, IDA allocates the bulk of its resources using the Performance-Based Allocation (PBA) formula. Modifications to this formula over the past several replenishments have helped direct more concessional resources to countries where results are being achieved. However, these modifications have also made the formula more complex. 2. Objectives. This paper follows up on discussions related to the simplification of the PBA formula that took place at the first IDA15 replenishment meeting held in Paris in March 2007.1 As requested by the Deputies, this paper provides additional information on the impact of proposed simplification options on allocations at the country level and will propose a preferred option. Apart from follow-up work from the Paris meeting, this paper also discusses two additional allocation-related issues: (i) strengthening IDA’s financial support to small states; and (ii) enabling countries with small IDA allocations to participate in regional projects. 3. Simplification. After weighing both options – the geometric and additive formulas – to simplify the current PBA formula, management proposes using the additive formula going forward. The proposed formula is: 2
Country Performance Rating = (0.24 * CPIA A-C + 0.68 * CPIA D + 0.08 * PORT)
IDA country allocation = f (Country performance rating 5.0, Population1.0, GNI/capita-0.125) While both options simplify the current PBA formula considerably, maintain the current weights of components, and track current allocations very closely, management proposes the additive formula because it is simpler and more transparent. It could be understood easily by policy makers in IDA countries, which is the aim of the simplification exercise. 4. Small states. IDA-eligible small states, with populations below 1.5 million,3 face several challenges including high per capita costs of production, lack of diversification and openness leading to higher vulnerability to shocks, and periodic recurrence of natural disasters which compound human, economic, and environmental costs. Given the structure of their economies and the challenges they face, it is all the more important for governments in small states to react swiftly and flexibly to mitigate the impact of shocks, implement structural reforms, provide infrastructure and public services, and generate effective information flows. 1 IDA (February 2007). “IDA’s Performance-Based Allocation System: Options for Simplifying the
Formula and Reducing Volatility.” 2 Cluster D of the CPIA assesses a country’s public sector management and institutions. The other three
clusters, A-C, assess economic management, structural policies, and policies for social inclusion/equity respectively.
3 The World Bank does not have a formal category of small states. The Commonwealth Secretariat and the World Bank Joint Task Force defines small states as those with populations of 1.5 million or less (see Small States: Meeting Challenges in the Global Economy, Commonwealth Secretariat/World Bank Joint Task Force report, April 2000).

- ii -
5. IDA’s overall role in small states was discussed during the IDA14 replenishment meetings4 and in a report by the Independent Evaluation Group (IEG) in 2006.5 The IEG report noted that the scope and nature of the World Bank’s activities in small states should be “strategic and selective.” The report also finds that the World Bank can play a limited, but useful role in these countries by : (i) helping governments coordinate and harmonize donor activities to maximize the development benefits of Official Development Assistance (ODA); (ii) supporting cooperation among small states to address development issues on a regional basis, especially where there are asymmetries in resources, skills, and bargaining power; (iii) preparing cross-country analytical work on issues of common concern and where possible, tailoring them to country circumstances; and (iv) helping harmonize donor practices to lower transactions costs. 6. In addition to providing a “platform” for making overall aid more effective, IDA’s role in small states can be enhanced through the learning that comes from implementing programs and projects in a country.6 A review shows that IDA’s financial assistance to small states has eroded over the past replenishments. Since base allocations matter for small states, management proposes increasing them from SDR1.1 million per year (or SDR3.3 million per replenishment period) to SDR1.5 million per year (or SDR4.5 million per replenishment period) for all countries. This increase adjusts for inflation and, together with the increase agreed upon during the IDA14 replenishment discussions, helps maintain the base allocation constant in real terms since IDA9. Management further proposes raising the cap on per capita allocations from SDR13.2 (US$20) to SDR19.8 (US$30), to also adjust for inflation since IDA9. Such an increase would also benefit the small states disproportionately and would be in line with the performance orientation of IDA’s PBA system. This is because well-performing small states are more likely to reach the cap, and therefore stand to benefit. In addition, some micro states with very small populations will also benefit. 7. Regional projects. IDA’s regional pilot program began in IDA13 and continues during the IDA14 period. Demand for regional projects has been strong so far, especially in Sub-Saharan Africa, and this strong demand is expected to continue to grow during the IDA15 period. Given the externalities associated with regional projects and the need to demonstrate ownership by participating countries, 1/3 of the cost of an eligible regional project is charged to the country envelope to leverage 2/3 of the cost from the regional envelope. While the 1/3:2/3 split between the country allocation and topping-up fund has been working well, implementation experience has shown that there have been instances where country participation in regional projects was constrained by a small IDA allocation.
4 IDA (2004). “Supporting Small and Vulnerable States.” 5 IEG (2006). “Small States: Making the Most of Development Assistance. A Synthesis of World Bank
Evaluation Findings.” 6 IDA (2007). “The Role of IDA in the Global Aid Architecture: Supporting the Country-Based
Development Model.”
- iii -
8. Therefore, management proposes placing a cumulative ceiling on an individual country’s cost of participation in regional projects at 20 percent of its annual allocation.7 Hence, a country would finance its 1/3 share of participation in regional projects until the cost of participation reaches 20 percent of its annual allocation, with the regional project envelope financing the country’s costs beyond this ceiling. While this provision applies to all countries, limiting the costs borne by an individual country as a share of its IDA allocation by placing a ceiling would benefit countries with small IDA allocations where this ceiling would likely be binding. This is corroborated by experience with regional project program so far and by an examination of the pipeline of proposed projects in IDA15. Moreover, such a ceiling would disproportionately benefit small states with populations below 1.5 million, where regional integration is important. At the IDA15 Mid-Term Review, management will present a review of the regional project program, report on experience with the scaling up, and propose adjustments to the proposed ceiling on country contributions if necessary. 9. Issues for discussion. Management proposes the following issues for discussion.
• Do Deputies agree that Option II, the additive formula, is the preferred option?
• Do Deputies agree with increasing the base allocations to all countries from SDR1.1 million per year (or SDR3.3 million per replenishment) to SDR1.5 million per year (or SDR4.5 million per replenishment) and the per capita cap on allocations from SDR13.2 (US$20) to SDR19.8 (or US$30) for the benefit of the small states?
• Do Deputies agree with a ceiling of 20 percent on the country contributions to
regional projects for the benefit of countries with small IDA allocations?
7 After grants discount and Multilateral Debt Relief Initiative (MDRI) netting out.

IDA’s Performance-Based Allocation System: Simplification of the Formula and Other Outstanding Issues
I. INTRODUCTION
1. Background. Each year, IDA allocates the bulk of its resources using the Performance-Based Allocation (PBA) formula. The PBA formula, while emphasizing country performance as the main determinant of IDA allocations, also takes needs into account. This formula was modified over the past several replenishment discussions to incorporate new analytical insights, evolving donor priorities, and lessons learned during implementation. While these modifications have helped direct more concessional resources to countries where results are being achieved,8 they have made the formula more complex. 2. Objectives and Layout. This paper follows up on discussions relating to the simplification of the PBA formula that took place at the first IDA15 replenishment meeting held in Paris in March 2007 (Section III).9 As requested by Deputies at this meeting, this paper will provide additional information on the impact of the proposed simplification options on country allocations (Annex 2) and will recommend a preferred option. Apart from the follow-up work from the Paris meeting, this paper will also discuss two other allocation-related issues: (i) strengthening IDA’s financial engagement in small states (Section IV); and (ii) facilitating participation of IDA countries with small allocations in regional projects (Section V). Finally, issues for discussion are presented in Section VI. But before getting into these topics, this paper begins with a brief description of IDA’s PBA system and a discussion of how IDA resources are managed during the replenishment period (Section II).
II. IDA’S CURRENT PBA SYSTEM A. Components of the current PBA Formula 3. The PBA system. This section provides a short description of the main components of the PBA system.10 In this system, country performance ratings play a major role. Figure 1 shows the three main components of the country performance ratings – the Country Policy and Institutional Assessment (CPIA), the portfolio performance ratings and the governance factor. Each year, a rigorous set of peer-reviewed CPIA ratings are prepared for all IDA countries, which assess the quality11 of a 8 See IDA (March 2007). “Selectivity and Performance: IDA’s Country Assessment and Development
Effectiveness.” 9 IDA (February 2007). “IDA’s Performance-Based Allocation System: Options for Simplifying the
Formula and Reducing Volatility.” 10 This section is partly drawn from IDA (2006), “IDA’s Performance-Based Allocation System: a review
of the governance factor.” 11 “Quality” refers to how conducive that framework is to fostering poverty reduction, sustainable
growth, and effective use of development assistance.

- 2 -
country’s present policy and institutional framework. Portfolio performance ratings, as captured annually in the Bank’s Annual Review of Portfolio Performance (ARPP), reflect the percentage of actual IDA-funded problem projects in each country.12 The governance factor, calculated using the five indicators of cluster D13 of the CPIA, places extra emphasis on public sector management and institutions in a country to mitigate fiduciary risks to aid funds.14 The CPIA, portfolio performance ratings and governance factor feed into the calculation of the country performance ratings, all of which are now publicly disclosed by IDA.
Figure 1: IDA Country Performance Rating, FY08
12 Beginning FY08, following a decision by the Deputies in the first IDA15 meeting held in Paris in
March 2007, three changes were introduced in the calculation of the portfolio performance ratings to lower unwarranted volatility. These are: (i) using actual problem projects instead of actual plus potential problem projects; (ii) using a quarterly average of actual problem projects rather than an end-year snapshot; and (iii) using a revised scale to convert percent of problem projects to a rating.
13 Cluster D of the CPIA assesses a country’s public sector management and institutions. The other three clusters, A-C, assesses economic management, structural policies, and policies for social inclusion/equity respectively.
14 Note that the procurement rating is no longer used to calculate the governance factor beginning FY08 as a consequence of the decision by the Deputies in the IDA15 Paris meeting to drop potential problem projects from the calculation of the portfolio performance ratings. Potential problem projects are identified by 12 risk flags – one of which is the procurement flag. So dropping potential problem projects from portfolio ratings also meant that the procurement flag would no longer be included in the governance factor.
Portfolio Performance Rating (from ARPP) 80% 20%
Governance Factor
Weighted Average
IDA Country Performance Rating
5 governance related indicators from the CPIA
Country Policy and Institutional Assessment (CPIA)
- 3 -
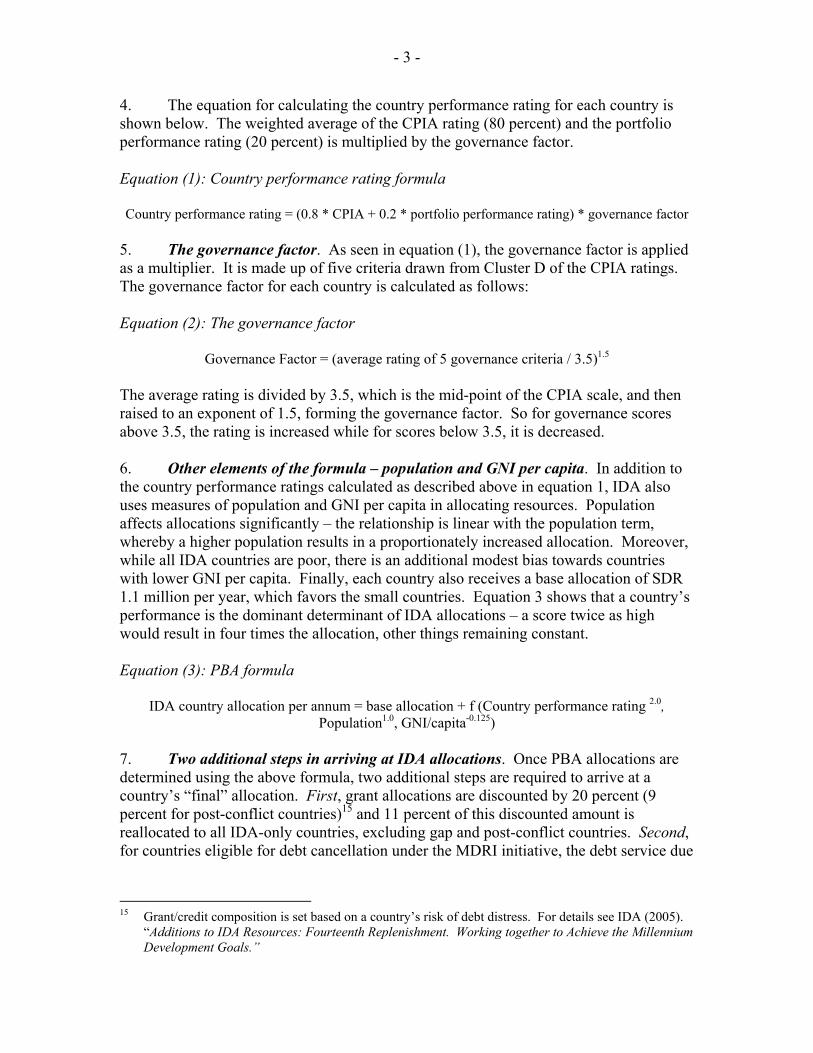
4. The equation for calculating the country performance rating for each country is shown below. The weighted average of the CPIA rating (80 percent) and the portfolio performance rating (20 percent) is multiplied by the governance factor. Equation (1): Country performance rating formula Country performance rating = (0.8 * CPIA + 0.2 * portfolio performance rating) * governance factor
5. The governance factor. As seen in equation (1), the governance factor is applied as a multiplier. It is made up of five criteria drawn from Cluster D of the CPIA ratings. The governance factor for each country is calculated as follows: Equation (2): The governance factor
Governance Factor = (average rating of 5 governance criteria / 3.5)1.5
The average rating is divided by 3.5, which is the mid-point of the CPIA scale, and then raised to an exponent of 1.5, forming the governance factor. So for governance scores above 3.5, the rating is increased while for scores below 3.5, it is decreased. 6. Other elements of the formula – population and GNI per capita. In addition to the country performance ratings calculated as described above in equation 1, IDA also uses measures of population and GNI per capita in allocating resources. Population affects allocations significantly – the relationship is linear with the population term, whereby a higher population results in a proportionately increased allocation. Moreover, while all IDA countries are poor, there is an additional modest bias towards countries with lower GNI per capita. Finally, each country also receives a base allocation of SDR 1.1 million per year, which favors the small countries. Equation 3 shows that a country’s performance is the dominant determinant of IDA allocations – a score twice as high would result in four times the allocation, other things remaining constant. Equation (3): PBA formula
IDA country allocation per annum = base allocation + f (Country performance rating 2.0, Population1.0, GNI/capita-0.125)
7. Two additional steps in arriving at IDA allocations. Once PBA allocations are determined using the above formula, two additional steps are required to arrive at a country’s “final” allocation. First, grant allocations are discounted by 20 percent (9 percent for post-conflict countries)15 and 11 percent of this discounted amount is reallocated to all IDA-only countries, excluding gap and post-conflict countries. Second, for countries eligible for debt cancellation under the MDRI initiative, the debt service due
15 Grant/credit composition is set based on a country’s risk of debt distress. For details see IDA (2005).
“Additions to IDA Resources: Fourteenth Replenishment. Working together to Achieve the Millennium Development Goals.”

- 4 -
in the relevant fiscal year is netted out from that year’s allocation. These netted-out amounts are then redistributed to IDA-only countries, excluding gap countries.16 B. Stressing Country Performance and Accounting for Needs 8. Performance is important. Country performance is the main determinant of IDA allocations. The stress on performance was put in place during the past replenishments because research shows that it helps direct more resources to countries where results are being achieved.17 As described above, the formula also gives high weight to governance because it is important for the development performance of a country as well as for mitigating fiduciary risks to aid funds.18 9. And needs are addressed too. In addition to factoring in country needs by including population and GNI per capita into the allocation formula, IDA’s allocation system addresses country needs in the following ways.
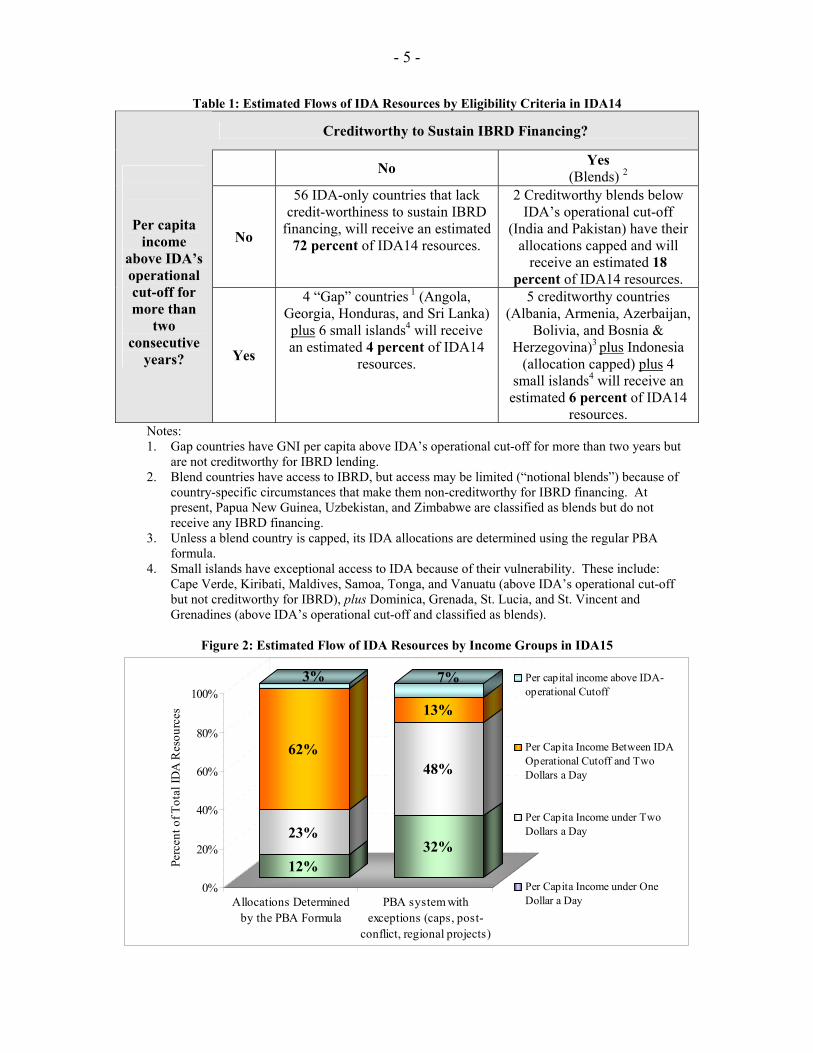
• Needs proxied by per capita income: IDA’s eligibility criteria ensure that resources are allocated to meet the needs of the poorest countries. In fact, around 90 percent of IDA’s resources during the IDA14 period are estimated to go to countries with per capita incomes below IDA’s operational cut-off, of which 72 percent are estimated to meet the needs of countries that are not creditworthy to sustain IBRD financing (Table 1).
Further, even within this group of poor countries eligible for IDA resources, the PBA system with its ring-fenced exceptions directs funds to the poorest among them. For instance, if allocations were purely driven by the PBA formula, only 12 percent of funds would go to countries where people earn less than a dollar a day and only 23 percent of resources would go to countries earning less than two dollars a day (Figure 2). By capping allocations to some creditworthy countries (because they have access to other sources of financing), providing exceptional allocations to some post-conflict countries to meet their extraordinary reconstruction needs, and by topping up funds for regional projects with positive externalities, allocations to countries where people earn less than a dollar a day would go up to 32 percent while allocations to countries earning less than two dollars a day would double to around 48 percent.
16 IDA (2005). “The Multilateral Debt Relief Initiative: Implementation Modalities for IDA.” 17 Also see IDA (March 2007). “Selectivity and Performance: IDA’s Country Assessment and
Development Effectiveness.” 18 See IDA (October 2007). “IDA’s Performance-Based Allocation System: A Review of the Governance
Factor.” and the 2006 Global Monitoring Report.
- 5 -
Table 1: Estimated Flows of IDA Resources by Eligibility Criteria in IDA14
Creditworthy to Sustain IBRD Financing?
No Yes (Blends) 2
No
56 IDA-only countries that lack credit-worthiness to sustain IBRD
financing, will receive an estimated 72 percent of IDA14 resources.
2 Creditworthy blends below IDA’s operational cut-off
(India and Pakistan) have their allocations capped and will
receive an estimated 18 percent of IDA14 resources.
Per capita income
above IDA’s operational cut-off for more than
two consecutive
years? Yes
4 “Gap” countries 1 (Angola, Georgia, Honduras, and Sri Lanka) plus 6 small islands4 will receive an estimated 4 percent of IDA14
resources.
5 creditworthy countries (Albania, Armenia, Azerbaijan,
Bolivia, and Bosnia & Herzegovina)3 plus Indonesia
(allocation capped) plus 4 small islands4 will receive an
estimated 6 percent of IDA14 resources.
Notes: 1. Gap countries have GNI per capita above IDA’s operational cut-off for more than two years but
are not creditworthy for IBRD lending. 2. Blend countries have access to IBRD, but access may be limited (“notional blends”) because of
country-specific circumstances that make them non-creditworthy for IBRD financing. At present, Papua New Guinea, Uzbekistan, and Zimbabwe are classified as blends but do not receive any IBRD financing.
3. Unless a blend country is capped, its IDA allocations are determined using the regular PBA formula.
4. Small islands have exceptional access to IDA because of their vulnerability. These include: Cape Verde, Kiribati, Maldives, Samoa, Tonga, and Vanuatu (above IDA’s operational cut-off but not creditworthy for IBRD), plus Dominica, Grenada, St. Lucia, and St. Vincent and Grenadines (above IDA’s operational cut-off and classified as blends).
Figure 2: Estimated Flow of IDA Resources by Income Groups in IDA15
12%
23%
62%
3%
32%
48%
13%
7%
0%
20%
40%
60%
80%
100%
Perc
ent o
f Tot
al ID
A R
esou
rces
Allocations Determinedby the PBA Formula
PBA system withexceptions (caps, post-
conflict, regional projects)
Per capital income above IDA-operational Cutoff
Per Capita Income Between IDAOperational Cutoff and TwoDollars a Day
Per Capita Income under TwoDollars a Day
Per Capita Income under OneDollar a Day

- 6 -
• Meeting Africa’s needs: The selected exceptions (caps, post-conflict allocations and regional projects) also help meet the needs of the poorest regions that have difficulty accessing other sources of financing. For instance, if all funds were allocated using the PBA formula, 72 percent of resources would go to South Asia and Africa would get only 20 percent (Figure 3). The exceptions help direct half of IDA’s assistance to the Africa region. Africa’s share would go up further in grant element19 terms, with HIPC and MDRI assistance included (Figure 4).
Figure 3: Estimated Regional Flows by Region in IDA15
20%
5%
72%
3%
52%
11%
31%
6%
0%
10%20%
30%40%
50%60%
70%80%
90%100%
Perc
ent o
f Tot
al ID
A R
esou
rces
Allocations Determined bythe PBA Formula
PBA System withExceptions (Caps, Post-
Conflict and RegionalProjects)
ECA, LAC and MNA
SOUTH ASIA
EAST ASIA
AFRICA
Figure 4: Estimated Grant Element of Regional Flows Including MDRI and HIPC Transfers in IDA15
52%
11%
31%
6%
60%
9%
25%
7%
0%10%20%30%40%50%60%70%80%90%
100%
Perc
ent o
f Tot
al ID
A R
esou
rces
PBA System withExceptions (Caps, Post-Conflict and Regional
Projects)
PBA System withExceptions Including
MDRI and HIPC in GrantElement Terms
ECA, LAC and MNA
SOUTH ASIA
EAST ASIA
AFRICA
19 The grant element is an assumed economic gain to IDA credit recipients and an assumed economic
loss to IDA due to the differential between the market and IDA's interest rates. Estimated grant element of regional flows was calculated assuming that IDA credits have a grant element of 60 percent and all projected HIPC and MDRI assistance were treated as grants.

- 7 -
C. Managing IDA Resources Within a Replenishment Period 10. Managing IDA resources. Every year, IDA resources are allocated according to principles agreed with donors during the replenishment discussions and tables showing individual country allocations are prepared in advance of the fiscal year. Since country performance and grant eligibility are assessed every year, firm allocations are provided only for the upcoming fiscal year and indicative allocations are provided for the outer years to facilitate planning at the country level.20 11. Meeting country-specific needs. While IDA resources are allocated in accordance to principles agreed with donors each year (PBA-driven allocations, capped allocations, post-conflict allocations, regional project allocations), operational realities on the ground in IDA countries require flexible management of resources during a replenishment period. For example, a large and lumpy infrastructure project may require commitments in excess of annual PBA allocations at the country level. Or it could be the case that not all allocated resources are committed in a country in a given year because of country-specific circumstances and allocations are carried forward to the next year. It could also be the case that annual allocations for small countries may be insufficient for a viable project and there may be a need to commit their three-year allocations in a single year. For all these reasons, in any given year, commitments may exceed PBA allocations for some countries (front loading) while for others, commitments may be lower than the PBA allocations (back loading). So although annual commitments could deviate from performance-based allocations for operational reasons, management keeps track of commitments in each country to ensure that they are in line with overall performance-based allocations for each country within each replenishment period. 12. Front and back loading of allocations. Clear guidelines are established in advance of each fiscal year on front and back loading of resources. Limited front loading of allocations in the first two years of a replenishment period of up to 30 percent is possible. Small countries (with populations of less than 1.5 million) can frontload by a higher amount given the small size of their allocations. Capped countries (India, Indonesia, and Pakistan) can also choose to frontload higher amounts as long as they stay within the three-year cap on allocations. Resources can be back loaded in the first two years of the replenishment period, if country conditions are not amenable for the full utilization of IDA allocations. Country commitments are required to stay within their indicative three-year cumulative PBA envelope for the replenishment period as a whole. If resources are front loaded in the first two years of a replenishment period, then resources available for commitment in the final year will be commensurately lower. 13. Final year of the replenishment period. In advance of the final year of a replenishment period, if it becomes evident that the allocated resources will not be committed in any country, then these dormant funds are returned to the IDA pool and redistributed to other countries using the PBA system. In addition, if a region identifies 20 Allocations for the outer years are subject to a number of uncertainties including the country’s
performance, its relative performance compared to other countries, the size of the available IDA envelope, traffic lights, MDRI status, reactivation of countries, and other reasons.
- 8 -
more dormant funds during the course of the final year of a replenishment period, then it could reallocate up to 10 percent of the total regional PBA allocations from countries where IDA allocations cannot be absorbed to better-performing countries with higher absorptive capacity. 14. Going forward, management will continue to manage its resources flexibly in IDA15 to meet the emerging needs of the countries, while ensuring that overall commitments are in line with overall performance-based allocations for the replenishment period as a whole.21
III. SIMPLIFYING THE PBA FORMULA 15. Background. At the first IDA15 meeting held in Paris in March 2007, Deputies discussed the two proposals put forward by management to simplify the PBA formula.22 While agreeing that both proposals greatly simplify the current PBA formula, Deputies indicated the “need to reflect further on the information provided in this meeting as well as inputs from further work on IDA’s resource allocation framework prior to deciding on a specific option.”23 Specifically, to be able to make a choice between the two options, some Deputies indicated that they would like to see the impact of the two options on individual country allocations. This additional country-level information is provided in Annex 2. Before comparing the two options, this section begins with a summary of the discussions in the March paper. 16. Increasing complexity of the PBA formula. IDA’s PBA formula has evolved over time and was modified several times during the IDA11-14 period (Annex 1). While such modifications have helped direct more resources to countries that have achieved results, they also contributed to the complexity of the formula, making it difficult to disentangle the impact of each component on allocations at the country level. 17. Simplification is necessary. Since 2006, IDA has been at the forefront in enhancing the transparency of its resource allocation system through public disclosure of the ratings that feed into the PBA formula. However, given the complexity of the formula, the way in which the ratings affect the final allocations is not readily evident. This is because of: (i) the double counting of governance; and (ii) the structure of the formula, which includes a combination of additive and multiplicative/geometric elements. Once the performance-based allocations are determined using the formula described in Section II, further steps involve grants-related discounts and the MDRI
21 IDA's allocation system is one of 30 business processes being reviewed by IEG in the on-going
assessment of the IDA controls framework, mandated as part of the IDA14 replenishment arrangements. Preliminary findings of the assessments, which will be discussed at the third IDA15 meeting in October 2007, suggest that the allocation system is appropriately designed and operating effectively.
22 IDA (February 2007). “IDA’s Performance-Based Allocation System: Options for Simplifying the Formula and Reducing Volatility.”
23 IDA (2007). “Chairman’s Summary: IDA Deputies Meeting, Paris, France, March 5-6, 2007.”

- 9 -
netting-out mechanism. These two additional steps add to the complexity of the allocation exercise. The focus in this section is only on the PBA formula. Simplifying the formula would enhance its transparency, thus making it easier for partner countries and country teams to better understand what drives changes in their allocations. 18. Guiding principles for simplification. The two options for simplification focus on the country performance rating, a major component of the PBA system. At the IDA14 Mid-Term Review meeting, Deputies provided two guiding principles for simplification. First, they requested that simplified options retain a weight of governance similar to the current formula. Second, they asked that the new options track closely the allocations from the current formula to minimize disruptions at the country level. 19. The current formula. As agreed in Paris with the Deputies, beginning FY08, the current formula incorporates the three technical changes in the calculation of portfolio performance ratings. These changes were introduced to lower unwarranted volatility. The changes are: (i) using actual problem projects instead of actual plus potential problem projects; (ii) using an average of quarterly data on actual problem projects instead of an end-year snapshot; and (iii) revising the scale used to convert the percent of projects at risk into a rating. As pointed out in the paper presented at the Paris meeting, dropping potential problem projects from the calculation of the portfolio ratings has an additional consequence for the governance factor. Since the procurement rating is based on a risk flag drawn from the potential problem projects, it is no longer included in the calculation of the governance factor. 20. Two simplification options. In accordance with the guidance provided by Deputies (paragraph 18) and the changes introduced to the current formula (paragraph 19), two options – a geometric formula (Option I) and an additive formula (Option II) – were proposed to simplify the formula.24 Current Formula
Country performance rating = (0.8 *CPIA + 0.2* PORT) * (CPIA D /3.5)1.5
IDA country allocation = f (Country performance rating 2.0, Population1.0, GNI/capita-0.125)
Option I
Country performance rating = (CPIA A-C) 0.24 * (CPIA D) 0.68 * (PORT) 0.08
IDA country allocation = f (Country performance rating 5.0, Population1.0, GNI/capita-0.125)
24 In the current formula, country performance ratings are more dispersed because of the governance
factor. In contrast, ratings are less dispersed in Options I and II. Therefore, increasing the exponent on the country performance ratings from 2 to 5 in the proposed option, results in similar shares and therefore similar levels of allocations per capita as the current formula.
- 10 -
Option II
Country Performance Rating = (0.24 * CPIA A-C + 0.68 * CPIA D + 0.08 * PORT)
IDA country allocation = f (Country performance rating 5.0, Population1.0, GNI/capita-0.125) 21. Comparing the Options. Both options address the main problems in the current formula by doing away with: (i) the double counting of governance and (ii) the structure of the formula, which includes a combination of additive and multiplicative/geometric elements. In addition, both options comply equally well with the Deputies’ guiding principles of retaining the weight of governance, and closely tracking the allocations from the current formula to minimize disruptions at the country level. 22. Both options produce similar results. Applying the options to IDA15 projections shows that they both track the current formula very closely. As requested by the Deputies, country-specific information for the IDA15 period comparing the two options is shown in Annex 2, along with assumptions that underpin these simulations. Allocations generated by Options I and II differ from the ones generated by the current formula on average by 0.32 percent and 0.50 percent respectively over the entire IDA15 period. Over the same period, under Option I (Option II) the greatest fall in allocations is around 3.3 percent (1.1 percent) and the greatest increase is around 1.3 percent (4.2 percent). In aggregate, for all countries, this translates into an overall shift of SDR26.7 million (0.10 percent of total resources) among all IDA countries under Option I and SDR68.6 million (0.26 percent of total resources) under Option II. In terms of allocations, both options produce similar results and the differences between the two are minor at the country level. 23. Option II is simpler of the two options. Although Option I tracks the current formula slightly more closely, Option II is preferable because it is simpler and more transparent. It has the following advantages:
• It is more easily understood by policy makers in IDA countries. IDA has made considerable progress in ensuring greater transparency and disclosure of IDA’s PBA system. IDA has publicly disclosed detailed CPIA scores for all IDA-eligible countries since 2006. This disclosure has allowed IDA countries to benefit from open scrutiny of comparative performance. In addition it has served, through consultations at the country level, as a diagnostic tool to strengthen partnership between the country policy makers and IDA. A further simplification of the PBA formula, by choosing Option II, would help IDA countries take the next step in figuring out how changes in their CPIA ratings would affect their IDA resource allocation, other things remaining constant.
• The impact of incremental changes in the CPIA and portfolio ratings on
performance-based allocations is straightforward and readily understood - all components have the same incremental impact on the final country performance rating regardless of the level of performance. Instead, in Option I, one would need to be familiar with the concepts of elasticity and
- 11 -
logarithmic transformations to arrive at the incremental impact of changes in CPIA and portfolio ratings on country performance rating. The latter adds a further step when calculating the effect of component changes on the final ratings, thereby making it a bit more complex.
24. In view of the advantages described above, management recommends Option II to simplify the PBA formula.
IV. SMALL STATES AND IDA’S FINANCIAL ASSISTANCE 25. Small states. The term "small states" generally refers to sovereign countries with fewer than one and a half million people.25 While small states can be found in every geographic region, they are largely concentrated in Africa, Caribbean and Pacific regions. Together, the small states are home to 29 million people, 0.5 percent of the total population of developing countries. Their sizes differ greatly, from micro states with fewer than 100,000 people each to those with more than one million people. 26. IDA eligible small states. During IDA14, 20 IDA borrowers had populations of around 1.5 million or less, with per capita incomes ranging from below IDA operational cutoff in FY08 (Bhutan, Comoros, Djibouti, Gambia, Guinea Bissau, Lesotho, Sao Tome and Principe, Solomon Islands, Timor Leste) to those above IDA’s operational cutoff (Cape Verde, Dominica, Grenada, Guyana, Kiribati, Maldives, Samoa, St. Lucia, St. Vincent and the Grenadines, Tonga, and Vanuatu).26 While small states account for a fourth of IDA-eligible countries, their combined population is small at around 0.5 percent of people living in IDA countries. A. Challenges Faced by Small States 27. Challenges. Small states face a number of well-known challenges because of their size.27 These include:
• Higher per capita costs of production. Like all countries, small states have to provide a range of public goods and services. These include the central functions
25 See also IDA (December 2004), “Supporting Small and Vulnerable States.” 26 Several small island economies have special access to IDA despite high per capita incomes because of
their vulnerability. These are: Cape Verde, Dominica, Grenada, Kiribati, Maldives, Samoa, St. Lucia, St. Vincent and the Grenadines, Tonga, and Vanuatu.
27 Recent research indicates that these challenges, outlined in the 2000 Commonwealth Secretariat/World Bank Joint Task Force report presented to the Development Committee, have endured—and indeed that “new challenges have emerged for small states in the recent past, including faster than anticipated preference erosion for traditional exports; a rapid rise in the debt burden for many small states; increased environmental susceptibilities; rising concerns with respect to youth employment; security and crime; and the HIV/AIDS pandemic” (see the Joint Commonwealth Secretariat/World Bank report Toward an Outward-Oriented Development Strategy for Small States: Issues, Opportunities, and Resilience Building—A Review of the Small States Agenda Proposed in the Commonwealth Secretariat/World Bank Joint Task Force Report of April 2000).

- 12 -
of government, regulatory activities, tax administration, provision of education, health and social services, a judicial system, foreign relations, and security. To the extent that there are indivisibilities in the provision of such public services, the fixed costs per capita are higher in small states. This is corroborated by empirical evidence, which shows that small states have higher costs of producing public goods.28 In addition, the costs of providing physical infrastructure are particularly high in small states. Moreover, in dispersed island states such as in the Pacific, the development of even a small domestic market is constrained by high transportation costs. Distance is often compounded by relatively small volumes of cargo, making transportation expensive. A study29 shows that small and island states are amongst countries facing the highest transportation costs,30 which are higher by 25-100 percent compared to even the median cost of developing countries.31 High international transport costs in turn increase the cost of exports, thereby reducing their competitiveness and export returns. Similarly, the costs of imports are increased, resulting in consumer welfare losses.
• Economic vulnerability is high. Second, because their economies tend to be
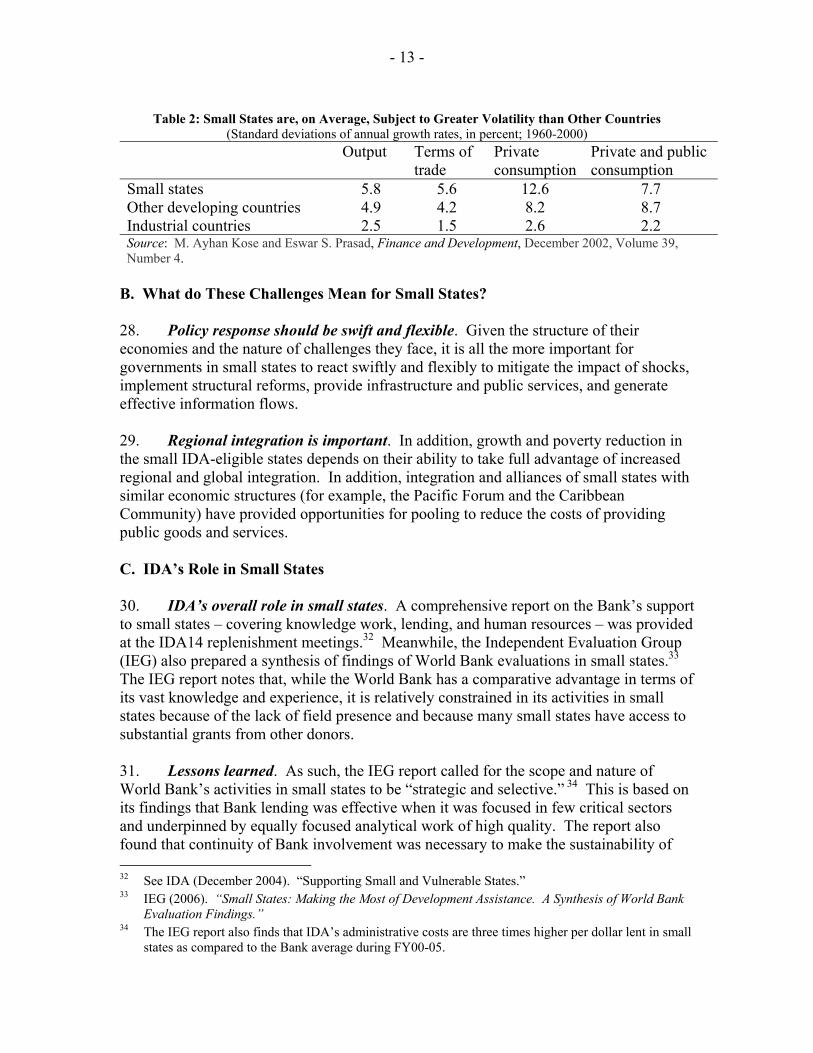
undiversified and highly dependent on external trade, they are more vulnerable to economic shocks and have significantly more volatile growth rates than larger countries. With a given level of shock, the impact on consumption will be more rapidly felt in a small state than in a medium or large state. Consumption volatility is not only higher than output volatility, but also a more relevant measure of welfare, especially of the poor in these countries (Table 2).
• Also vulnerable to natural disasters. Finally, many small states are prone to
natural disasters such as tropical storms, rise in sea level, cyclones, droughts, hurricanes, tsunamis, and volcanic eruptions. These natural disasters typically affect the entire economic, human and physical environment of small states. Often, periodic recurrences of these events compound the human, economic, and environmental costs and the financial burdens of renewing or replacing infrastructure.
28 See Alesina, Alberto and Romain Wacziarg (1998). “Openness, Country Size and the Government,”
Journal of Public Economics, Vol. 69, Issue 3 (September), 305-321.) 29 Atkins, J P, Mazzi, S, A & Easter C D, Commonwealth Vulnerability Index for Developing Countries,
Economic Paper, No. 40, Commonwealth Secretariat, London, 2000. 30 Transport costs are measured as a ratio of insurance and freight debits to merchandise imports. The
ratio to imports, rather than exports, is used since merchandise imports are often much larger than exports for many small states.
31 Insurance and freight debits as a percent of merchandise exports for some small states: Kiribati 26 percent; Comoros 24 percent; São Tomé and Principe 23 percent; Tonga 22 percent; Vanuatu 20 percent; Gabon 20 percent; The Gambia 20 percent; Solomon Islands 20 percent; Equatorial Guinea 19 percent; Trinidad & Tobago 18 percent; and Seychelles 18 percent. The median percentage for developing countries as a whole is 14 percent.
- 13 -
Table 2: Small States are, on Average, Subject to Greater Volatility than Other Countries
(Standard deviations of annual growth rates, in percent; 1960-2000) Output Terms of
trade Private consumption
Private and publicconsumption
Small states 5.8 5.6 12.6 7.7 Other developing countries 4.9 4.2 8.2 8.7 Industrial countries 2.5 1.5 2.6 2.2 Source: M. Ayhan Kose and Eswar S. Prasad, Finance and Development, December 2002, Volume 39, Number 4.
B. What do These Challenges Mean for Small States? 28. Policy response should be swift and flexible. Given the structure of their economies and the nature of challenges they face, it is all the more important for governments in small states to react swiftly and flexibly to mitigate the impact of shocks, implement structural reforms, provide infrastructure and public services, and generate effective information flows. 29. Regional integration is important. In addition, growth and poverty reduction in the small IDA-eligible states depends on their ability to take full advantage of increased regional and global integration. In addition, integration and alliances of small states with similar economic structures (for example, the Pacific Forum and the Caribbean Community) have provided opportunities for pooling to reduce the costs of providing public goods and services. C. IDA’s Role in Small States 30. IDA’s overall role in small states. A comprehensive report on the Bank’s support to small states – covering knowledge work, lending, and human resources – was provided at the IDA14 replenishment meetings.32 Meanwhile, the Independent Evaluation Group (IEG) also prepared a synthesis of findings of World Bank evaluations in small states.33 The IEG report notes that, while the World Bank has a comparative advantage in terms of its vast knowledge and experience, it is relatively constrained in its activities in small states because of the lack of field presence and because many small states have access to substantial grants from other donors. 31. Lessons learned. As such, the IEG report called for the scope and nature of World Bank’s activities in small states to be “strategic and selective.” 34 This is based on its findings that Bank lending was effective when it was focused in few critical sectors and underpinned by equally focused analytical work of high quality. The report also found that continuity of Bank involvement was necessary to make the sustainability of 32 See IDA (December 2004). “Supporting Small and Vulnerable States.” 33 IEG (2006). “Small States: Making the Most of Development Assistance. A Synthesis of World Bank
Evaluation Findings.” 34 The IEG report also finds that IDA’s administrative costs are three times higher per dollar lent in small
states as compared to the Bank average during FY00-05.
- 14 -
project benefits likely. Going forward, the report notes that the World Bank can play a limited, but useful role in small states by: (i) helping governments coordinate and harmonize donor activities to maximize the development benefits of Official Development Assistance (ODA); (ii) supporting cooperation among small states to address development issues on a regional basis, especially where there are asymmetries in resources, skills, and bargaining power; (iii) preparing cross-country analytical work on issues of common concern and where possible, tailoring them to country circumstances; and (iv) helping harmonize donor practices to lower transactions costs. 32. In addition to providing a “platform” for making overall aid more effective, IDA’s role in small states can also be enhanced through the learning that comes from implementing programs and projects in a country.35 This section focuses on strengthening IDA’s financial assistance to small states, which has eroded over the past replenishments. D. IDA’s Financing in Small States 33. Base allocation and cap on per capita allocation. IDA’s PBA system has a ‘fixed’ component, which gives a base allocation of SDR 1.1 million each year to all countries irrespective of their performance assessment. This base allocation was deemed as the minimum amount necessary to maintain a program in a country. In addition, there is also a cap on per capita allocations placed at US$20 (or SDR13.2), to ensure equitable treatment of countries. 34. Impact on small states. The base allocations as well as the cap on per capita allocations largely affect small states. Small states, in comparison to large countries, have small overall allocations (base allocation plus performance-based allocations) and the base allocation forms a larger share of this overall allocation. In addition, the cap on per capita allocations also largely affects small states. In FY07, for instance, seven small states reached the cap either because they were good performers (Dominica, Grenada, St. Lucia, St. Vincent and the Grenadines, and Samoa) or have extremely small populations (Kiribati and Tonga). Some large countries, like Ghana and Tanzania, are also close to the cap because of their strong performance ratings, but it is relatively uncommon for large countries to approach the cap on per capita allocations. 35. Erosion of base and cap in real terms. A review of IDA allocations shows that the base allocation and cap on per capita allocations have not been fully adjusted since IDA9 and have therefore eroded in real terms.36 Moreover, given the high per capita cost of providing public goods in these countries, as well as the lumpy nature of some infrastructure investments where IDA’s support is most strongly sought in these states, the current base allocation is too small. For instance, IDA’s current minimum lump sum allocation of SDR 1.1 million allows very little infrastructure investment in these countries. Table 3 provides an illustrative calculation of what the current minimum 35 IDA (2007). “The Role of IDA in the Global Aid Architecture: Supporting the Country-Based
Development Model.” 36 The base allocation was adjusted slightly in IDA14, but this adjustment did not go far enough.
- 15 -
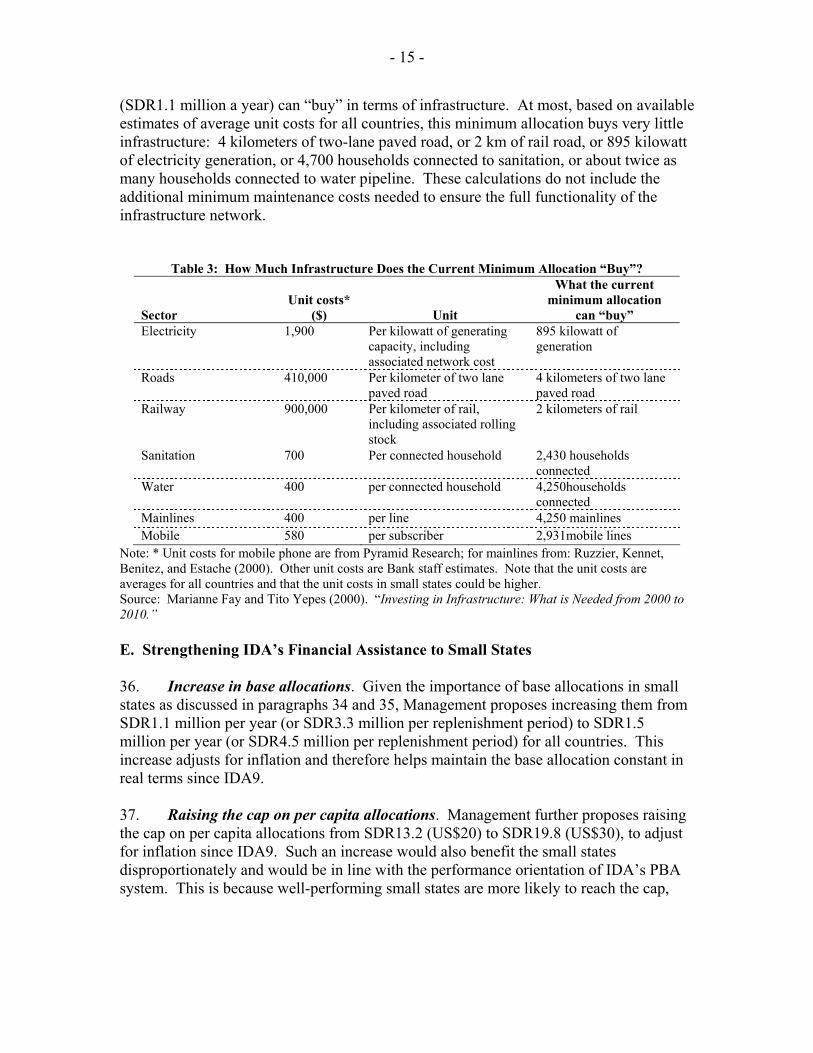
(SDR1.1 million a year) can “buy” in terms of infrastructure. At most, based on available estimates of average unit costs for all countries, this minimum allocation buys very little infrastructure: 4 kilometers of two-lane paved road, or 2 km of rail road, or 895 kilowatt of electricity generation, or 4,700 households connected to sanitation, or about twice as many households connected to water pipeline. These calculations do not include the additional minimum maintenance costs needed to ensure the full functionality of the infrastructure network.
Table 3: How Much Infrastructure Does the Current Minimum Allocation “Buy”?
Sector Unit costs*
($) Unit
What the current minimum allocation
can “buy” Electricity 1,900 Per kilowatt of generating
capacity, including associated network cost
895 kilowatt of generation
Roads 410,000 Per kilometer of two lane paved road
4 kilometers of two lane paved road
Railway 900,000 Per kilometer of rail, including associated rolling stock
2 kilometers of rail
Sanitation 700 Per connected household 2,430 households connected
Water 400 per connected household 4,250households connected
Mainlines 400 per line 4,250 mainlines Mobile 580 per subscriber 2,931mobile lines
Note: * Unit costs for mobile phone are from Pyramid Research; for mainlines from: Ruzzier, Kennet, Benitez, and Estache (2000). Other unit costs are Bank staff estimates. Note that the unit costs are averages for all countries and that the unit costs in small states could be higher. Source: Marianne Fay and Tito Yepes (2000). “Investing in Infrastructure: What is Needed from 2000 to 2010.” E. Strengthening IDA’s Financial Assistance to Small States 36. Increase in base allocations. Given the importance of base allocations in small states as discussed in paragraphs 34 and 35, Management proposes increasing them from SDR1.1 million per year (or SDR3.3 million per replenishment period) to SDR1.5 million per year (or SDR4.5 million per replenishment period) for all countries. This increase adjusts for inflation and therefore helps maintain the base allocation constant in real terms since IDA9. 37. Raising the cap on per capita allocations. Management further proposes raising the cap on per capita allocations from SDR13.2 (US$20) to SDR19.8 (US$30), to adjust for inflation since IDA9. Such an increase would also benefit the small states disproportionately and would be in line with the performance orientation of IDA’s PBA system. This is because well-performing small states are more likely to reach the cap,

- 16 -
and therefore stand to benefit from it. In addition, some micro states with very small populations will also benefit from it.37 38. Annex 3 shows the impact of changing the base and cap at the country level. Small countries would benefit from the two proposals, and the burden on other countries to compensate for this increase is negligible. It also causes minimal departure from the current formula. 39. In addition, in view of the importance of regional integration for small states, management also proposes changes in regional project allocations as discussed in the next section.
V. REGIONAL PROJECTS 40. Background. During the IDA14 period, SDR200 million in FY06 and SDR250 million in each of FY07 and FY08 was set aside for regional projects. Given the externalities associated with regional projects and the need to demonstrate ownership by participating countries, 1/3 of the cost of an eligible regional project is charged to the country PBA envelope to leverage 2/3 of the cost from the regional envelope. Thus while providing an important incentive for regional integration, this formula also provides a clear link to performance-based allocations, and helps ensure country ownership and commitment. 41. Strong demand for regional projects. The demand for regional project envelope was strong in the first two years of IDA14, with approved projects using SDR235 million and SDR233 million respectively of the topping-up resources, leaving SDR233 million for FY08. This is insufficient for meeting the demand for topping-up funds in FY08, where the 16 project proposals received so far add up to SDR465 million in topping-up funds. The excess demand for topping-up funds for regional projects will therefore spill over to IDA15 and this is corroborated by the strong pipeline of regional projects, especially in Sub-Saharan Africa. As requested by the Deputies at the IDA15 Replenishment meeting in Maputo, Annex 4 shows the pipeline of regional projects for the IDA15 period. 42. Ceiling on country contribution. While the 1/3:2/3 split between the country allocation and topping-up fund has been working well, implementation experience has shown that there have been instances where country participation in regional projects was constrained by a small IDA allocation. Therefore, management proposes placing a ceiling on an individual country’s cost of participation in regional projects at 20 percent of its annual allocation.38 A country would finance its 1/3 share of participation in
37 In some micro states, performance-based allocations could be lower than base allocations. This is
because either their performance or their small population or both could cause them to reach the cap thus constraining their allocations below the base allocation.
38 After grants discount and MDRI netting out.

- 17 -
regional projects until the cost of participation reaches 20 percent of its allocation, with the regional envelope financing the country’s costs beyond this ceiling. 43. Rationale for placing the ceiling at 20 percent. An analysis of the regional projects approved during IDA14 shows that the average country contribution has been around 20 percent (Annex 5),39 with countries with small allocations above this average and countries with larger allocations well below. Therefore, placing the ceiling at 20 percent will ensure that countries with small allocations, for which the country contribution represents a serious constraint, will be able to participate to a greater extent to regional projects. In fact, applying this ceiling to the IDA15 regional projects pipeline shows that limiting the costs borne by an individual country as a share of its IDA allocation by placing a ceiling would mainly benefit countries with small IDA allocations, especially the small states (also see paragraph 29). While the same objective could have been achieved by limiting the group of countries to which a ceiling would apply, having one ceiling for all countries provides a simple and transparent rule that avoids creating yet another subset of countries in IDA.40 44. Benefits for countries with small IDA allocations. As shown in Figure 5,41 a 20 percent annual ceiling would benefit primarily countries with small allocations, and in particular small states. Based on the IDA15 pipeline, of the 20 countries that would likely benefit by limiting their costs of participating in regional projects to 20 percent, 16 are projected to have allocations of less than SDR11 million, with the remaining country having an average allocation of about SDR43 million.42 Because these are mainly countries with small IDA allocations, the actual additional costs imposed on the regional envelope are small – estimated at about SDR61 million in IDA15. 45. Checks and balances. There are a number of checks and balances in place that will help ensure that burden sharing in regional projects continues to reflect benefits. Currently each region is required to manage a share of the fixed regional envelope and set regional priorities. As such there would not be a strong incentive for a region to encourage large projects to move forward that would cause a breach of this cumulative ceiling, as this would more quickly deplete the limited regional envelope. FRM also clears each individual regional project and hence would carefully monitor any unexpected impacts from this cumulative ceiling. At the IDA15 Mid-Term Review, management will present a review of the regional project program, report on experience with the scaling up of regional projects, and propose adjustments to the proposed ceiling on country contributions if necessary. 39 The analysis relates to FY06 and FY07 for which the regional project data is more relevant. FY08
figures are less representative because of the constraints relative to the final year of the IDA replenishment: countries that have frontloaded have fewer resources to contribute to regional projects.
40 Defining countries with small allocations by using a cutoff could also create problems during implementation. For example, if countries below SDR10 million are designated “small allocations countries,” a country with SDR11 million would not benefit from the ceiling even though its allocation is not substantially different from the countries with SDR10 million.
41 Figure 5 reports FY09 and FY10 for which the regional pipeline data is more concrete. 42 Countries are likely to reach the ceiling because of the limited size of their allocations, size of regional
project, and/or due to the number of regional projects in which they participate.

- 18 -
Figure 5: Projected Impact of a Ceiling of 20 percent on Country Contributions to Regional Projects
FY09
0%
20%
40%
60%
80%
100%
120%Sh
are
of a
lloca
tion
to
finan
ce re
gion
al p
roje
cts
0
20
40
60
80
100
SDR
mill
ions
Country contribution to regional project Share of allocation
FY10
0%
20%
40%
60%
80%
100%
120%
Shar
e of
allo
catio
n to
fin
ance
regi
onal
pro
ject
0
20
40
60
80
100
SDR
mill
ions
Country contribution to regional project Share of allocation
Allocation Size LargeSmall
20 percent ceiling
Allocation Size LargeSmall
20 percent ceiling
FY09
0%
20%
40%
60%
80%
100%
120%Sh
are
of a
lloca
tion
to
finan
ce re
gion
al p
roje
cts
0
20
40
60
80
100
SDR
mill
ions
Country contribution to regional project Share of allocation
FY10
0%
20%
40%
60%
80%
100%
120%
Shar
e of
allo
catio
n to
fin
ance
regi
onal
pro
ject
0
20
40
60
80
100
SDR
mill
ions
Country contribution to regional project Share of allocation
Allocation Size LargeSmall Allocation Size LargeSmall
20 percent ceiling
Allocation Size LargeSmall Allocation Size LargeSmall
20 percent ceiling
VI. ISSUES FOR DISCUSSION
• Do Deputies agree that Option II, the additive formula, is the preferred option?
• Do Deputies agree with increasing the base allocations to all countries from SDR1.1 million per year (or SDR3.3 million per replenishment) to SDR1.5 million per year (or SDR4.5 million per replenishment) and the per capita cap on allocations from SDR13.2 (US$20) to SDR19.8 (or US$30) for the benefit of the small states?
• Do Deputies agree to a ceiling of 20 percent on the country contributions to
regional projects for the benefit of countries with small IDA allocations?

- 19 -
ANNEX 1. EVOLUTION OF THE IDA PERFORMANCE BASED ALLOCATION FORMULA (IDA11-13)
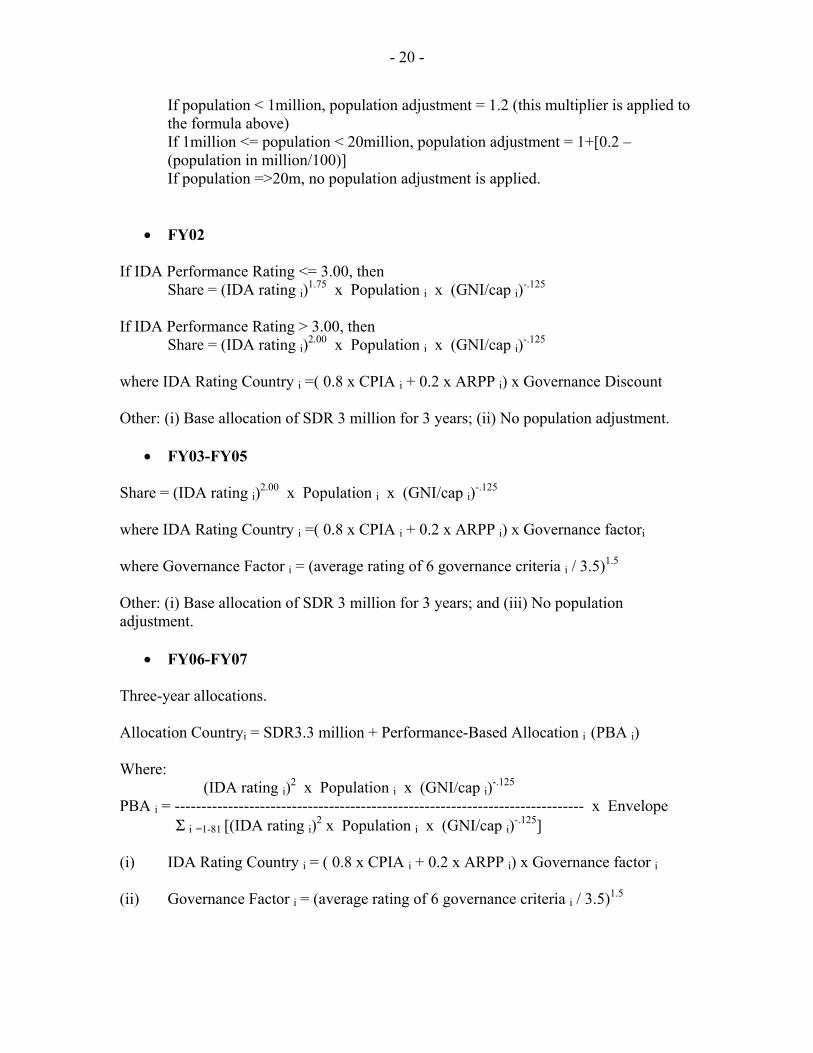
1. This annex provides describes the modifications in the PBA formula since the IDA11 period.43
• FY97-98 Share = (IDA rating i)1.8 x Population i x (GNI/cap i)-0.25 Where IDA Rating = CPIA and base allocation of SDR3 million for 3 years.
• FY99 If IDA Performance Rating <= 2.00, then
Share = (IDA rating i)0.5 x Population i x (GNI/cap i)-.125 If 2.00 < IDA Performance Rating <= 2.90, then
Share = (IDA rating i)1.6 x Population i x (GNI/cap i)-.125 If IDA Performance Rating > 2.90, then
Share = (IDA rating i)1.95 x Population i x (GNI/cap i)-.125 Where IDA Rating = CPIA and base allocation of SDR 3 million for 3 years.
• FY00-01 If IDA Performance Rating <= 3.00, then
Share = (IDA rating i)1.75 x Population i x (GNI/cap i)-.125 If IDA Performance Rating > 3.00, then
Share = (IDA rating i)2.00 x Population i x (GNI/cap i)-.125 Where IDA Rating for Country i = (0.8 x CPIA i + 0.2 x ARPP i) x Governance Discount Other: (i) Base allocation of SDR 3 million for 3 years. In addition, there was a population adjustment. If IDA Performance Rating <= 3, no population adjustment is applied If IDA Performance Rating > 3, then:
43 This annex draws from Moorty, L. and A. Orzan (2007). "Do IDA Resources Flow to Better-
Performing Countries?" Manuscript, The World Bank.
- 20 -
If population < 1million, population adjustment = 1.2 (this multiplier is applied to the formula above) If 1million <= population < 20million, population adjustment = 1+[0.2 – (population in million/100)]
If population =>20m, no population adjustment is applied.
• FY02 If IDA Performance Rating <= 3.00, then
Share = (IDA rating i)1.75 x Population i x (GNI/cap i)-.125 If IDA Performance Rating > 3.00, then
Share = (IDA rating i)2.00 x Population i x (GNI/cap i)-.125 where IDA Rating Country i =( 0.8 x CPIA i + 0.2 x ARPP i) x Governance Discount Other: (i) Base allocation of SDR 3 million for 3 years; (ii) No population adjustment.
• FY03-FY05 Share = (IDA rating i)2.00 x Population i x (GNI/cap i)-.125 where IDA Rating Country i =( 0.8 x CPIA i + 0.2 x ARPP i) x Governance factori where Governance Factor i = (average rating of 6 governance criteria i / 3.5)1.5 Other: (i) Base allocation of SDR 3 million for 3 years; and (iii) No population adjustment.
• FY06-FY07 Three-year allocations. Allocation Countryi = SDR3.3 million + Performance-Based Allocation i (PBA i) Where:
(IDA rating i)2 x Population i x (GNI/cap i)-.125 PBA i = ----------------------------------------------------------------------------- x Envelope Σ i =1-81 [(IDA rating i)2 x Population i x (GNI/cap i)-.125] (i) IDA Rating Country i = ( 0.8 x CPIA i + 0.2 x ARPP i) x Governance factor i (ii) Governance Factor i = (average rating of 6 governance criteria i / 3.5)1.5

- 21 -
(iii) The Envelope = IDA three-year envelope, after deduction of the otherwise determined blend allocations as well as the allocations to eligible post-conflict countries.
(iv) The country performance-based allocation is subject to a maximum of $20 per capita per annum.
• FY08 Three-year allocations. Allocation Countryi = SDR3.3 million + Performance-Based Allocation i (PBA i) Where:
(IDA rating i)2 x Population i x (GNI/cap i)-.125 PBA i = ----------------------------------------------------------------------------- x Envelope Σ i =1-81 [(IDA rating i)2 x Population i x (GNI/cap i)-.125] (i) IDA Rating Country i = (0.8 x CPIA i + 0.2 x ARPP i) x Governance factor i (ii) Governance Factor i = (average rating of 5 governance criteria i / 3.5)1.5
Procurement factor dropped from the calculation of the governance factor due to changes in the way the portfolio performance ratings are calculated.
(iii) The Envelope = IDA three-year envelope, after deduction of the otherwise
determined blend allocations as well as the allocations to eligible post-conflict countries.
(iv) The country performance-based allocation is subject to a maximum of $20 per capita per annum. (v) The portfolio ratings are calculated using (a) using actual problem projects instead of actual plus potential problem projects; (b) using the average data on actual problem projects at the end of four quarters rather than an end-year snapshot; and (c) revising the conversion scale used to convert the percent of projects at risk into a rating.

- 22 -
ANNEX 2: IDA15 PROJECTIONS UNDER THE CURRENT PBA FORMULA AND SIMPLIFICATION OPTIONS
IDA15 a/b/ IDA15 a/b/ IDA15 a/b/
Option I compared to
Current
Option II compared to
Current
Current Option I Option II % %
Africa Africa Regional 960.0 960.0 960.0 0.0% 0.0% Angola 156.0 156.0 156.0 0.0% 0.0% Benin 153.8 154.4 153.0 0.4% -0.5% Burkina Faso 320.9 320.1 318.3 -0.3% -0.8% Burundi 157.2 157.2 157.2 0.0% 0.0% Cameroon 192.8 193.4 192.1 0.3% -0.4% Cape Verde 22.0 21.9 21.9 -0.3% -0.2% Central African Republic 18.0 18.1 18.0 0.0% 0.0% Chad 27.3 27.3 27.3 -0.2% 0.1% Comoros 3.8 3.7 3.8 -2.2% 0.8% Congo, DR 719.8 719.7 720.1 0.0% 0.0% Congo, Republic of 52.2 52.2 52.2 0.0% 0.0% Cote d'Ivoire 214.4 214.4 214.3 0.0% 0.0% Eritrea 41.5 41.3 41.6 -0.6% 0.1% Ethiopia 1562.7 1570.1 1551.2 0.5% -0.7% Gambia, The 13.2 13.3 13.1 0.6% -0.9% Ghana 851.0 852.0 848.4 0.1% -0.3% Guinea 33.0 33.1 33.1 0.3% 0.4% Guinea-Bissau 11.2 11.1 11.1 -0.9% -0.5% Kenya 857.3 855.4 851.1 -0.2% -0.7% Lesotho 39.6 39.7 39.3 0.4% -0.7% Liberia 68.6 68.6 68.6 0.0% 0.0% Madagascar 445.6 447.8 442.2 0.5% -0.8% Malawi 278.2 279.0 275.9 0.3% -0.8% Mali 361.7 363.3 358.9 0.4% -0.8% Mauritania 19.1 19.1 19.2 0.1% 0.7% Mozambique 316.6 315.6 315.7 -0.3% -0.3% Niger 232.3 233.1 230.3 0.4% -0.8% Nigeria 1680.7 1678.9 1692.8 -0.1% 0.7% Rwanda 221.9 222.4 221.1 0.2% -0.4% Sao Tome and Principe 3.0 3.0 2.9 0.3% -0.4% Senegal 266.8 268.4 263.9 0.6% -1.1% Sierra Leone 56.7 56.6 56.3 -0.3% -0.8% Somalia 0.0 0.0 0.0 0.0% 0.0% Sudan 118.0 118.1 118.1 0.1% 0.1% Tanzania 1521.9 1523.2 1517.6 0.1% -0.3% Togo 71.7 71.8 71.7 0.0% 0.0% Uganda 778.0 776.5 786.2 -0.2% 1.1% Zambia 166.0 166.3 164.5 0.2% -0.9% Zimbabwe 10.4 10.4 10.4 0.0% 0.0%

- 23 -
IDA15 a/b/ IDA15 a/b/ IDA15 a/b/
Option I compared to
Current
Option II compared to
Current
Current Option I Option II % %
Arrears Clearance 355.9 355.9 355.9 0.0% 0.0% Subtotal 13381.0 13392.0 13355.6 0.1% -0.2% East Asia East Asia Regional 48.0 48.0 48.0 0.0% 0.0% Cambodia 130.9 130.7 131.6 -0.2% 0.5% Kiribati 4.1 4.1 4.1 0.0% 0.0% Lao PDR 49.3 49.2 49.6 -0.2% 0.7% Mongolia 51.8 51.8 51.5 0.0% -0.6% Myanmar 0.0 0.0 0.0 Papua New Guinea 66.9 67.7 67.3 1.3% 0.6% Samoa 7.9 7.9 7.9 0.0% 0.0% Solomon Islands 5.5 5.4 5.6 -2.0% 1.2% Timor-Leste 9.1 9.1 9.1 0.0% 0.0% Tonga 3.2 3.2 3.2 -0.3% 0.1% Vanuatu 5.9 5.9 5.9 0.3% -0.3% Vietnam 2508.5 2511.6 2497.5 0.1% -0.4% Subtotal 2891.1 2894.7 2881.3 0.1% -0.3% South Asia Afghanistan 483.8 483.8 483.9 0.0% 0.0% Bangladesh 1918.4 1908.8 1953.7 -0.5% 1.8% Bhutan 21.5 21.6 21.4 0.4% -0.7% India 2829.6 2829.6 2829.6 0.0% 0.0% Maldives 11.2 11.2 11.1 0.2% -0.5% Nepal 448.0 448.5 444.9 0.1% -0.7% Pakistan 1800.0 1800.0 1800.0 0.0% 0.0% Sri Lanka 442.2 444.3 438.7 0.5% -0.8% Subtotal 7954.7 7947.9 7983.3 -0.1% 0.4% ECA ECA Regional 48.0 48.0 48.0 0.0% 0.0% Armenia 111.3 111.2 111.7 -0.2% 0.3% Azerbaijan 158.6 158.4 159.8 -0.1% 0.8% Bosnia-Herzegovina 74.8 74.6 74.3 -0.3% -0.7% Georgia 148.1 147.8 147.4 -0.2% -0.4% Kosovo 19.8 19.8 19.8 0.0% 0.0% Kyrgyz Republic 66.4 65.6 68.8 -1.1% 3.7% Moldova 73.6 73.6 74.0 -0.1% 0.5% Tajikistan 62.5 61.6 65.1 -1.4% 4.2% Uzbekistan 143.8 142.1 145.7 -1.2% 1.4% Subtotal 906.8 902.6 914.7 -0.5% 0.9% LAC Bolivia 115.2 111.4 114.1 -3.3% -0.9%

- 24 -
IDA15 a/b/ IDA15 a/b/ IDA15 a/b/
Option I compared to
Current
Option II compared to
Current
Current Option I Option II % %
Dominica 2.8 2.8 2.8 0.0% 0.0% Grenada 4.2 4.2 4.2 0.0% 0.0% Guyana 7.1 7.1 7.1 -0.2% 0.4% Haiti 30.9 30.4 32.0 -1.6% 3.7% Honduras 153.6 153.7 152.9 0.1% -0.5% Nicaragua 109.1 109.3 108.6 0.2% -0.4% St. Lucia 6.5 6.5 6.5 0.0% 0.0% St. Vincent & the Grenadines 4.7 4.7 4.7 0.0% 0.0% OECS Countries 48.0 48.0 48.0 0.0% 0.0% Subtotal 482.2 478.2 481.2 -0.8% -0.2% MNA Djibouti 9.4 9.4 9.5 -0.7% 0.4% Yemen, Republic of 231.8 232.0 232.3 0.1% 0.2% Subtotal 241.2 241.3 241.7 0.1% 0.2% Regional Set Aside non-AFR 96.0 96.0 96.0 0.0% 0.0% Hard Term Lending 346.1 346.4 345.4 0.1% -0.2% Total 26299.2 26299.2 26299.2 0.0% 0.0%
Notes: a/ All amounts are net of grant discounts and of debt service due (MDRI). Projected country allocations presented under the current formula differ from those presented in the June meeting because they are based on updated performance ratings, incorporate newly agreed assumptions on post-conflict and re-engagement country allocations, take into account anticipated graduations of countries from IDA and include the proposed scale up of regional projects. . b/ IDA15 projections assume a 20 percent increase in commitment authority and the same country indicators as in FY08.

- 25 -
ANNEX 3: SIMULATED IMPACT OF AN INCREASE IN THE BASE ALLOCATION ON SMALL
STATES
Current Formula
Minimum Allocation Raised to SDR1.5 Million
and Cap at
SDR13.2 pcpa
Minimum Allocation Raised to SDR1.5 Million
and Cap at
SDR19.8 pcpa
Minimum Allocation Raised to SDR1.5 Million
and Cap at
SDR13.2 pcpa
Minimum Allocation Raised to SDR1.5 Million
and Cap at
SDR19.8 pcpa Population
Country Performance
Ratings SDR m SDR m SDR m Percent Percent millions Africa Africa Regional 960.0 960.0 960.0 0.0% 0.0% Angola 156.0 156.1 156.1 0.1% 0.1% 16.4 1.5 Benin 153.8 154.2 153.5 0.3% -0.2% 8.7 3.3 Burkina Faso 320.9 320.8 319.5 0.0% -0.5% 13.6 3.6 Burundi 157.2 157.3 157.3 0.1% 0.1% 7.8 2.1 Cameroon 192.8 193.2 192.3 0.2% -0.3% 16.7 2.6 Cape Verde 22.0 22.1 23.6 0.4% 7.6% 0.5 4.6 Central African Republic 18.0 18.1 18.0 0.0% 0.0% 4.1 1.2 Chad 27.3 28.3 28.1 3.6% 2.7% 10.0 1.5 Comoros 3.8 4.7 4.7 24.4% 23.8% 0.6 1.3 Congo, DR 719.8 718.4 718.4 -0.2% -0.2% 59.3 1.5 Congo, Republic of 52.2 52.4 52.4 0.4% 0.4% 4.1 2.0 Cote d'Ivoire 214.4 214.4 214.4 0.0% 0.0% 18.5 1.5 Eritrea 41.5 42.6 42.2 2.4% 1.7% 4.5 1.8 Ethiopia 1562.7 1558.4 1552.1 -0.3% -0.7% 72.7 3.1 Gambia, The 13.2 14.3 14.2 8.2% 7.5% 1.6 2.3 Ghana 851.0 850.4 878.0 -0.1% 3.2% 22.6 4.5 Guinea 33.0 33.9 33.6 2.7% 1.7% 9.6 1.9 Guinea-Bissau 11.2 12.1 12.0 8.0% 7.5% 1.6 1.8 Kenya 857.3 855.6 852.1 -0.2% -0.6% 35.1 3.4 Lesotho 39.6 40.5 40.3 2.3% 1.9% 1.8 3.4 Liberia 68.6 68.6 68.6 0.0% 0.0% 3.4 .. Madagascar 445.6 445.0 442.9 -0.1% -0.6% 19.1 3.4 Malawi 278.2 278.2 277.0 0.0% -0.4% 13.2 3.2 Mali 361.7 361.5 359.8 -0.1% -0.5% 13.9 3.6 Mauritania 19.1 20.0 19.9 4.8% 3.9% 3.2 2.5 Mozambique 316.6 316.5 315.0 0.0% -0.5% 20.2 2.8 Niger 232.3 232.5 231.5 0.1% -0.3% 14.4 2.8 Nigeria 1680.7 1676.2 1669.5 -0.3% -0.7% 144.7 2.3 Rwanda 221.9 222.1 221.2 0.1% -0.3% 9.2 3.5 Sao Tome and Principe 3.0 3.9 3.9 31.2% 30.5% 0.2 2.3 Senegal 266.8 266.7 265.3 0.0% -0.6% 11.9 3.8 Sierra Leone 56.7 57.6 57.3 1.5% 1.0% 5.6 2.2 Somalia 0.0 0.0 0.0 0.0% 0.0% 8.5 .. Sudan 118.0 118.0 118.0 0.0% 0.0% 37.0 1.3 Tanzania 1521.9 1520.6 1542.7 -0.1% 1.4% 38.3 4.4 Togo 71.7 71.8 71.7 0.0% 0.0% 6.3 1.2

- 26 -
Current Formula
Minimum Allocation Raised to SDR1.5 Million
and Cap at
SDR13.2 pcpa
Minimum Allocation Raised to SDR1.5 Million
and Cap at
SDR19.8 pcpa
Minimum Allocation Raised to SDR1.5 Million
and Cap at
SDR13.2 pcpa
Minimum Allocation Raised to SDR1.5 Million
and Cap at
SDR19.8 pcpa Population
Country Performance
Ratings SDR m SDR m SDR m Percent Percent millions Uganda 778.0 776.2 772.6 -0.2% -0.7% 29.9 3.6 Zambia 166.0 166.5 165.6 0.3% -0.3% 11.9 2.9 Zimbabwe 10.4 10.4 10.4 0.0% 0.0% 13.1 0.7 IDA Arrears Clearance 355.9 355.9 355.9 0.0% 0.0% Subtotal 13381.0 13375.7 13391.4 0.0% 0.1% East Asia East Asia Regional 48.0 48.0 48.0 0.0% 0.0% Cambodia 130.9 131.6 131.0 0.5% 0.1% 14.4 2.1 Indonesia 0.0 0.0 0.0 0.0% 0.0% 223.9 3.2 Kiribati 4.1 4.1 5.7 0.0% 37.5% 0.1 2.7 Lao PDR 49.3 50.0 49.8 1.6% 1.2% 5.8 2.1 Mongolia 51.8 52.6 52.4 1.7% 1.3% 2.6 3.2 Myanmar 0.0 0.0 0.0 0.0% 0.0% 51.0 .. Papua New Guinea 66.9 67.8 67.5 1.3% 0.9% 6.0 2.4 Samoa 7.9 7.9 11.6 0.0% 46.0% 0.2 4.7 Solomon Islands 5.5 6.4 6.4 16.7% 16.2% 0.5 1.9 Timor-Leste 9.1 9.7 9.7 6.1% 6.1% 1.0 1.8 Tonga 3.2 3.4 4.1 5.0% 28.2% 0.1 2.1 Vanuatu 5.9 7.1 7.0 19.3% 18.9% 0.2 2.6 Vietnam 2508.5 2501.2 2491.1 -0.3% -0.7% 84.1 3.8 Subtotal 2891.1 2889.7 2884.4 -0.2% -0.2% South Asia Afghanistan 483.8 483.8 483.8 0.0% 0.0% 28.8 1.4 Bangladesh 1918.4 1913.1 1905.4 -0.3% -0.7% 144.4 2.5 Bhutan 21.5 22.1 22.3 2.5% 3.6% 0.6 4.4 India 2829.6 2829.6 2829.6 0.0% 0.0% 1124.7 4.1 Maldives 11.2 12.3 12.3 10.0% 9.6% 0.3 3.7 Nepal 448.0 447.4 445.6 -0.1% -0.5% 27.7 2.9 Pakistan 1800.0 1800.0 1800.0 0.0% 0.0% 159.0 3.1 Sri Lanka 442.2 441.7 439.8 -0.1% -0.5% 19.7 3.5 Subtotal 7954.7 7950.0 7938.9 -0.3% -0.2% ECA ECA Regional 48.0 48.0 48.0 0.0% 0.0% Armenia 111.3 112.1 111.6 0.7% 0.2% 3.0 4.6 Azerbaijan 158.6 159.1 158.5 0.4% -0.1% 8.5 3.3

- 27 -
Current Formula
Minimum Allocation Raised to SDR1.5 Million
and Cap at
SDR13.2 pcpa
Minimum Allocation Raised to SDR1.5 Million
and Cap at
SDR19.8 pcpa
Minimum Allocation Raised to SDR1.5 Million
and Cap at
SDR13.2 pcpa
Minimum Allocation Raised to SDR1.5 Million
and Cap at
SDR19.8 pcpa Population
Country Performance
Ratings SDR m SDR m SDR m Percent Percent millions Bosnia-Herzegovina 74.8 75.6 75.3 1.2% 0.7% 3.9 3.4 Georgia 148.1 148.7 148.1 0.4% 0.0% 4.4 4.3 Kosovo 19.8 19.8 19.8 0.0% 0.0% 2.0 .. Kyrgyz Republic 66.4 67.1 66.8 1.1% 0.7% 5.2 2.6 Moldova 73.6 74.5 74.2 1.2% 0.8% 3.4 3.3 Tajikistan 62.5 63.2 63.0 1.2% 0.8% 6.6 2.2 Uzbekistan 143.8 144.4 143.8 0.4% 0.0% 26.5 1.6 Subtotal 906.8 912.5 909.0 1.0% 0.2% MNA Djibouti 9.4 10.3 10.3 9.6% 9.1% 0.8 2.3 Yemen, Republic of 231.8 232.0 231.1 0.1% -0.3% 19.8 2.5 Subtotal 241.2 242.4 241.4 0.7% 0.1% LAC OECS 48.0 48.0 48.0 0.0% 0.0% Bolivia 115.2 115.7 114.9 0.4% -0.2% 9.2 3.2 Dominica 2.8 2.8 4.3 0.0% 50.0% 0.1 4.0 Grenada 4.2 4.2 6.3 0.0% 50.0% 0.1 3.9 Guyana 7.1 8.1 8.1 14.0% 13.2% 0.8 2.9 Haiti 30.9 31.9 31.6 3.1% 2.4% 8.5 1.7 Honduras 153.6 154.0 153.2 0.3% -0.2% 7.2 3.8 Nicaragua 109.1 109.7 109.2 0.6% 0.1% 5.5 3.5 St. Lucia 6.5 6.5 9.1 0.0% 39.6% 0.2 4.5 St. Vincent & the Grenadines 4.7 4.7 7.1 0.0% 50.0% 0.1 4.2 Subtotal 482.2 485.7 491.9 4.4% 2.0% Total Unallocated regional 96.0 96.0 96.0 0.0% 0.0% Hard term lending 346.1 347.2 346.2 0.3% 0.0% Grand Total 26299.2 26299.2 26299.2 0.0% 0.0% Notes: All amounts are net of grant discounts and of debt service due (MDRI). IDA15 projections assume a 20 percent increase in commitment authority and the same country indicators as in FY08. In addition, it takes into account the anticipated graduations of countries from IDA, the proposals made in accompanying papers on fragile states and arrears clearance, and the proposed scale up of regional projects.
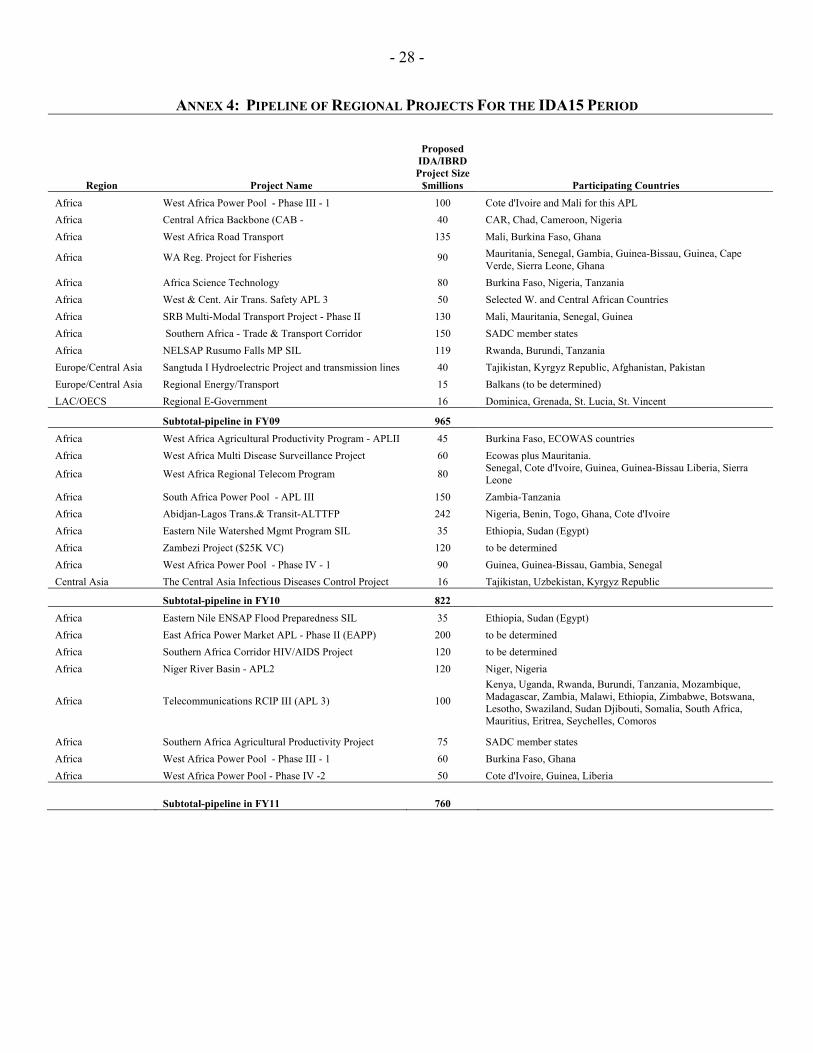
- 28 -
ANNEX 4: PIPELINE OF REGIONAL PROJECTS FOR THE IDA15 PERIOD
Region Project Name
Proposed IDA/IBRD Project Size
$millions Participating Countries Africa West Africa Power Pool - Phase III - 1 100 Cote d'Ivoire and Mali for this APL Africa Central Africa Backbone (CAB - 40 CAR, Chad, Cameroon, Nigeria Africa West Africa Road Transport 135 Mali, Burkina Faso, Ghana
Africa WA Reg. Project for Fisheries 90 Mauritania, Senegal, Gambia, Guinea-Bissau, Guinea, Cape Verde, Sierra Leone, Ghana
Africa Africa Science Technology 80 Burkina Faso, Nigeria, Tanzania Africa West & Cent. Air Trans. Safety APL 3 50 Selected W. and Central African Countries Africa SRB Multi-Modal Transport Project - Phase II 130 Mali, Mauritania, Senegal, Guinea Africa Southern Africa - Trade & Transport Corridor 150 SADC member states Africa NELSAP Rusumo Falls MP SIL 119 Rwanda, Burundi, Tanzania Europe/Central Asia Sangtuda I Hydroelectric Project and transmission lines 40 Tajikistan, Kyrgyz Republic, Afghanistan, Pakistan Europe/Central Asia Regional Energy/Transport 15 Balkans (to be determined) LAC/OECS Regional E-Government 16 Dominica, Grenada, St. Lucia, St. Vincent
Subtotal-pipeline in FY09 965 Africa West Africa Agricultural Productivity Program - APLII 45 Burkina Faso, ECOWAS countries Africa West Africa Multi Disease Surveillance Project 60 Ecowas plus Mauritania.
Africa West Africa Regional Telecom Program 80 Senegal, Cote d'Ivoire, Guinea, Guinea-Bissau Liberia, Sierra Leone
Africa South Africa Power Pool - APL III 150 Zambia-Tanzania Africa Abidjan-Lagos Trans.& Transit-ALTTFP 242 Nigeria, Benin, Togo, Ghana, Cote d'Ivoire Africa Eastern Nile Watershed Mgmt Program SIL 35 Ethiopia, Sudan (Egypt) Africa Zambezi Project ($25K VC) 120 to be determined Africa West Africa Power Pool - Phase IV - 1 90 Guinea, Guinea-Bissau, Gambia, Senegal Central Asia The Central Asia Infectious Diseases Control Project 16 Tajikistan, Uzbekistan, Kyrgyz Republic
Subtotal-pipeline in FY10 822 Africa Eastern Nile ENSAP Flood Preparedness SIL 35 Ethiopia, Sudan (Egypt) Africa East Africa Power Market APL - Phase II (EAPP) 200 to be determined Africa Southern Africa Corridor HIV/AIDS Project 120 to be determined Africa Niger River Basin - APL2 120 Niger, Nigeria
Africa Telecommunications RCIP III (APL 3) 100 Kenya, Uganda, Rwanda, Burundi, Tanzania, Mozambique, Madagascar, Zambia, Malawi, Ethiopia, Zimbabwe, Botswana, Lesotho, Swaziland, Sudan Djibouti, Somalia, South Africa, Mauritius, Eritrea, Seychelles, Comoros
Africa Southern Africa Agricultural Productivity Project 75 SADC member states Africa West Africa Power Pool - Phase III - 1 60 Burkina Faso, Ghana Africa West Africa Power Pool - Phase IV -2 50 Cote d'Ivoire, Guinea, Liberia
Subtotal-pipeline in FY11 760
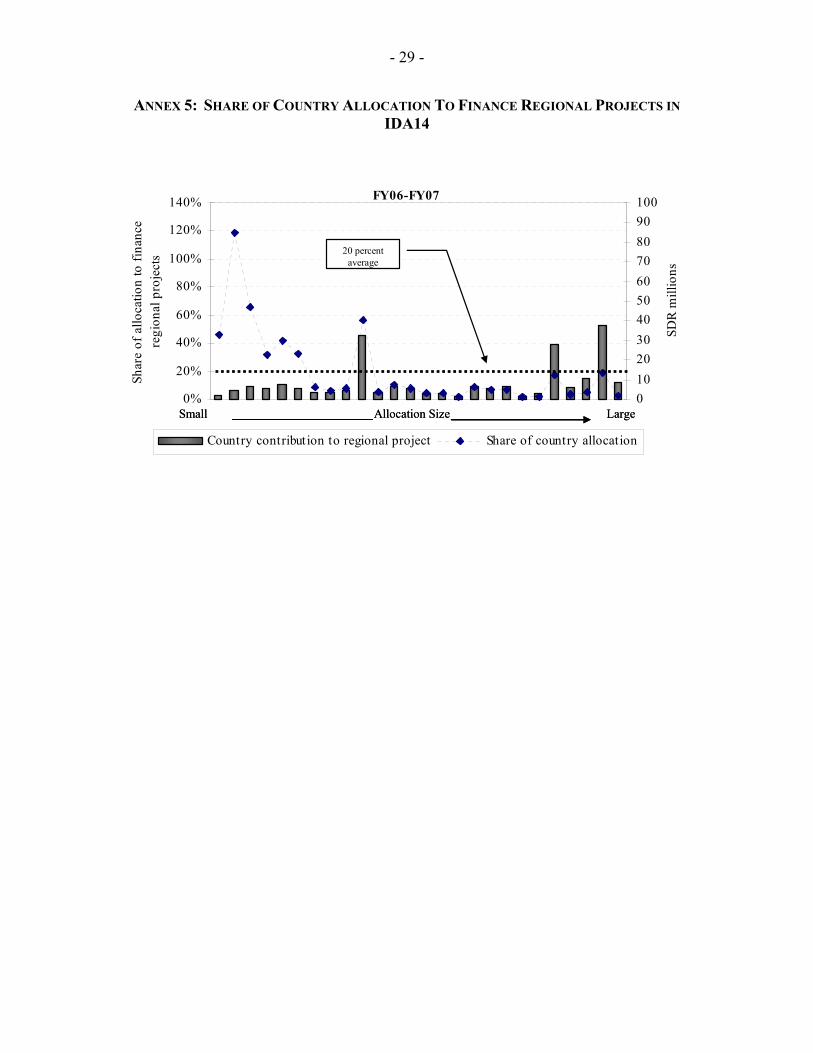
- 29 -
ANNEX 5: SHARE OF COUNTRY ALLOCATION TO FINANCE REGIONAL PROJECTS IN IDA14
FY06-FY07
0%
20%
40%
60%
80%
100%
120%
140%
Shar
e of
allo
catio
n to
fina
nce
regi
onal
pro
ject
s
0102030405060708090100
SDR
mill
ions
Country contribution to regional project Share of country allocation
20 percent average
Allocation Size LargeSmall
FY06-FY07
0%
20%
40%
60%
80%
100%
120%
140%
Shar
e of
allo
catio
n to
fina
nce
regi
onal
pro
ject
s
0102030405060708090100
SDR
mill
ions
Country contribution to regional project Share of country allocation
20 percent average
Allocation Size LargeSmall Allocation Size LargeSmall