Embed Size (px)
Citation preview

FP6-027026, K-Space
ID4.4.1: State of the Art Report on Multimedia Mining
1
ID4.4.1
State of the Art Report on Multimedia Mining
Please enter the relevant fields in ‘File/Properties’, ‘Summary’ tab. Complete the table below, using only one A4 page.
Contractual Date of Delivery to the EC:
-NA-
Actual Date of Delivery to the EC:
-NA-
Workpackage: WP4.4 Estimated Staff Months:
Dissemination Level: CO Nature: R
Approval Status: Pending Version: 13
Total Number of Pages: 61 Distribution List:
Filename: KS_ID42_GU_2006-11-02_State-of-the-Art-Multimedia-Mining.doc Keyword list: Multimedia Mining, Multimedia Indexing, Machine Learning,
Semantic Analysis, Clustering and Classification, Relevance Feedback, Latent.
Abstract Multimedia mining is a nascent area of research. Due to accumulation of large amounts of data, methods for the analysis and exploration of data are needed. Compared to textual or other structured domain, the application of multimedia data mining is limited. In this document, we review prominent techniques used in multimedia mining. The information in this document reflects only the author’s views and the European Community is not liable for any use that may be made of the information contained therein. The information in this document is provided as is and no guarantee or warranty is given that the information is fit for any particular purpose. The user thereof uses the information at its sole risk and liability.

FP6-027026, K-Space
ID4.4.1: State of the Art Report on Multimedia Mining
2
History
Version Date Reason Revised by
1 2006- Initial creation of document Joemon Jose (GU)
2 Introduction Joemon Jose (GU)
3 Section on Adaptive Retrieval/RF added
Jana Urban (GU)
4 2006-05-14 Section on Latent Semantic Indexing
Pavel Praks (UEP)
5 2006-07-11 Reference list updated Jana Urban (GU)
6 2006-07-12 Section on Indexing updated Jana Urban (GU)
7 2006-10-01 Corrections and formatting Reede Ren (GU)
8 2006-08-01 Section on Latent Semantic Indexing updated
Pavel Praks (UEP)
9 2006-08-04
Section on Relevance Feedback and Clustering updated
Krishna (QMUL)
10 2006-08-04 Final editing Joemon Jose (GU)
11 2006-11-03 Restructured document, corrections and formatting
Jana Urban (GU)
12 2006-11-21 Added Krishna’s corrections of Sections 5 (clustering) and 6 (RF)
Jana Urban (GU)
13 2206-11-23 Added JRS contribution Jana Urban (GU)

FP6-027026, K-Space
ID4.4.1: State of the Art Report on Multimedia Mining
3
Authors
Partner Name Phone / Fax / Email
GU
Joemon Jose +44 (0) 141 330 5653/
+44 (0) 141 330 4913/
GU
Jana Urban
+44 (0) 141 330 2788/
+44 (0) 141 330 4913/
GU
Reede Ren +44 (0) 141 330 2788/
+44 (0) 141 330 4913/
QMUL Krishna Chandramouli +44 (0) 20 7882 5352/
+44 (0) 20 7882 7997/
QMUL Divna Djordjevic +44 (0) 20 7882 7880/
+44 (0) 20 7882 7997/
UEP Pavel Praks + 420 777 053 57 2
+ 420 224 225 942
JRS Roland Mörzinger +43-(0)316- 876-1194
FP6-027026, K-Space
ID4.4.1: State of the Art Report on Multimedia Mining
4
Table of Content 1. INTRODUCTION ................................................................................................................ 9
1.1. DATA MINING .............................................................................................................................. 9 1.2. METHODS IN DATA MINING ......................................................................................................... 9 1.3. APPLICATIONS OF DATA MINING ............................................................................................... 10 1.4. MULTIMEDIA MINING ................................................................................................................ 10
1.4.1. Processing Text..................................................................................................................... 11 1.4.2. Processing Graphs ............................................................................................................... 11 1.4.3. Processing Images................................................................................................................ 11 1.4.4. Processing Audio.................................................................................................................. 11 1.4.5. Processing Video .................................................................................................................. 11
2. MULTIMEDIA INDEXING.............................................................................................. 12 2.1. INDEXING PROCESS .................................................................................................................... 12 2.2. IMAGE REPRESENTATION ........................................................................................................... 12
2.2.1. From Content-Based towards Concept-Based Features ...................................................... 13 2.2.2. Textual Features ................................................................................................................... 14 2.2.3. Primitive Content-Based Features........................................................................................ 15 2.2.4. Summary ............................................................................................................................... 20
3. MULTIMEDIA MINING AND LEARNING TECHNIQUES....................................... 20 3.1. DATA MINING AND MACHINE LEARNING................................................................................... 20
3.1.1. Knowledge Discovery in Databases and Data Mining......................................................... 20 3.1.2. Overview of Machine Learning ............................................................................................ 21 3.1.3. Data Mining vs. Machine Learning...................................................................................... 22
3.2. MACHINE LEARNING TECHNIQUES............................................................................................. 23 3.2.1. Top-down Induction of Decision Trees................................................................................. 23 3.2.2. Association Rules.................................................................................................................. 23 3.2.3. Decision Rules ...................................................................................................................... 24 3.2.4. Neural Networks ................................................................................................................... 25 3.2.5. Support Vector Machines ..................................................................................................... 25 3.2.6. Genetic Algorithms ............................................................................................................... 26 3.2.7. Instance-based Learning ...................................................................................................... 26 3.2.8. Bayesian Approach............................................................................................................... 26 3.2.9. Inductive Logic Programming.............................................................................................. 27
3.3. RELATED AREAS ........................................................................................................................ 27 3.3.1. (Explorative) data analysis................................................................................................... 27

FP6-027026, K-Space
ID4.4.1: State of the Art Report on Multimedia Mining
5
3.3.2. Pattern recognition............................................................................................................... 28 4. LATENT SEMANTIC INDEXING.................................................................................. 28
4.1. INFORMATION RETRIEVAL USING LINEAR ALGEBRA.................................................................. 28 4.2. BASIC CONCEPTS IN LSI ............................................................................................................ 30
4.2.1. The Singular Value Decomposition of the term matrix......................................................... 30 4.3. THE COMPUTATION OF THE SIMILARITY COEFFICIENTS BETWEEN TRANSFORMED DOCUMENTS . 31 4.4. IMAGE RETRIEVAL...................................................................................................................... 31 4.5. LATENT SEMANTIC INDEXING AND DOCUMENT MATRIX SCALING............................................ 32
5. CLASSIFICATION AND CLUSTERING ALGORITHMS .......................................... 33 5.1. INTRODUCTION........................................................................................................................... 34 5.2. DISTANCE AND SIMILARITY MEASURES..................................................................................... 34 5.3. CLUSTERING ALGORITHMS ........................................................................................................ 34
5.3.1. Partitioning Relocation Clustering....................................................................................... 35 5.3.2. Density Based Partitioning................................................................................................... 37
5.4. SUMMARY.................................................................................................................................. 39 6. RELEVANCE FEEDBACK PROCESS........................................................................... 39
6.1. LEARNING FROM RELEVANCE FEEDBACK .................................................................................. 40 6.2. ADAPTIVE INTERFACES .............................................................................................................. 41 6.3. RELEVANCE FEEDBACK LEARNING TECHNIQUES....................................................................... 42
6.3.1. Neural Network based Relevance Feedback......................................................................... 42 6.3.2. Bayesian Framework based Relevance Feedback ................................................................ 43 6.3.3. SVM based Relevance Feedback .......................................................................................... 44
6.4. EXISTING RELEVANCE FEEDBACK SYSTEMS.............................................................................. 46 6.4.1. PicHunter ............................................................................................................................. 46 6.4.2. PicSOM................................................................................................................................. 47
7. MULTIMEDIA MINING APPLICATIONS ................................................................... 48 7.1 IMAGE MINING .......................................................................................................................... 48 7.2. VIDEO MINING ........................................................................................................................... 49
7.2.1. Sports Videos ........................................................................................................................ 51 7.2.2. Medical Videos ..................................................................................................................... 51 7.2.3. Surveillance Videos .............................................................................................................. 51
7.3. USER BEHAVIOUR MINING......................................................................................................... 51 8. GENERAL CONCLUSION .............................................................................................. 52 9. RESEARCH GROUPS & SYSTEMS............................................................................... 52 10. REFERENCES ................................................................................................................... 54

FP6-027026, K-Space
ID4.4.1: State of the Art Report on Multimedia Mining
6
Executive Summary This document surveys the state-of-the-art in techniques for data mining. Data mining attempts to make sense of data by discovering patterns in data sets. It is motivated by the increasing amounts of digital data that is created and collected ubiquitously. The survey starts by introducing the main concepts of data mining, followed by typical features used for representing multimedia data. Many traditional machine learning techniques have been successfully applied to data mining, which are outlined in this survey. Thereafter, some special mining techniques for multimedia data are described. These include latent semantic indexing, clustering and relevance feedback. Finally, some applications areas are described and research groups are listed.

FP6-027026, K-Space
ID4.4.1: State of the Art Report on Multimedia Mining
7
Abbreviations and Acronyms BMU Best Matching Unit
CBIR Content-based Image Retrieval
CBVR Content-based Video Retrieval
EMD Earth Movers Distance
FDA Fisher’s Discriminative Analysis
FRBF Fuzzy Radial Basis Function
HTML HyperText Markup Language
LSI Latent Semantic Indexing
PCA Principal Component Analysis
QbE Query by Example
QBPE Query By Pictorial Example
RBF Radial Basis Function
RF Relevance Feedback
SNN Synergetic Neural Nets
SOM Self Organising Maps
SVD Singular Value Decomposition
SVM Support Vector Machine
TS-SOM Tree-Structured Self Organising Maps

FP6-027026, K-Space
ID4.4.1: State of the Art Report on Multimedia Mining
8
Glossary CBIR: Content-based image retrieval is the application of computer vision, to automatically extract contents of the images themselves, to the problem of searching for digital images in large databases.
Semantic gap: The gap between the low-level features used to represent visual documents and the high-level concepts the user has in mind when querying the data.
User Relevance Feedback: Relevance Feedback is a process in which human and system interactively refine the high-level query representation based on low-level features. In each iteration the user specifies (ir-)relevant documents which the system uses to update the query representation and internal matching parameters.
FP6-027026, K-Space
ID4.4.1: State of the Art Report on Multimedia Mining
9
1. Introduction Who(ever) has information fastest and uses it wins [Don McKeough, former president of Coca Cola]
1.1. Data Mining Large amounts of data are being created mainly due to the ever increasing technological power and the proliferation in the use of technology. Data, in general, is unstructured and unorganised except in the limited number of applications that employ well-designed databases. Mining or discovering “knowledge” in such large datasets is useful but at the same time very challenging from a technological perspective.
Data mining, a computer-assisted process of information exploration and analysis, seeks to discover hidden knowledge in data sets. Frawley [Frawley et al, 1992] specifies that knowledge discovery or data mining is a nontrivial extraction of previously unknown and potentially useful information from data. The mining process starts with exploring data sets in order to build a better understanding and characterization of the data. Data Mining incorporates techniques from machine learning, pattern recognition, statistics, information retrieval, databases, data visualization etc.
Data creation prowess was not developed together with any comparable techniques for data analysis. The accumulation of data has caused a need for analysing it and making use of the embedded knowledge. Improvements in computational power and developments in artificial intelligence, statistics and other allied fields make such mining a feasible process.
Data, in general, is mostly unstructured: that is not always organised into a database with well-designed formats. The first step in data mining is “exploration”: which involves cleaning the data, transforming the data, and selecting subsets of data. In this process data is being processed to generate data sets that are useful for data mining. The second step is “model building and validation”: In this step, various data models are proposed and evaluated by their predictive performance. The third step is “deployment”: The models selected in the previous step are deployed to the data set in question.
1.2. Methods in Data Mining In predictive data mining, the goal is to identify a statistical model or set of models that predict some response of interest. For example, an online book store may want to identify sudden changes in transaction behaviour or a credit card company may want transactions which have a high probability of being fraudulent. Two important techniques used in predictive data mining is bagging and boosting. The concept of bagging combines the predicted classifications (prediction) from multiple models, or from the same type of model for different learning data. Such a technique is also used to address the inherent instability of results when applying complex models to relatively small data sets. The concept of boosting is applied to generate multiple models or classifiers (for prediction or classification), and to derive weights to combine the predictions from those models into a single prediction or predicted classification.
Regression based models are used when we need to derive a predictive model in a non-symmetric way. There are two kinds of regression models: linear regression model for qualitative data; and logistic regression model for quantitative data.

FP6-027026, K-Space
ID4.4.1: State of the Art Report on Multimedia Mining
10
Another approach is using clustering (or unsupervised learning) which is efficient in finding the nearest neighbours of an item of interest in order form “natural groupings” of the data items. A number of clustering methods will be introduced and explained later in this document.
1.3. Applications of Data Mining Data mining is becoming more and more popular as a business information management tool. The technique reveals knowledge that can guide the process of decision making. One application is mining consumer behaviour from the customer transaction information (Market Basket Analysis). The knowledge obtained from such applications benefits the business (for example optimizing the layout, or taking products frequently sold together and locating them in close proximity). Another application is mining click-through data on a web site to find out general user behaviour and subsequently improve web site layout. One aspect is to monitor the click flow of the mouse and keys which the user employs to navigate the website. Usually every click of mouse corresponds to the viewing of a web page therefore we can define the click stream as the sequences of web pages requested. By analysing the click flow data, we can show the most likely navigation pattern on a website, and hence this information can be used to improve the layout. Another application is profiling visitors of the website. By analysing the web access data, we can classify the visitors into homogeneous groups on the basis of their behaviour. This will allow behaviour segmentation of users and can be useful for future marketing. These are just two example applications. Numerous other application areas exist, such as medicine (e.g., drug side effects), finance (e.g., stock market prediction), scientific discovery (e.g., superconductivity research) and engineering (e.g. fault detection).
1.4. Multimedia Mining The above section provided a brief introduction to the concepts of data mining. Multimedia mining applies machine learning, knowledge discovery and data mining approaches to multimedia data. The idea is to discover knowledge from large amounts of data in different media types. Application areas include the detection of unusual video events, which is important for both consumer video applications, such as sports highlights extraction and commercial message detection, as well as surveillance applications. Most of the work to date deals with mining feature sets for effective content representation mainly for the purpose of retrieval.
Applying data mining to multimedia data requires additional care. The main problem is how to analyze heterogeneous data that consists of (hyper-) text, graphs, images, sounds and videos. Multimedia data typically has a complex structure that cannot be processed as a whole by available data mining algorithms. Therefore, multimedia mining involves two basic steps:
• Extraction of appropriate features from the data; and • Selection of data mining methods to identify the desired information.
The high dimensionality of the feature spaces and the size of the multimedia datasets make feature extraction a difficult problem. There are two kinds of features: description-based and content-based. The former uses metadata such as keywords, caption, size and time of creation.
FP6-027026, K-Space
ID4.4.1: State of the Art Report on Multimedia Mining
11
The later is based on the content of the object itself [Kotsiantis et al, 2004]. In this section, we will give a brief outline of the available feature modalities, which include text, graphs, images, audio and video. Section 2 will introduce in more detail how each of these modalities is typically indexed.
1.4.1. Processing Text Unstructured text documents can be represented as:
• “bag-of-words”, for example, huge feature vectors, where each feature encodes the presence or absence of a word (term) from the dictionary common to all documents. Such vectors can then be analysed by a naive Bayesian classifier (to classify documents into one of a predefined groups – see e.g. [Grobelnig et al, 1998]), or by self organizing maps – a type of neural networks (to cluster documents according to topics – see e.g. [Kohonen, 1998])
• trees – if we consider the structure of documents as expressed e.g. using HTML tags • multi-valued attributes, which corresponds to some parts of the document instead of
single term. This approach was used for filtering e-mails [Cohen, 1996]
1.4.2. Processing Graphs Processing graphs or trees (e.g. organic molecules or web sites and HTML documents) has become an important part of research in the machine learning community. Graph structures are somewhere between classic attribute-value and multi-relational representation of training data. While for the former type a number of machine learning approaches are available, the latter type of data can be analysed only using ILP methods (see Section 3.2.9). The motivation for using graph representation in the area of machine learning is that a graph is more expressive than a flat representation and that directly learning from graphs is potentially more efficient than multi-relational learning.
1.4.3. Processing Images A number of approaches to image processing (partially coming from the field of pattern recognition) can be used for feature extraction. The tasks solved in image processing are texture analysis, line detection, edge detection, segmentation, region of interest processing. Tools that are used to solve these tasks are Fourier transformation, smoothing, color histograms, contour representation etc.
The images decomposed into segments or regions can then be represented in relational form (and machine learning algorithms can be applied).
1.4.4. Processing Audio Audio data play an important role in multimedia applications. Most frequently used features for audio processing are band energy, zero crossing rate, frequency centroid, band width and pitch period [Kotsiantis et al, 2004]. Audio signals can also be decomposed using wavelet transformation.
1.4.5. Processing Video Automatic segmentation, indexing, content-based retrieval and classification are tasks of digital video processing. High-level information from video includes detecting trigger events,
FP6-027026, K-Space
ID4.4.1: State of the Art Report on Multimedia Mining
12
determining patterns of activity, classifying activities into named categories, clustering and determining interactions between entities [Kotsiantis et al, 2004].
In the following sections, we will describe the tools and techniques used for multimedia mining and also provide an overview of multimedia data mining applications developed so far. Before introducing the various multimedia mining techniques however, it is essential to discuss how multimedia data is typically represented. The process of multimedia indexing, namely extracting and storing suitable representations of the data, precedes later data mining and exploration stages.
2. Multimedia Indexing Indexing is the process in which the data is prepared for mining and for efficient retrieval. Two kinds of features can be extracted: low-level features and concept based features (high-level indexing). Progress in this field is achieved within the context of content-based image/video retrieval systems (CBIR/CBVR).
2.1. Indexing Process The video indexing process consists of the following three steps [Idris et al, 1997]:
1. Shot segmentation: Before a document can be indexed it has to be decomposed into its building blocks. For video data the building blocks are shots. Each shot is represented using visual and temporal features. The visual features are extracted from a representative image in the shot, the keyframe. The shots themselves, or sequence of images within a shot, are analysed to extract temporal features.
2. Image pre-processing: Pre-processing includes operations such as decompression, enhancement, filtering, and normalisation. Often segmentation of the image is performed to attempt object recognition.
3. Feature extraction and representation: The aim of this stage is to represent the semantics of the image or video content. After the pre-processing stage, low-level visual features are extracted to represent the content of an image (or key frame). These include colour, texture, and shape features. If a segmentation into objects or regions of interest is available, the spatial layout can also play an important part to represent images. For video documents, the low-level features are extracted from key frames. In addition, temporal features can be extracted based on motion or camera operations. Furthermore, the audio stream can be analysed for spoken text, emotions, high-light detection in sports videos, etc.
To lay the grounds for further discussion of indexing and mining techniques, an overview of the fundamentals of image features is essential and will follow.
2.2. Image Representation Before being able to handle visual documents by the retrieval system, a suitable way of representation needs to be found. It is unreasonable to work with the whole image directly, since the amount of data is simply too large to be computationally manageable. Furthermore, for effective access, it is desirable to index the image by its most significant contents. Ideally, this
FP6-027026, K-Space
ID4.4.1: State of the Art Report on Multimedia Mining
13
would include objects the image contains, their layout and relationships among them. An image therefore needs to be transformed in a more compact representation that reflects significant features in the image. A feature vector (a line-up of different features) thus provides a compressed “view” of the image which emphasises certain attributes of the image. Along with the image representation, rules for comparing images have to be defined. These rules—referred to as similarity measures—are dependent on the feature space and usually each feature has its own measures. In summary, the features together with their similarity measures are crucial for the system’s efficiency and effectiveness.
In comparison, pre-processing in text retrieval systems involves splitting the original documents into tokens serving as units for indexing and subsequent matching between documents. Tokenising textual documents into words and phrases has proven to work reasonably well for retrieval purposes, since words carry some level of semantic meaning. In the visual domain, on the contrary, this is far from easy, since images cannot be readily decomposed into such semantic units. The content of an image can be described as the pixel distribution of certain colours, or the existence and direction of edges present in the image, for example. Such transformations from the space of image pixels to a feature space with better properties for retrieval and recognition—even though easy to automatically extract—lack a semantic interpretation.
Features for images today often include both textual features, such as keywords obtained from annotation, and visual features. Visual features are at the core of content-based retrieval and since a huge amount of work has gone into feature extraction, a large variety of visual features have been proposed. Some of those are general features, such as colour, texture and shape. Others have been developed for a specific recognition task or special domain, such as face recognition [Pentland et al., 1994] and trademarks [Eakins, 2001]. However, it has to be born in mind that due to many difficulties including perception subjectivity, one universally good feature set does not exist.
The remainder of this section will discuss the development of features used for image retrieval. The features involved in each of the three “evolutionary” steps will be covered: from textual, to generic low-level (and hence most often used), and finally “semantic” or concept-based features.
2.2.1. From Content-Based towards Concept-Based Features CBIR is considered to lie at the crossroads of many research areas. While it was mainly driven by image processing and computer vision at the early stages, artificial intelligence and human computer interaction have influenced its more recent advances. This shift of interest has been triggered by the inability of finding an acceptable solution to the image understanding problem, which is the core of successful semantic retrieval. Even after decades of research in computer vision for image retrieval, object recognition in generic heterogeneous image collections remains a seemingly insurmountable challenge. After an initial euphoria of purely content-based retrieval systems [Flickner et al, 1995] replacing the labour-intensive and expensive manual indexing procedures [Tamura et al, 1984] preceding systems have been relying on, the existence of the semantic gap [Smeulders et al, 2000] between low-level features and the user finally had to be admitted. This gap has indeed been the reason for most of the disappointment in CBIR research. It is considered as probably the most challenging problem for CBIR systems. At the same time, the need to provide semantic-level interaction between users and content has been proven to be of vital importance. In each of the few existing user studies [Garber et al, 1992, Markkula et al, 2000] it has become apparent that the ability to query images based on semantic concepts is necessary for acceptability and effective practical applicability of image retrieval systems. Today, this need has moved towards the centre of current research directions.
FP6-027026, K-Space
ID4.4.1: State of the Art Report on Multimedia Mining
14
However, that does not mean that research in CBIR has come to a halt. On the contrary, researchers in the field are pushing the boundaries and are exploring new dimensions. The problems of fully automatic image understanding that computer vision is still trying to solve, have proven to be less critical for image retrieval purposes. The reason for this is that retrieval systems can exploit the knowledge of the user. Since recognising this fact, more and more inspiration has been taken from research in artificial intelligence and human computer interaction. Artificial intelligence research has driven the advance in machine learning, i.e. the problem of devising computer programs that automatically improve with experience. In the case of image retrieval applications this problem can be formulated as: Can we teach the computer to infer semantics from the low-level feature representation? Most of the proposed CBIR systems today encompass some sort of learning, in which the experience is drawn from the user’s interaction with the system. Consequently, this has also led to borrowing ideas from the human computer interaction research community. It has become apparent that providing an intuitive and interactive environment, in which the system assists the user while browsing or searching, can improve the system’s overall effectiveness in many ways and also compensate for its shortcomings due to the semantic gap.
According to Smeulders et al “semantic features aim at encoding interpretations of the image which may be relevant to the application.” [Smeulders et al, 2000] To enable querying images for concepts and semantic content while still maintaining predominantly automatic indexing facilities, people started arguing for hybrid approaches to combine content-based and concept-based (usually textual) features [Zhou et al, 2002]. This is not as straight forward as it might seem. Even though many people have attempted to combine these two features before, only recently has there been a push towards more rigorous and well-founded ideas. Techniques to achieve this are mostly based on machine learning or pattern recognition techniques, which either involve semi automatic annotation [Chang et al, 2003, Jeon et al, 2003] or image classification [Oliva et al, 2001, Bradshaw, 2000]. Automatic annotation is achieved by label propagation, in which a partially annotated image collection is used to propagate their labels to other unlabelled images in the collection on the basis of visual similarity [Jeon et al, 2003]. Image classification is achieved by training a classifier on a set of training images to perform the classification task. This has been successfully employed for image retrieval by [Oliva et al, 2001], who order images on semantic axes. One such axis is natural versus artificial, which can again be classified on sub-axes into open versus closed, for example.
Instead of using a knowledge base to mine for semantic concepts, people have also proposed to learn the semantic space from user interaction and feedback. User-based approaches include [Su et al, 2002, Zhou et al, 2002]. The major difference in the two approaches lies in the interpretation context considered for deciphering the image’s meaning. It should become obvious that the annotation-based approach can only succeed in taking very general concepts into consideration, as opposed to user-based approaches that are tailored to the user’s expectations and interpretations.
2.2.2. Textual Features Current indexing practice of large professional image collections relies on assigning metadata to each image. These metadata in the form of textual descriptors are then used as retrieval keys at search time with the help of traditional IR techniques. One can distinguish between indices that capture the formal description of the image and subject indexing and retrieval. The former covers formal attributes of the image such as who, when, and where, and is comparable to a bibliographical description of a textual document. There is need for a standardised indexing
FP6-027026, K-Space
ID4.4.1: State of the Art Report on Multimedia Mining
15
scheme for image description. Subject indexing depends largely on the make-up and purpose of the collection itself. Many image libraries use their own indexing scheme geared towards the nature of the collection and the needs of their users.
Subject indexing is usually achieved by either describing the content of the image directly assigning keywords from a specially designed thesaurus of words, or classifying the images according to classification codes. Keywords are probably the most widely used approach in image libraries. Getty Images (www.gettyimages.com)—the company that markets the largest stock collection of imagery in the world—have developed a comprehensive thesaurus for indexing their photographs. It comprises more than 10,000 concepts, allowing users to pose queries at a range of levels, from very abstract to quite specific.
The alternative is to develop a strict classification scheme. Sometimes classification codes are developed in favour of keywords because they are to a larger degree language independent and are less prone to indexer subjectivity. Subjectivity arises because of inconsistencies in choices of keywords for indexing an image, which is a serious downside of existing manual indexing practices for image collections. Classification codes are usually employed to create a hierarchical structure reflecting the concepts in the library. One such example is ICONCLASS (http://www.iconclass.nl/) designed for the classification of works of art.
Keyword indexing schemes still succeed over content-based techniques because of their expressive power. They can capture the content of an image at various levels of complexity—one can list the objects depicted in the scene (eg house and tree), the layout of the objects (eg a tree in front of a house), the mood the image conveys (eg happiness) and even metadata that cannot be directly inferred from the image content itself, such as who took the picture at what time and where.
However, there are major drawbacks concerning the process of manual indexing processes often quoted in the literature. These are on the one hand the time and thus cost of indexing a collection manually. On the other hand, the choice of keywords is very subjective and shown to be often inconsistent between different indexers. Even worse, there is often a huge discrepancy between the keywords chosen by the indexer, who is often a specialist in the field of library science, and those expected by the users.
For more examples of classification and indexing schemes, software for image data management, current indexing practice, and research into indexing effectiveness refer to [Eakins et al, 1999]. User studies [Garber et al, 1992; Markkula et al, 2000; Armitage et al, 1996] have shown that manual indices are often inadequate and far from perfect. Eakins et al conclude that “there is very little firm evidence that current text-based techniques for image retrieval are adequate for their task.” [Eakins et al, 1999, p. 22] This suggests that, although they are still used in favour of content-based techniques, there is a definitive need for alternative ideas. The most promising direction at the moment appears to be a hybrid approach between the two [Enser, 2000].
2.2.3. Primitive Content-Based Features Content-based features are obtained by mathematical analysis of the pixel values of images. They capture data patterns and statistics of the image using image processing and pattern analysis algorithms. The main requirements for feature extraction are [Lu, 1999]:
1. Completeness/Expressiveness: Features should be a rich enough representation of the image contents to reproduce the essential information.
2. Compactness: The storage of the features should be compact to allow efficient access.
FP6-027026, K-Space
ID4.4.1: State of the Art Report on Multimedia Mining
16
Tractability: The distance between features should be efficient to compute.
For each feature a suitable similarity measure is defined that is used for determining similarity scores. During the retrieval process, images are presented to the user based on the similarity scores computed between the features of images in the database and the query features. Usually it is the case that each image is represented by a set of features, each feature type having its own similarity measure. Hence, to obtain a single similarity score, a means to combine the scores needs to be incorporated. In most cases this is achieved by a weighted sum of the normalised similarity scores for each feature type. The three most prominent features are colour, texture and shape are described below.
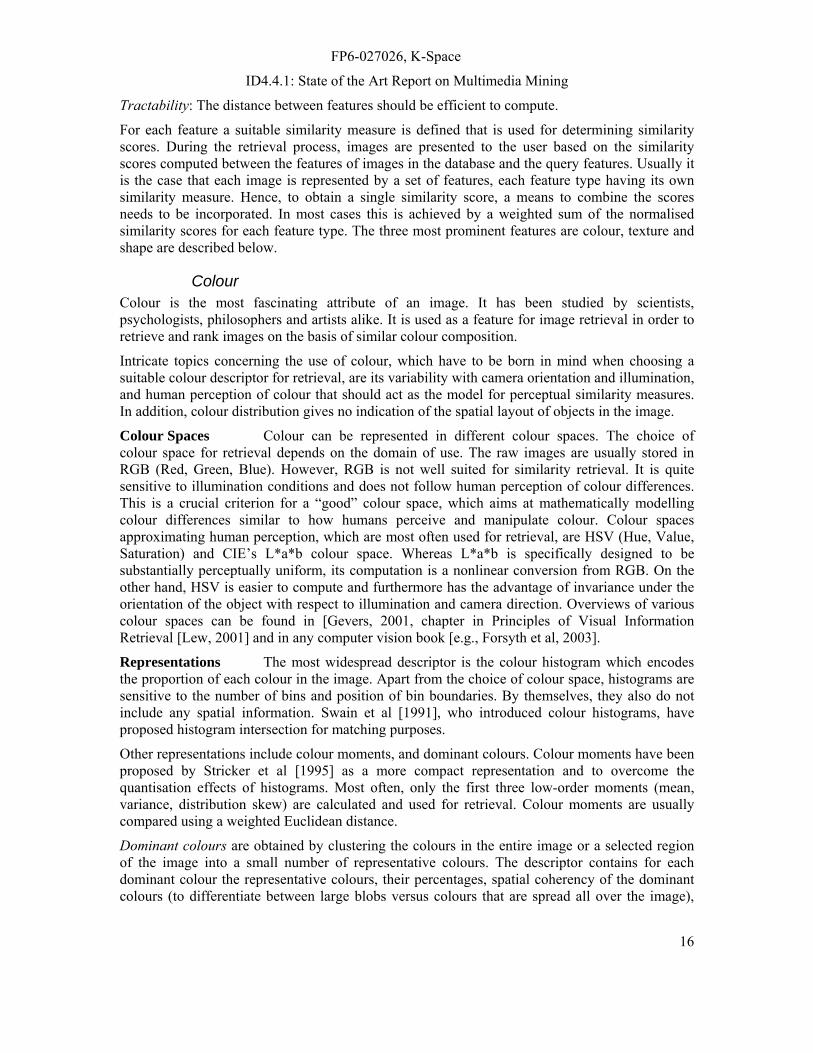
Colour Colour is the most fascinating attribute of an image. It has been studied by scientists, psychologists, philosophers and artists alike. It is used as a feature for image retrieval in order to retrieve and rank images on the basis of similar colour composition.
Intricate topics concerning the use of colour, which have to be born in mind when choosing a suitable colour descriptor for retrieval, are its variability with camera orientation and illumination, and human perception of colour that should act as the model for perceptual similarity measures. In addition, colour distribution gives no indication of the spatial layout of objects in the image.
Colour Spaces Colour can be represented in different colour spaces. The choice of colour space for retrieval depends on the domain of use. The raw images are usually stored in RGB (Red, Green, Blue). However, RGB is not well suited for similarity retrieval. It is quite sensitive to illumination conditions and does not follow human perception of colour differences. This is a crucial criterion for a “good” colour space, which aims at mathematically modelling colour differences similar to how humans perceive and manipulate colour. Colour spaces approximating human perception, which are most often used for retrieval, are HSV (Hue, Value, Saturation) and CIE’s L*a*b colour space. Whereas L*a*b is specifically designed to be substantially perceptually uniform, its computation is a nonlinear conversion from RGB. On the other hand, HSV is easier to compute and furthermore has the advantage of invariance under the orientation of the object with respect to illumination and camera direction. Overviews of various colour spaces can be found in [Gevers, 2001, chapter in Principles of Visual Information Retrieval [Lew, 2001] and in any computer vision book [e.g., Forsyth et al, 2003].
Representations The most widespread descriptor is the colour histogram which encodes the proportion of each colour in the image. Apart from the choice of colour space, histograms are sensitive to the number of bins and position of bin boundaries. By themselves, they also do not include any spatial information. Swain et al [1991], who introduced colour histograms, have proposed histogram intersection for matching purposes.
Other representations include colour moments, and dominant colours. Colour moments have been proposed by Stricker et al [1995] as a more compact representation and to overcome the quantisation effects of histograms. Most often, only the first three low-order moments (mean, variance, distribution skew) are calculated and used for retrieval. Colour moments are usually compared using a weighted Euclidean distance.
Dominant colours are obtained by clustering the colours in the entire image or a selected region of the image into a small number of representative colours. The descriptor contains for each dominant colour the representative colours, their percentages, spatial coherency of the dominant colours (to differentiate between large blobs versus colours that are spread all over the image),

FP6-027026, K-Space
ID4.4.1: State of the Art Report on Multimedia Mining
17
and colour variances. The objective of this descriptor is to provide a compact and intuitive representation of salient colours in a given region of interest. Their effectiveness depends on a suitable clustering algorithm, efficient similarity measures and indexing schemes, which can be looked up in [Manjunath et al., 2001]. A similar approach is proposed by Smith et al [1996] in the form of colour sets as an approximation of the colour histogram, in which insignificant colour information is ignored while prominent colour regions are emphasised. The spatially localised colour sets are also an improvement over the global histogram, as it provides regional colour information.
The histogram is an efficient and the prevalent representation of feature distributions. However, it is inflexible, since the bin quantisation levels have to be decided beforehand, and hence it is difficult to achieve a good balance between expressiveness and efficiency. Alternatively, signatures in which the number and size of the bins (or clusters) is defined for each image individually have been proposed for representing feature distributions. Signatures have the advantage of adapting the number of clusters to the complexity of the images, so that simple images have short signatures whereas complex images have longer signatures.
Additionally, the similarity measures can be improved upon. The traditional bin-by-bin histogram measures (including histogram intersection) only compare the contents of the corresponding histogram bins (i.e. for histograms H = {hi}i=1..n and K = {ki}i=1..n: compare hi to ki for all i, but not hi to kj for i ≠ j). This makes the measure very sensitive to the chosen bin boundaries. An improvement on effectiveness (but not efficiency) is to use cross-bin histogram measures, which also compare non-corresponding bins. Rubner proposed the Earth Mover’s Distance as an effective similarity measure for histograms and signatures [Rubner, 1998]. He also provides a comprehensive comparison on feature representations and alternative similarity measures.
More information on the usage of colour for retrieval can be read in [Del Bimbo, 1999, chapter 2]. Manjunath et al. [2001] describe the colour descriptors that are proposed for the MPEG-7 standard. They also cover texture features. Different distance measures for colour and texture features are summarised and evaluated in [Puzicha et al., 1999]. From this extensive comparative study, Puzicha et al. conclude that there is no single measure that exhibits best overall performance, but that the task at hand determines the performance.
Texture Colour alone is not discriminative enough for most image retrieval applications. For example, a part of sky cannot readily be distinguished from a lake based on colour similarity only. This is where texture can help. It is a phenomenon that is easy to recognise but hard to define. Visual texture can be identified by variations of intensity and colour which form certain patterns. This makes texture analysis more complicated than the one of colour: a single pixel has no texture. For the computation of texture properties it is consequently necessary to take into account correlations of pixels in a certain neighbourhood. A lot of research has gone into the definition and extraction of texture properties.
There are some issues that need to be considered, when dealing with textures. Texture is dependent on the scale at which the image is viewed. At a large scale, pebbles on a beach, for instance, create an effect interpreted as texture. Yet when focusing on a single stone at a finer scale, it will be seen as an object rather than a texture, until, while zooming in even more, the pattern or texture of the stone surface will become apparent.
FP6-027026, K-Space
ID4.4.1: State of the Art Report on Multimedia Mining
18
Natural images usually do not expose a homogeneous texture. They can be decomposed into regions within which the texture is constant. Texture segmentation is however an intricate task, which involves determining region boundaries and finding a suitable texture representation.
Texture Models There are numerous approaches for texture features in the literature. A good introduction to texture features for content-based retrieval and a taxonomy of texture models can be found in [Sebe et al, 2001].
Two distinct models that are established in CBIR are Picard et al [1994]’s Wold decomposition and the Gabor filter decomposition approach refined by Manjunath et al [1996]. Picard et al [1994] have attempted to define a model in accordance with human perception of texture. It is based on the assumption that an image is a homogeneous 2D discrete random field. The Wold representation then decomposes an image into three mutually orthogonal components, which roughly correspond to periodicity, directionality, and randomness. Those three components have been related to perceptual similarity dimensions in psychophysical findings. In addition, they offer some semantic referent. Since they agree with linguistic descriptions of texture, they have the advantage of allowing manual specification of the desired image properties in retrieval applications. In the Photobook system [Pentland et al., 1994] this model has been applied for retrieval of texture-swatch and keyframe databases.
Gabor filters, on the other hand, are believed to correspond to the way human vision works. A bank of Gabor filters can be considered as a collection of orientation and scale tunable bar filters (or edge and line detectors), which is analogous to the functioning of the visual cortex. The texture feature representation developed by Manjunath et al [1996], is based on a Gabor filter dictionary designed for image retrieval and browsing. In their NeTra system [Ma et al, 1999], texture has been modelled using the mean and standard deviation of the filtered outputs, which is applied to search through large collections of arial photographs. This texture feature characterises homogeneous image regions quantitatively, which is suitable for accurate search and retrieval given some query images. Lacking the possibility of a verbal description that the Wold model provides, Manjunath et al. [2000] have further extended their texture descriptor by a “perceptual browsing component”. Similar to theWold attributes, this component characterises the perceptual attributes directionality, regularity, and coarseness computed from the filtered images. This results in a very compact representation, which is more suitable for coarse classification of textures and browsing type applications. Both the similarity retrieval and the texture browsing descriptor have been adopted in the MPEG-7 standard [Manjunath et al., 2001].
Texture features are hardly ever used on their own. For retrieval and browsing of heterogeneous images, they are used in combination of a suitable segmentation algorithm to detect homogeneous texture regions [eg, Ma et al, 1999]. The segmentation is usually achieved by combining texture, colour and shape information. In addition, the obtained regions are represented by multiple features in both of the systems discussed above [Pentland et al., 1994; Ma et al, 1999].
Shape Moving closer to the recognition of objects, shape is the third of the most prominent basic features. In contrast to colour and texture, which represent global intensity attributes of the image (unless used in combination with some segmentation technique), shape encodes inherently local geometric information.
The shape of an object within a 2-D image is defined as the contour traced by its boundaries. Formalising shape similarity, however, is a more delicate matter. Equally to colour and texture similarity, the ultimate goal is to match human perception of shape similarity.
FP6-027026, K-Space
ID4.4.1: State of the Art Report on Multimedia Mining
19
The process of obtaining a shape feature vector is achieved in two steps. First, the image has to be segmented by detecting lines or similar in order to extract the shapes from a given gray-scale image. These shapes (in the form of binary images) are fed into shape analysis algorithms to arrive at a characterisation. Shape matching between the resulting shape vectors is used in the retrieval applications to determine the similarity between any two images.
The criteria that shape matching techniques must fulfill are—besides the ability to match human similarity perception—invariance to translation, scale, and rotation, and robustness to noise. The modelling of shape similarity is seriously hampered by occlusion in the image and differences in view angle.
Since shape analysis plays a crucial role in object recognition, it has received extensive attention in the computer vision literature. Consequently, there exist numerous techniques. The interested reader is referred to a comprehensive survey of shape analysis techniques by Loncaric [1998]. Shorter introductions to shape analysis for image retrieval, including pointers to interesting approaches, can be found in any of the reviews of CBIR [eg, Rui et al., 1999; Smeulders et al., 2000; Eakins et al, 1999]. In the field of image retrieval, shape analysis has been studied extensively for trademark retrieval [Eakins, 2001; Jain et al, 1998].
Combination of Features Most often, a combination of (primitive) features is used in visual retrieval systems [eg, Flickner et al., 1995; Ma et al, 1999; Pentland et al., 1994]. The most prevalent approach is to compute a single score as the weighted sum of the similarity scores of each feature. While this is a convenient way of computation, it is based on the assumption that the features are independent of each other (i.e. forming an orthogonal basis of the vector space spanned by the features as its dimensions). Primitive attributes, however, are inherently intertwined, which will become even more obvious in the next paragraph, and thus provides a reason why to question the independence assumption. Instead of a linear combination, Ma et al [1999] for instance, suggest a different treatment for uniting features. In their NeTra system an implicit ordering of features is assumed to prune the search. The search space is narrowed down using the first feature, followed by a re-ranking of the obtained set of images and final selection according to the whole set of features.
Alternatively, features have been proposed that by themselves, already capture more than one aspect of image attributes. In theory, this is already the case for most texture features for instance, since they capture changes in intensity values that can also indicate the existence of edges, which is the basis for shape matching. Visual appearance features are an extension of this idea. They are often used in attempts to recognise objects in images. The reasoning behind is that in order to characterise the visual appearance of an object, which depends on an interplay of factors such as its shape, albedo, surface texture, view point etc., a syntactic representation is more suitable for object recognition. So rather than extracting separate features for texture, shape, colour etc., only to later synthesise them again for similarity matching, the appearance feature approach circumvents having to separate the different factors constituting an object’s appearance. Pentland et al. [1994] consider their Eigenface approach to face matching as an example of an appearance feature. Ravela et al. characterise visual appearance by the ‘shape of the intensity surface’, and propose features computed from Gaussian derivative filters for region matching [Ravela et al, 1997] and global similarity retrieval [Ravela et al, 2000].

FP6-027026, K-Space
ID4.4.1: State of the Art Report on Multimedia Mining
20
2.2.4. Summary In summary, the unifying approach of low-level and conceptual features is without a doubt the most promising direction for the future. Firstly, low-level features should be employed in combination with conceptual features. Low-level features on their own lack the semantic capabilities asked for by most users, while semantic concepts are just too great a challenge to obtain independently from low-level content. When combined, visual features are useful for propagating semantic labels from (manually) labelled images (label should be understood generically, arising for instance from keyword annotations, relevance judgements, etc.) to others based on visual similarity. Secondly, user-assisted labelling techniques can help to improve and refine the semantics learnt from purely visual-based categorisation. In addition, a proper learning framework plays a crucial role in the personalisation of retrieval systems.
The techniques introduced in this section also highlight the importance of learning methods in CBIR. Learning has indeed been the dominating factor to narrow the semantic gap arising from the low-level feature representation in the last few years (see Section 6).
3. Multimedia Mining and Learning Techniques
3.1. Data Mining and Machine Learning Data mining applies many techniques developed for machine learning. Data mining (DM), also referred to as knowledge discovery in databases (KDD), is about finding understandable knowledge in the data. Machine learning (ML), on the other hand, is concerned with improving performance of an agent. In this section we will briefly define these two areas.
3.1.1. Knowledge Discovery in Databases and Data Mining Knowledge discovery in databases (KDD) can be defined as:
„Non-trivial process of identifying valid, novel, potentially useful and ultimately understandable patterns from data.”
[Fayyad et al., 1996]
or as:
„Analysis of observational data sets to find unsuspected relationships and summarize data in novel ways that are both understandable and useful to the data owner.”
[Hand et al, 2001]
DM is concerned with finding patterns and regularities in sets of data by automatic techniques that identify the underlying rules and features in the data. As mentioned in the introduction, DM encompasses a number of different approaches, including clustering, data summarisation, learning classification rules, finding dependency networks, analyzing changes and detecting anomalies. The common characteristics of data such systems have to analyse are:
• Large quantities of data
• Noisy, incomplete data
• Complex data structures
FP6-027026, K-Space
ID4.4.1: State of the Art Report on Multimedia Mining
21
• Heterogeneous
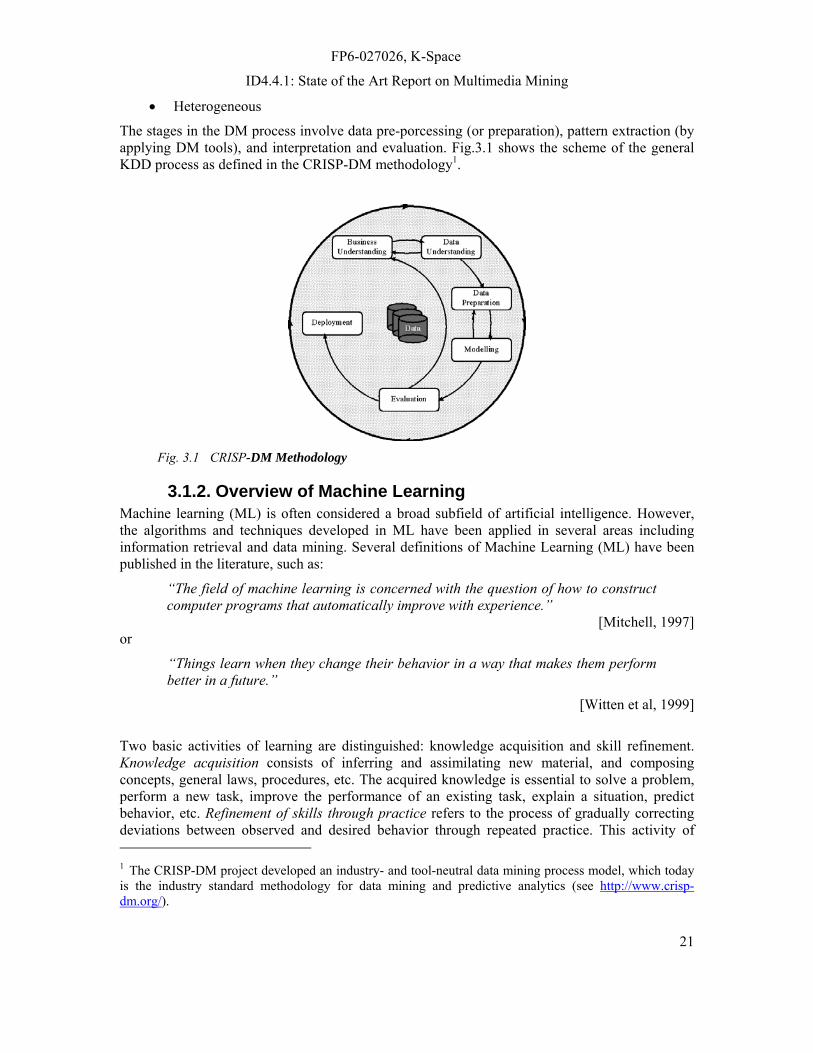
The stages in the DM process involve data pre-porcessing (or preparation), pattern extraction (by applying DM tools), and interpretation and evaluation. Fig.3.1 shows the scheme of the general KDD process as defined in the CRISP-DM methodology1.
Fig. 3.1 CRISP-DM Methodology
3.1.2. Overview of Machine Learning Machine learning (ML) is often considered a broad subfield of artificial intelligence. However, the algorithms and techniques developed in ML have been applied in several areas including information retrieval and data mining. Several definitions of Machine Learning (ML) have been published in the literature, such as:
“The field of machine learning is concerned with the question of how to construct computer programs that automatically improve with experience.”
[Mitchell, 1997] or
“Things learn when they change their behavior in a way that makes them perform better in a future.”
[Witten et al, 1999]
Two basic activities of learning are distinguished: knowledge acquisition and skill refinement. Knowledge acquisition consists of inferring and assimilating new material, and composing concepts, general laws, procedures, etc. The acquired knowledge is essential to solve a problem, perform a new task, improve the performance of an existing task, explain a situation, predict behavior, etc. Refinement of skills through practice refers to the process of gradually correcting deviations between observed and desired behavior through repeated practice. This activity of 1 The CRISP-DM project developed an industry- and tool-neutral data mining process model, which today is the industry standard methodology for data mining and predictive analytics (see http://www.crisp-dm.org/).
FP6-027026, K-Space
ID4.4.1: State of the Art Report on Multimedia Mining
22
human learning covers mental, motor, and sensory processes. Note that current research in machine learning focuses on knowledge acquisition (concept learning).
Two contrasting groups of learning can be distinguished among the concept learning forms:
Empirical (similarity-based) learning involves examining multiple training examples of one or more concepts (classes) in order to determine the characteristics they have in common. Such systems are usually based on limited background (domain-specific) knowledge. The learner acquires a concept by generalizing these examples through an inductive search process. The empirical learning comprises both learning from examples and from observations.
Analytic learning formulates a generalization by observing only a single example (or with absence of examples at all) and by exploiting a large background knowledge about the given domain. Explanation-based learning and learning by analogy belong to this group.
Learning from examples (called also concept acquisition) is one of the most researched approaches of learning. It has been applied in many domains, e.g., to learn medical diagnoses, to predict weather, in speech recognition, chemistry and geology. It is most commonly applied for knowledge acquisition for expert systems, knowledge discovery from databases and data mining. A number of methods have been developed for this type of task. The common background of these methods is similarity based learning. The hypothesis is that examples can be described by similar characteristics (thus creating clusters in so called feature space). The methods differ in the way how the knowledge is represented (e.g. trees, rules, etalons or probabilities), what type of task they can solve (e.g. classification, prediction or segmentation), or how complex clusters (classes, segments) they can express (e.g. if the clusters are linearly separable).
3.1.3. Data Mining vs. Machine Learning The main differences to machine learning are:
1. DM focuses on methods obtaining knowledge from data (i.e. empirical learning) whereas ML is concerned with improving performance of an agent; and
2. DM covers not only the data analysis step where the induction (ML) algorithms are applied but also problems of data understanding, data cleansing and preprocessing, and knowledge (model) evaluation and deployment.
ML is a mature area of computer science compared to a fairly recent interest in DM in the field. However, many older techniques from machine learning, pattern recognition and information retrieval can be applied to DM. DM deals with ‘real world’ data, as opposed to the laboratory type of examples most ML learning techniques have been developed for and tested on. Hence, the DM community has to deal with more noisy and dynamic data, as well as making ML algorithms more efficient and scalable.
In the remainder of this section we will introduce a number of machine learning techniques that have been applied to DM. The following sections then cover some particular methods in more detail. Section 3 deals with latent semantic indexing, which is a popular mechanism in information retrieval to reduce the dimensionality of the feature space by identifying the most discriminative dimensions. Section 4 covers the pattern recognition aspect in more detail, in particular clustering techniques. And finally Section 6 is concerned with the relevance feedback
FP6-027026, K-Space
ID4.4.1: State of the Art Report on Multimedia Mining
23
approach, developed in the information retrieval area in order to improve retrieval based on user-provided feedback.
3.2. Machine Learning Techniques
3.2.1. Top-down Induction of Decision Trees In data mining, decision trees (also referred to a classification or reduction trees) are used to predict the class membership of the input data items. A decision tree consists of leaf nodes, representing classifications, and branches, representing conjunctions of features/attributes that lead to those classifications. More specifically, the internal nodes correspond to variables; branches represent possible values of the variables (e.g., Color=red). A leaf then represents a possible class given the values of the variables represented by the path from the root.
Decision tree learning, the machine learning technique for building (inducing) a decision tree from data, is based on a recursive partitioning approach (also called divide and conquer): At each node, one attribute is chosen to split training examples into distinct classes as much as possible. Such a process terminates when the leaves contain a substantially large proportion of examples of a single class. A new example is classified by following a matching path to a leaf node.
There are a number of algorithms for top-down induction of decision trees, such as C4.5 [Quinlan, 1994] and CART [Agrawal et al, 1993]. The former is a de facto standard algorithm for the machine learning community, the latter is preferred by statisticians. Other well known algorithms are CHAID, 1R (this algorithm creates so called decision stumps as it stops growing the tree after finding the first split), or the recently proposed random forest [Breiman, 2001].
Decision trees can handle both categorical and numeric attributes (although they have been originally designed for categorical attributes only), they divide the feature space into regions (hyper-rectangles) parallel to the axes. The main advantage of decision trees is their understandability.
3.2.2. Association Rules Association rule mining finds interesting associations or correlation relationships among data items. Association rules show attribute-value conditions that occur frequently together. One of the main application areas of association rule mining is Market Basket Analysis, which attempts to identify groups of items which are frequently bought together. Association rules are automatically learnt from the data, and can be thought of as probabilistic “if-then” statements. Agrawal et al [1993] introduced the following notation:
Ant ⇒ Suc (3.1)
where Ant (for “antecedent” corresponding to the “if” part) and Suc (the consequent corresponding to the “then” part) are frequent item sets (in original Agrawal’s understanding of association rule mining as market basket analysis), or, more general, conjunctions of attribute-
FP6-027026, K-Space
ID4.4.1: State of the Art Report on Multimedia Mining
24
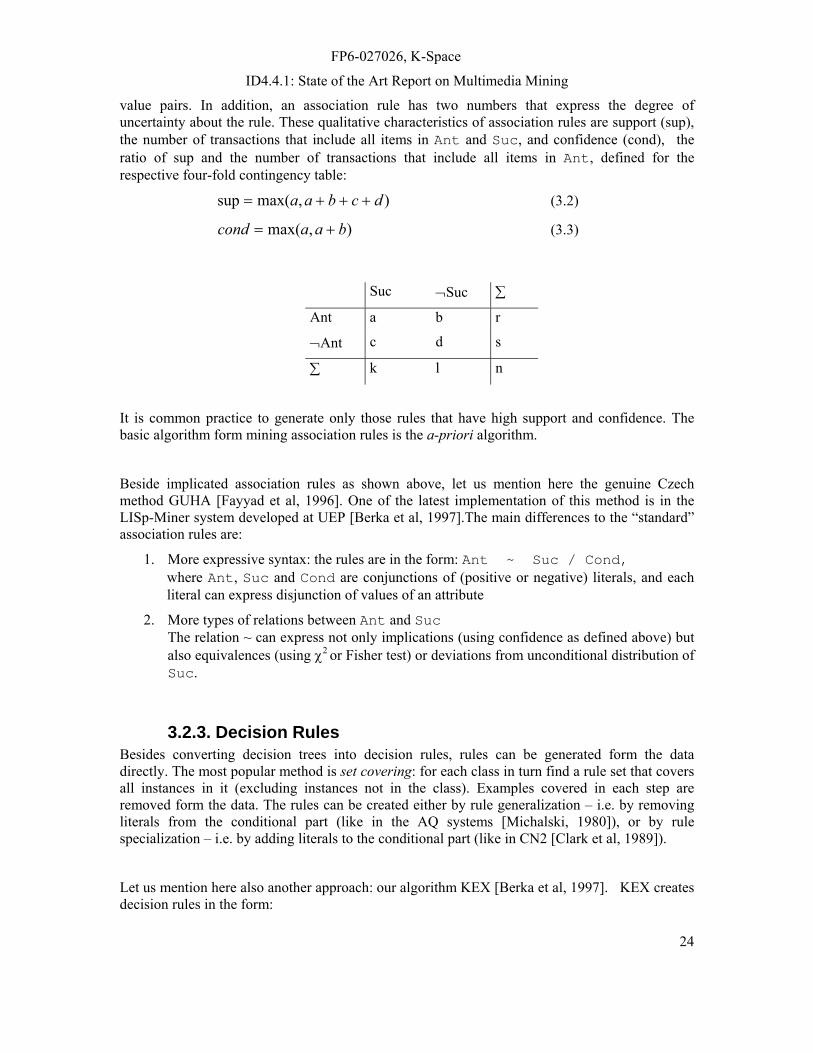
value pairs. In addition, an association rule has two numbers that express the degree of uncertainty about the rule. These qualitative characteristics of association rules are support (sup), the number of transactions that include all items in Ant and Suc, and confidence (cond), the ratio of sup and the number of transactions that include all items in Ant, defined for the respective four-fold contingency table:
),max(sup dcbaa +++= (3.2)
),max( baacond += (3.3)
Suc ¬Suc ∑
Ant a b r
¬Ant c d s
∑ k l n
It is common practice to generate only those rules that have high support and confidence. The basic algorithm form mining association rules is the a-priori algorithm.
Beside implicated association rules as shown above, let us mention here the genuine Czech method GUHA [Fayyad et al, 1996]. One of the latest implementation of this method is in the LISp-Miner system developed at UEP [Berka et al, 1997].The main differences to the “standard” association rules are:
1. More expressive syntax: the rules are in the form: Ant ~ Suc / Cond, where Ant, Suc and Cond are conjunctions of (positive or negative) literals, and each literal can express disjunction of values of an attribute
2. More types of relations between Ant and Suc The relation ~ can express not only implications (using confidence as defined above) but also equivalences (using χ2 or Fisher test) or deviations from unconditional distribution of Suc.
3.2.3. Decision Rules Besides converting decision trees into decision rules, rules can be generated form the data directly. The most popular method is set covering: for each class in turn find a rule set that covers all instances in it (excluding instances not in the class). Examples covered in each step are removed form the data. The rules can be created either by rule generalization – i.e. by removing literals from the conditional part (like in the AQ systems [Michalski, 1980]), or by rule specialization – i.e. by adding literals to the conditional part (like in CN2 [Clark et al, 1989]).
Let us mention here also another approach: our algorithm KEX [Berka et al, 1997]. KEX creates decision rules in the form:
FP6-027026, K-Space
ID4.4.1: State of the Art Report on Multimedia Mining
25
Ant ⇒ C (w) (3.4)
where Ant is a conjunction of attribute-value pairs, C is the class attribute and w is the weight of the rule (from the interval [0,1]).
During knowledge acquisition, KEX works in an iterative way, which tests and expands an implication Ant -> C in each iteration. This process starts with a default rule weighted with the relative frequency of the class C and stops after testing all implications created according to the user defined criteria. The induction algorithm inserts only such rules into the knowledge base, for which the confidence cannot be inferred from the existing rules. To combine weights of different rules, we use the pseudo-Bayesian combination function:
))1(*)1(*;*( 21212121 wwwwwwFww −−+=⊕ (3.5)
3.2.4. Neural Networks Artificial neural networks are one of the most popular machine learning algorithms. The original inspiration for the technique was from examination of the central nervous system. An artificial neural network is the collection of simple artificial neurons connected by directed weighted connections. Each single neuron sums weighted inputs from other neurons (or from the environment). This sum is then transformed by a non-linear activation function.
Different topologies of neural networks have been proposed. The most popular is the multilayer perceptron for classification or prediction tasks. This type of network is trained by so called error back-propagation learning, which minimizes the mean-squared error (sum of squared differences between computed and correct output value calculated over the training data) using gradient descent approach.
In contrast to decision trees or rules, the knowledge of neural network is “hidden” in the network topology and in the weights of links between neurons.
3.2.5. Support Vector Machines Support Vector Machines (SVM) are based on two ideas: (1) we can transform a problem that is not linearly separable in low dimensional feature space into a problem that is linearly separable in high dimensional space; and (2) when building a classifier for linearly separable classes, we can consider only those examples, that are closest to the decision boundary.
SVM introduces a method that allows us to apply the above mentioned ideas without explicitly knowing the transformation from low dimensional into high dimensional space (using so-called kernel functions). SVMs will be further discussed in Section 6.5.
FP6-027026, K-Space
ID4.4.1: State of the Art Report on Multimedia Mining
26
3.2.6. Genetic Algorithms Another group of biologically inspired methods are genetic algorithms (GA), which originates from the analogy of Darwin’s evolutionary theory. A population of individuals (solutions of a problem) improves over time by employing three basic operators: selection, crossover and mutation.
Genetic algorithms are used for optimisation problems as well as for concept learning. In the later case, GA’s are used as stand-alone algorithms (when encoding pieces of knowledge as chromosomes) or as part of other ML algorithms to perform parallel random search (e.g. as a part of set-covering algorithms that induce decision rules).
3.2.7. Instance-based Learning Case-Based Reasoning is an alternative to Rule-Based Reasoning. In CBR systems, the knowledge is represented by (proto)-typical cases (problems, successfully solved in the past). The reasoning is based on the notion of similarity or dissimilarity (distance). Commonly used distance measures are e.g. Euclidian distance
∑=j
jjEE xxxxd ),(),( 2121 δ ,where δE(x1j,x2j) = (x1j - x2j)2 (3.6)
or overlap distance
∑=j
jjoo xxxxd )(),( 2,121 δ ,where δO(x1j,x2j) =⎩⎨⎧
≠ 2j1j
2j1j
xfor x 1 x=for x 0
(3.7)
The solution for a new problem is then adapted from the case, that is most similar (closest) to this problem.
3.2.8. Bayesian Approach Naive Bayesian classifiers compute the aposteriori (conditional) probability of a hypothesis H given evidences, E1,… Ek using the formula:
),,(
)()|(
),,()()|,,(
),,|(11
11
k
ii
k
kk EEP
HPHEP
EEPHPHEEP
EEHPLL
LL
Π== (3.8)
When classifying with more hypotheses, we select the one that maximizes the aposteriori probability.
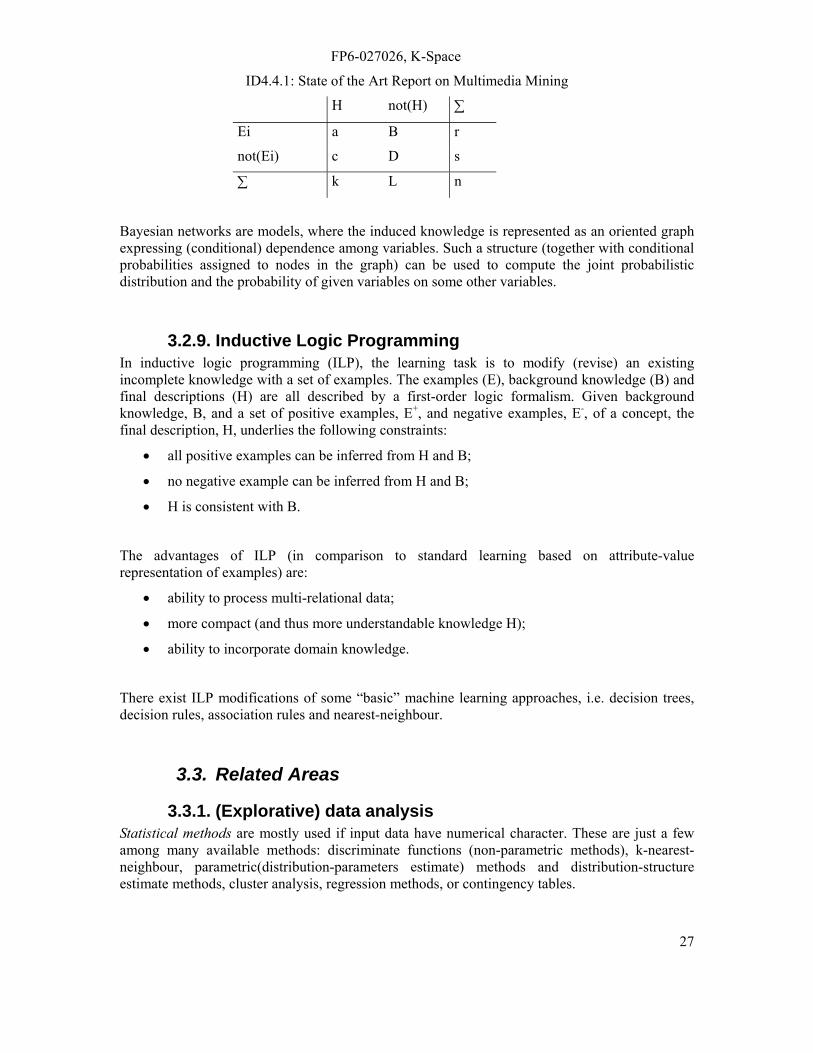
The probabilities P(Ei|H) that build the classifier, can be understood as characteristics of association rules that relate together evidence Ei and hypothesis H. Building the naïve Bayesian classifier from data (as is the case in machine learning), P(Ei|H) = a/(a+c) is the coverage of the association rule Ei ⇒ H, (or the confidence of the association rule H ⇒ Ei)
FP6-027026, K-Space
ID4.4.1: State of the Art Report on Multimedia Mining
27
H not(H) ∑
Ei a B r
not(Ei) c D s
∑ k L n
Bayesian networks are models, where the induced knowledge is represented as an oriented graph expressing (conditional) dependence among variables. Such a structure (together with conditional probabilities assigned to nodes in the graph) can be used to compute the joint probabilistic distribution and the probability of given variables on some other variables.
3.2.9. Inductive Logic Programming In inductive logic programming (ILP), the learning task is to modify (revise) an existing incomplete knowledge with a set of examples. The examples (E), background knowledge (B) and final descriptions (H) are all described by a first-order logic formalism. Given background knowledge, B, and a set of positive examples, E+, and negative examples, E-, of a concept, the final description, H, underlies the following constraints:
• all positive examples can be inferred from H and B;
• no negative example can be inferred from H and B;
• H is consistent with B.
The advantages of ILP (in comparison to standard learning based on attribute-value representation of examples) are:
• ability to process multi-relational data;
• more compact (and thus more understandable knowledge H);
• ability to incorporate domain knowledge.
There exist ILP modifications of some “basic” machine learning approaches, i.e. decision trees, decision rules, association rules and nearest-neighbour.
3.3. Related Areas
3.3.1. (Explorative) data analysis Statistical methods are mostly used if input data have numerical character. These are just a few among many available methods: discriminate functions (non-parametric methods), k-nearest-neighbour, parametric(distribution-parameters estimate) methods and distribution-structure estimate methods, cluster analysis, regression methods, or contingency tables.
FP6-027026, K-Space
ID4.4.1: State of the Art Report on Multimedia Mining
28
3.3.2. Pattern recognition Pattern recognition is the research area that studies the operation and design of systems that recognize patterns in data. It encloses sub-disciplines like discrimination analysis, feature extraction, error estimation, cluster analysis (together sometimes called statistical pattern recognition), grammatical inference and parsing (sometimes called syntactical pattern recognition). Important application areas are image analysis, character recognition, speech analysis, man and machine diagnostics, person identification and industrial inspection.
4. Latent Semantic Indexing After having outlined the “basic” machine learning techniques, this section now introduces one particular method that has proven very popular for the high-dimensional and diverse feature space in multimedia data sets: Latent Semantic Indexing
4.1. Information Retrieval using Linear Algebra Numerical linear algebra, especially Singular Value Decomposition (SVD), is used as a basis for information retrieval in the indexing and retrieval strategy referred to as Latent Semantic Indexing, see [Berry et al, 1999 and 2004], [Grossman et al, 2000]. Originally, LSI was used as an efficient tool for semantic analysis of large amounts of text documents. The main reason is that more conventional retrieval strategies (such as vector space, probabilistic and extended Boolean) are not very efficient for real data, because they retrieve information solely on the basis of keywords. There are two main problems with using keywords as indexing units: polysemy (words having multiple meanings); and synonymy (multiple words having the same meaning). As a result, keywords often are not effectively matched. LSI can be viewed as a variant of the vector space model with a low-rank approximation of the original data matrix via the SVD or other numerical methods [Berry et al, 1999].
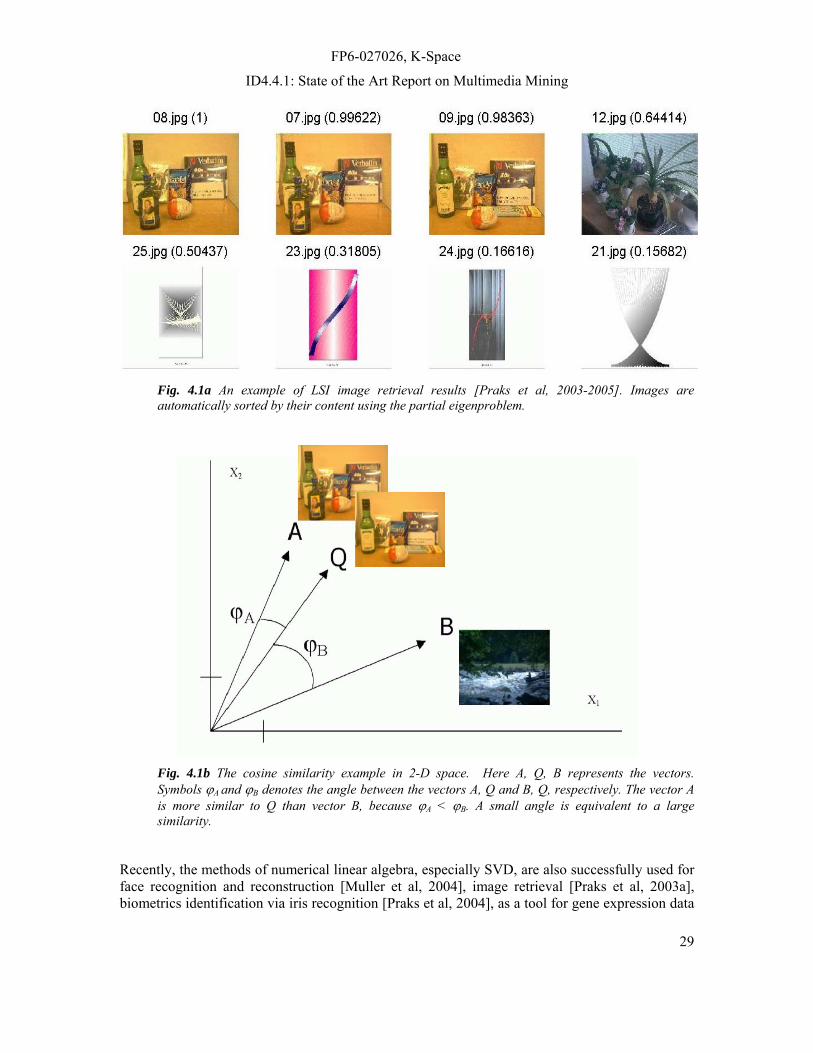
Numerical experiments have pointed out that dimension reduction applied to the original data has the following two main advantages for information retrieval: (i) automatic noise filtering; and (ii) naturally clustering of data with "similar" semantics (see Fig 4.1).
FP6-027026, K-Space
ID4.4.1: State of the Art Report on Multimedia Mining
29
Fig. 4.1a An example of LSI image retrieval results [Praks et al, 2003-2005]. Images are automatically sorted by their content using the partial eigenproblem.
Fig. 4.1b The cosine similarity example in 2-D space. Here A, Q, B represents the vectors. Symbols ϕA and ϕB denotes the angle between the vectors A, Q and B, Q, respectively. The vector A is more similar to Q than vector B, because ϕA < ϕB. A small angle is equivalent to a large similarity.
Recently, the methods of numerical linear algebra, especially SVD, are also successfully used for face recognition and reconstruction [Muller et al, 2004], image retrieval [Praks et al, 2003a], biometrics identification via iris recognition [Praks et al, 2004], as a tool for gene expression data

FP6-027026, K-Space
ID4.4.1: State of the Art Report on Multimedia Mining
30
analysis in biology [Wall et al., 2003], for macroeconomic data analysis in economics [Dvořák et al., 2004], for information extraction from HTML product catalogues [Svátek et al., 2005] and for analysis of geochemical data [Praus, 2005].
4.2. Basic Concepts in LSI The classical LSI algorithm in information retrieval has the following basic steps: i) The Singular Value Decomposition (SVD) of the term matrix using numerical linear algebra. SVD is used to identify and remove redundant noise information from data. ii) The computation of the similarity coefficients between the transformed vectors of data and thus reveal some hidden (latent) structures of data.
4.2.1. The Singular Value Decomposition of the term matrix Let the symbol A be used to be denoted the m x n data matrix, i.e., the term-document matrix. The aim of SVD is to compute decomposition
A = USVT (4.1)
where S is an m x n diagonal matrix with nonnegative diagonal elements called the singular values, U and VT are m x m, and n x n orthogonal matrices, i.e., the following conditions hold: UT=U-1, VT=V-1. The columns of matrices U and VT are called the left singular vectors and the right singular vectors, respectively. The SVD decomposition can be computed so that the singular values are sorted by decreasing order. For large real problems, the full SVD decomposition is a memory and time-consuming operation. Moreover, our experiments show that computation of very small singular values and associated singular vectors can damage retrieval results. Due to these facts, only the k largest singular values of A and the corresponding left and right singular vectors are computed and stored in memory in practice.
In this way a multi-dimensional space is reduced to k-dimensional vector space according to:
Ak = UkSkVkT, (4.2)
where the symbol Uk denotes m*k matrix derived from the matrix U by the selection of its k first columns, Sk is k*k diagonal matrix with the diagonal including the first k singular values, and Vk is n*k matrix acquired by the selection of the k first columns of the V matrix. The columns of the matrix VkT contain the transformed (i.e. filtered) documents of the original data collection.
In other words, the SVD allows the approximation of the matrix A with respect to its column vectors. The k-approximation (Ak) of the matrix A’s rank is acquired by choosing only the k first singular values of the matrix S, while the other ones are neglected. The LSI algorithm was implemented in Matlab (The Math Works, Ltd.). For the computation of a few singular values and vectors of the matrix A we used the standard Matlab command svds(A,k).
There is no exact routine for the selection of the optimal number of computed singular values and vectors [Berry et al, 1995 and 1999]. For this reason, the number of singular values and associated singular vectors used for calculation of SVD was estimated experimentally.
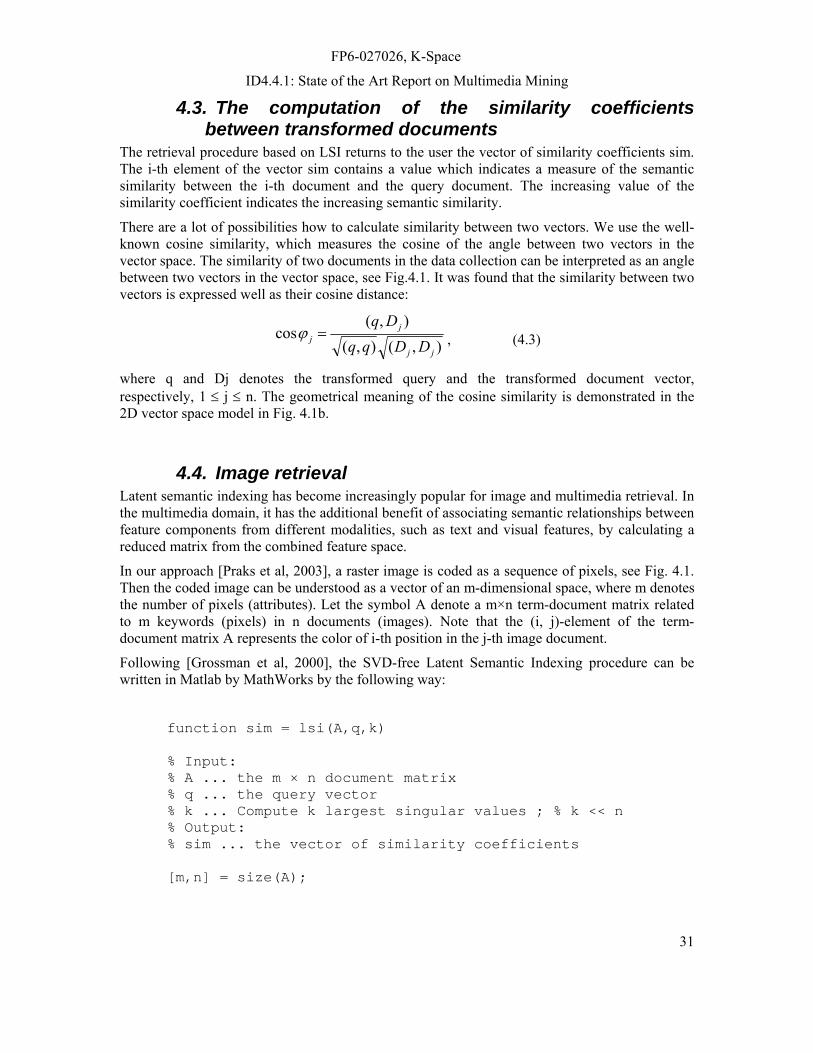
FP6-027026, K-Space
ID4.4.1: State of the Art Report on Multimedia Mining
31
4.3. The computation of the similarity coefficients between transformed documents
The retrieval procedure based on LSI returns to the user the vector of similarity coefficients sim. The i-th element of the vector sim contains a value which indicates a measure of the semantic similarity between the i-th document and the query document. The increasing value of the similarity coefficient indicates the increasing semantic similarity.
There are a lot of possibilities how to calculate similarity between two vectors. We use the well-known cosine similarity, which measures the cosine of the angle between two vectors in the vector space. The similarity of two documents in the data collection can be interpreted as an angle between two vectors in the vector space, see Fig.4.1. It was found that the similarity between two vectors is expressed well as their cosine distance:
),(),(),(
cosjj
jj DDqq
Dq=ϕ , (4.3)
where q and Dj denotes the transformed query and the transformed document vector, respectively, 1 ≤ j ≤ n. The geometrical meaning of the cosine similarity is demonstrated in the 2D vector space model in Fig. 4.1b.
4.4. Image retrieval Latent semantic indexing has become increasingly popular for image and multimedia retrieval. In the multimedia domain, it has the additional benefit of associating semantic relationships between feature components from different modalities, such as text and visual features, by calculating a reduced matrix from the combined feature space.
In our approach [Praks et al, 2003], a raster image is coded as a sequence of pixels, see Fig. 4.1. Then the coded image can be understood as a vector of an m-dimensional space, where m denotes the number of pixels (attributes). Let the symbol A denote a m×n term-document matrix related to m keywords (pixels) in n documents (images). Note that the (i, j)-element of the term-document matrix A represents the color of i-th position in the j-th image document.
Following [Grossman et al, 2000], the SVD-free Latent Semantic Indexing procedure can be written in Matlab by MathWorks by the following way:
function sim = lsi(A,q,k) % Input: % A ... the m × n document matrix % q ... the query vector % k ... Compute k largest singular values ; % k << n % Output: % sim ... the vector of similarity coefficients [m,n] = size(A);
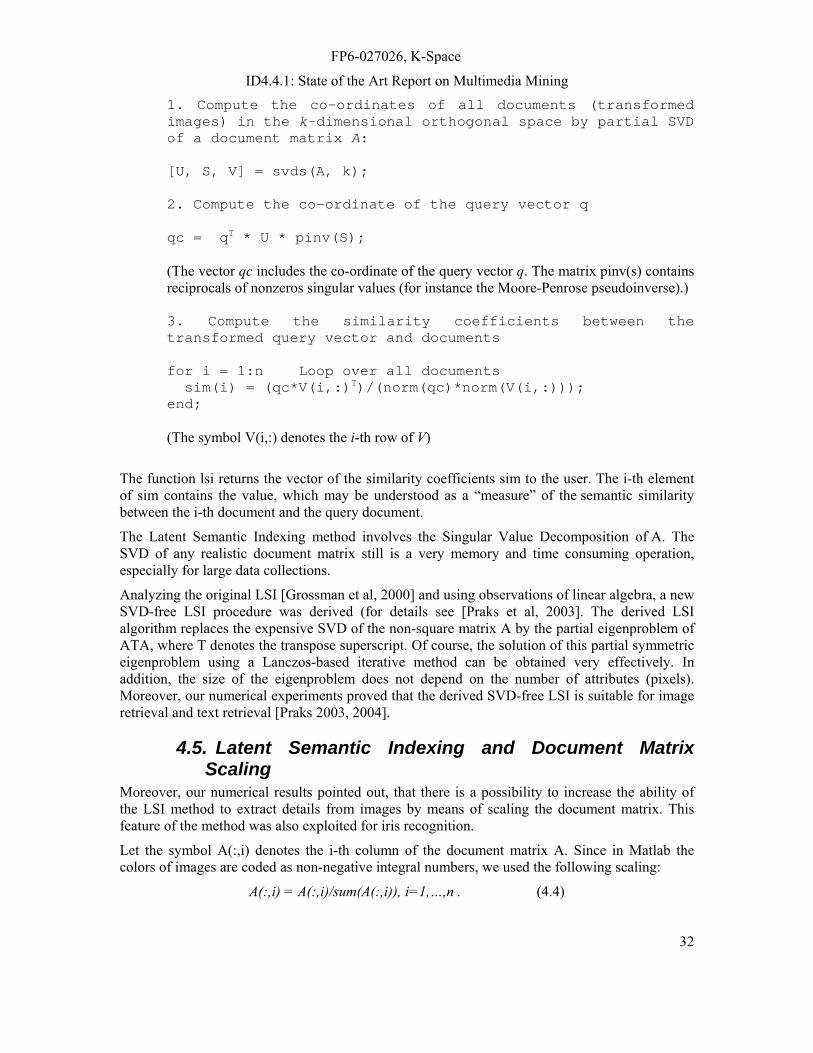
FP6-027026, K-Space
ID4.4.1: State of the Art Report on Multimedia Mining
32
1. Compute the co-ordinates of all documents (transformed images) in the k-dimensional orthogonal space by partial SVD of a document matrix A: [U, S, V] = svds(A, k); 2. Compute the co-ordinate of the query vector q qc = qT * U * pinv(S); (The vector qc includes the co-ordinate of the query vector q. The matrix pinv(s) contains reciprocals of nonzeros singular values (for instance the Moore-Penrose pseudoinverse).) 3. Compute the similarity coefficients between the transformed query vector and documents for i = 1:n Loop over all documents sim(i) = (qc*V(i,:)T)/(norm(qc)*norm(V(i,:))); end; (The symbol V(i,:) denotes the i-th row of V)
The function lsi returns the vector of the similarity coefficients sim to the user. The i-th element of sim contains the value, which may be understood as a “measure” of the semantic similarity between the i-th document and the query document.
The Latent Semantic Indexing method involves the Singular Value Decomposition of A. The SVD of any realistic document matrix still is a very memory and time consuming operation, especially for large data collections.
Analyzing the original LSI [Grossman et al, 2000] and using observations of linear algebra, a new SVD-free LSI procedure was derived (for details see [Praks et al, 2003]. The derived LSI algorithm replaces the expensive SVD of the non-square matrix A by the partial eigenproblem of ATA, where T denotes the transpose superscript. Of course, the solution of this partial symmetric eigenproblem using a Lanczos-based iterative method can be obtained very effectively. In addition, the size of the eigenproblem does not depend on the number of attributes (pixels). Moreover, our numerical experiments proved that the derived SVD-free LSI is suitable for image retrieval and text retrieval [Praks 2003, 2004].
4.5. Latent Semantic Indexing and Document Matrix Scaling
Moreover, our numerical results pointed out, that there is a possibility to increase the ability of the LSI method to extract details from images by means of scaling the document matrix. This feature of the method was also exploited for iris recognition.
Let the symbol A(:,i) denotes the i-th column of the document matrix A. Since in Matlab the colors of images are coded as non-negative integral numbers, we used the following scaling:
A(:,i) = A(:,i)/sum(A(:,i)), i=1,…,n . (4.4)
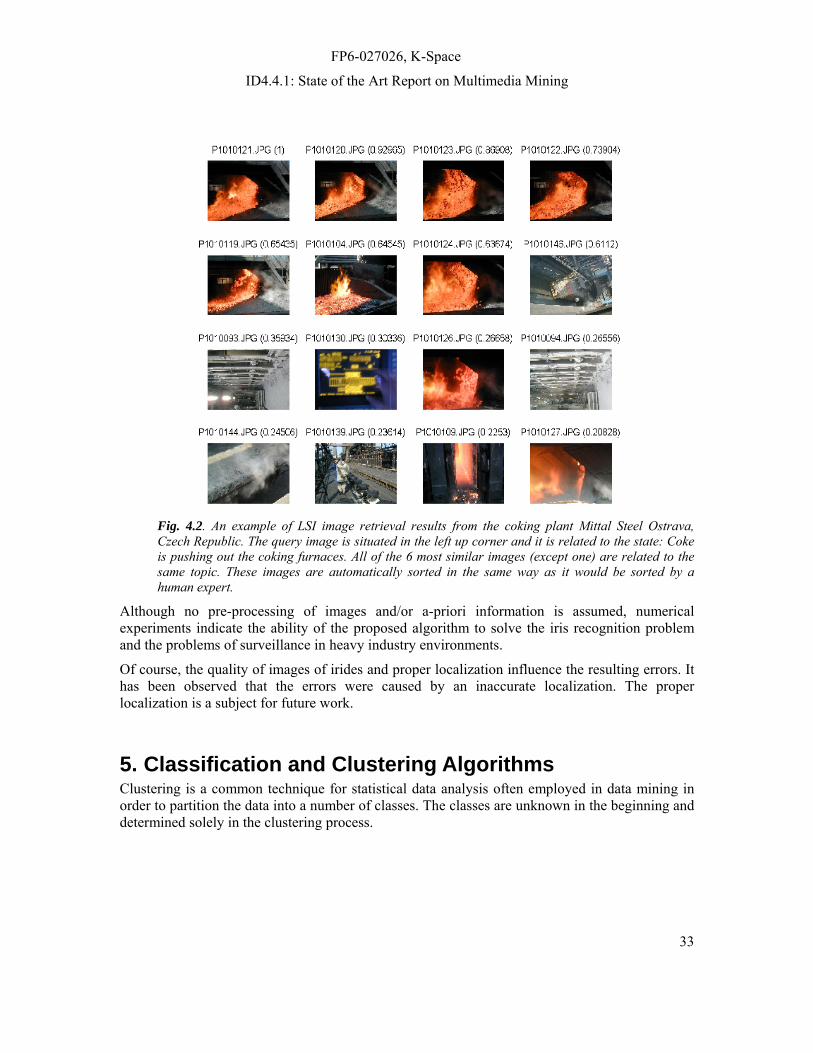
FP6-027026, K-Space
ID4.4.1: State of the Art Report on Multimedia Mining
33
Fig. 4.2. An example of LSI image retrieval results from the coking plant Mittal Steel Ostrava, Czech Republic. The query image is situated in the left up corner and it is related to the state: Coke is pushing out the coking furnaces. All of the 6 most similar images (except one) are related to the same topic. These images are automatically sorted in the same way as it would be sorted by a human expert.
Although no pre-processing of images and/or a-priori information is assumed, numerical experiments indicate the ability of the proposed algorithm to solve the iris recognition problem and the problems of surveillance in heavy industry environments.
Of course, the quality of images of irides and proper localization influence the resulting errors. It has been observed that the errors were caused by an inaccurate localization. The proper localization is a subject for future work.
5. Classification and Clustering Algorithms Clustering is a common technique for statistical data analysis often employed in data mining in order to partition the data into a number of classes. The classes are unknown in the beginning and determined solely in the clustering process.
FP6-027026, K-Space
ID4.4.1: State of the Art Report on Multimedia Mining
34
5.1. Introduction The problem of cluster analysis has been attempted by wide-range of researchers from different communities such as statistics, computer science, machine learning, pattern recognition, data mining and other related fields [Everitt et al, 2000], [Hathaway et al, 2000], [Bobrowski et al, 1991]. In cluster analysis, a group of objects are split into a number of more or less homogenous subgroups on the basis of an often subjectively chosen measure of similarity. As a result, a wide range of clustering algorithms were proposed and implemented for the corresponding area of application. This report reviews such state of the art algorithms which are relevant to the application of multimedia data mining.
A detailed report on the clustering algorithms related to low-level Image classification are presented in another internal deliverable, state of the art on User Relevance Feedback and Biologically Inspired Systems (ID4.4). General references regarding clustering include [Hartigan et al 1975, Spath et al 1980].
5.2. Distance and Similarity Measures The Minkowski distance is a metric and is invariant to translation and rotation only for
2=p (Euclidean distance). Features with large values and variances tend to dominate over other features. Richard J. Hathaway James C. Bezdek and Yingkang Hu in [Hathaway et al, 2000] applied Minkowski distance for the Fuzzy c-means (FCM) clustering algorithm.
The Euclidean distance is the most commonly used metric. It is a special case of Minkowski distance with 2=p . This metric tends to form hyper-spherical clusters. J.MacQueen applied Euclidean distance metric to K-means (see below) [Duin et al, 1999].
The city block distance is a special case of Minkowski distance where 1=p , and it tends to form hyper-rectangular clusters. G. Carpenter, S. Grossberg, and D. Rosen have applied this distance metric to Fuzzy ART [Carpenter et al, 1988].
The Mahalanobis distance removes the effect of linear correlation between features by including the covariance matrix. If the covariance matrix is equal to the identity matrix, then the Mahalanobis distance is equivalent to the Euclidean distance. If the covariance matrix is a diagonal matrix, then it is referred as Normalized Euclidean distance. This distance metric forms the hyper-ellipsoidal clusters. Pearson Correlation is not a metric, rather derived from correlation coefficient. This measure cannot detect the magnitude between two variables. This measure is applied in gene expression data. Point symmetry distance is not a metric, used to compute the distance between an object and a reference point. Distance is minimised when a symmetry pattern exists. This measure is applied in symmetry-based K-means.
The Cosine similarity metric is independent of vector length and is also invariant to rotation, but not to linear transformations. This measure is most commonly used for document clustering. The selection of different measures is problem dependent. For binary features, a similarity measure is commonly used; however, the dissimilarity measure can be obtained by ijij SD −= 1 , where ijS is the similarity measure.
5.3. Clustering Algorithms The basic procedure for cluster analysis consists of four steps: (1) feature selection or extraction; (2) cluster algorithm design or selection; (3) cluster validation; and (4) results interpretation.
FP6-027026, K-Space
ID4.4.1: State of the Art Report on Multimedia Mining
35
Traditionally clustering techniques are broadly divided into hierarchical and partitioning. Hierarchical clustering is further subdivided into agglomerative and divisive. The basics of hierarchical clustering include Lance-Williams formula, SLINK, COBWEB, CURE and Chameleon. On the other hand, partitional clustering algorithms either learn clusters directly or try to identify clusters as areas highly populated with data. Algorithms of the first kind are surveyed in the section Partitional Relocation Methods, while the latter is surveyed on Density based Partitioning.
5.3.1. Partitioning Relocation Clustering This section surveys data partitioning algorithms, which divide data into several subsets. Because checking all possible subset systems is computationally infeasible, certain greedy heuristics are used in the form of iterative optimization. Specifically, this means different relocation schemes that iteratively reassign points between the k clusters. Unlike traditional hierarchical methods, in which clusters are not revisited after being constructed, relocation algorithms gradually improve clusters. One approach to data partitioning is to take a conceptual point of view that identifies the cluster with a cluster model whose unknown parameters have to be found. Partitioning relocation methods are further categorized into probabilistic clustering (EM framework, SNOB, AUTOCLASS, MCLUST), k-medoids (PAM, CLARA, CLARANS, and extension) and K-Means methods.
In the probabilistic approach, data is considered to be a sample independently drawn from a mixture model of several probability distributions [McLachnal et al 88]. The main assumption is that data points are generated by, first randomly picking a model j with probability
kjj :1, =τ and second by drawing a point x from a corresponding distribution. The area around the mean of each (supposedly unimodal) distribution constitutes a natural cluster. So, we associate the cluster with the corresponding distribution’s parameters such as mean, variance etc. Each data point carries not only its (observable) attributes, but also a (hidden) cluster ID (class in pattern recognition). Each point x is assigned to belong to one and only one cluster, and we can estimate the probabilities of the assignment )|Pr( xC j to thj model. The overall likelihood of the training data is its probability to be drawn from the given mixture model.
)|Pr()|( :1,:1 jijKjNi CxCXL τ==∏=
Log-likelihood ))|(log( CXL serves as an objective function, which gives rise to the Expectation-Maximization (EM) method [Mitchell et al 97, Dempster et al 77, McLachlan et al 97]. EM is a two-step iterative optimization. Step E estimates probabilities )|Pr( jCx which is equivalent to a soft (fuzzy) reassignment. Step (M) finds an approximation to a mixture model, given current soft assignments. This boils down to finding mixture model parameters that maximize log-likelihood. The process continues until log-likelihood convergence is achieved. Some of the important features of probabilistic clustering are listed below:
• It can be modified to handle recodes of complex structure
• It can be stopped and resumed with consecutive batches of data, since clusters have representation totally different from sets of points
FP6-027026, K-Space
ID4.4.1: State of the Art Report on Multimedia Mining
36
• At any stage of iterative process the intermediate mixture model can be used to assign cases (on – line property)
• It results in easily interpretable cluster system
The algorithm SNOB [Wallace et al 94] uses a mixture model in conjunction with the MML principle. Algorithm AUTOCLASS [Cheeseman et al 96] utilizes a mixture model and covers a broad variety of distributions including Bernoulli, Poisson, Gaussian and log-normal distributions. Beyond fitting a particular fixed mixture model, AUTOCLASS extends the search to different models and different k . To do this, AUTOCLASS heavily relies on Bayesian methodology, in which a model complexity is reflected through certain coefficients (priors) in the expression for the likelihood previously dependent only on parameters values. An important property of probabilistic clustering is that mixture model can be naturally generalized to clustering heterogeneous data. This is important in practice, where an individual (data object) has multivariate static data (demographics) in combination with variable length dynamic data. The dynamic data can consist of finite sequences subject to a first order Markov model with a transition matrix dependent on a cluster. This framework also covers data objects consisting of several sequences, where in of sequences per ix is subject to geometric distribution [Cadez et al 00]. To emulate sessions of different length, finite state Markov model has to be augmented with a special end state.
In −k medoids methods a cluster is represented by one of its points. When medoids are selected, clusters are defined as subsets of points close to respective medoids, and the objective function is defined as the averaged distance or another dissimilarity measure between a point and its medoid. Two early versions of −k medoids are the algorithm PAM (Partitional Around Medoids) and the algorithm CLARA (Clustering LARge Applications) [Kaufman et al 90]. PAM is iterative optimization that combines relocation of points between perspective clusters with re-nominating the points as potential medoids. The guiding principle for the process is the effect on an objective function, which obviously, is a costly strategy. CLARA uses several samples each with 40+2 k points, which are each subjected to PAM. The whole dataset is assigned to resulting medoids, the objective function is computed, and the best system of medoids is retained.
Further progress is associated with Ng and Han in [Ng et al 94] who introduced the algorithm CLARANS, in the content of clustering spatial databases. Authors considered a graph whose nodes are the sets of k medoids and an edge connects two nodes if they differ by exactly one medoid. While CLARA compares very few neighbours corresponding to a fixed small sample, CLARANS uses random search to generate neighbours by starting with an arbitrary node and randomly checking neighbourmax neighbours. If a neighbour represents a better partition, the process continues with this new node. Otherwise a local maximum is found, and the algorithm restarts until numlocal local minima are found. The best node is returned for the formation of a resulting partition. The complexity of CLARANS is )( 2NO in terms of number of points. Ester in [Ester et al 95] extended CLARANS to spatial VLDB. The authors used −*R trees [Beckmann et al 90] to relax the original requirement that all the data resides in core memory, which allowing focussing exploration on the relevant part of the database that resides at a branch of the whole data tree.
The −k means algorithm [Hartigan et al 75] is by far the most popular clustering tool used in scientific and industrial applications. The name comes from representing each of k clusters jC by the mean jc of its points, the so-called centroid. While this obviously does not work well with

FP6-027026, K-Space
ID4.4.1: State of the Art Report on Multimedia Mining
37
categorical attributed, it has the good geometric and statistical sense for numerical attributed. The sum of discrepancies between a point and its centroid expressed through appropriate distance is used as the objective function. Two versions of k-means iterative optimization are known. The first version is similar to EM algorithm and consists of two-step major iterations that (1) reassign all the points to their nearest centroids and (2) recomputed centroids of newly assembled groups. Iterations continue until a stopping criterion is achieved. The latter is known as Forgy’s algorithm [Forgy et al 65] and has many advantages as listed below:
• It easily works with any pL norm
• It allows straightforward parallelization
• It is insensitive with respect to data ordering
The second version of −k means iterative optimization reassigns points based on more detailed analysis of effects on the objective function caused by moving a point from its current cluster to a potentially new one. If a move has a positive effect, the point is relocated and the two centroids are recomputed. It is not clear that this version is computationally feasible, because the outlined analysis requires an inner loop over all member points of involved clusters affected by centroids shits.
5.3.2. Density Based Partitioning An open set in the Euclidean space can be divided into a set of its connected components. The implementation of this idea for partitioning of a finite set of points requires concepts of density, connectivity and boundary. They are closely related to points nearest neighbours. A cluster, defined as a connected dense component, grows in any direction that density leads. Therefore, density based algorithms are capable of discovering clusters of arbitrary shapes. Also, this provides a natural protection against outliers. These algorithms have good scalability. These outstanding properties are tempered with certain inconveniencies. From a very general data description point of view, a single dense cluster consisting of two adjacent areas with significantly different densities (both higher than a threshold) is not very informative. Another drawback is a lack of interpretability [Han et al 01]. There are two major approaches for density based methods. The first approach pins density to a training data point and is reviewed in the sub-section Density Based connectivity. Representative algorithms include DBSCAN, GDBSCAN, OPTICS and DBCLAD. The second approach pins density to a point in the attribute space and is explained in the sub-section Density Functions. This includes algorithm DENCLUE.
Crucial concepts of this section are density and connectivity both measured in terms of local distributions of nearest neighbours. The algorithm DBSCAN (Density based spatial Clustering of Applications with Noise) [Ester et al 96] targeting low-dimensional spatial data is the major representative in this category. Two input parameters ε and MinPts are used to define:
1. An −ε neighbourhood }),(|{)( εε ≤∈= yxdXyxN of the point x
2. A core object (a point with a neighbourhood consisting of more than MinPts points)
3. A concept of a point y density – reachable from a core object x (a finite sequence of core objects between x and y exists such that each next belongs to a −ε neighbourhood of its predecessor.

FP6-027026, K-Space
ID4.4.1: State of the Art Report on Multimedia Mining
38
4. A density – connectivity of two points yx, (they should be density reachable from a common core object).
So, defined density connectivity is a symmetric relation and all the points are reachable from core objects can be factorized into maximal connected components serving as clusters. The points that are not connected to any core point are declared to be outliers (they are not covered by any cluster). The non-core points inside a cluster represent its boundary. Finally, core objects are internal points. Processing is independent of data ordering. So, far, nothing requires any limitations on the dimension or attribute types. Obviously, an effective computing of −ε neighbourhoods presents a problem. However, in the case of low-dimensional spatial data,
different effective indexing schemes exist (meaning ))(log(NO rather than )(NO fetches per search). DBSCAN relies on *R tree indexation [Kriegel et al 90]. Therefore on low-dimensional spatial data theoretical complexity of DBSCAN is O(Nlog(N)).
Hinnburg and Kein [Hinnburg et al 98] shifted the emphasis from computing densities pinned to data points to computing densigy functions defined over the underlying attribute space. They proposed the algorithm DENCLUE (DENsity-based CLUstEring). Along with DBCLASD, it has a firm mathematical foundation. DENCLUE uses a density function ∑
∈Dy
D yxfxf ),()( that is the
superposition of several influence functions. When the −f term depends on yx − the formula can be recognized as a convolution with a kernel. Examples include a square wave function
)/||(||),( σθ yxyxf −= equal to 1, if distance between x and y is less than or equal to σ and a
Gaussian influence function 22 2/||||),( σyxeyxf −−= . This provides a highest level of generality.
Other algorithms developed for handling large datasets include CURE, ROCK, Chameleon and BIRCH. The main motivation of BIRCH lies in two aspects: the ability to deal with large data sets and the robustness to outliers. In order to achieve these goals, a new data structure clustering feature (CF) tree, is designed to store the summaries of the original data. The CF tree is a height – balanced tree with each internal vertex composed of entries defined as [CFi, childi], i=1,…,B, where CFi=(Ni,LS,SS), where Ni is the number of data objects in the cluster, LS is the linear sum of the objects, and SS is the squared sum of the objects, childi is a pointer to the ith child node, and B is the threshold parameter that determines the maximum number of entries in the vertex and each leaf composed of entries in the form of [CFi], i=1…,L where L is the threshold parameter that controls the maximum number of entries in the leaf. Moreover, the leaves must follow the restriction that the diameter of each entry in the leaf is less than a threshold T. The CF tree structure captures the important clustering information of the original data while reducing the required storage. Outliers are eliminated from the summaries by identifying the objects sparsely distributed in the feature space. After the CF tree is buildt, an agglormerative HC is applied to the set of summaries to perform global clustering. An additional step may be performed to refine the clusters. BIRCH can achieve a computational complexity of O(N).
Noticing the restriction of centroid based HC, which is unable to identify arbitrary cluster shapes, Guha, Rastogi and Shim developed a HC algorithm, called CURE, to explore more sophisticated cluster shapes. The Crucial feature of CURE lies in the usage of a set of well scattered points to represent each cluster, which makes it possible to find rich cluster shapes other than hyperplanes and avoids both the chaining effect of the minimum linkage method and the tendency to favour clusters with similar sizes of centroid. These representative points are further shrunk toward the

FP6-027026, K-Space
ID4.4.1: State of the Art Report on Multimedia Mining
39
cluster centroid according to an adjustable parameter in order to weaken the effects of outliers. CURE utilizes the random sample (and partition) strategy to reduce computational complexity.
Guha et al also proposed another agglomerative HC algorithm, ROCK to group data with qualitative attributes. They used a novel measure “link” to describe the relation between a pair of objects and their common neighbours. Like CURE, a random sample strategy is used to handle large data sets. Relative hierarchical clustering is another exploration that considers both the internal distance (distance between a pair of clusters which may be merged to yield a new cluster) and the external distance (distance from the two clusters to the rest), and uses the ratio of them to decide the proximities.
Chameleon is a newly developed agglomerative HC algorithm based on the k-nearest neighbour graph, in which an edge is eliminated if both vertices are not within the k closest points related to each other. At the first step, Chameleon divides the connectivity graph into a set of subclusters with the minimal edge cut. Each subgraph should contain enough nodes for effective similarity computation. By combining both the relative interconnectivity and relative closeness, which make Chameleon flexible enough to explore the characteristics of potential clusters, Chameleon merges these small subsets and thus comes up with the ultimate clustering solution. Here, the relative interconnectivity is obtained by normalizing the sum of weights of the edges connecting the two clusters over the internal connectivity of the clusters.
5.4. Summary Clustering is a popular means to discover hidden relationships between data objects. It is often very useful in combination with visualisation techniques in order to visualise the resulting clustering. This allows the user to browse and navigate the huge information space more easily. Further clustering is very useful to make searching such huge collections more efficient by restricting the search space to relevant clusters.
6. Relevance Feedback Process Unsupervised clustering and supervised classification are important learning techniques extensively researched in the data mining community. However the performance of the single stage clustering and classification algorithms is often limited due to the problem of “Semantic Gap”. To overcome this problem, a supervised learning technique has been proposed called “Relevance Feedback”. The learning process from relevance feedback is achieved in an interactive session, in which the user responds to the data objects to be classified by attaching appropriate labels. The decision depends on the relevancy of returned documents during a retrieval process.
This section is organized as follows. In section 6.1, a brief introduction to learning from relevance feedback is presented, followed by the motivation to use adaptive interfaces for content retrieval systems. In section 6.3 a selection of relevance feedback techniques is presented, including Neural Network, Bayesian and Support Vector Machines (SVM) based relevance feedback techniques, followed by a review of existing relevance feedback systems (PicSOM and PicHunter) based on different approaches in section 6.4.

FP6-027026, K-Space
ID4.4.1: State of the Art Report on Multimedia Mining
40
6.1. Learning from Relevance Feedback Learning has been the dominating factor to narrow the semantic gap in CBIR arising from the low-level feature representation in the last few years. The idea of incorporating relevance feedback first emerged in text retrieval systems [Rocchio, 1971], and has been studied since. In comparison to purely text-based information retrieval (IR) systems, RF techniques are even more valuable in the image domain: a user can tell instantaneously whether an image is relevant with respect to their current context (information need, awareness of information need, etc.), while it takes substantially more time to read through a text document to estimate its relevance.
RF techniques are regarded as an invaluable tool to improve CBIR systems, for several reasons. Apart from providing a way to embrace the individuality of users, they are indispensable to overcome the semantic gap between low-level image features and high-level semantic concepts. The user’s judgement of relevance is naturally based on their current context, their preferences, and also their way of judging the semantic content of the images. The low-level image features are used as a quick way to ‘estimate’ the relevance values of the images. By prompting the user for relevance feedback, this initial estimation can be improved to steer the results in the direction the user has in mind. Rather than trying to find better techniques and more enhanced image features in order to improve the performance of what has been referred to as “computer-centric” systems [Rui et al, 1998], it is more satisfactory to the user to exploit human computer interaction to refine high level queries to representations based on low level features. This way, the subjectivity of human perception and the user’s current context are automatically taken into account, as well. Consequently, a number of algorithms have been proposed over the last decade. A comprehensive study of existing relevance feedback techniques in image retrieval can be found in [Zhou et al, 2003].
Relevance feedback is engaged with finding optimised ways of updating the parameters of the retrieval algorithm. Conventional approach implement query refinement techniques [Ishikawa et al, 1998, Porkaew et al, 1999, Rui et al, 2000]. These approaches underlie a geometric interpretation of the feature and query space. In most CBIR systems, the images are represented by their feature vectors in the vector space model [Salton et al, 1983]. Hence, query refinement approaches strive to find the “ideal” query point that minimises the distance to the positive examples provided by the user. Alternatively, RF has also been formulated in probabilistic frameworks as belief propagation [Cox et al, 2000, Vasconcelos et al, 2000], or as a classification task [Wood et al, 1998, Tong et al, 2001].
Although being an active research interest for many researchers over a decade, RF techniques still suffer from many drawbacks. One of the important drawbacks is the flexibility to adjust the degree of relevance over time, with notable exception of the probabilistic approach as mentioned by Vasconcelos in [Vasconcelos et al, 2000]. The problem can be stated as the lack of optimal query for a specific user preference. To address this problem, one common approach is to make an assumption that the multimedia content space could be divided into relevant and non-relevant categories. Therefore, after a number of iterations, the system is trained to generate satisfactory results based on user preference.
The second drawback is that existing RF techniques do not exploit implicit feedback for training the system, where the explicit judgement of the user on the multimedia content is alone considered. The implicit feedback refers to observing user’s preference. Effective research into monitoring and observing RF technique could be used to help user to stay focussed on the current context.
FP6-027026, K-Space
ID4.4.1: State of the Art Report on Multimedia Mining
41
Finally, browsing is typically not supported. The relevance feedback approaches usually assume category search or target search for simplicity of their algorithms. However, the user will greatly benefit of an environment in which both retrieval and browsing is combined. The possible nature of the tasks a user might want to perform is extremely diverse, and the user should not be restricted to this end by the functionality of the system.
6.2. Adaptive Interfaces The solution to the above mentioned drawbacks of existing tools lies in developing even more user-centric systems. The interface is the mediator between the user and the search system and as such is a vital component around which the development of new retrieval approaches should be centred. From the perspective of the user, it is the entry point to the system. A properly designed interface assists the user with meaningful and intuitive ways of communicating their information need to the system and displays results in ways that stimulate the user and enhance performance.
Initially, the major innovation has been to create more meaningful result displays to replace the traditional linear result display, ranked by similarity to the query, with two- or three-dimensional maps of the returned images [Santini et al, 2000, Chen et al, 2000]. These multidimensional displays aim at revealing relationships between images by visualising mutual similarities between any two images. By depicting relationships between images in a global view, the user can form a more accurate mental model of the database and support navigation within it. A user study conducted by [Rodden et al, 2001] has pointed to the benefits of a display organised by similarity for image browsing.
On the other hand, the representation of information in the retrieval system has traditionally been confined to those suitable for retrieval. Thus, in image retrieval systems the interface was focused on the provision of query components to specify the appropriate image features used for retrieval, eg QBIC developed by IBM [Flickner et al, 1995]. However, in order to support the way information is used and managed, the interface has to include better result handling and personalisation techniques.
The Ostensive Model of developing information needs proposed by Campbell and van Rijsbergen [Campbell et al, 1996] combines the two complementary approaches to information seeking: query-based and browse-based. It supports a query-less interface, in which the user’s indication of the relevance of an object—through pointing at an object, is interpreted as evidence for it being relevant to their current information need. Therefore, it allows direct searching without the need of formally describing the information need. The model adds a temporal dimension to the notion of relevance. A recently selected object is regarded more indicative to the current information need than a previously selected one. So, in this sense, the degree to which a document is considered relevant is continuously updated to reflect the changing context.
The interaction with an Ostensive Browser follows an intuitive scheme. In this model, one query image is provided to the user and is then presented with new set of candidate images (top ranking documents according to the similarity measure used). As a next step, the user selects one of the returned images and in this way updates the query, which now consists of the original image and the selected image of the set of returned candidates. After a couple of iterations, the query is based on a path of documents. A path represents the user’s motion through information, and taken as a whole is used to build up a representation of the instantaneous information need. Since the whole path is visible to the users, they can jump back to a previous object along the path if they get the feeling that they are stuck or moving in the wrong direction. From there a new path can be

FP6-027026, K-Space
ID4.4.1: State of the Art Report on Multimedia Mining
42
explored, starting from the original object (the root) and the newly selected object. The resulting paths form a tree-like structure, originating from one root and branching at various objects.
In the EGO system [Urban et al, 2005] the major emphasis lies on the long-term management and personalised access to the image (or multimedia) collection. The long-term usage provides additional search clues such as usage histories of images and groups that is combined with the low-level image features to provide an adaptive retrieval framework. EGO provides the means to describe a long-term multifaceted information need. To achieve this, the user and the system interactively group potentially similar images. The process of grouping images stretches over multiple sessions, so that existing groups are changed and new ones are created whenever the user interacts with the collection. Through a simple interaction strategy the user provides feedback information without having to think in terms of the system’s internal representation. The organisation of images into groups is more natural to the user and matches more closely to the process of accomplishing the task.
By placing the groups on a separate workspace, the users leave trails of their actions for themselves or others to inspect and follow. The process is incremental and dynamic: an organisation is built up and changes by usage. A semantic organisation emerges that reflects the user’s mental model and the work tasks. These are the two most important influences on the organisation of personal media recognised in [Kang et al, 2003]: “There is no unique or right model; rather the mental model is personal, has meaning for the individual who creates it, and is tied to a specific task.” EGO is a personalised “retrieval in context” system that allows the user to effectively manage and search their images. It captures both short- and long-term information needs, communicated by leaving behind trails of actions, and used by the system to adapt to the user’s need.
Both the Ostensive Browser and EGO are examples of adaptive systems, in which the feedback from the user interaction provides contextual information that is vital to exploit a semantically enriched retrieval process. Still, more needs to be done to this end. Nevertheless, semantic features can only be developed with the help of adaptive systems that learn from their users.
6.3. Relevance Feedback Learning Techniques
Various techniques have been successfully implemented for incorporating user’s preference in Relevance Feedback. In this section, Neural Network, Bayesian and Support Vector Machine (SVM) based learning techniques are briefly reviewed, along with the analysis of the existing relevance feedback framework. A detailed analysis of the above mentioned topics are provided in internal deliverable ID4.4, in section User Relevance Feedback.
6.3.1. Neural Network based Relevance Feedback In [Bordogna et al, 1996], the authors present a relevance feedback model based on an associative neural network in which meaningful concepts to the user are accumulated at retrieval time by an interactive process. The network was regarded as a kind of personal thesaurus to the users. A rule based superstructure is then defined to expand the query evaluation with the meaningful terms identified in the network. The search terms are expanded by taking into account their associations with the meaningful terms in the network. The authors apply this approach to Information Retrieval, which in general performed through an iterative and cooperative process of trial and error between the user and the system. In this approach the authors generate the thesaurus of
FP6-027026, K-Space
ID4.4.1: State of the Art Report on Multimedia Mining
43
concepts on the basis of the relevant documents selected by the user from among those retrieved by the original query.
In [Koskela et al, 2001] the authors present a content-based image retrieval (CBIR) system, which uses self organizing maps (SOM) for indexing images with their low-level features. SOM’s represent unsupervised topologically ordered neural networks, which projects a high dimensional input space (n-dimensional feature vectors) into a low dimension lattice. The latter, usually being a two-dimensional grid with n-dimensional neighbours connected in appropriately weighted nodes. This approach considers QbE and iterative refinement using RF [Koskela et al, 2004]. In order to reduce computation PicSOM uses the hierarchical structure of Tree-Structured SOM (TS-SOM). TS-SOM reduces complexity for training large SOM by using the hierarchy for finding the best matching unit (BMU) of an input vector. SOM organizes similar feature vectors into neighbouring neurons, so that relevance information is mapped from the images labelled by the user to appropriate BMU’s and after low-pass filtering with Guassian spread to the neighbouring neurons with similar feature vectors. PicSOM supports multiple features by employing parallel SOM for each feature [Laaksonen et al, 1999]. Further details are provided latter in the section.
In [Zhao et al, 2003] authors propose to address the issue of image retrieval which corresponds to human perception. The authors propose to control the order vector used in Synergetic Neural Nets (SNN) [Wang et al, 2004] and use it as the basis of a similarity function for shape based retrieval. Based on the properties an efficient affine invariant similarity measure has been developed for trademark images. Furthermore a self-attentive retrieval and relevance feedback mechanism for similarity measure refinement is presented
In [Wu et al, 2003], a fuzzy RF approach was introduced, in which the user provides a fuzzy judgement about the relevance of an image, unlike in binary relevance systems with a hard decision on relevance. A hierarchical tree with multiple levels of informational provided to the user is defined in the first step. A continuous fuzzy membership function is used to model user’s fuzzy feedback by weighting different images labelled as fuzzy with different weights to simulate user’s perception. For learning users preferences and visual content interpretation a radial basis function (RBF) neural network is used. RBF neural network in combination with the fuzzy approach is denoted as fuzzy radial basis function (FBRF) network
6.3.2. Bayesian Framework based Relevance Feedback In [Giacinto et al, 2004], a Bayesian decision theory was introduced to estimate the boundary between relevant and non-relevant images in relevance feedback mechanisms. The Bayesian approach computes the new query point based on RF from the user scenarios where images are indexed by a global feature vector, the similarity function is defined through a metric measure, and images are retrieved by the k-NN algorithm. The idea is to use local estimation of the decision boundary between the “relevant” and “non-relevant” images in the neighbourhood of the original query. The new query is then placed at a suitable distance from such boundary, on the side of the region containing relevant images.
In [Su et al, 2003], a new relevance feedback approach based on Bayesian classifier was proposed. This approach evaluates positive and negative feedback examples with different strategies. Not only can the retrieval performance be improved for the current user, but the improvements can also help subsequent users. The authors also apply the Principle Component Analysis (PCA) techniques, the feature subspace is extracted and updated during the feedback process, so as to reduce the dimensionality of feature spaces, reduce noise contained in the
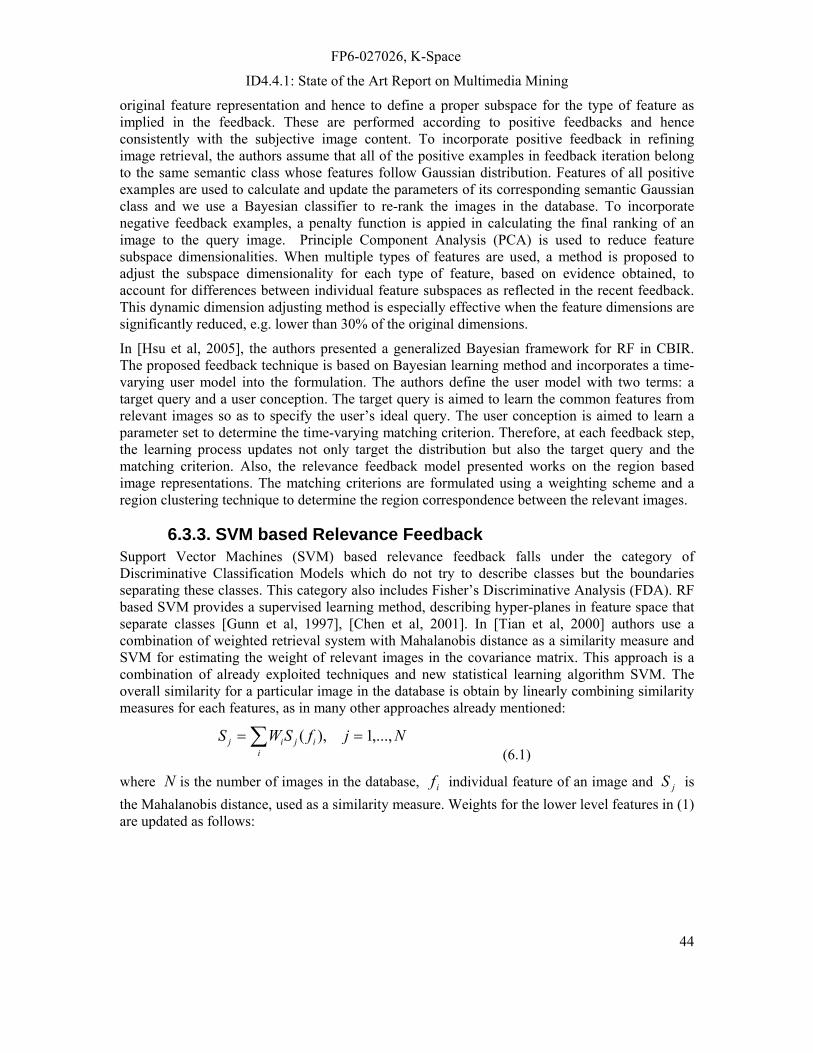
FP6-027026, K-Space
ID4.4.1: State of the Art Report on Multimedia Mining
44
original feature representation and hence to define a proper subspace for the type of feature as implied in the feedback. These are performed according to positive feedbacks and hence consistently with the subjective image content. To incorporate positive feedback in refining image retrieval, the authors assume that all of the positive examples in feedback iteration belong to the same semantic class whose features follow Gaussian distribution. Features of all positive examples are used to calculate and update the parameters of its corresponding semantic Gaussian class and we use a Bayesian classifier to re-rank the images in the database. To incorporate negative feedback examples, a penalty function is appied in calculating the final ranking of an image to the query image. Principle Component Analysis (PCA) is used to reduce feature subspace dimensionalities. When multiple types of features are used, a method is proposed to adjust the subspace dimensionality for each type of feature, based on evidence obtained, to account for differences between individual feature subspaces as reflected in the recent feedback. This dynamic dimension adjusting method is especially effective when the feature dimensions are significantly reduced, e.g. lower than 30% of the original dimensions.
In [Hsu et al, 2005], the authors presented a generalized Bayesian framework for RF in CBIR. The proposed feedback technique is based on Bayesian learning method and incorporates a time-varying user model into the formulation. The authors define the user model with two terms: a target query and a user conception. The target query is aimed to learn the common features from relevant images so as to specify the user’s ideal query. The user conception is aimed to learn a parameter set to determine the time-varying matching criterion. Therefore, at each feedback step, the learning process updates not only target the distribution but also the target query and the matching criterion. Also, the relevance feedback model presented works on the region based image representations. The matching criterions are formulated using a weighting scheme and a region clustering technique to determine the region correspondence between the relevant images.
6.3.3. SVM based Relevance Feedback Support Vector Machines (SVM) based relevance feedback falls under the category of Discriminative Classification Models which do not try to describe classes but the boundaries separating these classes. This category also includes Fisher’s Discriminative Analysis (FDA). RF based SVM provides a supervised learning method, describing hyper-planes in feature space that separate classes [Gunn et al, 1997], [Chen et al, 2001]. In [Tian et al, 2000] authors use a combination of weighted retrieval system with Mahalanobis distance as a similarity measure and SVM for estimating the weight of relevant images in the covariance matrix. This approach is a combination of already exploited techniques and new statistical learning algorithm SVM. The overall similarity for a particular image in the database is obtain by linearly combining similarity measures for each features, as in many other approaches already mentioned:
∑ ==i
ijij NjfSWS ,...,1),( (6.1)
where N is the number of images in the database, if individual feature of an image and jS is the Mahalanobis distance, used as a similarity measure. Weights for the lower level features in (1) are updated as follows:

FP6-027026, K-Space
ID4.4.1: State of the Art Report on Multimedia Mining
45
iiNR
k
NR
kik
i dW
kV
fSkVd 1,
)(
)()(
1
1 ==
∑
∑
=
=
.(6.2)
where )(kV denotes the weight for the thk relevant image, which will be determined by the use of SVMs, NR represents the overall number of positive feedback examples. A smaller normalized distance id gives a higher weight to a feature.
For determining the weight for thk relevant image )(kV users feedback SVMs are exploited. The aim is to separate and classify positive and negative examples. For this purpose the user must give negative and positive example feedback, and the new weights for relevant examples are automatically obtained from SVM learning.
If a user provides a set of training samples either positive +1 or negative –1:
1/1,)},{( 1 −+== iNiii yyxr . (6.3)
where ixr is a feature vector for the thi image and iy is a label. SVM searches for an optimal hyper-plane to separate positive and negative examples:
0=+ bxwT r (6.4)
Here w denotes the weight and b the bias. SVM tries to find optimal 0w and 0b to maximize the distance between the feature vectors belonging to different classes but being closest to the separation hyper-plane. Thus the distance of a point from the plane is given as:
0
0000 ),,(
w
bxwxbwd
T +=
rr
. (6.5)
Different weights are assigned based on the distance of positive examples from the hyper-plane, the larger the distance the more distinguishable the examples are from the negative ones and the large the weights. In case that the two classes are not linearly separable implementing inner product kernel functions maps the input feature space into a higher dimensional space where the boundary can be easily determined.
A new approach proposed in [Jing et al, 2004a], [Jing et al, 2004b] is a region-based method for extracting local region features. Automatic extracting of semantically meaningful image objects is still not fully possible even in state-of-the-art segmentation methods. Some RF approaches partition an object into several regions and ask the user to determine relevant one, in this way they place an additional burden on the user. Whereas in this approach the authors combine regions and perform image-to-image similarity matching by using EMD which allows different dimensions of feature vectors. In SVM-based classification both positive and negative labelled images are used as training data to learn the classifier how to separate the unknown part of the database, the test set, into two or more classes. Kernels in SVM are based on inner product in the input space, and in [divna4] a new kernel is introduced to better accommodate region-based
FP6-027026, K-Space
ID4.4.1: State of the Art Report on Multimedia Mining
46
approach. This new kernel is a generalization of the Gaussian with the Euclidian norm replaced by EMD [Rubner et al, 1998]:
)2/),(exp(),( 2σyxdyxKGaussian −= . (6.6)
Where d is the distance measure and in the general case this is Euclidian norm, in this specific case it is EMD. Signature for EMD for each image is a vector of pairs (feature of a region, weight of a region) for all regions. Hence, the length of image representations is variable due to different numbers of segmented regions. EMD incorporates features of all the regions allowing many-to-many relationships and thus robustness to inaccurate segmentations [Jing et al, 2004b].
6.4. Existing Relevance Feedback Systems The development of relevance feedback techniques often goes hand-in-hand with the development of interfaces that allow the user to provide such feedback. In the following section, we will discuss two interfaces that have been developed for particular relevance feedback algorithms.
6.4.1. PicHunter Cox et al. [Cox et al, 2000] present the theory, design principle, implementation and performance results of PicHunter, a prototype content-based image retrieval (CBIR) system. The PicHunter project makes four primary contributions to research on content-based image retrieval. First, PicHunter represents a simple instance of a general Bayesian Framework described for using relevance feedback to direct a search. With an explicit model of what users would do, given what target image they want, PicHunter uses Bayes rule to predict what the target they want, given their actions is. This is done via a probability distribution over possible image targets, rather than by refining a query. Second, entropy – minimizing display algorithm is described that attempts to maximize the information obtained from a user at each iteration of the search. Third, PicHunter makes use of hidden annotation rather than a possibly inaccurate/inconsistent annotation structure that the user must learn and make queries in. Finally, PicHunter introduces two experimental paradigms to quantitatively evaluate the performance of the system, and psychophysical experiments are presented that support the theoretical claims.
During each iteration ,..2,1=t of a PicHunter session, the program displays a set tD of
DN images from its database, and the user takes an action tA in response, which the program observes. For convenience the history of the session through iteration t is denoted tH and consists of },,...,,,,{ 2211 tt ADADAD . The database images are denoted as nTT ,...,1 and PicHunter takes a probabilistic approach regarding each of them as a putative target. After iteration t PicHunter’s estimate of the probability that database image iT is the users target T , given the session history, is then written ).|( ti HTTP = The system’s estimate prior to starting the session is denoted )( iTTP = . After iteration t the program must select the next set 1+tD of images to display. The canonical strategy for doing so selects the most likely images. From Bayes rule the following equation can be derived:

FP6-027026, K-Space
ID4.4.1: State of the Art Report on Multimedia Mining
47
∑=
==
====
====
n
jjjt
iitti
tiit
ti
TTPTTHP
TTPTTHPHTTP
HPTTPTTHPHTTP
1)()|(
)()|()|(
)()()|()|(
(6.7)
That is, the a posterior probability that image iT is the target, given the observed history, may be
computed by evaluating )|( it TTHP = , which is the history’s likelihood given that the target
is, in fact iT . Here, )( iTTP = represents the a priori probability. The canonical choice of )( iTTP = assigns probability n/1 to each image, but one might use other starting functions that
digest the results of earlier sessions. The heart of the Bayesian approach is the term ),,|( 1−= ttit HDTTAP which the authors refer to as the user model because its goal is to
predict what the user will do given the entire history 1, −tt HD and the assumption that iT is his/her target.
6.4.2. PicSOM In [Laaksonen et al, 2002], the authors implemented a CBIR system based on Self Organizing Maps (SOM) using relevance feedback mechanism. The technique is based on SOM’s inherent property of topology-preserving mapping from a high-dimensional feature space to a two-dimensional grid of artificial neurons. On this grid similar images are mapped in nearby locations, As image similarity must, in un-annotated databases, be based on low-level visual features, the similarity of images is dependent on the feature extraction scheme used. Therefore, in PicSOM there exists a separate tree-structured SOM for each different feature type. The incorporation of the relevance feedback and the combination of the outputs from the SOM’s are performed as two successive processing steps.
Query By Pictorial Example (QBPE) is a common retrieval paradigm in content-based image retrieval applications [Chang et al, 1980]. In implementing relevance feedback in a CBIR system, three minimum requirements need to be fulfilled. First, the system must show the user a series of images, remember what images have been shown and not to display them again. Thus, the system will not end up in a loop and all images will eventually be displayed. Secondly, user must somehow indicate which images are to some extent relevant to the present query and which are not, these are termed as positive and negative images respectively. As the third requirement, the system must change its behaviour depending on which images are included in the positive and negative image sets. During the retrieval process, more and more images are accumulated in the two image sets, and the system has an increasing amount of data to use in retrieving the succeeding image sets. The art of relevance feedback is finding the ways which use this information most efficiently.
The authors formalize the CBIR process by denoting the set of images in the database as D and
its non-intersecting subsets of positive and negative seem images as +D and −D respectively.
The unseen images can then be marked as D′which leads to:
FP6-027026, K-Space
ID4.4.1: State of the Art Report on Multimedia Mining
48
)(
)/(−+
−+
+−=′
+=′
NNNN
DDDD
(6.8)
Where N denotes the cardinalities of the respective sets. If there are M different feature vectors
for each image, they can be written as mnn
m fIf =)( where Mm ,...,2,1= . The *N images the
system the system will display to the user next can be denoted with
DIIID N ′⊂= **2
*1
* ,...,,{ .An image database may contain millions of images. It is not possible to calculate accurately all distances between all the positive seen images and all the unseen images in the database. Therefore, some computational shortcuts are to perform distance calculation in offline mode, the second is to divide and conquer the image selection process by making it in two stages. Each feature representation can be used separately for finding a set of matching image candidates. The latter approach is advantageous if the distance calculated in the different feature spaces are weighted dynamically. In such a case it is not possible to order images in each subset, whose number should not exceed the count of images finally shown to user. These per-feature subsets will be combined in a larger set of images which will be processed in a more exhaustive manner. The third technique is to use quantisation.
A hierarchical SOM has been utilized as an indexing tool with texture features in CBIR [Zhang et al, 1995]. In another system a hierarchical SOM has been constructed for image database exploration and similarity search by using colour information [Sethi et al, 1999]. Objects of an image database have also been organised according to their boundary shapes in a two-dimensional browsing tree by SOM [Han et al, 1996]. SOM has additionally been used for feature extraction in image databases containing astronomical images [Csillagphy, 1997]. The unsupervised clustering property of SOM has been used also for image segmentation [Chen et al, 1999].
The PicSOM image retrieval system is a general framework for generic research on algorithms and methods for content-based image retrieval. PicSOM supports multiple parallel features and with a techniques introduced in the PicSOM system, the responses from the parallel TS-SOM’s are combined automatically. The implementation uses colour, shape and texture features and as well as six different shape features.
7. Multimedia Mining Applications Having discussed various techniques for Multimedia Mining, this section will briefly introduce current applications of these techniques.
7.1. Image Mining Tesic [2004], discuss techniques on mining images and videos. Image and video mining techniques have novel applications in aerial image analysis and remote sensing. For example, consumer-grade video cameras are being increasingly used as remote sensing devices in geographic domains. These cameras are being flown in small planes over large areas of the Amazon forest to provide inexpensive alternatives to the satellite imagery. These video datasets are valuable resources for studying deforestation processes, but the size of these datasets makes manual analysis infeasible. Automatic analysis techniques are needed. They have extensively
FP6-027026, K-Space
ID4.4.1: State of the Art Report on Multimedia Mining
49
investigated the use of homogeneous texture to annotate and classify aerial images. These image features have been shown to be effective at classifying land types of interest: primary forest, secondary forest, and pasture. Analyzing the spatial arrangements of these land types gives further information about the stage of deforestation. For example, islands of forest surrounded by pasture are prone to dying out. Spatial data structures, such as Spatial Event Cubes, summarize the spatial arrangements of the land types. These summaries in turn allow effective analysis and visualization.
7.2. Video Mining The Informedia Digital Video Library (IDVL) system extracts information from digital video sources and allows full content search and retrieval over all extracted data. The system uniquely utilizes integrated speech, image and natural language understanding to process broadcast video. The News-on-Demand collection enables review of continuously captured television and radio news content from multiple countries in a variety of languages. A user can look for relevant material and review the sequence of news stories related to an event of interest in the world news. The Informedia system allows information retrieval in both spoken language and video or image domains. Queries for relevant news stories may be made by words, images or maps. Fast, high-accuracy automatic transcriptions of broadcast news stories are generated through speech recognition, and closed captions (teletext) are incorporated where available. Faces are detected and can be searched for in the video. Text visible on the screen is recognized through video OCR and can also be searched for. Images can be searched by multiple image retrieval mechanisms. These ideas are being extended and applied to analyse and mine patterns in videos belonging to multiple genres (e.g., care home, traffic monitoring, news videos etc.) [Informedia]
At Mitsubishi Electric Research laboratories (MERL) (http://www.merl.com/projects/ VideoMining/), video mining problem is approached by discovering patterns. Patterns in audio-visual content through principal cast detection, sports highlights detection, and location of "significant" parts of video sequences are identified and used for video browsing. Since content production styles vary widely even within genres, content-adaptive event detection is essential. Furthermore, the unusual events are both rare and diverse making application of conventional machine learning techniques difficult. The objective of the research at MERL is to develop techniques to adaptively detect unusual audio-visual events for both consumer applications such as video browsing systems for HDD-enabled DVD recorders, and surveillance video applications such as traffic video monitoring. Divakaran et. al [2004] discuss the meaning and significance of the video mining problem. A simple definition of video mining is unsupervised discovery of patterns in audio-visual content. Such purely unsupervised discovery is readily applicable to video surveillance as well as to consumer video browsing applications. They interpret video mining as content-adaptive, in which the first stage is content characterization and the second stage is event discovery based on the characterization obtained in stage 1. They target consumer video browsing applications such as commercial message detection, sports highlights extraction etc. and employ both audio and video features. It has been reported that supervised audio classification combined with unsupervised unusual event discovery enables accurate supervised detection of desired events.
Roy Wang et al. from the University of Illinois at Urbana-Champaign discuss a framework of human motion tracking and event detection for video indexing and mining [Wang et. al. 2004]. Tracking and identifying human body motions are important issues for automatic indexing and discovering human-related events in video. Discovered dynamic information such as motion trajectories and event types are ideal metadata for video indexing. Model-based abnormal human
FP6-027026, K-Space
ID4.4.1: State of the Art Report on Multimedia Mining
50
motion event discovery also has significant applications in video mining. The major challenges encountered in these tasks, often in the form of monocular video analysis, arise from the following: unknown camera motion, background clutter, non-rigid articulation of objects of interest, and occlusion. To robustly track and analyze human motion in the light of these unknown conditions, we report a Maximum APosteriori (MAP) probabilistic framework based on random sampling and temporal integration, in which tracking and event analysis operate simultaneously. The state space model employed permits the use of a mixture of discrete and continuous features, which are represented and propagated harmoniously in a particle-based random sampling fashion. The formulation of object tracking and analysis as state space traversal problems allows analysis of multiple frames. The maximization of a joint data and state likelihood across time enables us to track objects robustly and analyze their events concurrently. To deal with the curse of high dimensionality as the size of the state space increases, they identify active nodes in temporal trellis with the Expectation Maximization (EM) algorithm. The random samples are propagated through video frames based on multiple modes discovered by the EM algorithm. The sparsity of node distribution affords good scalabilities when the dimensionality of state space increases. Such a mixture summarization of local probabilistic density has multiple advantages, 1) increased efficiency of re-sampling, 2) prevention of sample depletion, 3) identification of active nodes for further trellis decoding, and 4) ability to tie event analysis to the discrete portions of active nodes. The event analysis can co-occur with tracking because they operate essentially in the same state space. The discrete part of the space is our exemplar-based human body model; while the continuous counterpart is a set of allowable transformations of the model, such as translation and scaling. We model profile views of human body by its 2D appearances. They first extract spatial and temporal gradient features of walking humans in a large training set, and then learn a set of exemplar templates to serve as our 2D model for human motions. By computing the pair-wise distance between the model and an observation, and training of a transition matrix between model configurations, we constructed three common components in our tracking and analysis framework: object representation, object measurement model, and object dynamics model. These enable temporal event detections to be performed in a finite-state machine, whose parameters are derived from supervised training.
The Multimedia Mining Toolbox [Rehatschek et al, 2004] provides users and application developers with tools for powerful combined text and content-based search. Digital content analysis and annotation for the latter is fully automatic. Manual annotation and usage of legacy metadata is included for text-based search. It also boasts a revolutionary video summary view. The Multimedia Mining Toolbox focuses on moving images, but also supports still images and audio. It comprises the following tools: media-analyze, media-find, media-summary and media-backend.
The media-analyze component imports media into the search database and performs a fully automatic content analysis. It recognizes characteristic camera motion, shots including dissolves, relevant key frames, moving objects, and extracts several image similarity features. Furthermore it supports manual entry of text-based metadata. The media-find search tool provides very fast access to digital archives by supporting the formulation of combined text and content-based queries for visual content. The tool enables efficient search for all features automatically extracted by the media-analyze tool. E.g., a user may search for video items recorded in the city of “Graz“ at night by typing “Graz” in the location field and by providing a still image with a night scene.
An innovative media-summary viewer is part of the Multimedia Mining Toolbox for the efficient evaluation of visual results. It visualizes an entire video on one screen in terms of a temporal
FP6-027026, K-Space
ID4.4.1: State of the Art Report on Multimedia Mining
51
summary/overview and by providing efficient navigation functionality by shot structure and key frames. All content can be played back at various speeds and trimmed for further editing. The media-backend provides the infrastructure necessary for metadata storage and search for the tools mentioned above. Through its well-defined interfaces it is also perfect for use in third party applications. MPEG-7 is utilized for all metadata stored within the media-backend, hence the system is open to other applications and even conversions to other standards are possible. All queries are expressed in SQL. The Multimedia Mining Toolbox may be easily integrated into already existing asset management systems, content annotation and monitoring solutions.
7.2.1. Sports Videos In sports video databases, event mining is a popular research area and plays a key role in sports video analysis, which discovers temporal patterns among video sequence and identifies events of interest. Such identified events are used in various applications, such as video summary generation [Ballie et al, 2003; Ren et al, 2006], play-break structure decomposition [Xu et al, 2001] and video modelling [Ren et al, 2006]. Some extracted semantically important events, e.g. a goal in a football match, are typically employed in practice for selective video skimming of highlights or video summary creation. Several Markov models have been introduced in the mining process [Xu et al, 2001; Lenardi et al, 2004] usually requiring manual training. Nevertheless, Chang et al. proved that with a hierarchical structure a hidden Markov network can automatically learn play-break structure without supervision [Xie & Chang, 2003]. They used a Markov blanket to rank the effectiveness of multimedia features. They have applied these techniques to baseball and football videos. Results show automatic discovery of interesting, although unsurprising, patterns corresponding to play-break structure in the game. When evaluated with manual labels, the accuracy is very encouraging and comparable to those by supervised approaches. This approach is being extended to feature selection methods to other domains such as surveillance, news, and consumer.
7.2.2. Medical Videos Zhu et. al [2003] mine medical video for efficient browsing. The continuous video stream is parsed into smaller physical units like shots, and then key frames are extracted. Video shot grouping, group merging, and scene clustering schemes are then applied to generate a hierarchical structure. Audio and video processing is integrated to mine event information such as dialog, presentation and clinical operation, from the detected scenes.
7.2.3. Surveillance Videos Research in data mining techniques for surveillance videos has become increasingly popular over the last few years due to the ever increasing number of surveillance cameras installed with the growing safety and security concerns. In surveillance videos objects (i.e., person, car, airplane, etc.) are commonly extracted from video sequences, and modelled by specific domain knowledge. The behaviour of those objects is then monitored (tracked) to find any abnormal or interesting situations, such as piggy-backing through restricted access doors.
7.3. User Behaviour Mining User behaviours in large video databases have been analysed to mine important video items [Mongy et. al]. User behaviour data is captured and analysed to help navigation of video
FP6-027026, K-Space
ID4.4.1: State of the Art Report on Multimedia Mining
52
repositories. The idea is to discover which videos have been accessed by users and how and why. This information is used to improve the quality of the retrieved data set. A framework combining intra-video usage mining and inter-video usage mining to generate user profiles on a video search engine is introduced. In inter-video usage mining data such as play, pause, forward etc. are collected. At this level a particular video and its sequence viewing is considered as the first unit. In inter-video usage mining the transitions between video sequence viewing is captured. Intra-video user behaviour is modelled by a first order and non-hidden Markov model. This model is constructed using the different actions taken by the user while viewing the video. An adapted version of the K-means cluster method is used for clustering inter-video usage data. This enabled them to characterize several behavioural types.
8. General Conclusion Multimedia mining attempts to automatically discover knowledge in multimedia datasets. It is a comparatively young discipline and the research community is still adapting techniques from more established fields, such as artificial intelligence and pattern recognition, and developing new techniques particularly tailoured for multimedia mining applications. The exponential growth of multimedia data in consumer as well as scientific applications, however, requires fast progress of research in the field in order to find adequate techniques to analyse and manage such data, including feature extraction, high-dimensional indexing, similarity based search, and personalised search and retrieval. The major challenge is to unify all these existing methods from various fields into a multimedia mining framework.
This report has introduced current indexing procedures and feature representations of multimedia data. Further, general machine learning techniques were outlined, followed by a detailed survey of three subareas: latent semantic indexing, clustering, and relevance feedback. These three areas have proven particularly successful for multimedia mining. Latent semantic indexing addresses the issues related to the high-dimensionality of the feature space, as well as finding semantic relations between different feature modalities in multimedia data. Clustering is a popular means to discover hidden relationships between data objects and addresses retrieval in huge datasets. Finally, relevance feedback makes use of the user’s judgements of relevancy of data objects or class memberships. It is successful at overcoming the semantic gap and leads to a more personalised search experience.
9. Research Groups & Systems [UCSB] http://vision.ece.ucsb.edu/~jelena/research/index.html, last accessed 13 June 2006.
[Alexandria] http://www.alexandria.ucsb.edu/research/index.htm, last accessed 13 June 2006
[webseek] http://persia.ee.columbia.edu:8008/ last accessed 13 June 2006
[cuvid] http://apollo.ee.columbia.edu/cuvidsearch/login.php, last accessed 13 June 2006
[videoQ] http://persia.ee.columbia.edu:8080/, last accessed 13 June 2006

FP6-027026, K-Space
ID4.4.1: State of the Art Report on Multimedia Mining
53
[Columbia] http://www.ee.columbia.edu/dvmm/, last accessed 13 June 2006
[ADaM] http://datamining.itsc.uah.edu/adam/index.html, last accessed 13 June 2006
[PicHunter] http://www.intermemory.net/pny/papers/pichunter/main.html, last accessed 13 June 2006
[EGO] http://www.dcs.gla.ac.uk/~jana/, last accessed 13 June 2006
FP6-027026, K-Space
ID4.4.1: State of the Art Report on Multimedia Mining
54
10. References [Agrawal et al, 1993] R. Agrawal, T. Imielinski, Swami A.: Mining associations between sets of items in massive databases. In: Proc. of the ACM-SIGMOD 1993 Int. Conference on Management of Data, Washington D.C., May 1993, 207-216.
[Armitage et al, 1996] L. H. Armitage and P. G. Enser. Analysis of user need in image archives. Journal of Information Science , 23(4):287–299, 1996.
[Baillie et al, 2003] M. Baillie and J.M. Jose, Audio-based Event Detection for Sports Video. In CIVR2003, pp.300-310, July 2003
[Berka et al, 1997] Berka,P. - Rauch,J.: GUHA and KEX for Knowledge Acquisition from Economic Data. Acta Oeconomica Pragensia, Vol 5, No 1, 1997, s.11-38
[Berry et al, 1995] Berry W.M, Dumais S. T., O'Brien G. W., Using linear algebra for intelligent information retrieval, SIAM Review, 37 (1995), pp. 573-595.
[Berry et al, 1999] Berry W.M, Drmač Z., Jessup J.R. Matrices, Vector Spaces, and Information Retrieval. SIAM Review, 41 (1999), pp. 336-362.
[Berry et al, 2004] Berry W.M., Dumais S. (2004) Latent Semantic Indexing Web Site. http://www.cs.utk.edu/~lsi/
[Bobrowski et al, 1991] L. Bobrowski and J. Bezdek, “c-Means clustering with the Lp and L norms,” IEEE Trans. Syst., Man, Cybern., vol. 21, no. 3, pp. 545–554, May-Jun. 1991.
[Bordogna et al, 1996] Gloria Bordogna and Gabriella Pasi, “A user-adaptive neural network supporting a rule based relevance feedback”, Fuzzy Sets and Systems, Vol. 82, No. 9, Spt 1996, pp. 201 – 211.
[Breiman, 2001] L. Breiman: Random Forests. Machine Learning 45 (1):5-32, October 2001
[Bradshaw, 2000] B. Bradshaw. Semantic based image retrieval: A probabilistic approach. In Proc. of the ACM Int. Conf. on Multimedia (Multimedia-00), pages 167–176, New York, Oct. 30–Nov. 04 2000. ACM Press.
[Cadez et al 2000] I.Cadex, S.Gaffney, P.Smyth, “A general probabilistic framework for clustering individuals”, Technical Report UCI-ICS 00-09, 2000.
[Campbell et al, 1996] I. Campbell and C. J. van Rijsbergen. The ostensive model of developing information needs. In Proc. of the Int. Conf. on Conceptions of Library and Information Science, pages 251–268, 1996.
[Carpenter et al, 1988] G. Carpenter and S. Grossberg, “The ART of adaptive pattern recognition by a self-organizing neural network,” IEEE Computer, vol. 21, no. 3, pp. 77–88, Mar. 1988.
[Chang et al, 2003] E. Chang, K. Goh, G. Sychay, and G. Wu. CBSA: Content-based soft annotation for multimodal image retrieval using bayes point machines. IEEE Trans. Circuits Syst. Video Technol. (Special Issue on Conceptual and Dynamical Aspects of Multimedia Content Description), 13(1):26–38, Jan. 2003.
[Chang et al, 1980] N. S. Chang, K. S. Fu. Query by pictorial example. IEEE Trans. on Software Engineering, pp. 519 – 524, 1980.
[Cheeseman et al 1996] P.Cheeseman, J. Stutz, “Bayesian Classification (AutoClass): Theory and Results”, In Fayyad, U.M., Piatetsky-Shapiro, Advances in Knowledge Discovery and Data Mining, AAAI Press/MIT Press, 1996.
[Chen et al, 2001] Y. Chen, X. S. Zhou, T. S. Huang, “One-class SVM for Learning in Image Retrieval”, ICIP'2001, Thessaloniki, Greece, October 7-10, 2001.
[Chen et al, 2000] J.-Y. Chen, C. A. Bouman, and J. C. Dalton. Hierarchical browsing and search of large image databases. IEEE Trans. Image Processing, 9, 2000.
[Chen et al, 1999] T. Chen, L.-H. Chen, K.K. Ma. Colour image indexing using SOM for region of interest. Pattern Analysis and Applications, pp. 157 – 165, 1999
[Cherng et al, 2001] J. Cherng and M. Lo, “A hypergraph based clustering algorithm for spatial data sets,” in Proc. IEEE Int. Conf. Data Mining (ICDM’01), 2001, pp. 83–90.
[Chiang et al, 2003] J. Chiang and P. Hao, “A new kernel-based fuzzy clustering approach: Support vector clustering with cell growing,” IEEE Trans. Fuzzy Syst., vol. 11, no. 4, pp. 518–527, Aug. 2003.

FP6-027026, K-Space
ID4.4.1: State of the Art Report on Multimedia Mining
55
[Cohen, 1996] W. Cohen: Learning rules to classify e-mail. AAAI Spring Symposium on Machine Learning in Information Access, Stanford, 1996
[Cox et al, 2000] I. J. Cox, M. L. Miller, T. P. Minka, T. V. Papathomas, and P. N. Yianilos. The bayesian image retrieval retrieval system, PicHunter: Theory, implementation and psychophysical experiments. In IEEE Trans. Image Processing, 9(1):20–37, Jan. 2000.
[Csillagphy, 1997] A. Csillaghy. Neural Network generated indexing features and retrieval effectiveness. In Proceedings of the Convergence computing Methodologies in Astronomy (CCMA) Conference, Sonthofen, Bavaria, Sep 1997.
[Daugman, 2003] Daugman, J.G.: The importance of being random: statistical principles of iris recognition. Pattern Recognition, 36(2):279-291 (2003)
[Del Bimbo, 1999] A. Del Bimbo. Visual Information Retrieval. Morgan Kaufmann Publishers, 1999.
[Divakaran et. Al 2004] Divakaran, A.; Miyaraha, K.; Peker, K.A.; Radhakrishnan, R.; Xion, Z., "Video Mining Using Combinations of Unsupervised and Supervised Learning Techniques", SPIE Conference on Storage and Retrieval for Multimedia Databases, Vol. 5307, pp. 235-243, January 2004
[Dempster et al 1977] A.Dempster, N.Laird, D.Rubin, “Maximum likelihood from incomplete data via the EM algorithm“, Journal of the Royal Statistical Society, Series B, Vol. 39, No. 1, pp. 1 – 38, 1977.
[Dobeš et al, 2004] Dobeš M. and Machala L.: The database of Iris Images. Palacký University, Olomouc, Czech Republic, http://phoenix.inf.upol.cz/iris , 2004.
[Duin et al, 1999] Jain, R. Duin, and J. Mao, “Statistical pattern recognition: A review,” IEEE Trans. Pattern Anal. Mach. Intell., vol. 22, no. 1, pp. 4–37, 2000.
[Dvořák et al, 2004] Dvořák P., Střižík M., Praks P., Pudil P., Šumpíková M., Lešetický O.: The feasibility of using special quantitative methods for prediction of currency crises. International Scientific Conference European Finance – Theory, Politics And Practice. Matej Bel University, Banska Bystrica, Slovakia, September 8–9, 2004. ISBN 80-8055-968-6 (CD-ROM), pp. 1-26, http://www.financ.umb.sk/cd/Prispevky/C%20Prispevky%20do%20zbornika/Prez_%20prispevok%20Strizik.pdf
[Eakins et al, 1999] J. P. Eakins and M. Graham. Content-based image retrieval. JISC Technology Applications Report 39, Oct. 1999
[Eakins, 2001] J. P. Eakins. Tradmark image retrieval. In Lew [2001 ], pages 319–350.
[Enser, 2000] P. G. Enser. Visual information retrieval: seeking the alliance of concept-based and content-based paradigms. Journal of Information Science , 26(4):199–210, 2000.
[Ester et al 1996] M. Ester, H-P.Kriegel, J.Sander, X.Xu, “A density based algorithm for discovering clusters in large spatial databases with noise”, In proceeding of the 2nd ACM SIGKDD, 226-231, Portland, Oregon, 1996.
[Everitt et al, 2000] B. Everitt, S. Landau, and M. Leese, Cluster Analysis. London: Arnold, 2001.
[Fayyad et al, 1996] U. Fayyad, G. Piatetsky-Shapiro, P. Smyth, R. Uthurusamy, (eds.): Advances in Knowledge Discovery and Data Mining. AAAI Press/MIT Press, 1996.
[Flickner et al, 1995] M. Flickner, H. Sawhney, W. Niblack, J. Ashley, Q. Huang, B. Dom, M. Gorkani, J. Hafner, D. Lee, D. Petkovic, D. Steele, and P. Yanker. Query by image and video content: The QBIC system. Computer, 28(9):23–32, Sept. 1995.
[Flom et al, 1987] Flom, L. and Safir, A.: Iris Recognition System. U.S. Patent No. 4,641,349. U.S. Government: Washington (1987)
[Forgy et al 1965] E.Forgy, “Cluster analysis of multivariate data: Efficiency versus interpretability of classification”, Biometrics, Vol. 21, pp. 768 – 780, 1965.
[Forsyth et al, 2003] D. A. Forsyth and J. Ponce. Computer Vision: A Modern Approach. Prentice-Hall, New Jersey, 2003.
[Frawley et al, 1992] W. Frawley and G. Piatetsky-Shapiro and C. Matheus, Knowledge Discovery in Databases: An Overview. AI Magazine, Fall 1992, pgs 213-228.

FP6-027026, K-Space
ID4.4.1: State of the Art Report on Multimedia Mining
56
[Garber et al, 1992] S. R. Garber and M. B. Grunes. The art of search: A study of art directors. In Proc. of the ACM Int. Conf. on Human Factors in Computing Systems (CHI’92), pages 157–163, 1992.
[Gevers, 2001] T. Gevers. Color-based retrieval. In Lew [2001 ], pages 11–49.
[Giacinto et al, 2004] G. Giacinto and F. Roli, “Bayesian relevance feedback for content based image retrieval”, Pattern Recognition, Vol. 37, No. 7, July 2004, pp. 1499 – 1508.
[Grobelnik et al, 1998] Grobelnik,M. - Mladenic,D.: Efficient text categorization. In (Kodratoff, ed.) Proc. ECML’98 Workshop on Text Mining, TU Chemnitz, CSR-98-05, 1998.
[Grossman et al, 2000] Grossman D. A., Frieder O.: Information retrieval: Algorithms and heuristics. Kluwer Academic Publishers, Second edition (2000) pp. 1-254
[Guha et al, 1998] S. Guha, R. Rastogi, and K. Shim, “CURE: An efficient clustering algorithm for large databases,” in Proc. ACM SIGMOD Int. Conf. Management of Data, 1998, pp. 73–84.
[Gunn et al, 1997] S. R. Gunn, “Support vector machines for classification and regression, technical report”, Image Speech and Intelligent Systems Research Group, University of Southampton, 1997.
[Han et al, 1996] K.A. Han, S. H. Myaeng. Image Organization and retrieval with automatically constructed feature vectors. In SIGIR Forum (19th Annual International ACM SIGIR Conference on Research and Development in Information Retrieval, pp. 157 – 165, 1996.
[Han et al 2001] J. Han, M. Kamber, ”Data Mining”, Morgan Kaufmann Publishers, 2001.
[Han et al 2001] J. Han, M.Kamber, A.K.H.Tung, ”Spatial clustering methods in data mining: A survey”, In Geographic Data Mining and Knowledge Discovery, Taylor and Francis, 2001
[Hand et al, 2002] Hand D., Manilla H., Smyth P.,: Principles of Data Mining. MIT Press, 2002.
[Hartingan et al 1975], J. Hartigan, “Clustering Algorithm”, John Wiley & Sons, New York, NY, 1975.
[Hathaway et al, 2000] R. Hathaway, J. Bezdek, and Y. Hu, “Generalized fuzzy c-means clustering strategies using L norm distances,” IEEE Trans. Fuzzy Syst., vol. 8, no. 5, pp. 576–582, Oct. 2000.
[Hinneburg et al 98] A. Hinneburg, D. Keim, ”An efficient approach to clustering large multimedia databases with noise”, In proceddings of the 4th ACM SIGKDD, pp. 58 – 65, New York, NY, 1998.
[Hsu et al, 2005] C.-T. Hsu, C.-Y. Li, “Relevance feedback using generalized Bayesian framework with region-based optimization learning”, IEEE Trans. on Image Processing, Vol. 14, No. 10, Oct. 2005, pp. 1617 – 1631
[Idris et al, 1997] F. Idris, and S. Panchanathan. Review of Image and Video Indexing Techniques. Journal of Visual Communication and Image Representation, 8(2):146-166, 1997
[Ishikawa et al, 1998] Y. Ishikawa, R. Subramanya, and C. Faloutsos. MindReader: Querying databases through multiple examples. In A. Gupta, O. Shmueli, and J. Widom, editors, Proc. of the 24th Int. Conf. on VLDB, pages 218–227, New York, NY,USA, Aug. 1998. Morgan Kaufmann Publishers.
[Jain et al, 1998] A. K. Jain and A. Vailaya. Shape-based retrieval: A case study with trademark image databases. Pattern Recognition, 31(9):1369–1390, Sept. 1998.
[Jeon et al, 2003] J. Jeon, V. Lavrenko, and R. Manmatha. Automatic image annotation and retrieval using cross-media relevance models. In Proc. of the Annual Int. ACM SIGIR Conf. on Research and Development in Information Retrieval (SIGIR03), pages 119–126, New York, 2003. ACM Press.
[Jing et al, 2004a] F. Jing, M. Li, Hong-Jiang Zhang, and B. Zhang “Relevance Feedback in Region-Based Image Retrieval”, IEEE Transactions on Circuits and Systems for Video Technology, Vol. 14, No. 5, May 2004.
[Jing et al, 2004b] F. Jing, M. Li, Hong-Jiang Zhang, B. Zhang ,“An Efficient and Effective Region-Based Image Retrieval Framework”, IEEE Transactions on Image Processing , vol.13, no.5, May 2004.
[Kang et al, 2003] H. Kang and B. Shneiderman. Mediafinder: An interface for dynamic personal media management with semantic regions. In Proc. of the ACM Int. Conf. on Human Factors in Computing Systems CHI’2003, pages 764–765, 2003.
[Karypis et al, 1999] G. Karypis, E. Han, and V. Kumar, “Chameleon: Hierarchical clustering using dynamic modeling,” IEEE Computer, vol. 32, no. 8, pp. 68–75, Aug. 1999.

FP6-027026, K-Space
ID4.4.1: State of the Art Report on Multimedia Mining
57
[Kauffman et al 1990] L. Kauffman, P. Rousseeuw, ”Finding Groups in Data: An introduction to cluster analysis”, John Wiley and Sons, New York, NY, 1990.
[Kohonen, 1990] T. Kohonen, “The self-organizing map,” Proc. IEEE, vol. 78, no. 9, pp. 1464–1480, Sep. 1990.
[Kohonen, 1998] Kohonen,T.: Self-organization of very large document collections: state of the art. In: (Niklasson, Boden, Ziemke, eds.) Proc. 8th Int. Conf. on Artificial Neural Networks ICANN98, Springer, 1998, 65-74.
[Koskela et al, 2001] M. Koskela, J. Laaksonen, E. Oja, “Comparison of Techniques for Content-Based Image Retrieval”, Proceedings of SCIUA 2001, Bergen, Norway, June 2001.
[Koskela et al, 2004] M. Koskela, J. Laaksonen, and E. Oja, “Use of image Subsets in Image Retrieval with Self-Organizing Maps”, Proceedings for International Conference on Image and Video Retrieval CIVR 2004, pp. 508-516, Dublin, 2004.
[Kotsiantis et al, 2004] Kotsiantis S., Kanellopoulos D., Pintelas P.: Multimedia mining. WSEAS Transactions on Systems, Issue 10, Volume 3, December 2004, pp. 3263-3268
[Laaksonen et al, 1999] J. Laaksonen, M. Koskela, and E. Oja. “PicSOM: Self-Organizing Maps for Content-Based Image Retrieval”, Proc. IJCNN'99. Washington, DC. July 1999.
[Laaksonen et al, 2002] Laaksonen J, Koskela M, Oja E, “PicSOM – self organizing image retrieval with MPEG – 7 content descriptors“, IEEE Trans. On Neural Networks, Vol. 13, No. 4, July 2002, pp. 841 – 853.
[Labský et al, 2005a] Labský M., Praks, P., Svátek V., Šváb O.: Multimedia information extraction from HTML product catalogues. DATESO 2005. Ed. K. Richta, V. Snášel, J. Pokorný; pg. 84-93, ISBN 80-01-03204-3, ISSN 1613-0073. Also at http://ceur-ws.org/Vol-129/paper10.pdf
[Labský et al 2005b] Labský M., Vacura M., Praks P.: Web Image Classification for Information Extraction. First International Workshop on Representation and Analysis of Web Space (RAWS-05), Prague, Sep. 15-16, 2005; pg. 55-62; ISBN 80-248-0864-1; Also at http://ceur-ws.org/Vol-164/raws2005-paper7.pdf
[Labský et al, 2005c] Labský M., Svátek V., Šváb O., Praks P., Krátký M. and Snášel V.: Information Extraction from HTML Product Catalogues: from Source Code and Images to RDF. The 2005 IEEE/WIC/ACM International Conference on Web Intelli-gence; Campiegne Univ. of Technology, France, Sep. 19-22 2005; pp. 401-404, ISBN 0-7695-2415-X. Published by IEEE Computer Society Washington, DC, USA; Also at http://rainbow.vse.cz/wi05fi.pdf
[Lenardi et al, 2004] R. Lenardi, P. Migliorati and M. Prandini. Semantic Indexing of Soccer Audio-Visual Sequence: A multimodal approach based on controlled Markov chains. In IEEE Trans on Circuits&System for Video Technology, pp.634-643, Vol.14, No.5, 2004.
[Lew, 2001] M. S. Lew, editor. Principles of Visual Information Retrieval. Advances in Pattern Recognition. Springer-Verlag, 2001.
[Loncaric, 1998] S. Loncaric. A survey of shape analysis techniques. Pattern Recognition, 31(8):983–1001, 1998.
[Lu, 1999] G. Lu. Design issues of multimedia information indexing and retrieval systems. Journal of Network and Computer Applications (Academic Press) , 22(3):175–198, July 1999.
[Ma et al., 1999] W.-Y. Ma and B. S. Manjunath. Netra: A toolbox for navigating large image databases. ACM Multimedia Systems Journal , 7(3):184–198, 1999.
[Manjunath et al, 1996] B. S. Manjunath and W.-Y. Ma. Texture features for browsing and retrieval of image data. IEEE Trans. Pattern Analysis and Machine Intelligence, 18(8):837–842, Aug. 1996.
[Manjunath et al, 2000] B. S. Manjunath, P. Wu, S. Newsam, and H. D. Shin. A texture descriptor for browsing and similarity retrieval. Signal Processing: Image Communication (Elsevier) , 16(1–2):33–43, Sept. 2000.
[Manjunath et al, 2001] B. S. Manjunath, J.-R. Ohm, V. V. Vasudevan, and A. Yamada. Color and texture descriptors. IEEE Trans. Circuits Syst. Video Technol. , 11(6):703–715, June 2001.
[Markkula et al, 2000] M. Markkula and E. Sormunen. End-user searching challenges indexing practices in the digital newspaper photo archive. Information Retrieval, 1(4):259–285, 2000.
FP6-027026, K-Space
ID4.4.1: State of the Art Report on Multimedia Mining
58
[McLachlan et al 1988] G.Mclachlan, K. Basford, "Mixture Models: Inference and Applications to Clustering”, Marcel Dekker, New York, NY, 1988
[McLachlan et al 1997] G.McLachlan and T.Krishnan, “The EM Algorithm and Extensions”. John Wiley & Sons, New York, NY, 1997.
[Muller et al, 2004] Muller N., Magaia L., Herbst B. M., Singular Value Decomposition, Eigenfaces, and 3D Reconstructions. SIAM Review Vol. 46, No. 3, (2004), pp. 518–545.
[Michalski, 1980] Michalski R.: Pattern recognition as rule-guided inductive inference. IEEE Trans. PAMI-2, 4 (1980), 349-361
[Mitchell, 1997] Mitchell T.: Machine Learning. McGraw-Hill. 1997.
[Ng et al 1994] R. Ng, J. Han, ”Efficient and effective clustering methods for spatial data mining”, In proceedings of the 20th Conference on VLDB, pp. 144 – 155, Santiago, Chile, 1994.
[Oliva et al, 2001] A. Oliva and A. Torralba. Modeling the shape of the scene: A holistic representation of the spatial envelope. Int. Journal of Computer Vision (Kluwer Academic Publishers), 2001.
[Pentland et al, 1994] A. Pentland, R. W. Picard, and S. Sclaroff. Photobook: Tools for content-based manipulation of image databases. In Proc. Storage and Retrieval for Image and Video Databases II , volume 2185 of SPIE Storage and Retrieval for Image and Video Databases II , pages 34–47, San Jose, CA, USA, Feb. 1994. SPIE.
[Picard et al, 1994] R. W. Picard and F. Liu. A new Wold ordering for image similarity. In Proc. of the IEEE Conf. Acoustics Speech and Signal Processing , pages 129–132, Adelaide, Australia, Apr. 1994.
[Porkaew et al, 1999] K. Porkaew, K. Chakrabarti, and S. Mehrotra. Query refinement for multimedia similarity retrieval in MARS. In Proc. of the ACM Int. Conf. on Multimedia, pages 235–238, Orlando, Florida, 1999.
[Praks et al, 2003a] Praks P., Dvorský J., Snášel V.: Latent Semantic Indexing for Image Retrieval Systems. SIAM Conference on Applied Linear Algebra, July 15-19, 2003, The College of William and Mary, Williamsburg, U.S.A. Published by SIAM, http://www.siam.org/meetings/la03/proceedings/Dvorsky.pdf
[Praks et al, 2003b] Praks P., Dvorský J., Snášel V., Černohorský J.: On SVD-free Latent Semantic Indexing for Image Retrieval for application in a hard industrial environment. IEEE International Conference on Industrial Technology – ICIT 2003; Maribor, Slovenia, December 10-12, 2003. Published by IEEE, pg. 466-471, ISBN 0-7803-7853-9, http://ieeexplore.ieee.org/
[Praks et al, 2004] Praks P., Machala L., Snášel V.: Iris Recognition Using the SVD-Free Latent Semantic Indexing. In L. Khan and V.A. Petrushin (Eds.). Proceedings of the Fifth ACM International Workshop on Multimedia Data Min-ing (MDM/KDD'04), pg. 67-71. August 22, 2004, Seattle, WA – USA. Also at http://www.cs.uiuc.edu/homes/hanj/cs591/kdd04/docs/mdmkdd.pdf
[Praks et al, 2006a] Praks P., Černohorský J., Briš R.: Human Expert Modelling Using Numerical Linear Algebra: a Heavy Industry Case Study. In: Kiyoki, Y. et al. (eds). EJC 2006, Proceedings of the 16th European-Japanese conference on information modelling and knowledge bases, May 29 – June 2, 2006, Trojanovice, Czech Republic.
[Praks et al, 2006b] Praks P., Machala L., Snášel V.: On SVD-free Latent Semantic Indexing for iris recognition of large databases. Chapter 26 in book: V. A. Petrushin and L. Khan (Eds.): Multimedia Data Mining and Knowledge Discovery. Springer. Accepted, to appear
[Praus, 2005] Praus P.: SVD-based principal component analysis of geochemical data. Central European Journal of Chemistry, 3 (2005) 731-741
[Puzicha et al, 1999] J. Puzicha, Y. Rubner, C. Tomasi, and J. M. Buhmann. Empirical evaluation of dissimilarity measures for color and texture. In IEEE Proc. of Int. Conf. on Computer Vision (ICCV’99) , pages 1165–1173, 1999.
[Quinlain, 1994] Quinlan J,R.: C4.5: Programs for machine learning. Morgan Kaufmann Publ. 1994.
[Rocchio, 1971] J. J. Rocchio. Relevance feedback in information retrieval. In G. Salton, editor, The SMART retrieval system: experiments in automatic document processing, pages 313–323. Prentice-Hall, Englewood Cliffs, US, 1971.
[Ravela et al, 1997] S. Ravela and R. Manmatha. Image retrieval by appearance. In Proc. of the Annual Int. ACM SIGIR Conf. on Research and Development in Information Retrieval, pages 278–285, 1997.

FP6-027026, K-Space
ID4.4.1: State of the Art Report on Multimedia Mining
59
[Ravela et al, 2000] S. Ravela and C. Luo. Appearance-based global similarity of images. In B. W. Croft, editor, Advances in Information Retrieval - Recent Research from the Center for Intelligent Information . Kluwer Academic Publishers, Apr. 2000.
[Rehatschek et al, 2004] H. Rehatschek, P. Schallauer, W. Bailer, W. Haas, A. Wertner: "An innovative system for formulating complex, combined content-based and keyword based queries". Proceedings of the SPIE conference on Internet Imaging S. Santini and R. Schettini (eds.), Vol. #5304, pp. 160 - 169, January 2004.
[Ren et al, 2006] R. Ren and J. Jose. Attention Guided Football Video Content Recommendation on Mobile Devices. In MobiMedia 2006, Alghero, Sardinia, Italy
[Ren et al, 2005] R. Ren and J. Jose. Football Video Segmentation Based on Video Production Strategy. In ECIR 2005, Sandiago, Spain
[Rodden et al, 2001] K. Rodden, W. Basalaj, D. Sinclair, and K. Wood. Does organisation by similarity assist image browsing? In Proc. of the ACM Int. Conf. on Human Factors in Computing Systems, Sensable Navigation Search, pages 190–197, 2001.
[Rubner et al, 1998] Y. Rubner, C. Tomasi, and L. J. Guibas, “A metric for distributions with applications to image databases”, IEEE International Conference on Computer Vision, pages 59-66, January 1998.
[Rui et al, 2000] Y. Rui and T. S. Huang. Optimizing learning in image retrieval. In IEEE Proc. of Conf. on Computer Vision and Pattern Recognition (CVPR-00), pages 236–245, Los Alamitos, June 2000. IEEE Computer Society Press.
[Rui et al, 1998] Y. Rui, T. S. Huang, M. Ortega, and S. Mehrotra. Relevance feedback: A power tool for interactive contentbased image retrieval. IEEE Trans. Circuits Syst. Video Technol., 8(5):644–655, Sept. 1998. Special Issue on Segmentation, Description, and Retrieval of Video Content.
[Salton et al, 1983] G. Salton and M. J. McGill. Introduction to Modern Information Retrieval. McGraw-Hill, Tokio, 1983.
[Santini et al, 2000] S. Santini and R. Jain. Integrated browsing and querying for image databases. IEEE Trans. Multimedia, 7(3):26–39, July–Sept. 2000.
[Sebe et al, 2001] N. Sebe and M. S. Lew. Texture features for content-based retrieval. In Lew [2001 ], pages 51–85.
[Sethi et al, 1999] Sethi I.K, Coman I. Image Retrieval using hierarchical self organizing feature map. Pattern Recognition Letter 1999, pp. 1337 – 1345.
[Smeulders et al, 2000] A. W. Smeulders, M. Worring, S. Santini, A. Gupta, and R. Jain. Content-based image retrieval at the end of the early years. IEEE Trans. Pattern Analysis and Machine Intelligence, 22(12):1349–1380, Dec. 2000.
[Smith et al, 1996] J. R. Smith and S.-F. Chang. Local color and texture extraction and spatial query. In IEEE Proc. of Int. Conf. on Image Processing (ICIP-96), volume 3, pages 1011–1014, Lausanne, Switzerland, Sept. 1996.
[Stricker et al, 1995] M. Stricker and M. Orengo. Similarity of color images. In Proc. of the SPIE: Storage and Retrieval for Image and Video Databases , volume 2420, pages 381–392, Feb. 1995.
[Su et al, 2003] Z. Su, H.-J. Zhang, Li. S, S. Ma, “Relevance Feedback in content based image retrieval: Bayesian framework, feature subspaces and progressive learning“, IEEE Trans. on Image Processing, Vol. 12, No. 8, Aug 2003, pp. 924 – 937
[Su et al, 2002] Z. Su and H.-J. Zhang. Relevance feedback in CBIR. In X. Zhou and P. Pu, editors, Sixth Working Conference on Visual Database Systems (VDB’02), May 29-31, 2002, Bisbane, Australia, volume 216 of IFIP Conference Proceedings, pages 21–35. Kluwer Academic Publishers, 2002.
[Svátek et al, 2005] Svátek V., Labský M., Praks, P., Šváb O.: Information extraction from HTML product catalogues: coupling quantitative and knowledge-based approaches. In Dagstuhl Seminar on Machine Learning for the Semantic Web. Ed. N. Kushmerick, F. Ciravegna, A. Doan, C. Knoblock and S. Staab, Wadern,Germany, Feb. 13–18 2005, pg. 1-5. Also available at http://www.smi.ucd.ie/Dagstuhl-MLSW/proceedings/labsky-svatek-praks-svab.pdf

FP6-027026, K-Space
ID4.4.1: State of the Art Report on Multimedia Mining
60
[Swain et al, 1991] M. J. Swain and D. H. Ballard. Color indexing. Int. Journal of Computer Vision (Kluwer Academic Publishers) , 7(1):11–32, 1991.
[Tamura et al, 1984] H. Tamura and N. Yokoya. Image database systems: A survey. Pattern Recognition, 17(1):29–43, 1984.
[Tesic 2004] Jelena Tešic, “Managing Large-scale Multimedia Repositories" Ph.D. Thesis, University of California, Santa Barbara, Sep. 2004.
[Tian et al, 2000] Q. Tian, P. Hong, T. S. Huang, “Update relevant image weights for content-based image retrieval using support vector machines”, IEEE International Conference on Multimedia and Expo, Hilton New York & Towers, New York, NY, July 30 - Aug. 2, 2000.
[Tong et al, 2001] S. Tong and E. Chang. Support vector machine active learning for image retrieval. In Proc. of the ACM Int. Conf. on Multimedia, pages 107–118. ACM Press, 2001.
[Tseng et al, 2001] L. Tseng and S. Yang, “A genetic approach to the automatic clustering problem,” Pattern Recognit., vol. 34, pp. 415–424, 2001.
[Urban et al, 2005] J. Urban and J. M. Jose. EGO: A personalised multimedia management and retrieval tool. International Journal of Intelligent Systems (IJIS), Special Issue on ’Intelligent Multimedia Retrieval’, 2005. to appear.
[Vasconcelos et al, 2000] N. Vasconcelos and A. Lippman. Bayesian relevance feedback for content-based image retrieval. In IEEE Proc. of Workshop on Content-based Access of Image and Video Libraries, pages 63–67, 2000.
[Wallace et al 1994] C. Wallace, D.Dowe, “Intrinsic classification by MML – The SNOB program”, In the proceedings of the 7th Australian Joint Conference on Artificial Intelligence, UNE, World Scientific Publishing Co, Armidale, Australia, pp. 37 – 44, 1004.
[Wang et al, 2004] W. Wang, B. Lu, M. Zhu, “The intelligent control based on synergetic pattern recognition”, Fifth world congress on Intelligent control and automation WCICA 2004, Vol. 3, June 2004, pp. 2449 – 2453.
[Wang et. al 2004] Ruoyu Roy Wang, Thomas S. Huang: A framework of joint object tracking and event detection. Pattern Anal. Appl. 7(4): 343-355 (2004)
[Witten et al, 1999] Witten I.H., Frank E.: Data Mining. Practical Machine Learning Tools and Techniques with Java Implementations. Morgan Kaufman, 1999.
[Wood et al, 1998] M. E. J. Wood, B. T. Thomas, and N. W. Campbell. Iterative refinement by relevance feedback in content-based digital image retrieval. In ACM Multimedia 98, pages 13–20, Bristol, UK, Sept. 1998. ACM Press.[Wu et al, 2003] K. Wu and K.-H. Yap, "Fuzzy relevance feedback in content-based image retrieval," Proc. Int. Conf. Information, and Signal Processing and Pacific-Rim Conf. Multimedia, Singapore, 2003.
[Xie, 2002] L. Xie et al., Structure analysis of soccer video with Hidden Markov Models. In ICASSP 2002.
[Xie et al. 2003] L. Xie, S.-F. Chang, A. Divakaran and H. Sun, Unsupervised Mining of Statistical Temporal Structures in Video, Book Chapter in Video Mining, A. Rosenfeld, D. Doremann and D. Dementhon Eds, Kluwer Academic Publishers, June 2003
[Xu et al, 2001] P. Xu et al. Algorithms and Systems for Segmentation and Structure Analysis in Soccer Video. In IEEE International Conference on Multimedia and Expo,
Tokyo, Japan, 2001.
[Xu et al, 2005] R. Xu, D. Wunsch II, “Survey of Clustering Algorithms”, IEEE Trans. Neural Netw, vol. 16 no.3, pp. 645 – 678, May 2005.
[Zhang et al, 1995] H. Zhang, D. Zhong. A scheme for visual feature based image indexing. Storage and Retrieval for Image and Video Databases III (SPIE), pp. 2420, San Jose, CA, Feb. 1995.
[Zhang et al, 1996] T. Zhang, R. Ramakrishnan, and M. Livny, “BIRCH: An efficient data clustering method for very large databases,” in Proc. ACM SIGMOD Conf. Management of Data, 1996, pp. 103–114.
[Zhao et al, 2003] T. Zhao, L. H. Tang, Horace H.S.Ip, F. Qi, “On relevance feedback and similarity measure for image retrieval with synergetic neural nets”, Neurocomputing, Vol. 51, April 2003, pp. 105 – 124

FP6-027026, K-Space
ID4.4.1: State of the Art Report on Multimedia Mining
61
[Zhou et al, 2003] X. S. Zhou and T. Huang. Relevance feedback in image retrieval: A comprehensive review. ACM Multimedia Systems Journal, Special Issue on CBIR, 8(6):536–544, 2003.
[Zhou et al, 2002] X. S. Zhou and T. S. Huang. Unifying keywords and visual contents in image retrieval. IEEE Multimedia, 9(2):23–33, 2002.