Embed Size (px)
Citation preview

ICUT
Annual Statistical Report
2007
Independent Colleges and Universities of Texas, Inc. Stretching Minds. Stretching Money.


I C U T S t a t i s t i c a l R e p o r t : 2 0 0 7
ICUT
Annual Statistical Report
2007
Carol McDonald President
ICUT Independent Colleges and Universities of Texas, Inc. 400 West 15th Street, Suite 850 P.O. Box 13105, Austin, Texas 78711-3105

I C U T S t a t i s t i c a l R e p o r t : 2 0 0 7
TABLE OF CONTENTS
Preface i Acknowledgments iii ICUT v ICUT Institutions vii Introduction 1 Section 1: OVERVIEW OF ICUT INSTITUTIONS
Enrollment 4
Student Credit Hours 4
Enrollment by Ethnicity 5
Enrollment by Geographic Distribution 6
Degrees Awarded 6
Sources of Student Financial Aid 7
Average Tuition and Fees 7
Full-time Faculty 8
Expenditures 9
Sources of Revenue 10 Section 2: FIVE-YEAR TRENDS
Total Enrollment 12
Minority Enrollment 13
Tuition and Fees 14
Institutional Financial Aid 15
Student-to-faculty Ratio 16

I C U T S t a t i s t i c a l R e p o r t : 2 0 0 7
Section 3: INSTITUTION-LEVEL DATA Part I: Student Data
Summary of Student Data 21
Enrollment 22
First-time, First-year, Degree-seeking 23
Semester Credit Hours 24
Geographic Distribution 25
Ethnicity 26
Degrees Awarded 28
Persistence of Undergraduates 29 Part II: Student Financial Aid Data
Summary of Student Financial Aid Data 33
Student Costs 34
Sources of Student 35
Tuition Equalization Grant Statistics 36
TEXAS Grant Statistics 37
Texas College Work Study Statistics 38 Part III: Faculty Data
Summary of Faculty Data 41
Full-time Faculty 42
Tenured Faculty 43 Part IV: Financial Data
Summary of Financial Data 47
Expenditures by Function 48
Sources of Revenue 50
Land, Buildings and Equipment 51
Endowment 52

I C U T S t a t i s t i c a l R e p o r t : 2 0 0 7

I C U T S t a t i s t i c a l R e p o r t : 2 0 0 7
Preface
The 2007 ICUT Annual Statistical Report presents data by institution
for all 40 ICUT institutions. Data collected on students, faculty, student finan-
cial aid, and institutional finances are presented in four parts and include sum-
mary pages comparing the totals with the previous year. Every effort has been
made to ensure comparability with the previous year’s data.
The 2007 Annual Statistical Report was produced by Elizabeth Puthoff
and was edited by Carol McDonald and Nancy Ward.
i

I C U T S t a t i s t i c a l R e p o r t : 2 0 0 7

I C U T S t a t i s t i c a l R e p o r t : 2 0 0 7
Acknowledgments The ICUT staff wishes to thank member institutions for collecting the data
presented in this report. Special thanks go to the Institutional Research Officers,
Financial Aid Officers and Chief Financial Officers for the time and energy they ex-
pended to provide us the information that is presented here. We could not have
produced this report without their help.
Since the analyses in any report are only as good as the data upon which
they are based, we sincerely appreciate the careful and conscientious efforts of all
who provide information.
The ICUT Staff
iii

I C U T S t a t i s t i c a l R e p o r t : 2 0 0 7

I C U T S t a t i s t i c a l R e p o r t : 2 0 0 7
ICUT Independent Colleges and Universities of Texas
Stretching Minds. Stretching Money.
Our purpose… ICUT works with the Legislature, state agencies and other appropriate organizations to promote access
for all Texans to the state’s private colleges and universities. Our primary activity is to support and enhance the Tuition Equalization Grant… The TEG offers two compelling advantages:
The TEG stretches the state’s higher education dollar. Helping students find
places at private colleges or universities costs less than educating them at
state universities. The TEG helps Texas students from all legislative districts attend the colleges
of their choice.
Other important ICUT activities include… Helping legislators find information they need about higher education.
Monitoring the legislative process on behalf of Texas’ private institutions and
assisting them with appropriate responses and initiatives. Finding ways to control costs at ICUT institutions by negotiating as a group for
goods and services.
An established institution… Founded in 1965, ICUT is a public policy organization in Austin which helps legislators, state administra-
tors, high school counselors and students understand the TEG and other public policy issues that pro-
vide access to Texas’ private colleges and universities. How the TEG stretches taxpayers’ dollars The average TEG award in fiscal year 2006 was $2,905. In contrast, about $6,888 was appropriated for
every full-time student enrolled at a state university—almost a 2.5-to-one savings. It would cost taxpay-
ers more than $207 million to enroll TEG recipients in state universities, and this would strain the capac-
ity of those institutions. How the TEG helps Texans Texas students seeking TEG assistance must demonstrate financial need through the Free Application
for Federal Student Aid (FAFSA). To qualify, students must be Texas residents, enroll full-time, maintain
a 2.5 GPA by the end of their second year, pay higher tuition than charged at a public institution, and not
be athletic scholarship recipients.
v

I C U T S t a t i s t i c a l R e p o r t : 2 0 0 7

I C U T S t a t i s t i c a l R e p o r t : 2 0 0 7
ICUT INSTITUTIONS
vii

I C U T S t a t i s t i c a l R e p o r t : 2 0 0 7
Abilene Christian University Amberton University Austin College Baylor University College of St. Thomas More Concordia University at Austin Dallas Baptist University East Texas Baptist University Hardin-Simmons University Houston Baptist University Howard Payne University Huston-Tillotson University Jacksonville College Jarvis Christian College LeTourneau University Lon Morris College Lubbock Christian University McMurry University Our Lady of the Lake University Paul Quinn College Rice University St. Edward's University St. Mary's University Schreiner University Southern Methodist University Southwestern Adventist University Southwestern Assemblies of God University Southwestern Christian College Southwestern University Texas Christian University Texas College Texas Lutheran University Texas Wesleyan University Trinity University University of Dallas University of the Incarnate Word University of Mary Hardin-Baylor University of St. Thomas Wayland Baptist University Wiley College

I C U T S t a t i s t i c a l R e p o r t : 2 0 0 7
Introduction

I C U T S t a t i s t i c a l R e p o r t : 2 0 0 7
2
The 2007 Statistical Report contains both raw data and trend analysis.
Data sources are cited in each table and include the National Center for Educa-
tional Statistics Integrated Postsecondary Education Data System (IPEDS), the
Texas Higher Education Coordinating Board (THECB), The College Board and
ICUT data collection forms.
Sections 1 and 2 give an overview of ICUT institutions as a whole. The
first chapter summarizes current-year data and the second gives a five-year trend
for key variables.
Section 3 contains institution-level data in table form. There are four sec-
tions within this chapter: Part I contains student data, including: headcount; first-
time, first-year, degree seeking students; semester credit hours; geographic distri-
bution; ethnicity; degrees awarded; and persistence of undergraduates.
Part II presents data on student costs and a broad summary of sources of
student aid. Grant statistics are given for the Tuition Equalization Grant program,
a state program for students attending independent colleges and universities in
Texas. Also included are award totals for the state-supported TEXAS Grant and
College Work Study programs available to students at both public and independ-
ent colleges and universities in Texas. The TEXAS Grant program is currently be-
ing phased out at ICUT institutions.
Part III provides data on faculty at ICUT institutions, including the number
of full-time faculty by rank and the number of tenured faculty by rank.
Part IV presents institutional financial data, including: data on expenditures
by function; sources of revenue; value of land, buildings, and equipment; and en-
dowment.
I C U T S t a t i s t i c a l R e p o r t : 2 0 0 7
Section 1:
Overview of
ICUT Institutions

I C U T S t a t i s t i c a l R e p o r t : 2 0 0 7
Overview of ICUT Institutions
4
Source: IPEDS Fall Enrollment, 2006
Source: ICUT
Enrollment by Classification, Fall 2006
Classification Number Percentage
Full-time 85,295 74.5
Part-time 29,193 25.5
Total 114,488 100.0 Full-time74.5%
Part-time25.5%
Credit Hours by Degree Classification, Fall 2006
Classification Number Percentage
Undergraduate 2,406,554 83.0
Master 323,567 11.2
Doctoral 62,607 2.2
Professional 105,205 3.6
Total 2,897,933 100.0 Undergraduate
83.0%
Doctoral 2.2%Professional
3.6%
Master 11.2%

I C U T S t a t i s t i c a l R e p o r t : 2 0 0 7
Overview of ICUT Institutions
5
Source: IPEDS Fall Enrollment, 2006
Enrollment by Ethnicity, Fall 2006
Ethnicity Number Percentage
African American 13,260 11.6
Hispanic 18,347 16.0
American Indian 695 0.6
Asian/Pacific 4,792 4.2
White 67,762 59.2
Non-U.S. Resident 4,699 4.1
Unknown 4,933 4.3
Total 114,488 100.0
Unknown 4.3%
Non-US Resident 4.1%
African American 11.6%
Hispanic 16.0%
American Indian 0.6%
Asian/Pacific 4.2%
White 59.2%

I C U T S t a t i s t i c a l R e p o r t : 2 0 0 7
Overview of ICUT Institutions
6
Source: ICUT *This total may include study abroad students and audi-tors and may, therefore, differ from IPEDS numbers.
Source: IPEDS Completions, 2005-2006
Unknown 1.6%
Other States 13.2%
Foreign 4.2%
In State 81.0%
Enrollment by Geographic Distribution, Fall 2006
Residency Number Percentage
In-State 92,290 81.0
Other States 15,087 13.2
Foreign 4,823 4.2
Unknown 1,808 1.6
Total 114,007 100.0
Degrees Awarded, 2005-2006
Classification Number Percentage
Associate 460 1.8
Bachelor 17,267 67.2
Master 6,535 25.4
Doctoral 393 1.5
Professional 1,051 4.1
Total 25,706 100.0 Bachelor67.2%
Professional4.1%
Doctoral1.5%
Master25.4%
Associate1.8%

I C U T S t a t i s t i c a l R e p o r t : 2 0 0 7
Overview of ICUT Institutions
7
Source: ICUT
Federal51.3%
State10.7%
Institutional34.1%
Other3.9%
Sources of Student Financial Aid, 2005-2006
Type Amount Percentage
Federal $605,690,119 51.3
State 126,854,931 10.7
Institutional 403,854,931 34.1
Other 45,739,279 3.9
Total $1,181,781,806 100.0
College Board, 2006-2007 Average Tuition and Fees, Private Institutions
$19,321
ICUT Institutions, 2006-2007 Average Tuition and Fees $15,528
ICUT 2006-2007 Tuition and Fees Range
$5,846 - $28,630
Source: ICUT and the College board

I C U T S t a t i s t i c a l R e p o r t : 2 0 0 7
Overview of ICUT Institutions
8
Source: ICUT
Full- Time Faculty by Classification, 2006-2007
Classification Number Percentage
Professor 1,850 32.0
Associate Professor 1,519 26.3
Assistant Professor 1,488 25.7
Instructor 362 6.3
Lecturer 494 8.5
Other 71 1.2
Total 5,784 100
Assistant Professor25.7%
Associate Professor26.3%
Professor32.0%
Other1.2%
Instructor6.3%
Lecturer8.5%

I C U T S t a t i s t i c a l R e p o r t : 2 0 0 7
Overview of ICUT Institutions
9
Source: IPEDS Finance, 2006 (1) Net aid to students refers to student grants that are reported as expenditures. It does not include student aid in the form of work study or reduced tuition.
Expenditures, 2005-2006
Type Amount Percentage
Instruction $933,614,114 39.2
Research 83,160,021 3.5
Public Service 25,493,716 1.1
Academic Support 249,156,116 10.5
Student Services 258,394,427 10.8
Institutional Support 396,423,591 16.6
Auxiliary Enterprises 360,125,756 15.1
Net Aid to Students 28,944,982 1.2
Other 53,048,748 2.2
Total $2,383,634,018 100.0
Other, 2.2%
Academic Support, 10.5%
Student Services, 10.8%
Institutional Support, 16.6%
Auxiliary Enterprises,
15.1%
Net Aid to Students, 1.2%
Instruction, 39.2%
Research, 3.5%
Public Service, 1.1%

I C U T S t a t i s t i c a l R e p o r t : 2 0 0 7
Overview of ICUT Institutions
10
Source: IPEDS Finance, 2006
Sources of Revenue, 2005-2006
Type Amount Percentage
Tuition and Fees $1,244,154,879 35.3
Government Appropriation 0 0.0
Government Grants 197,045,652 5.6
Private Gifts 462,658,839 13.1
Other 1,620,639,203 46.0
Total $3,524,498,573 100.0
Tuition and Fees
35.3%
Private Gifts13.1%
Government Grants5.6%
Government Appropriation
0.0%
Other46.0%

I C U T S t a t i s t i c a l R e p o r t : 2 0 0 7
Section 2:
Five-year Trends
at ICUT Institutions

I C U T S t a t i s t i c a l R e p o r t : 2 0 0 7
Five-year Trend: Enrollment
12
Source: IPEDS Enrollment, 2006
Overall Enrollment
Year Number of Students Percent Change
2002 114,010
2003 113,099 -0.8
2004 112,311 -0.7
2005 114,125 +1.6
2006 114,488 +0.3
Total Enrollment
114,488
114,125
112,311
113,099
114,010
111,000
111,500
112,000
112,500
113,000
113,500
114,000
114,500
115,000
2002 2003 2004 2005 2006
Num
ber o
f Stu
dent
s

I C U T S t a t i s t i c a l R e p o r t : 2 0 0 7
Five-year Trend: Enrollment
13
Source: IPEDS Enrollment, 2006
Minority Enrollment
Year Total Enrollment
Minority Enrollment Percent Percent
Change
2002 114,010 34,574 30.3
2003 113,099 35,166 31.1 +2.5
2004 112,311 35,509 31.6 +1.7
2005 114,125 36,517 32.0 +1.2
2006 114,488 37,094 32.4 +1.3
Minority Enrollment
114,010 113,099 112,311 114,125 114,488
34,574 35,166 35,509 37,09436,517
0
20,000
40,000
60,000
80,000
100,000
120,000
2002 2003 2004 2005 2006
Enro
llmen
t

I C U T S t a t i s t i c a l R e p o r t : 2 0 0 7
Five-year Trend: Tuition and Fees
14
Source: ICUT and The College Board
Average Tuition and Fees
Year ICUT Institutions
Percent Change
National Average
Percent Change
2002 11,711 15,659
2003 12,646 +8.0 16,293 +4.0
2004 13,522 +6.9 17,270 +6.0
2005 14,360 +6.2 18,310 +6.0
2006 15,528 +8.1 19,231 +5.0
Tuition and Fees: ICUT Institutions vs. National Average
$15,659 $16,293$17,270
$18,310$19,231
$15,528$14,360
$13,522$12,646$11,711
$0
$5,000
$10,000
$15,000
$20,000
$25,000
2002 2003 2004 2005 2006
Dol
lars ICUT
Average
NationalAverage

I C U T S t a t i s t i c a l R e p o r t : 2 0 0 7
Five-year Trend: Institutional Aid
15
Source: ICUT
2002 2003 2004 2005 2006
Institutional Financial Aid Awarded
Year Amount Percent Change
2002 339,476,420
2003 332,023,665 -2.2
2004 319,290,501 -3.8
2005 368,482,725 +15.0
2006 403,497,477 +9.5
Institutional Financial Aid
$403,497,477
$319,290,501
$368,482,725
$332,023,665$339,476,420
$0
$50,000,000
$100,000,000
$150,000,000
$200,000,000
$250,000,000
$300,000,000
$350,000,000
$400,000,000
$450,000,000
Dol
lars

I C U T S t a t i s t i c a l R e p o r t : 2 0 0 7
Five-year Trend: Student-to-faculty Ratio
16
Source: ICUT and IPEDS Enrollment *Includes only full-time faculty
Student-to-faculty* Ratio
Year Total Enrollment
Total Faculty Ratio Percent
Change
2002 114,010 5,264 21.7 :1
2003 113,099 5,348 21.1 :1 -2.8
2004 112,311 5,393 20.8 :1 -1.4
2005 114,125 5,614 20.3 :1 -2.4
2006 114,488 5,724 20.0 :1 -1.5
Student-to-faculty Ratio
21.7
21.1
20.8
20.3
19.8
18.5
19
19.5
20
20.5
21
21.5
22
2002 2003 2004 2005 2006
Num
ber o
f Stu
dent
s pe
r Fac
ulty
Mem
ber

I C U T S t a t i s t i c a l R e p o r t : 2 0 0 7
Section 3:
Institution-level Data

I C U T S t a t i s t i c a l R e p o r t : 2 0 0 7

I C U T S t a t i s t i c a l R e p o r t : 2 0 0 7
Part I:
Student Data

I C U T S t a t i s t i c a l R e p o r t : 2 0 0 7

I C U T S t a t i s t i c a l R e p o r t : 2 0 0 7
Summary of Student Data The total headcount enrollment at ICUT institutions increased from
114,125 in fall 2005 to 114,488 in fall 2005, an increase of 0.3%. The num-
ber of first-time, first-year, degree-seeking students decreased by 1.7% from
fall 2005 to 2006.
As a percentage of the total enrollment at all ICUT institutions in fall
2006, 59.2% of the students were white; 11.6% were African American;
16.0% were Hispanic; 4.2% were Asian/Pacific; 0.6% were American Indian;
4.1% were non-US residents; and 4.3% did not report.
ICUT institutions continue to serve primarily Texas residents, with
81.0% coming from Texas; 13.2% were from other states; and the remainder
were from foreign countries or their residency status was not reported.
ICUT institutions remain focused on providing undergraduate educa-
tion. A total of 83.0% of semester credit hours taken were in undergraduate
courses, and 67.2% of the degrees awarded were bachelor’s degrees.
The THECB provided data to demonstrate the persistence of first-
time undergraduates from 2005 to the fall of 2006. A total of 73.16% re-
mained at the same ICUT institution and a total of 85.46% remained in col-
lege in Texas.
21

I C U T S t a t i s t i c a l R e p o r t : 2 0 0 7
Institution-level Data
Enrollment Fall 2006
22
ICUT INSTITUTION FULL-TIME PART-TIME TOTAL
Abilene Christian U 4,243 534 4,777 Amberton U 679 903 1,582 Austin C 1,344 10 1,354 Baylor U 13,424 616 14,040 C of St. Thomas More 24 58 82 Concordia U at Austin 881 386 1,267 Dallas Baptist U 2,643 2,510 5,153 East Texas Baptist U 1,204 161 1,365 Hardin-Simmons U 1,947 420 2,367 Houston Baptist U 1,717 426 2,143 Howard Payne U 1,078 250 1,328 Huston-Tillotson U 650 92 742 Jacksonville C 234 76 310 Jarvis Christian C 602 73 675 LeTourneau U 2,071 1,912 3,983 Lon Morris C 337 59 396 Lubbock Christian U 1,404 596 2,000 McMurry U 1,148 231 1,379 Our Lady of the Lake U 1,462 1,321 2,783 Paul Quinn C 714 70 784 Rice U 4,907 117 5,024 St. Edward's U 3,394 1,830 5,224 St. Mary's U 3,169 735 3,904 Schreiner U 872 58 930 Southern Methodist U 8,019 2,922 10,941 SW Adventist U 711 156 867 SW Assemblies of God U 1,264 394 1,658 SW Christian C 195 7 202 Southwestern U 1,255 22 1,277 Texas Christian U 7,467 1,398 8,865 Texas C 705 50 755 Texas Lutheran U 1,334 95 1,429 Texas Wesleyan U 1,653 1,277 2,930 Trinity U 2,557 141 2,698 U of Dallas 1,509 1,432 2,941 U of the Incarnate Word 2,766 2,622 5,388 U of Mary Hardin-Baylor 2,313 422 2,735 U of St. Thomas 1,644 1,880 3,524 Wayland Baptist U 964 2,860 3,824 Wiley C 791 71 862
TOTAL 85,295 29,193 114,488
Source: IPEDS Fall Enrollment, 2006

I C U T S t a t i s t i c a l R e p o r t : 2 0 0 7
First-time, First-year, Degree-Seeking Fall 2006
23
Part I: Student Data
ICUT INSTITUTION FULL-TIME PART-TIME TOTAL
Abilene Christian U 962 2 964 Amberton U 0 0 0 Austin C 340 0 340 Baylor U 2,782 1 2,783 C of St Thomas More 4 0 4 Concordia U at Austin 191 12 203 Dallas Baptist U 360 0 360 East Texas Baptist U 341 1 342 Hardin-Simmons U 400 0 400 Houston Baptist U 223 6 229 Howard Payne U 311 12 323 Huston-Tillotson U 181 5 186 Jacksonville C 88 3 91 Jarvis Christian C 113 0 113 LeTourneau U 310 24 334 Lon Morris C 180 1 181 Lubbock Christian U 315 2 317 McMurry U 305 2 307 Our Lady of the Lake U 262 2 264 Paul Quinn C 157 3 160 Rice U 712 1 713 St. Edward's U 699 15 714 St. Mary's U 548 3 551 Schreiner U 272 1 273 Southern Methodist U 1,369 2 1,371 SW Adventist U 153 3 156 SW Assemblies of God U 191 4 195 SW Christian C 82 0 82 Southwestern U 345 0 345 Texas Christian U 1,649 3 1,652 Texas C 164 2 166 Texas Lutheran U 387 0 387 Texas Wesleyan U 180 1 181 Trinity U 687 0 687 U of Dallas 315 0 315 U of the Incarnate Word 614 7 621 U of Mary Hardin-Baylor 482 0 482 U of St. Thomas 291 11 302 Wayland Baptist U 211 4 215 Wiley C 135 2 137
TOTAL 17,311 135 17,446
Source: IPEDS Fall Enrollment, 2006

I C U T S t a t i s t i c a l R e p o r t : 2 0 0 7
Institution-level Data Semester Credit Hours
2006-2007
24
INSTITUTION UNDERGRADUATE MASTER DOCTORAL PROFESSIONAL TOTAL
Abilene Christian U 118,662 8,270 228 1,698 128,858 Amberton U 10,233 17,076 0 0 27,309 Austin C 47,429 868 0 0 48,297 Baylor U 354,802 18,657 10,171 20,455 404,085 C of St. Thomas More 542 0 0 0 542 Concordia U at Austin 29,436 1,575 0 0 31,011 Dallas Baptist U 84,885 22,354 1,008 0 108,247 East Texas Baptist U 36,512 0 0 0 36,512 Hardin-Simmons U 54,923 9,539 3,049 1,554 69,065 Houston Baptist U 51,899 5,801 0 0 57,700 Howard Payne U 33,854 0 0 0 33,854 Huston-Tillotson U 18,249 0 0 362 18,611 Jacksonville C 7,641 0 0 0 7,641 Jarvis Christian C 18,006 0 0 0 18,006 LeTourneau U 78,016 5,115 0 0 83,131 Lon Morris C 11,997 0 0 0 11,997 Lubbock Christian U 50,096 4,321 0 0 54,417 McMurry U 39,316 0 0 0 39,316 Our Lady of the Lake U 42,033 16,280 1,779 0 60,092 Paul Quinn C 21,529 0 0 225 21,754 Rice U 87,339 21,140 36,707 0 145,186 St. Edward's U 102,022 16,381 0 0 118,403 St. Mary's U 69,485 10,194 1,112 23,575 104,366 Schreiner U 20,933 1,266 0 0 22,199 Southern Methodist U 191,400 48,514 4,038 29,978 273,930 SW Adventist U 23,804 763 0 0 24,567 SW Assemblies of God U 37,529 3,038 0 0 40,567 SW Christian C* Southwestern U 39,233 0 0 0 39,233 Texas Christian U 207,751 20,427 1,872 5,328 235,378 Texas C 24,302 0 0 0 24,302 Texas Lutheran U 19,817 0 0 54 19,871 Texas Wesleyan U 34,661 9,611 0 19,776 64,048 Trinity U 72,614 4,759 0 0 77,373 U of Dallas 33,988 26,913 1,045 0 61,946 U of the Incarnate Word 113,956 12,550 1,466 127,972 U of Mary Hardin-Baylor 66,480 2,440 0 0 68,920 U of St. Thomas 47,177 24,715 132 2,200 74,224 Wayland Baptist U 80,710 11,000 0 0 91,710 Wiley C 23,293 0 0 0 23,293
TOTAL 2,406,554 323,567 62,607 105,205 2,897,933 PERCENTAGE 83.0% 11.2% 2.2% 3.6% 100% *Data not received Source: ICUT

I C U T S t a t i s t i c a l R e p o r t : 2 0 0 7
Geographic Distribution, Fall 2006
25
Part I: Student Data
OTHER NOT ICUT INSTITUTION TEXAS STATES FOREIGN REPORTED TOTAL
Abilene Christian U 3,450 841 213 273 4,777 Amberton U 1,312 197 73 0 1,582 Austin C 1,231 98 25 0 1,354 Baylor U 11,316 2,241 389 94 14,040 C of St. Thomas More 35 6 2 1 44 Concordia U at Austin 1,186 75 2 0 1,263 Dallas Baptist U 4,501 248 404 0 5,153 East Texas Baptist U 1,211 140 14 0 1,365 Hardin-Simmons U 2,266 95 11 0 2,372 Houston Baptist U 1,320 25 135 663 2,143 Howard Payne U 1,304 44 2 0 1,350 Huston-Tillotson U 688 40 14 0 742 Jacksonville C 286 10 14 0 310 Jarvis Christian C 557 111 0 0 668 LeTourneau U 3,229 720 34 0 3,983 Lon Morris C 357 0 0 0 357 Lubbock Christian U 1,794 189 17 0 2,000 McMurry U 1,305 62 14 0 1,381 Our Lady of the Lake U 2,734 25 24 0 2,783 Paul Quinn C 594 129 60 0 783 Rice U 2,435 1,649 811 129 5,024 St. Edward's U 4,898 208 115 3 5,224 St. Mary's U 3,538 237 118 11 3,904 Schreiner U 900 23 7 0 930 Southern Methodist U 7,552 2,519 870 0 10,941 SW Adventist University 370 180 136 234 920 SW Assemblies of God U 996 642 20 0 1,658 SW Christian C* Southwestern U 1,169 85 8 15 1,277 Texas Christian U 6,490 1,622 406 347 8,865 Texas C 680 71 4 0 755 Texas Lutheran U 1,374 44 11 0 1,429 Texas Wesleyan U 2,696 194 40 0 2,930 Trinity U 1,647 702 96 22 2,467 U of Dallas 2,054 629 258 0 2,941 U of the Incarnate Word 4,839 330 219 0 5,388 U of Mary Hardin-Baylor 2,643 56 14 0 2,713 U of St. Thomas 3,271 46 191 16 3,524 Wayland Baptist U 3,628 153 24 0 3,805 Wiley C 434 401 27 0 862
TOTAL (1) 92,290 15,087 4,822 1,808 114,007 PERCENTAGE 81.0% 13.2% 4.2% 1.6% 100.0% *Data not received (1) These totals may include study abroad students and auditors, and may therefore differ from the IPED's numbers reported for Enrollment and Ethnicity on pages 22 and 26 respectively. Source: ICUT

I C U T S t a t i s t i c a l R e p o r t : 2 0 0 7
Institution-level Data: Ethnicity Fall 2006
26
A
FRIC
AN
A
MER
ICA
N
ASIA
N/
N
ON
-US
NO
T
ICU
T IN
STIT
UTI
ON
AM
ERIC
AN
H
ISPA
NIC
IN
DIA
N
PAC
IFIC
W
HIT
E R
ESID
ENT
REP
OR
TED
TO
TAL
A
bile
ne C
hris
tian
U
326
286
28
53
3,77
3 21
3 98
4,
777
Am
berto
n U
49
0 95
16
32
82
2 0
127
1,58
2 A
ustin
C
36
129
15
172
977
25
0 1,
354
Bay
lor U
99
0 1,
256
88
857
10,1
83
389
277
14,0
40
C o
f St.
Thom
as M
ore
1 3
0 0
78
0 0
82
Con
cord
ia U
at A
ustin
12
3 21
7 1
15
802
2 10
7 1,
267
Dal
las
Bap
tist U
1,
063
454
42
88
3,10
2 40
4 0
5,15
3 E
ast T
exas
Bap
tist U
21
1 59
13
9
1,05
6 14
3
1,36
5 H
ardi
n-Si
mm
ons
U
119
209
18
21
1,73
4 11
25
5 2,
367
Hou
ston
Bap
tist U
39
4 32
1 9
298
946
135
40
2,14
3 H
owar
d P
ayne
U
95
186
12
9 97
1 2
53
1,32
8 H
usto
n-Ti
llots
on U
57
4 72
0
8 58
13
17
74
2 Ja
ckso
nville
C
43
35
1 2
215
14
0 31
0 Ja
rvis
Chr
istia
n C
63
8 28
0
0 8
1 0
675
LeTo
urne
au U
90
8 32
2 25
48
2,
551
34
95
3,98
3 Lo
n M
orris
C
80
49
2 1
231
26
7 39
6 Lu
bboc
k C
hris
tian
U
104
267
10
16
1,57
4 17
12
2,
000
McM
urry
U
178
210
10
11
920
14
36
1,37
9 O
ur L
ady
of th
e La
ke U
20
4 1,
682
9 37
50
1 24
32
6 2,
783
Pau
l Qui
nn C
69
9 17
0
1 3
64
0 78
4 R
ice
U
260
484
19
687
2,44
3 81
2 31
9 5,
024
St.
Edw
ard'
s U
27
4 1,
431
38
148
2,94
4 11
5 27
4 5,
224
St.
Mar
y's
U
139
2,06
9 12
10
8 1,
219
118
239
3,90
4 S
chre
iner
U
28
187
6 15
68
7 7
0 93
0 S
outh
ern
Met
hodi
st U
65
1 87
0 68
73
6 7,
746
870
0 10
,941
SW
Adv
entis
t U
114
210
9 79
33
6 88
31
86
7 SW
Ass
embl
ies
of G
od U
95
23
0 30
17
1,
250
22
14
1,65
8 SW
Chr
istia
n C
18
6 2
0 0
5 9
0 20
2 S
outh
wes
tern
U
36
160
9 58
99
8 2
14
1,27
7 Te
xas
Chr
istia
n U
46
4 58
5 52
20
7 6,
679
406
472
8,86
5 Te
xas
C
678
54
0 1
15
0 7
755
Texa
s Lu
ther
an U
13
0 25
1 6
19
980
11
32
1,42
9 Te
xas
Wes
leya
n U
38
4 41
6 22
89
1,
654
0 36
5 2,
930
Trin
ity U
85
29
7 26
17
9 1,
663
104
344
2,69
8 U
of D
alla
s 23
1 34
0 9
226
1,66
1 25
8 21
6 2,
941
U o
f the
Inca
rnat
e W
ord
385
2,91
4 31
12
8 1,
382
219
329
5,38
8 U
of M
ary
Har
din-
Bayl
or
290
336
16
50
2,02
9 14
0
2,73
5 U
of S
t. Th
omas
39
9 84
4 20
31
9 1,
439
191
312
3,52
4 W
ayla
nd B
aptis
t U
399
728
21
45
2,09
5 24
51
2 3,
824
Wile
y C
75
6 42
2
3 32
27
0
862
TO
TAL
P
ERC
ENTA
GE
13,2
60
18,3
47
695
4,79
2 67
,762
4,
699
4,93
3 11
4,48
8
11.6
%
16.0
%
0.6%
4.
2%
59.2
%
4.1%
4.
3%
95.7
%

I C U T S t a t i s t i c a l R e p o r t : 2 0 0 7
27
Part I: Student Data
AFR
ICAN
AM
ERIC
AN
AS
IAN
/
NO
N-U
S N
OT
ICU
T IN
STIT
UTI
ON
AM
ERIC
AN
HIS
PAN
IC
IND
IAN
PA
CIF
IC
WH
ITE
RES
IDEN
T R
EPO
RTE
D
Abile
ne C
hris
tian
U
6.8%
6.
0%
0.6%
1.
1%
79.0
%
4.5%
2.
1%
Am
berto
n U
31
.0%
6.
0%
1.0%
2.
0%
52.0
%
0.0%
8.
0%
Aus
tin C
2.
7%
9.5%
1.
1%
12.7
%
72.2
%
1.8%
0.
0%
Bay
lor U
7.
1%
8.9%
0.
6%
6.1%
72
.5%
2.
8%
2.0%
C
of S
t. Th
omas
Mor
e 1.
2%
3.7%
0.
0%
0.0%
95
.1%
0.
0%
0.0%
C
onco
rdia
U a
t Aus
tin
9.7%
17
.1%
0.
1%
1.2%
63
.3%
0.
2%
8.4%
D
alla
s B
aptis
t U
20.6
%
8.8%
0.
8%
1.7%
60
.2%
7.
8%
0.0%
E
ast T
exas
Bap
tist U
15
.5%
4.
3%
1.0%
0.
7%
77.4
%
1.0%
0.
2%
Har
din-
Sim
mon
s U
5.
0%
8.8%
0.
8%
0.9%
73
.3%
0.
5%
10.8
%
Hou
ston
Bap
tist U
18
.4%
15
.0%
0.
4%
13.9
%
44.1
%
6.3%
1.
9%
How
ard
Pay
ne U
7.
2%
14.0
%
0.9%
0.
7%
73.1
%
0.2%
4.
0%
Hus
ton-
Tillo
tson
U
77.4
%
9.7%
0.
0%
1.1%
7.
8%
1.8%
2.
3%
Jack
sonv
ille C
13
.9%
11
.3%
0.
3%
0.6%
69
.4%
4.
5%
0.0%
Ja
rvis
Chr
istia
n C
94
.5%
4.
1%
0.0%
0.
0%
1.2%
0.
1%
0.0%
Le
Tour
neau
U
22.8
%
8.1%
0.
6%
1.2%
64
.0%
0.
9%
2.4%
Lo
n M
orris
C
20.2
%
12.4
%
0.5%
0.
3%
58.3
%
6.6%
1.
8%
Lubb
ock
Chr
istia
n U
5.
2%
13.4
%
0.5%
0.
8%
78.7
%
0.9%
0.
6%
McM
urry
U
12.9
%
15.2
%
0.7%
0.
8%
66.7
%
1.0%
2.
6%
Our
Lad
y of
the
Lake
U
7.3%
60
.4%
0.
3%
1.3%
18
.0%
0.
9%
11.7
%
Pau
l Qui
nn C
89
.2%
2.
2%
0.0%
0.
1%
0.4%
8.
2%
0.0%
R
ice
U
5.2%
9.
6%
0.4%
13
.7%
48
.6%
16
.2%
6.
3%
St.
Edw
ard'
s U
5.
2%
27.4
%
0.7%
2.
8%
56.4
%
2.2%
5.
2%
St.
Mar
y's
U
3.6%
53
.0%
0.
3%
2.8%
31
.2%
3.
0%
6.1%
S
chre
iner
U
3.0%
20
.1%
0.
6%
1.6%
73
.9%
0.
8%
0.0%
S
outh
ern
Met
hodi
st U
6.
0%
8.0%
0.
6%
6.7%
70
.8%
8.
0%
0.0%
SW
Adv
entis
t U
13.1
%
24.2
%
1.0%
9.
1%
38.8
%
10.1
%
3.6%
SW
Ass
embl
ies
of G
od U
5.
7%
13.9
%
1.8%
1.
0%
75.4
%
1.3%
0.
8%
SW C
hris
tian
C
92.1
%
1.0%
0.
0%
0.0%
2.
5%
4.5%
0.
0%
Sou
thw
este
rn U
2.
8%
12.5
%
0.7%
4.
5%
78.2
%
0.2%
1.
1%
Texa
s C
hris
tian
U
5.2%
6.
6%
0.6%
2.
3%
75.3
%
4.6%
5.
3%
Texa
s C
89
.8%
7.
2%
0.0%
0.
1%
2.0%
0.
0%
0.9%
Te
xas
Luth
eran
U
9.1%
17
.6%
0.
4%
1.3%
68
.6%
0.
8%
2.2%
Te
xas
Wes
leya
n U
13
.1%
14
.2%
0.
8%
3.0%
56
.5%
0.
0%
12.5
%
Trin
ity U
3.
2%
11.0
%
1.0%
6.
6%
61.6
%
3.9%
12
.8%
U
of D
alla
s 7.
9%
11.6
%
0.3%
7.
7%
56.5
%
8.8%
7.
3%
U o
f the
Inca
rnat
e W
ord
7.1%
54
.1%
0.
6%
2.4%
25
.6%
4.
1%
6.1%
U
of M
ary
Har
din-
Bay
lor
10.6
%
12.3
%
0.6%
1.
8%
74.2
%
0.5%
0.
0%
U o
f St.
Thom
as
11.3
%
24.0
%
0.6%
9.
1%
40.8
%
5.4%
8.
9%
Way
land
Bap
tist U
10
.4%
19
.0%
0.
5%
1.2%
54
.8%
0.
6%
13.4
%
Wile
y C
87
.7%
4.
9%
0.2%
0.
3%
3.7%
3.
1%
0.0%
S
ourc
e: IP
ED
S F
all E
nrol
lmen
t 200
6

I C U T S t a t i s t i c a l R e p o r t : 2 0 0 7
Institution-level Data
Degrees Awarded 2005-2006
28
ICUT INSTITUTION ASSOC BACH MAST DOCT PROF TOTAL
Abilene Christian U 2 790 155 4 25 976 Amberton U* 0 122 330 0 0 452 Austin C 0 316 25 0 0 341 Baylor U 0 2,209 544 108 226 3,087 C of St. Thomas More 0 3 0 0 0 3 Concordia U at Austin 22 157 32 0 0 211 Dallas Baptist U 0 771 418 0 0 1,189 East Texas Baptist U 0 221 0 0 0 221 Hardin-Simmons U 0 333 97 26 13 469 Houston Baptist U 6 289 127 0 0 422 Howard Payne U 5 238 0 0 0 243 Huston-Tillotson U 0 80 0 0 0 80 Jacksonville C 44 0 0 0 0 44 Jarvis Christian C 0 88 0 0 0 88 LeTourneau U 0 528 165 0 0 693 Lon Morris C 75 0 0 0 0 75 Lubbock Christian U 0 363 64 0 2 429 McMurry U 0 223 0 0 0 223 Our Lady of the Lake U 0 377 330 10 0 717 Paul Quinn C 0 149 0 0 0 149 Rice U 0 811 486 147 0 1,444 St. Edward's U 0 734 293 0 0 1,027 St. Mary's U 0 508 199 8 242 957 Schreiner U 0 112 16 0 0 128 Southern Methodist U 0 1,583 1,122 52 316 3,073 SW Adventist U 28 123 14 0 0 165 SW Assemblies of God U 49 229 50 0 0 328 SW Christian C 49 9 0 0 0 58 Southwestern U 0 298 0 0 0 298 Texas Christian U 0 1,506 439 15 40 2,000 Texas C 0 74 0 0 0 74 Texas Lutheran U 0 254 0 0 0 254 Texas Wesleyan U 0 305 160 0 177 642 Trinity U 0 595 116 0 0 711 U of Dallas 0 224 537 8 0 769 U of the Incarnate Word 5 695 231 15 0 946 U of Mary Hardin-Baylor 0 478 37 0 0 515 U of St. Thomas 0 339 366 0 10 715 Wayland Baptist U 175 998 182 0 0 1,355 Wiley C 0 135 0 0 0 135
TOTAL 460 17,267 6,535 393 1,051 25,706 PERCENTAGE 1.8% 67.2% 25.4% 1.5% 4.1% 100.0% *Numbers reported directly from institution Note: An additional 1,766 Bachelor's degrees and 157 Master's degrees were awarded in 2nd major fields. Source: IPEDS Completions, 2005-2006

I C U T S t a t i s t i c a l R e p o r t : 2 0 0 7
Persistence of 2005 First-time Entering Undergraduates to Fall 2006 at
ICUT Institutions (19,004 students)
Part I: Student Data
29
ENROLLMENT NUMBER PERCENT
CUMULATIVE NUMBER OF
STUDENTS CUMULATIVE
PERCENT
Same ICUT Institution 13,904 73.16 13,904 73.16 Other ICUT Institution 237 1.25 14,141 74.41 Public 2 or 4 Year Institution 2,099 11.05 16,240 85.46 Not Found in Texas Institution 2,764 14.54 19,004 100.00

I C U T S t a t i s t i c a l R e p o r t : 2 0 0 7
Institution-level Data
Persistence of 2005 First-time Entering Undergraduate TEG Recipients to Fall 2006 at
ICUT Institutions (6,257 students)
ENROLLMENT NUMBER PERCENT
CUMULATIVE NUMBER OF
STUDENTS CUMULATIVE
PERCENT
Same ICUT Institution 4,329 69.19 4,329 69.19 Other ICUT Institution 93 1.49 4,422 70.67 Public 2 or 4 Year Institution 937 14.98 5,359 85.65 Not Found in Texas Institution 898 14.35 6,257 100.00
30

I C U T S t a t i s t i c a l R e p o r t : 2 0 0 7
Part II:
Student Financial
Aid Data

I C U T S t a t i s t i c a l R e p o r t : 2 0 0 7

I C U T S t a t i s t i c a l R e p o r t : 2 0 0 7
Summary of Student Financial Aid Data The average cost of attending an ICUT institution, shown in the Stu-
dent Costs table, grew 7.2% between 2005-06 and 2006-07.
Student financial aid from all sources increased 1.2% in 2005-06 over
2004-05. There was a decrease of 6.9% in federal aid; a 8.6% increase in
state aid; a 9.5% increase in institutional aid; and an increase of 13.4% in
other aid. As a percentage of the total, aid provided by the federal govern-
ment decreased from 2004-2005 (55.7%) to 2005-2006 (51.3%).
The number of students who received Tuition Equalization Grants at
ICUT institutions increased from 24,790 in 2004-05 to 28,747 in 2005-06,
16.0%. The average grant amount increased from $2,739 to $2,931, 7.0%.
The number of TEXAS Grant recipients decreased by 24.5%. The
total grant amount decreased from $22,333,593 in 2004-05 to $17,813,509
in 2005-06, 20.2%. The average grant increased from $3,337 to $3,523,
5.6%. The decrease in funds is due to the phasing out of the TEXAS Grant
program at independent institutions.
The total grant amount for Texas College Work-Study awards de-
creased 17.4% from $1,312,537 in 2004-05 to $1,083,510 in 2005-06. The
number of recipients decreased 5.7%, from 1,161 in 2004-05 to 1,095 in
2005-06. The average grant decreased 12.5% from $1,131 in 2004-05 to
$990 in 2005-06.
33

I C U T S t a t i s t i c a l R e p o r t : 2 0 0 7
Student Costs 2006-2007 Academic Year
Institution-level Data
34
TUITION ROOM ICUT INSTITUTION & FEES & BOARD TOTAL
Abilene Christian U $16,330 $6,120 $22,450 Amberton U (1) 6,000 6,000 Austin C 23,540 7,741 31,281 Baylor U 22,869 7,125 29,994 C of St. Thomas More 12,000 5,600 17,600 Concordia U at Austin 17,800 4,500 22,300 Dallas Baptist U 13,650 4,959 18,609 East Texas Baptist U 13,720 4,190 17,910 Hardin-Simmons U 15,626 4,580 20,206 Houston Baptist U 16,500 4,500 21,000 Howard Payne U 14,470 4,722 19,192 Huston-Tillotson U 8,610 6,224 14,834 Jacksonville C 5,846 2,891 8,737 Jarvis Christian C 7,990 4,810 12,800 LeTourneau U 16,920 6,590 23,510 Lon Morris C 10,400 6,000 16,400 Lubbock Christian U 13,644 5,530 19,174 McMurry U 15,320 5,918 21,238 Our Lady of the Lake U 17,900 5,768 23,668 Paul Quinn C 7,650 4,700 12,350 Rice U 26,974 9,590 36,564 St. Edward's U 18,800 6,600 25,400 St. Mary's U 19,334 6,680 26,014 Schreiner U 15,880 7,580 23,460 Southern Methodist U 28,630 9,696 38,326 SW Adventist U 13,636 6,124 19,760 SW Assemblies of God U 10,388 4,868 15,256 SW Christian C 5,887 4,430 10,317 Southwestern U 23,650 7,815 31,465 Texas Christian U 22,980 7,520 30,500 Texas C 8,746 5,600 14,346 Texas Lutheran U 18,840 6,260 25,100 Texas Wesleyan U 14,875 2,750 17,625 Trinity U 24,131 8,198 32,329 U of Dallas 21,805 7,332 29,137 U of the Incarnate Word 17,400 6,475 23,875 U of Mary Hardin-Baylor 15,660 4,032 19,692 U of St. Thomas 17,868 6,700 24,568 Wayland Baptist U 11,000 3,986 14,986 Wiley C 7,848 4,826 12,674
TOTAL AVERAGE $15,528 $5,885 $21,266
(1) Amberton University is not included in the Total Average for Room and Board, as they do not have on-campus housing and students do not pay room and board.
Source: ICUT Data Collection 2006

I C U T S t a t i s t i c a l R e p o r t : 2 0 0 7
Sources of Student Aid 2005-2006
35
Part II: Student Financial Aid Data
ICUT INSTITUTION FEDERAL STATE INSTITUTIONAL OTHER TOTAL
Abilene Christian U $26,995,750 $7,323,747 $20,160,762 $0 $54,480,259 Amberton U (1) Austin C 9,868,667 2,475,235 10,661,081 463,953 23,468,936 Baylor U 71,576,890 18,254,904 50,748,872 3,748,230 144,328,896 C of St. Thomas More 66,100 38,604 31,960 0 136,664 Concordia U at Austin 6,577,953 1,222,759 3,874,110 0 11,674,822 Dallas Baptist U 24,903,612 2,755,456 10,252,005 5,298,727 43,209,800 East Texas Baptist U 7,241,489 2,721,140 4,726,955 1,118,406 15,807,990 Hardin-Simmons U 16,271,704 3,002,912 9,517,266 3,214,006 32,005,888 Houston Baptist U 14,861,479 2,644,481 5,393,511 1,275,654 24,175,125 Howard Payne U 7,358,630 2,012,656 4,005,988 544 13,377,818 Huston-Tillotson U 4,914,927 1,036,036 842,718 2,126 6,795,807 Jacksonville C 458,024 408,937 424,592 59,924 1,351,477 Jarvis Christian C 1,776,126 919,759 1,011,257 0 3,707,142 LeTourneau U 30,695,347 1,183,832 6,426,654 432,056 38,737,889 Lon Morris C 1,738,364 572,445 1,698,494 136,157 4,145,460 Lubbock Christian U 15,548,695 2,541,333 4,990,706 306,706 23,387,440 McMurry U 9,787,414 3,430,721 6,241,082 1,266,194 20,725,411 Our Lady of the Lake U 21,238,444 3,920,796 3,821,980 2,163,855 31,145,075 Paul Quinn C 4,295,174 861,962 536,476 374,355 6,067,967 Rice U 10,144,921 2,409,288 24,854,494 2,327,515 39,736,218 St. Edward's U 32,268,322 6,758,272 14,305,001 690,417 54,022,012 St. Mary's U 37,653,867 10,998,504 18,196,334 908,876 67,757,581 Schreiner U 6,482,828 1,222,857 3,695,236 218,417 11,619,338 Southern Methodist U 55,673,509 7,207,444 67,707,242 2,042,972 132,631,167 SW Adventist U 4,750,541 812,731 2,396,820 1,075,091 9,035,183 SW Assemblies of God U 10,479,603 1,328,001 2,564,891 521,483 14,893,978 SW Christian C* Southwestern U 10,698,404 1,611,836 9,402,631 972,827 22,685,698 Texas Christian U 8,059,195 10,287,319 41,327,090 9,806,598 69,480,202 Texas C 8,323,909 1,233,363 963,214 0 10,520,486 Texas Lutheran U 10,575,230 2,402,337 8,133,703 559,150 21,670,420 Texas Wesleyan U 27,212,702 4,080,724 10,576,539 1,158,263 43,028,228 Trinity U 15,678,357 3,325,366 16,800,995 1,887,305 37,692,023 U of Dallas 12,955,815 1,159,412 12,068,197 214,681 26,398,105 U of the Incarnate Word 29,868,961 4,653,875 9,716,047 881,638 45,120,521 U of Mary Hardin-Baylor 16,760,258 5,189,830 6,086,438 1,190,850 29,227,376 U of St. Thomas 14,785,308 2,689,753 6,149,051 681,653 24,305,765 Wayland Baptist U 11,648,287 1,498,148 2,334,927 238,817 15,720,179 Wiley C 5,495,313 658,156 852,158 501,833 7,507,460
TOTAL $605,690,119 $126,854,931 $403,497,477 $45,739,279 $1,181,781,806 *Data not received (1) Amberton University does not participate in state, federal or institutional student aid programs. Source: ICUT

I C U T S t a t i s t i c a l R e p o r t : 2 0 0 7
Institution-level Data
Tuition Equalization Grant Statistics 2005-2006*
36
NUMBER OF ICUT INSTITUTION RECIPIENTS AWARDED
Abilene Christian U 1,481 $4,042,001 Amberton U (1) Austin C 501 1,624,292 Baylor U 3,410 11,218,996 C of St. Thomas More 12 35,250 Concordia U at Austin 381 1,034,830 Dallas Baptist U 971 2,376,884 East Texas Baptist U 570 1,804,815 Hardin-Simmons U 970 2,570,050 Houston Baptist U 813 2,212,142 Howard Payne U 441 1,301,953 Huston-Tillotson U 293 867,149 Jacksonville C 182 327,477 Jarvis Christian C 308 836,271 LeTourneau U 355 971,701 Lon Morris C 175 491,133 Lubbock Christian U 695 2,128,117 McMurry U 707 1,868,767 Our Lady of the Lake U 1,132 3,117,529 Paul Quinn C 330 755,101 Rice U 566 1,932,597 St. Edward's U 1,115 3,439,789 St. Mary's U 1,454 4,742,816 Schreiner U 390 1,172,379 Southern Methodist U 1,774 5,455,714 SW Adventist U 274 614,972 SW Assemblies of God U 394 1,043,966 SW Christian C 69 158,403 Southwestern U 424 1,361,903 Texas Christian U 1,576 4,923,483 Texas College 418 1,199,811 Texas Lutheran U 566 1,741,168 Texas Wesleyan U 1,014 2,839,336 Trinity U 527 1,721,656 U of Dallas 295 888,070 U of the Incarnate Word 1,332 3,820,732 U of Mary Hardin-Baylor 1,326 3,676,930 U of St. Thomas 759 2,042,331 Wayland Baptist U 529 1,316,400 Wiley C 218 593,093
TOTAL 28,747 $84,270,007 (1) Amberton University does not participate in state student aid programs. Source: Texas Higher Education Coordinating Board, FY 2006 *TEG Funds were used to cover TEXAS Grant obligations as the program is phased out.

I C U T S t a t i s t i c a l R e p o r t : 2 0 0 7
TEXAS Grant Statistics 2005-2006*
Part II: Student Financial Aid Data
37
NUMBER OF TEXAS GRANT INSTITUTION RECIPIENTS FUNDS AWARDED
Abilene Christian U 385 $1,330,335 Amberton U (1) Austin C 62 203,606 Baylor U 554 1,943,345 C of St. Thomas More 0 0 Concordia U at Austin 25 94,270 Dallas Baptist U 44 131,123 East Texas Baptist U 172 642,154 Hardin-Simmons U 90 326,388 Houston Baptist U 120 372,482 Howard Payne U 103 373,978 Huston-Tillotson U 35 137,204 Jacksonville C 28 79,212 Jarvis Christian C 20 62,370 LeTourneau U 36 127,648 Lon Morris C 22 79,566 Lubbock Christian U 98 325,909 McMurry U 169 588,929 Our Lady of the Lake U 243 743,596 Paul Quinn C 33 104,455 Rice U 178 681,334 St. Edward's U 292 1,130,925 St. Mary's U 601 2,297,786 Schreiner U 48 179,740 Southern Methodist U 439 1,460,829 SW Adventist U 33 135,850 SW Assemblies of God U 66 187,301 SW Christian C 14 39,173 Southwestern U 45 139,482 Texas Christian U 163 592,031 Texas C 15 48,216 Texas Lutheran U 169 638,326 Texas Wesleyan U 69 266,290 Trinity U 107 411,936 U of Dallas 33 107,593 U of the Incarnate Word 152 482,160 U of Mary Hardin-Baylor 206 767,479 U of St. Thomas 120 381,884 Wayland Baptist U 61 180,236 Wiley C 6 18,368
TOTAL 5,056 $17,813,509 (1) Amberton University does not participate in state student aid programs. Source: Texas Higher Education Coordinating Board, FY 2006 *TEG Funds were used to cover TEXAS Grant obligations as the program is phased out.

I C U T S t a t i s t i c a l R e p o r t : 2 0 0 7
Institution-level Data
Texas College Work Study 2005-2006
38
NUMBER OF WORK STUDY INSTITUTION RECIPIENTS FUNDS AWARDED
Abilene Christian U 66 $82,516 Amberton U (1) Austin C 22 25,593 Baylor U 60 103,316 C of St. Thomas More 4 2,814 Concordia U at Austin 6 9,924 Dallas Baptist U 42 31,576 East Texas Baptist U 13 17,677 Hardin-Simmons U 61 25,690 Houston Baptist U 92 30,947 Howard Payne U 10 14,047 Huston-Tillotson U 4 7,980 Jacksonville C 18 2,995 Jarvis Christian C 12 7,881 LeTourneau U 27 29,083 Lon Morris C 4 2,328 Lubbock Christian U 116 25,849 McMurry U 60 53,642 Our Lady of the Lake U 23 15,232 Paul Quinn C 13 8,814 Rice U 4 6,272 St. Edward's U 53 71,654 St. Mary's U 82 55,862 Schreiner U 28 26,303 Southern Methodist U 50 71,913 SW Adventist U 14 9,688 SW Assemblies of God U 15 20,710 SW Christian C 3 2,783 Southwestern U 7 12,328 Texas Christian U 17 30,999 Texas C 18 12,126 Texas Lutheran U 11 15,309 Texas Wesleyan U 9 27,261 Trinity U 17 18,567 U of Dallas 10 16,505 U of the Incarnate Word 19 65,081 U of Mary Hardin-Baylor 77 103,347 U of St. Thomas 3 10,737 Wayland Baptist U 0 0 Wiley C 5 8,161
TOTAL 1,095 $1,083,510 (1) Amberton University does not participate in state student aid programs. Source: Texas Higher Education Coordinating Board, FY 2006

I C U T S t a t i s t i c a l R e p o r t : 2 0 0 7
Part III:
Faculty Data

I C U T S t a t i s t i c a l R e p o r t : 2 0 0 7

I C U T S t a t i s t i c a l R e p o r t : 2 0 0 7
Summary of Faculty Data
The number of full-time faculty at ICUT institutions increased from
5,614 in 2005-06 to 5,784 in 2006-07, 3.0%.
The number of tenured faculty at ICUT institutions increased by 4.5%
from 2005-06 to 2006-07. Tenured faculty at the rank of professor increased
by 2.3%; tenured associate professors increased by 5.4%; and tenured as-
sistant professors increased by 21.8%.
41

I C U T S t a t i s t i c a l R e p o r t : 2 0 0 7
Institution-level Data
Full-time Faculty 2006-2007
42
ICUT INSTITUTION PROF ASSOC ASST INST LECT OTHER TOTAL
Abilene Christian U 56 62 68 37 0 0 223 Amberton U 15 0 0 0 0 0 15 Austin C 29 40 23 0 0 0 92 Baylor U 255 178 138 1 232 0 804 C of St. Thomas More 3 0 0 0 0 0 3 Concordia U at Austin 11 16 8 3 0 0 38 Dallas Baptist U 41 13 48 0 0 0 102 East Texas Baptist U 27 12 18 9 0 0 66 Hardin-Simmons U 56 46 36 15 0 0 153 Houston Baptist U 44 35 37 2 0 0 118 Howard Payne U 20 20 30 3 0 0 73 Huston-Tillotson U 11 10 12 4 0 0 37 Jacksonville C 0 0 0 10 0 0 10 Jarvis Christian C 7 2 13 10 1 0 33 LeTourneau U 22 17 28 5 0 0 72 Lon Morris C 1 11 11 10 4 2 39 Lubbock Christian U 20 29 24 7 3 0 83 McMurry U 22 17 24 16 0 0 79 Our Lady of the Lake U 30 40 29 6 0 0 105 Paul Quinn C 3 16 7 9 0 0 35 Rice U 262 105 131 19 55 37 609 St. Edward's U 48 48 78 8 0 5 187 St. Mary's U 77 43 48 6 9 0 183 Schreiner U 13 10 14 8 4 0 49 Southern Methodist U 205 150 144 0 137 4 640 SW Adventist U 23 13 19 1 0 0 56 SW Assemblies of God U 17 9 16 14 1 1 58 SW Christian C 0 7 2 1 0 1 11 Southwestern U 32 41 45 2 0 0 120 Texas Christian U 140 158 93 51 36 0 478 Texas C 6 7 10 11 0 0 34 Texas Lutheran U 15 27 29 2 4 0 77 Texas Wesleyan U 59 40 28 13 0 3 143 Trinity U 93 59 65 5 0 0 222 U of Dallas 34 40 47 15 0 8 144 U of the Incarnate Word 41 44 52 38 0 7 182 U of Mary Hardin-Baylor 37 45 43 5 0 3 133 U of St. Thomas 44 54 24 2 5 0 129 Wayland Baptist U 27 36 24 4 2 0 93 Wiley C 4 19 22 10 1 0 56
TOTAL 1,850 1,519 1,488 362 494 71 5,784
Source: ICUT

I C U T S t a t i s t i c a l R e p o r t : 2 0 0 7
Tenured Faculty 2006-2007
Part III: Faculty Data
43
PROF ASSOC ASST INST LECT OTHER TOTAL
Abilene Christian U 51 42 6 0 0 0 99 Amberton U 0 0 0 0 0 0 0 Austin C 29 37 0 0 0 0 66 Baylor U 223 140 12 1 0 0 376 C of St. Thomas More 0 0 0 0 0 0 0 Concordia U at Austin 2 1 0 0 0 0 3 Dallas Baptist U 2 0 0 0 0 0 2 East Texas Baptist U 2 0 0 0 0 0 0 Hardin-Simmons U 47 33 7 5 0 0 92 Houston Baptist U 0 0 0 0 0 0 0 Howard Payne U 6 0 0 0 0 0 6 Huston-Tillotson U 4 0 0 0 0 0 4 Jacksonville C 0 0 0 0 0 0 0 Jarvis Christian C 3 0 0 0 0 0 3 LeTourneau U 20 12 12 0 0 0 44 Lon Morris C 0 1 0 0 0 0 1 Lubbock Christian U 20 20 5 0 0 0 45 McMurry U 21 16 3 0 0 0 40 Our Lady of the Lake U 20 10 1 0 0 0 31 Paul Quinn C 0 0 0 0 0 0 0 Rice U 244 102 0 0 0 0 346 St. Edward's U 40 16 0 0 0 0 56 St. Mary's U 73 36 5 0 0 0 114 Schreiner U 13 8 0 0 0 0 21 Southern Methodist U 182 135 3 0 2 0 322 SW Adventist U 22 6 0 0 0 0 28 SW Assemblies of God U 8 1 5 0 0 0 14 SW Christian C 0 4 0 0 0 0 4 Southwestern U 32 35 0 0 0 0 67 Texas Christian U 131 131 2 4 0 0 268 Texas C 1 0 0 0 0 0 1 Texas Lutheran U 15 22 8 0 0 0 45 Texas Wesleyan U 57 22 3 0 0 0 82 Trinity U 93 59 1 5 0 0 158 U of Dallas 26 29 4 0 0 0 59 U of the Incarnate Word 35 26 8 1 0 0 70 U of Mary Hardin-Baylor 22 16 7 0 0 0 45 U of St. Thomas 41 38 3 0 0 0 82 Wayland Baptist U 1 0 0 0 0 0 1 Wiley C 1 1 0 0 0 0 2
TOTAL 1,487 999 95 16 2 0 2,597
Source: ICUT

I C U T S t a t i s t i c a l R e p o r t : 2 0 0 7
Institution-level Data

I C U T S t a t i s t i c a l R e p o r t : 2 0 0 7
Part IV:
Financial Data

I C U T S t a t i s t i c a l R e p o r t : 2 0 0 7

I C U T S t a t i s t i c a l R e p o r t : 2 0 0 7
Summary of Financial Data
As a whole, revenue at ICUT institutions increased by 16.7%, from
$3.02 billion in 2004-05 to $3.52 billion in 2005-06. Private Gifts increased
47.9%, and Other Revenue, which includes investment returns, increased by
18.6%.
Total expenditures at ICUT institutions increased by 6.2%, from
$2.244 billion in 2004-05 to $2.384 billion in 2005-06.
Land, buildings and equipment increased in value as a whole by
7.2%.
The Endowment table shows that the total market value of endow-
ments increased by 11.16% between the beginning and end of fiscal year
2006. The endowment yield for fiscal year 2006 was 9.9% higher than the
yield for fiscal year 2005.
47
I C U T S t a t i s t i c a l R e p o r t : 2 0 0 7
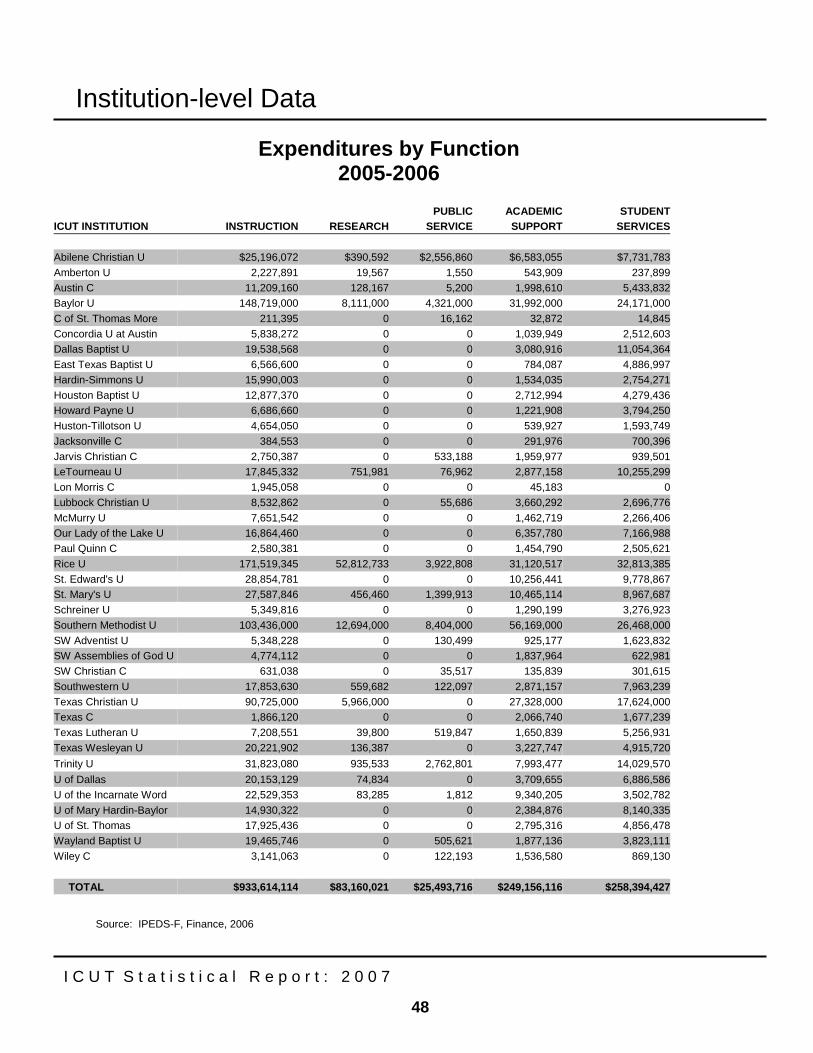
Source: IPEDS-F, Finance, 2006
Expenditures by Function 2005-2006
Institution-level Data
48
PUBLIC ACADEMIC STUDENT ICUT INSTITUTION INSTRUCTION RESEARCH SERVICE SUPPORT SERVICES
Abilene Christian U $25,196,072 $390,592 $2,556,860 $6,583,055 $7,731,783 Amberton U 2,227,891 19,567 1,550 543,909 237,899 Austin C 11,209,160 128,167 5,200 1,998,610 5,433,832 Baylor U 148,719,000 8,111,000 4,321,000 31,992,000 24,171,000 C of St. Thomas More 211,395 0 16,162 32,872 14,845 Concordia U at Austin 5,838,272 0 0 1,039,949 2,512,603 Dallas Baptist U 19,538,568 0 0 3,080,916 11,054,364 East Texas Baptist U 6,566,600 0 0 784,087 4,886,997 Hardin-Simmons U 15,990,003 0 0 1,534,035 2,754,271 Houston Baptist U 12,877,370 0 0 2,712,994 4,279,436 Howard Payne U 6,686,660 0 0 1,221,908 3,794,250 Huston-Tillotson U 4,654,050 0 0 539,927 1,593,749 Jacksonville C 384,553 0 0 291,976 700,396 Jarvis Christian C 2,750,387 0 533,188 1,959,977 939,501 LeTourneau U 17,845,332 751,981 76,962 2,877,158 10,255,299 Lon Morris C 1,945,058 0 0 45,183 0 Lubbock Christian U 8,532,862 0 55,686 3,660,292 2,696,776 McMurry U 7,651,542 0 0 1,462,719 2,266,406 Our Lady of the Lake U 16,864,460 0 0 6,357,780 7,166,988 Paul Quinn C 2,580,381 0 0 1,454,790 2,505,621 Rice U 171,519,345 52,812,733 3,922,808 31,120,517 32,813,385 St. Edward's U 28,854,781 0 0 10,256,441 9,778,867 St. Mary's U 27,587,846 456,460 1,399,913 10,465,114 8,967,687 Schreiner U 5,349,816 0 0 1,290,199 3,276,923 Southern Methodist U 103,436,000 12,694,000 8,404,000 56,169,000 26,468,000 SW Adventist U 5,348,228 0 130,499 925,177 1,623,832 SW Assemblies of God U 4,774,112 0 0 1,837,964 622,981 SW Christian C 631,038 0 35,517 135,839 301,615 Southwestern U 17,853,630 559,682 122,097 2,871,157 7,963,239 Texas Christian U 90,725,000 5,966,000 0 27,328,000 17,624,000 Texas C 1,866,120 0 0 2,066,740 1,677,239 Texas Lutheran U 7,208,551 39,800 519,847 1,650,839 5,256,931 Texas Wesleyan U 20,221,902 136,387 0 3,227,747 4,915,720 Trinity U 31,823,080 935,533 2,762,801 7,993,477 14,029,570 U of Dallas 20,153,129 74,834 0 3,709,655 6,886,586 U of the Incarnate Word 22,529,353 83,285 1,812 9,340,205 3,502,782 U of Mary Hardin-Baylor 14,930,322 0 0 2,384,876 8,140,335 U of St. Thomas 17,925,436 0 0 2,795,316 4,856,478 Wayland Baptist U 19,465,746 0 505,621 1,877,136 3,823,111 Wiley C 3,141,063 0 122,193 1,536,580 869,130
TOTAL $933,614,114 $83,160,021 $25,493,716 $249,156,116 $258,394,427

I C U T S t a t i s t i c a l R e p o r t : 2 0 0 7
(1) Net aid to students refers to student grants that are reported as expenditures. It does not include student aid in the form of work study or reduced tuition.
Expenditures by Function (continued) 2005-2006
49
Part IV: Financial Data
INSTITUTIONAL AUXILIARY NET AID TO ICUT INSTITUTION SUPPORT ENTERPRISES STUDENTS OTHER TOTAL
Abilene Christian U $20,478,186 $21,819,432 $0 $1 $84,755,981 Amberton U 1,977,166 0 0 0 5,007,982 Austin C 6,232,233 1,573,461 0 11,116,272 37,696,935 Baylor U 42,542,000 57,347,000 0 0 317,203,000 C of St. Thomas More 178,956 29,221 0 161,782 645,233 Concordia U at Austin 3,561,245 1,899,735 0 0 14,851,804 Dallas Baptist U 10,384,448 3,198,834 0 0 47,257,130 East Texas Baptist U 3,998,389 3,935,687 0 0 20,171,760 Hardin-Simmons U 5,625,875 7,437,819 0 -651,016 32,690,987 Houston Baptist U 7,124,435 4,360,182 3,513,962 0 34,868,379 Howard Payne U 3,510,293 2,628,411 3,518,089 7,740 21,367,351 Huston-Tillotson U 3,350,244 1,005,116 1,241,842 2,723,076 15,108,004 Jacksonville C 628,339 374,306 0 634,031 3,013,601 Jarvis Christian C 3,617,635 2,004,985 0 0 11,805,673 LeTourneau U 5,521,814 5,740,043 0 0 43,068,589 Lon Morris C 3,667,257 1,369,135 1,684,188 1,306,625 10,017,446 Lubbock Christian U 4,279,931 5,344,843 0 7,007,305 31,577,695 McMurry U 2,862,506 5,213,285 307,328 0 19,763,786 Our Lady of the Lake U 11,108,681 3,241,933 0 0 44,739,842 Paul Quinn C 3,744,260 957,170 1,110,232 0 12,352,454 Rice U 34,495,717 33,475,532 11,177,963 0 371,338,000 St. Edward's U 12,482,550 10,181,369 0 0 71,554,008 St. Mary's U 12,607,738 10,498,060 0 0 71,982,818 Schreiner U 4,464,022 3,594,295 0 0 17,975,255 Southern Methodist U 61,514,000 42,662,000 2,677,000 1,833,000 315,857,000 SW Adventist U 3,983,197 2,551,937 0 0 14,562,870 SW Assemblies of God U 2,886,944 1,733,061 0 5,929,662 17,784,724 SW Christian C 496,830 510,936 407,989 2,923,254 5,443,018 Southwestern U 13,473,021 8,503,709 0 0 51,346,535 Texas Christian U 22,769,000 60,213,000 2,355,000 6,586,000 233,566,000 Texas C 3,900,059 2,053,902 0 0 11,564,060 Texas Lutheran U 7,278,988 5,035,191 0 0 26,990,147 Texas Wesleyan U 8,741,526 3,433,856 0 -1,398,820 39,278,318 Trinity U 18,334,996 13,324,987 0 0 89,204,444 U of Dallas 6,071,354 7,124,107 0 0 44,019,665 U of the Incarnate Word 12,699,013 6,784,323 0 1,355,994 56,296,767 U of Mary Hardin-Baylor 6,119,710 8,258,849 0 0 39,834,092 U of St. Thomas 9,241,291 4,879,583 0 0 39,698,104 Wayland Baptist U 4,203,512 3,211,614 0 5,886,287 38,973,027 Wiley C 6,266,230 2,614,847 1,001,389 2,850,102 18,401,534
TOTAL $396,423,591 $360,125,756 $28,994,982 $48,271,295 $2,383,634,018

I C U T S t a t i s t i c a l R e p o r t : 2 0 0 7
Institution-level Data
Sources of Revenue 2005-2006
50
TUITION GOVT GOVT PRIVATE OTHER ICUT INSTITUTION & FEES APPROP GRANTS GIFTS REVENUE TOTAL
Abilene Christian U $45,819,480 $0 $2,236,763 $17,713,504 $58,422,289 $124,192,036 Amberton U 5,651,820 0 0 0 398,094 6,049,914 Austin C 18,371,423 0 597,269 13,676,840 23,386,401 56,031,933 Baylor U 200,449,000 0 24,209,000 38,112,000 224,705,000 487,475,000 C of St. Thomas More 296,290 0 49,376 350,557 82,658 778,881 Concordia U at Austin 10,151,145 0 1,343,512 1,460,274 3,116,702 16,071,633 Dallas Baptist U 36,718,906 0 467,332 9,528,188 10,470,497 57,184,923 East Texas Baptist U 10,210,637 0 0 5,758,422 11,068,707 27,037,766 Hardin-Simmons U 20,158,863 0 216,001 14,205,149 17,945,467 52,525,480 Houston Baptist U 20,734,850 0 0 5,716,426 8,850,247 35,301,523 Howard Payne U 11,550,048 0 1,978,725 5,351,292 9,063,777 27,943,842 Huston-Tillotson U 4,795,288 0 2,801,264 6,103,368 2,096,425 15,796,345 Jacksonville C 1,095,504 0 415,637 860,351 868,012 3,239,504 Jarvis Christian C 2,333,105 0 5,444,619 1,069,999 2,070,534 10,918,257 LeTourneau U 36,052,195 0 2,333,485 2,912,911 8,041,203 49,339,794 Lon Morris C 2,794,645 0 1,093,658 960,211 3,146,954 7,995,468 Lubbock Christian U 11,831,657 0 2,149,638 3,545,808 19,453,751 36,980,854 McMurry U 13,377,487 0 4,278,477 4,198,833 7,174,891 29,029,688 Our Lady of the Lake U 27,785,688 0 4,609,032 2,667,707 10,894,569 45,956,996 Paul Quinn C 4,359,654 0 3,940,896 339,746 3,768,552 12,408,848 Rice U 71,354,000 0 65,044,878 107,021,122 562,463,000 805,883,000 St. Edward's U 56,062,972 0 3,039,089 7,351,177 18,057,498 84,510,736 St. Mary's U 42,871,595 0 12,938,511 29,174,678 24,480,006 109,464,790 Schreiner U 6,814,961 0 158,198 7,851,473 7,237,557 22,062,189 Southern Methodist U 176,769,000 0 17,138,000 66,134,000 140,261,000 400,302,000 SW Adventist U 7,364,938 0 1,017,100 1,863,084 9,155,832 19,400,954 SW Assemblies of God U 8,397,850 0 3,221,535 3,292,938 3,863,262 18,775,585 SW Christian C 816,835 0 1,737,862 1,735,468 1,338,658 5,628,823 Southwestern U 18,919,406 0 553,691 7,975,869 19,784,172 47,233,138 Texas Christian U 129,011,000 0 6,685,000 33,087,000 200,210,000 368,993,000 Texas C 3,122,215 0 7,201,671 1,312,769 2,964,436 14,601,091 Texas Lutheran U 13,429,023 0 3,141,802 4,659,678 15,876,681 37,107,184 Texas Wesleyan U 31,538,448 0 1,390,015 3,455,766 7,198,800 43,583,029 Trinity U 37,976,898 0 1,799,960 18,590,859 124,589,012 182,956,729 U of Dallas 26,412,184 0 772,911 5,884,115 13,488,234 46,557,444 U of the Incarnate Word 48,895,582 0 5,229,402 8,055,002 9,093,080 71,273,066 U of Mary Hardin-Baylor 25,950,861 0 531,103 4,926,229 17,196,011 48,604,204 U of St. Thomas 30,111,521 0 403,878 8,874,443 5,056,320 44,446,162 Wayland Baptist U 20,947,797 0 976,675 4,250,776 11,505,591 37,680,839 Wiley C 2,850,108 0 5,899,687 2,630,807 1,795,323 13,175,925
TOTAL $1,244,154,879 $0 $197,045,652 $462,658,839 $1,620,639,203 $3,524,498,573
Source: IPEDS Finance, 2006

I C U T S t a t i s t i c a l R e p o r t : 2 0 0 7
Land, Buildings and Equipment 2005-2006
Part IV: Financial Data
51
EQUIPMENT LAND AND LAND (INCLUDING ART
ICUT INSTITUTION IMPROVEMENTS BUILDINGS AND LIBRARY) TOTAL
Abilene Christian U $2,904,699 $134,314,392 $23,809,014 $161,028,105 Amberton U 200,000 1,703,592 974,988 2,878,580 Austin C 9,792,524 73,302,124 17,078,637 100,173,285 Baylor U 28,815,000 547,679,000 158,778,000 735,272,000 C of St. Thomas More 135,892 913,334 269,964 1,319,190 Concordia U at Austin 1,293,932 28,397,248 6,322,215 36,013,395 Dallas Baptist U 11,839,393 46,762,500 12,696,170 71,298,063 East Texas Baptist U 4,965,223 28,690,849 8,091,180 41,747,252 Hardin-Simmons U 1,324,277 53,738,429 19,092,735 74,155,441 Houston Baptist U 7,322,691 37,464,947 20,040,706 64,828,344 Howard Payne U 2,144,957 31,845,978 2,212,319 36,203,254 Huston-Tillotson U 1,775,081 5,821,752 1,489,555 9,086,388 Jacksonville C 194,998 2,692,967 959,631 3,847,596 Jarvis Christian C 61,509 20,415,263 9,972,482 30,449,254 LeTourneau U 7,616,528 66,785,204 16,026,229 90,427,961 Lon Morris C 262,595 15,726,135 6,167,880 22,156,610 Lubbock Christian U 6,606,448 27,961,781 9,288,424 43,856,653 McMurry U 1,577,693 28,583,579 15,105,523 45,266,795 Our Lady of the Lake U 2,217,126 39,632,903 25,527,908 67,377,937 Paul Quinn C 3,175,694 7,072,335 1,242,858 11,490,887 Rice U 18,105,000 424,679,000 146,105,000 588,889,000 St. Edward's U 3,155,589 121,612,626 22,157,671 146,925,886 St. Mary's U 11,797,843 75,408,288 38,626,406 125,832,537 Schreiner U 8,971,742 31,650,009 11,256,048 51,877,799 Southern Methodist U 142,321,000 489,164,000 91,970,000 723,455,000 SW Adventist U 2,519,225 21,766,991 7,272,364 31,558,580 SW Assemblies of God U 655,254 18,425,679 5,506,970 24,587,903 SW Christian C 110,246 2,498,287 757,240 3,365,773 Southwestern U 13,679,950 97,019,437 28,662,092 139,361,479 Texas Christian U 29,052,000 364,148,000 102,089,000 495,289,000 Texas C 174,480 6,181,419 5,304,895 11,660,794 Texas Lutheran U 10,583,105 43,416,912 11,640,300 65,640,317 Texas Wesleyan U 4,101,187 50,670,240 38,460,327 93,231,754 Trinity U 17,490,196 157,642,880 69,537,908 244,670,984 U of Dallas 18,376,792 64,599,461 12,676,273 95,652,526 U of the Incarnate Word 2,414,212 74,205,543 17,651,695 94,271,450 U of Mary Hardin-Baylor 9,855,486 60,387,855 15,060,837 85,304,178 U of St. Thomas 16,283,878 68,446,450 20,950,207 105,680,535 Wayland Baptist U 4,415,826 38,824,515 16,804,701 60,045,042 Wiley C 874,519 17,565,062 9,190,774 27,630,355
TOTAL 409,163,790 3,427,816,966 1,026,827,126 4,863,807,882
Source: IPEDS Finance, 2006

I C U T S t a t i s t i c a l R e p o r t : 2 0 0 7
Institution-level Data
Endowment 2006
52
FY 2006 BEGINNING FY 2006 ENDING FY 2006 ICUT INSTITUTION MARKET VALUE MARKET VALUE ENDOWMENT YIELD
Abilene Christian U $189,786,539 $228,761,113 $9,715,283 Amberton U 16,600,000 18,502,773 203,371
Austin C 107,886,955 120,221,782 3,833,270
Baylor U 745,751,000 870,364,000 45,654,000 C of St. Thomas More 111,151 114,718 856 Concordia U at Austin 11,679,828 12,070,225 549,397 Dallas Baptist U 27,832,841 30,503,577 1,513,349 East Texas Baptist U 51,001,631 56,158,298 2,744,753 Hardin-Simmons U 87,136,199 104,693,614 5,165,374 Houston Baptist U 84,627,146 82,289,211 2,351,844 Howard Payne U 40,795,800 44,355,138 2,472,056 Huston-Tillotson U 0 0 611,419 Jacksonville C 2,421,189 2,593,268 131,932 Jarvis Christian C 11,824,774 11,824,774 0 LeTourneau U 5,152,885 5,864,674 84,829 Lon Morris C 19,389,941 17,626,455 501,824 Lubbock Christian U 11,116,779 11,642,487 179,101 McMurry U 46,390,952 47,927,027 2,038,737 Our Lady of the Lake U 25,934,755 26,838,170 645,950 Paul Quinn C 5,989,660 6,208,815 101,295 Rice U 3,752,895,796 4,118,919,949 70,679,715 St. Edward's U 44,955,000 53,562,000 517,320 St. Mary's U 103,505,043 135,887,844 1,143,157 Schreiner U 38,046,172 42,674,756 2,080,077 Southern Methodist U 1,008,505,188 1,127,671,239 14,431,894 SW Adventist U 4,020,134 5,692,707 555,928 SW Assemblies of God U 2,799,639 3,000,064 163,495 SW Christian C* Southwestern U 279,293,177 279,939,773 12,063,349 Texas Christian U 987,889,487 1,117,209,000 36,242,000 Texas C 1,271,488 1,322,521 41,339 Texas Lutheran U 51,678,786 58,523,550 2,495,134 Texas Wesleyan U 39,629,700 43,890,300 4,317,654 Trinity U 733,261,357 814,671,694 54,042,781 U of Dallas 43,782,863 44,066,403 371,405 U of the Incarnate Word 33,648,754 35,981,039 784,085 U of Mary Hardin-Baylor 49,437,151 55,365,000 2,837,000 U of St. Thomas 41,015,685 44,439,700 2,246,147 Wayland Baptist U 46,290,427 49,427,546 4,910,613 Wiley C 3,853,054 3,978,121 88,498 TOTAL $8,757,208,926 $9,734,783,325 $288,510,231 *Data not received Source: ICUT