Embed Size (px)
Citation preview

�
���
�
B y U N E S C O I n s t i t u t e f o r S t a t i s t i c s 2 0 1 6
ICT in education statistics: Shifting from regional reporting to global
monitoring: Progress made, challenges encountered, and the way forward
This paper was commissioned by the Global Education Monitoring Report as background information to assist in drafting the 2016 report. It has not been edited by the team. The views and opinions expressed in this paper are those of the author(s) and should not be attributed to the Global Education Monitoring Report or to UNESCO. The papers can be cited with the following reference: “Paper commissioned for the Global Education Monitoring Report 2016, Education for people and planet: Creating sustainable futures for all”. For further information, please contact [email protected].
��������������� ���
Background paper prepared for the 2016 Global Education Monitoring Report
Education for people and planet: Creating sustainable futures for all

2
Role of the UIS in ICT in education statistics
The UNESCO Institute for Statistics (UIS)1 is mandated to administer international data collections on the availability, use and impact of ICT in education. Through the establishment of internationally comparable and policy-relevant indicators, the UIS contributes towards benchmarking and monitoring the integration of and access to ICT in education, which are fundamental for policymakers to select priorities and adopt and develop effective policies. With available data, policymakers can make informed decisions regarding:
i) curricula including promoting ICT skills as well as using ICT to support instruction in other school subjects;
ii) national capacity and/or infrastructure levels (e.g. electricity, Internet, by type) to permit the integration of ICT tools in more schools;
iii) types of ICT currently being emphasised and/or neglected in relation to issues of suitability and affordability (e.g. radio- versus computer-assisted instruction);
iv) national deployment patterns of ICTs in schools;
v) access rates among girls and boys;
vi) types of support mechanisms currently in place or lack thereof; and
vii) the relative level of teacher training provided in relation to the demands placed on them to teach and/or use ICT in the classroom.
ICT in education: International Frameworks and Monitoring
In 2000, neither the Millennium Development Goals (MDGs) nor Education for All (EFA) provided concrete objectives or goals related to ICT in education. However about a decade later, the World Summit on the Information Society (WSIS), which convened in 2003 and 2005, resulted in a clear commitment by governments to foster the achievement of an inclusive information society. To this end, the WSIS Geneva Plan of Action identified ten targets to be achieved by 2015—two of which are related to education. The Geneva Plan of Action includes Target 2 to “Connect all secondary and primary schools with ICTs”, as well as Target 7 to “Adapt all primary and secondary school curricula to meet the challenges of the information society, taking into account national circumstances” (Partnership on Measuring ICT for Development, 2011).
As a response to the international community’s increasing recognition of the vital role that ICT in education can play in establishing an inclusive information society, the UIS, which was developing a statistical framework for measuring and monitoring ICT in education, developed the UIS Guide to Measuring Information and Communication Technologies (ICT) in Education (Technical Paper NO.2) (UNESCO-UIS, 2009). In this statistical manual UIS promotes and describes eight core indicators that were selected to monitor key features of ICT integration into national education systems. Given electricity’s important role in supporting the integration and use of many ICTs, the core list also includes a reference indicator to measure its availability in schools (see Box 1: UIS core indicators on ICT in education).
1 This paper was written by Peter Wallet of the UNESCO Institute for Statistics (UIS).

3
While a number of the core UIS indicators can be applied to measuring the targets, WSIS outcome documents did not specify quantifiable indicators that could be applied to monitor progress. The international, multi-stakeholder Partnership on Measuring ICT for Development initiative, of which UIS is an active member, has the objective to improve the availability and quality of ICT data and indicators, particularly in developing countries (Partnership on Measuring ICT for Development, 2011). Recognising this lack of an international framework for measuring the WSIS targets, UIS in collaboration with other members of the Partnership developed a statistical framework in 2010 and selected indicators to monitor the ten targets. To validate the framework, the list of indicators was presented and discussed during the ITU World Telecommunication/ICT Indicators Meeting (WTIM); they were also discussed through the online task group including 90 experts in the area of ICT measurement. For this, final WSIS indicators overlap UIS core indicators, yet remain focused on primary and secondary education unlike the core (see Box 2: WSIS targets on education and related indicators). More recently in May 2015, UNESCO organised the World Education Forum in Incheon, Republic of Korea to bring together the international community, and lead the way to build a powerful new education
Box 2: WSIS targets on education and related indicators
Target 2. Connect all secondary schools and primary schools with ICT 1. Proportion of schools with a radio used for educational purposes 2. Proportion of schools with a television used for educational purposes 3. Learner-to-computer ratio 4. Proportion of schools with Internet access, by type of access
Target 7. Adapt all primary and secondary school curricula to meet the challenges of the information society, taking into account national circumstances 1. Proportion of ICT-qualified teachers in schools 2. Proportion of teachers trained to teach subjects using ICT 3. Proportion of schools with computer-assisted instruction (CAI) 4. Proportion of schools with Internet-assisted instruction (IAI)
Source: Partnership on Measuring ICT for Development, 2011
Box 1: UIS core indicators on ICT in education
1. Proportion of schools with a radio used for educational purposes 2. Proportion of schools with a television used for educational purposes 3. Proportion of schools with a telephone communication facility 4. Learner-to-computer ratio in schools with computer-assisted instruction 4bis. Learners-to-computer ratio 5. Proportion of schools with Internet access, by type of access 6. Proportion of learners who have access to the Internet at school 7. Proportion of learners enrolled at the post-secondary non-tertiary and tertiary level in ICT fields 8. Proportion of ICT-qualified teachers in primary and secondary schools EDR1: Proportion of schools with electricity Source: UNESCO-UIS, 2009

4
agenda that will transform lives. In the Incheon Declaration, the vital role of ICT in achieving the new global education targets is reflected in Article 10 of the text where it states that: “Information and communication technologies (ICTs) must be harnessed to strengthen education systems, knowledge dissemination, information access, quality and effective learning, and more effective service provision.” (UNESCO, 2015a).
To underline the significance and important role of ICTs in the future of education, UNESCO also organised the International Conference on ICT in Education in Qingdao, China bringing together approximately 65 Ministers of Education, which resulted in the Qingdao Declaration. This new international declaration not only committed countries to integrating ICT into their education systems, but also committed countries to the timely reporting of accurate ICT in education data to the UIS to facilitate its work and advance its mission to build and maintain a global statistical repository (UNESCO, 2015b).
Collecting more and better quality data from countries will be a priority in the post-2015 development agenda. While targets are emerging, indicators to monitor said targets are still being identified. The Sustainable Development Goals (SDGs) and the proposed monitoring framework acknowledge the importance of ICTs in education. In particular Target 4.a states that countries need to: “Build and upgrade education facilities that are child, disability and gender sensitive and provide safe, non-violent, inclusive and effective learning environments for all.” In addition to collecting indicators on potable water, basic sanitation and handwashing facilities, UIS will also lead monitoring efforts in collecting data on proportions of schools with electricity and Internet used for pedagogical purposes as they are recognised globally as pivotal in achieving this target.
Finally, the SDGs also recognise that ICT in education is important for achieving SDG Target 4.4, which states that, “By 2030, substantially increase the number of youth and adults who have relevant skills, including technical and vocational skills, for employment, decent jobs and entrepreneurship.” Again, UIS ICT in education indicators will be essential for shedding light on the capacity for national education systems, schools, and the teaching workforce to support progress towards meeting fostering and enhancing these skills.
Progress and challenges in monitoring ICT in education
Despite the growing demand for data on ICT in education, the best-known international sources of education statistics continue to lack basic information about ICT policies in education. For developed countries, neither the Organisation for Economic Co-operation and Development (OECD) nor the European Commission have a comprehensive set of indicators that include all three components of inputs, processes and outcomes related to ICT – although they are both increasingly improving the dataset to include, for instance, assessments of student performance in digital skills, and the magnitude of ICT use in various subjects, e.g. mathematics, and its effect on student achievement scores. In fact, the OECD’s Programme for International Student Assessment (PISA) dataset remains one of the most reliable sources of information on access, use and outcomes in this domain, despite its limitations in terms of geographical coverage, reliability and inadequacy regarding current classroom practices (OECD, 2015).
Collecting internationally comparable statistics on ICT in education in developing countries is even more challenging. Unlike in developed countries, collecting the most basic data to calculate key indicators remains challenging and this is particularly true in low income and least developed countries (LDCs) where systematic data collection on ICT in education is either i) in its infancy (i.e. only a few items are possibly included in the countries’ EMIS), or ii) does not currently exist. Since data collection typically reflects

5
national priorities and current policy (see Box 1), data on the integration of ICT in education is of lower priority in many of the world’s least developed economies when compared to other objectives, such as decreasing out-of-school children, improving grade progression, and ensuring an adequate supply of trained teachers. Additionally, the relatively slow pace of ICT integration due to a variety of factors beyond the lack of formal policy, including inadequate financial resources, curricular reform, physical infrastructure, and trained teachers with appropriate skills further reinforces this lack of urgency to measure and monitor progress. For example, in response to a recent UIS survey Angola, Benin, the Central African Republic, Congo, the Democratic Republic of Congo, Djibouti and Somalia all reported that at the current reference period (i.e. 2013/2014), systematic data collection for ICT in education did not exist (UNESCO-UIS, 2015a). Similarly in South and West Asia, both Afghanistan and Pakistan also reported no systematic data collection for ICT in education in 2010/2011 (UNESCO-UIS, 2014a).
Data included in this paper
UIS has begun to shed light on the state of ICT in education by conducting regional data collections in Latin America and the Caribbean (UNESCO-UIS, 2012), Arab States (UNESCO-UIS, 2013), Asia (UNESCO-UIS, 2014a), and sub-Saharan Africa (UNESCO-UIS, 2015a). Based on these previous papers, this commissioned work will cover some of the basic indicators to support ICT in education in schools including a) ICT courses in curriculum, b) electrification of schools, c) Internet availability, and d) computer density as measured by pupil-computer ratios. It is noteworthy that data on Internet availability in schools refers to general Internet that may be used for both pedagogical and/ or administrative purposes. Data on Internet in schools used for solely pedagogical purposes is more challenging to collect and the reasons why will be further elucidated in the relevant section in this paper.

6
Box 1: Various types of ICT in education policy and plan documents: An important lever for curricular reform
ICT usage in schools is important to ensure children can develop digital literacy to acquire general life and basic work skills, and also to empower them in their ongoing education throughout secondary, post-‐secondary and tertiary education. Especially where ICTs are absent in households, computers in schools are even more necessary. Policymakers are in a unique position to bring about curricular change. As illustrated in a study of 174 ICT-‐supported innovative classrooms in 28 countries (Kozma, 2003), there was an explicit connection between ICT innovation and national policies that promoted usage in 127 cases (Jones, 2003).
Policies are typically defined as government-‐issued documents that set out the principles, guidelines and strategy, while plans describe how these principles are to be achieved within a specified timeframe and include details of each activity to be undertaken, the method employed for implementation, the timeframe, the resources required, and the actors responsible for implementation. According to UIS data collection efforts in sub-‐Saharan Africa in 2013/2014, the manner in which ICT in education policies/ plans are expressed varies among countries and can be contained within:
• Education sector strategy policy and plans: Elaborates ICT integration and usage within the context of the overall education system (tertiary may be addressed in other documents) where it forms one part of policy reform or planning which can also address various topics related to general programme orientation, curriculum, other educational inputs, gender, teacher training, and various education goals and objectives;
• Cross-‐sectoral ICT policy and master plans: Discusses ICT integration in education within the context of integrating ICT across many sectors including education, health, government (e-‐government), business, waste management (e-‐waste), other public services, culture, etc.; and
• Specific ICT in education policy and plans: Typically develops the scope of national goals and strategy most effectively by focusing solely on ICT integration in education providing detail on specific objectives and goals, inputs, strategy, teacher training, expected outcomes, etc.
Policy development is thought to precipitate ICT integration in schools; however curricular reform including formal recommendations to use ICT in primary and secondary curricula is another important lever towards promoting ICT usage. Based on recent data from sub-Saharan Africa, Figure 1 presents countries that have specific curricular objectives or a course on basic computer skills (or computing) in primary and secondary education levels. Several countries do not have any objectives or offer courses on basic computer skills or computing including Burkina Faso, Comoros, Guinea, Madagascar and Niger. In other countries, however, regardless whether or not it is achievable in all schools, courses are first recommended in upper secondary education in Djibouti, Gambia, Sao Tome and Principe, South Africa and Togo, and in lower secondary education in Ethiopia, Lesotho and Liberia. Finally, while such objectives or courses are rarely recommended in national curriculum at the primary level, Angola, Botswana, Cameroun, Côte d’Ivoire, Mauritius, Uganda and Zambia do so.
Figure 1. Education levels with an objective or course in basic computer skills or computing, 2013
Notes: Educational levels are represented according to the International Standard Classification of Education 2011 (ISCED 2011). In ISCED 2011, the following education levels are labelled as follows: primary education = ISCED 1; lower secondary education = ISCED 2; and upper secondary education = ISCED 3. Data for South Africa reflect 2011; data for Angola, Botswana, Togo and Zambia reflect 2012; data for Ethiopia, Gambia, Liberia and Mauritius reflect 2014. Source: UIS statistical database, 2015

7
Electrification of schools
Electricity in schools or a lack thereof, is a significant antecedent not only for lighting and heating, but also to power ICTs. While battery-operated devices can be recharged off-site (e.g. radios, mobile telephones, smart phones), most devices including television, desktop/laptop/tablet computers and the Internet continue to require a more stable energy source. In other words, the integration of ICT in schools requires electricity that is regularly and readily available. In many developing countries, however, rural, remote and nomadic regions are frequently neglected when developing national infrastructure, even though they could be well served using innovative ICT solutions such as radio and television broadcasts, especially those which are interactive in nature (UNESCO-UIL, 2014). Even if schools are connected to an electrical source, in many developing countries, power surges and brownouts are common in both rural and urban areas further impeding the reliable usage of ICT (Mudenda, et al., 2014; Practical Action, 2013).
Electrification of schools is almost universal in all schools in North America and Western Europe, and Central and Eastern Europe. In Central Asia, most countries also are fully electrified except one notable exception being Mongolia where 91 per cent of schools had electricity in 2012. In all other regions, Figure
2 shows that the proportion of primary and secondary schools with electricity varies substantially between
countries. For example, in the Arab States, all schools had electricity in Egypt in 2010, Oman and Qatar in 2011, and Palestine in 2012, while in Mauritania, just 2 per cent and 36 per cent of primary and secondary schools, respectively, had electricity in 2012.
In several Caribbean countries electricity is available in all schools while there is greater variability in South America. More than 90 per cent of schools were electrified in many countries including Brazil, El Salvador and Paraguay in 2010, and Argentina, Suriname and Uruguay in 2009. In contrast the availability of electricity was a challenge in 2010 in Venezuela, Dominican Republic and Nicaragua where 54, 43 and 24 per cent of primary schools had electricity, respectively, compared to 60, 34 and 68 per cent of secondary schools.
In most developing countries, secondary schools are more frequently connected to an electrical supply than primary schools. This is true of Latin American and Caribbean countries; however this pattern becomes more amplified in South and West Asia. For example, 55 and 45 percent of primary schools were connected in 2012 in Bangladesh and India, respectively, compared 71 and 68 per cent of secondary schools. Electricity is especially a challenge in the highly mountainous country of Nepal where only 6 and 24 of primary and secondary schools, respectively, had electricity in 2011. As an exception to the region, all schools in Maldives and almost all schools in Iran were electrified in 2012.
8
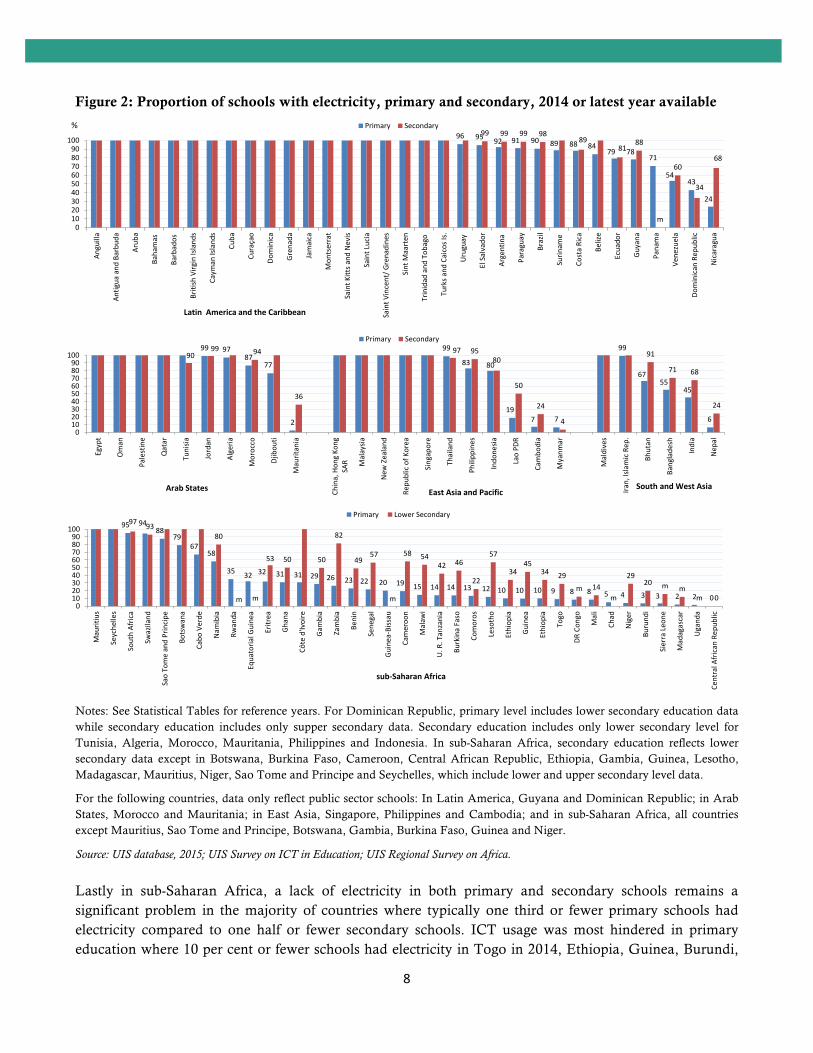
Figure 2: Proportion of schools with electricity, primary and secondary, 2014 or latest year available
Notes: See Statistical Tables for reference years. For Dominican Republic, primary level includes lower secondary education data while secondary education includes only supper secondary data. Secondary education includes only lower secondary level for Tunisia, Algeria, Morocco, Mauritania, Philippines and Indonesia. In sub-Saharan Africa, secondary education reflects lower secondary data except in Botswana, Burkina Faso, Cameroon, Central African Republic, Ethiopia, Gambia, Guinea, Lesotho, Madagascar, Mauritius, Niger, Sao Tome and Principe and Seychelles, which include lower and upper secondary level data.
For the following countries, data only reflect public sector schools: In Latin America, Guyana and Dominican Republic; in Arab States, Morocco and Mauritania; in East Asia, Singapore, Philippines and Cambodia; and in sub-Saharan Africa, all countries except Mauritius, Sao Tome and Principe, Botswana, Gambia, Burkina Faso, Guinea and Niger.
Source: UIS database, 2015; UIS Survey on ICT in Education; UIS Regional Survey on Africa.
Lastly in sub-Saharan Africa, a lack of electricity in both primary and secondary schools remains a significant problem in the majority of countries where typically one third or fewer primary schools had electricity compared to one half or fewer secondary schools. ICT usage was most hindered in primary education where 10 per cent or fewer schools had electricity in Togo in 2014, Ethiopia, Guinea, Burundi,
96 95 92 91 90 89 88 8479 78
71
5443
24
99 99 99 9889
8188
m
60
34
68
0102030405060708090
100
Anguilla
Antig
ua and
Barbu
da
Arub
a
Bahamas
Barbados
British Virg
in Island
s
Caym
an Island
s
Cuba
Curaçao
Dominica
Grenada
Jamaica
Mon
tserrat
Saint K
itts a
nd Nevis
Saint Lucia
Saint V
incent/ G
renadine
s
Sint M
aarten
Trinidad and
Tob
ago
Turks a
nd Caicos Is.
Uruguay
El Salvado
r
Argentina
Paraguay
Brazil
Surin
ame
Costa Rica
Belize
Ecuado
r
Guyana
Panama
Vene
zuela
Dominican Rep
ublic
Nicaragua
Primary Secondary
Latin America and the Caribbean
95 9488
7967
58
35 32 32 31 31 29 26 23 22 20 19 15 14 14 13 12 10 10 10 9 8 8 5 4 3 3 2 2 0
97 9380
m m
53 50 50
82
4957
m
58 5442 46
22
57
3445
34 29
m 14m
2920 m m
m 00
102030405060708090
100
Mauritius
Seyche
lles
South Africa
Swaziland
Sao To
me and Principe
Botswana
Cabo
Verde
Nam
ibia
Rwanda
Equatoria
l Guine
a
Eritrea
Ghana
Côte d'Ivoire
Gam
bia
Zambia
Benin
Sene
gal
Guine
a-‐Bissau
Cameroo
n
Malaw
i
U. R
. Tanzania
Burkina Faso
Comoros
Lesotho
Ethiop
ia
Guine
a
Ethiop
ia
Togo
DR Con
go
Mali
Chad
Niger
Burund
i
Sierra Leo
ne
Madagascar
Ugand
a
Central A
frican Rep
ublic
Primary Lower Secondary
99 9787
77
2
99
83 80
197 7
99
6755
45
6
9099 94
36
97 9580
50
24
4
91
71 68
24
0102030405060708090
100
Egypt
Oman
Palestine
Qatar
Tunisia
Jordan
Algeria
Morocco
Djibou
ti
Mauritania
China, Hon
g Ko
ngSA
R Malaysia
New
Zealand
Repu
blic of K
orea
Singapore
Thailand
Philipp
ines
Indo
nesia
Lao PD
R
Cambo
dia
Myanm
ar
Maldives
Iran, Islamic Rep
.
Bhutan
Banglade
sh
India
Nep
al
Primary Secondary
South and West AsiaArab States East Asia and Pacific
sub-‐Saharan Africa
%

9
DR Congo, Madagascar, and Niger in 2013, Central African Republic, Mali and Sierra Leone in 2012, and in Uganda in 2011.
Internet connectivity in schools
To use various ICTs to their potential, access to the Internet is critical. However, Ministries of education often have little or no control over school Internet connectivity as this depends to a great extent on the level of development of the national telecommunications infrastructure and access to a reliable power supply (World Bank, 2010). In many developing countries, the absence of Internet can be attributed to a number of other factors, including difficult mountainous terrain, the unwillingness of Internet service providers (ISPs) to operate in unprofitable rural areas with low population density, and limited school budgets to pay for Internet services (ADB, 2012).
UIS collects data on the proportion of schools with Internet. However challenges remain to collect data on Internet type and speed. This data gap remains significant given that as of 2013, the Broadband Commission set the target of Broadband for All by 2020, an initiative that would favour the connectivity of all schools (Broadband Commission, 2013). Moreover, current data on Internet in schools includes those using Internet for teaching and learning as well as those schools where Internet is used solely by administration. Collecting data on the proportion of schools that have Internet specifically for pedagogical use by pupils and/ or teachers would be an important step in collecting Internet data, albeit this would be more difficult. Challenges however remain in several developing countries, especially in least developed economies where ICT policy development is lacking and infrastructure is poor resulting in the use of school census forms that do not reflect evolving policy needs that take into account ICT.
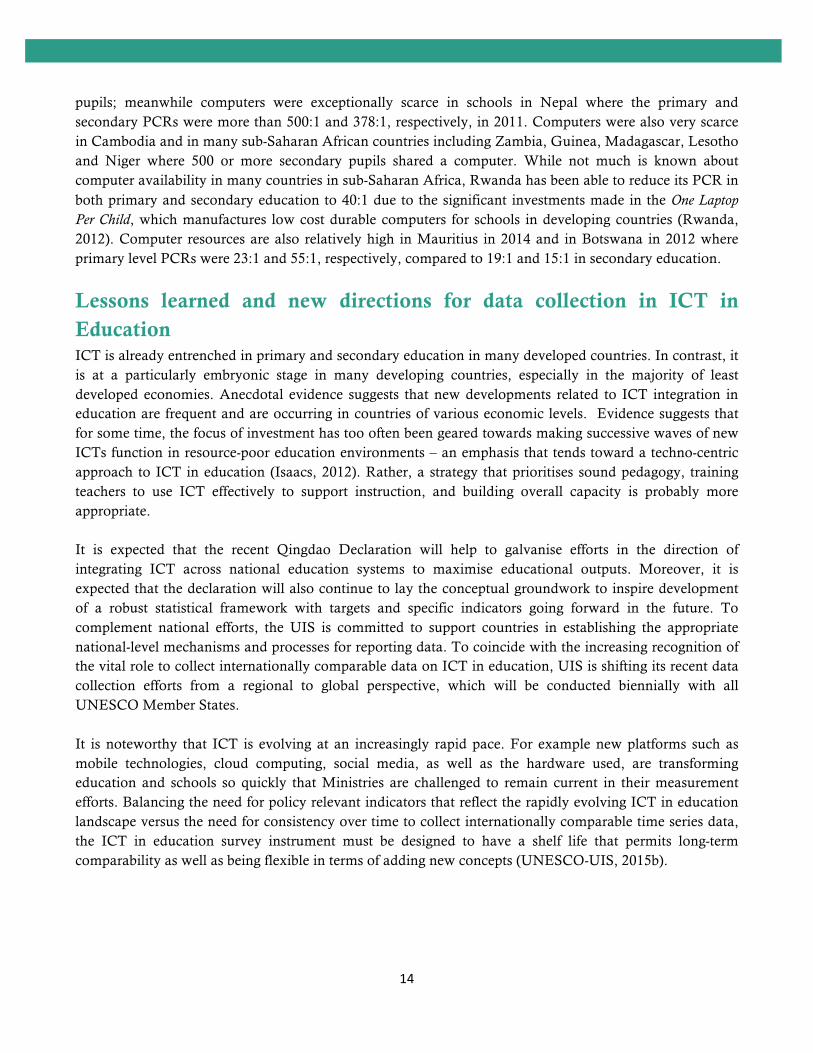
Figure 3 shows that electricity is a poor predictor for Internet in many countries. In fact in many countries
where electricity is universally available, Internet ranges from being present in all schools to less than 10 per cent. For instance in Palestine in 2012, Jordan, Oman and Qatar in 2011, and in Egypt in 2010, Internet connections were available in 30, 85, 77, 61 and 49 percent of schools, respectively.
In Central Asia, Internet was available in all schools in Armenia and in Georgia in 2012 and in 97 percent of schools in Kazakhstan in 2010. However, despite full electrification of schools, it was only available in less than a third of schools in Azerbaijan in 2012 given that is has yet to connect its rural area schools (UNESCO-UIS, 2014a). The absence of Internet is even greater in the highly mountainous country of Kyrgyzstan, where Internet was available in just 6 per cent of primary and secondary schools in 2012. In Mongolia, which has one of the lowest population densities in Asia, considerable progress has been made in that 91% of primary and secondary schools have been connected by 2012. Yet despite this positive trend, some schools have been known to voluntarily terminate Internet access due to high costs. However to mitigate this, the Ministry of Education, Culture and Science (MECS) has attempted to meet the Internet costs of schools from its central funds to ensure continued connectivity. In addition to school connections, Internet usage for formal schooling purposes is also furnished through community-based socio-development centres or ‘high-tech centres’ and through access to mobile sites (ADB, 2012).

10
Figure 3: Proportion of combined primary and secondary schools with electricity and Internet, 2014 or latest year available
Notes: See Statistical Tables for reference years. For the following countries, data only reflect public sector schools: In Central Asia, Azerbaijan; in East Asia and the Pacific, Cambodia and Singapore; in Latin America and the Caribbean, Barbados, Cayman Islands, Sint Maarten, Colombia, and Guatemala; in South and West Asia, Bhutan and Maldives; and in Madagascar and Sao Tome and Principe.
Source: UIS database, 2015. Internet availability also varies in other regions. It was universally available in high income countries in East Asia and the Pacific and in the Caribbean. It was also available in 97 per cent of schools in Uruguay in 2009, which implemented its well-known El Ceibal programme to connect all schools with Internet and provide all children in primary schools with laptop computers (Martinez, Diaz & Alonso, 2009; UNESCO-UIS, 2012). Meanwhile, Internet access remains a challenge in formal education in other countries in Latin America and the Caribbean being available in less than one quarter of schools. It was available in 24 per cent of schools in El Salvador, 22 per cent in Ecuador, and nine per cent in Paraguay in 2010, and six per cent of schools in Suriname in 2009. In Guatemala, a negligible proportion (0%) of schools also reported having Internet in 2009. In East Asia, Internet was only available in 7 per cent of schools in Cambodia where electricity is also greatly absent in schools. Similarly in some South and West Asian countries, and particularly in Sub-Saharan Africa, Internet remains a significant challenge. Internet was available in just 18 and 5 per cent of schools in Sri Lanka and Nepal, while it was present in a negligible proportion (near 0%) of schools in Guinea and Madagascar in 2013 and in Liberia in 2014. In Sao Tome and Principe the lack of Internet (i.e. 13 per cent) cannot be attributed to the lack of electricity as it was present in 89 per cent of its schools in 2013. Mauritius is an exception to the region as Internet was available in 95 per cent of its schools in 2014.
Computer Density as measured by the pupil (learner) to computer ratio To ensure that teaching and learning using computers and online information meets the needs of all pupils, a sufficient number of computers, i.e. computer density, must be established keeping pace with demand based on enrolment. Computer density can be measured using the pupil (learner) to computer ratio (PCR
m
91
99
8
97 95 95 9492 92 92
80
37
82
75
22
89
36
14
63
85
77
61
49
30
97
27
6
91 91
98
7
88
7168
61 6056
54
96
36
24
71
46
9 6
22
0
87
18
43
5
95
13
22
0 000
10
20
30
40
50
60
70
80
90
100
Jordan
Oman
Qatar
Egypt
Palestine
Armen
iaGeo
rgia
Kazakhstan
Azerbaijan
Kyrgyzstan
Mon
golia
Brun
ei Darussalam
China, Hon
g Ko
ng SAR
Repu
blic of K
orea
Singapore
Malaysia
Thailand
Cambo
dia
Anguilla
Arub
aBa
rbados
British Virg
in Island
sCaym
an Island
sSaint K
itts a
nd Nevis
Saint Lucia
Sint M
aarten
Antig
ua and
Barbu
daDo
minica
Saint V
incent/ G
renadine
sGrenada
Mon
tserrat
Trinidad and
Tob
ago
Turks a
nd Caicos Is.
Uruguay
Argentina
El Salvado
rCo
lombia
Brazil
Paraguay
Surin
ame
Ecuado
rGuatemala
Maldives
Iran, Islamic Rep
.Sri Lanka
Bhutan
Nep
al
Mauritius
Sao To
me/ Prin
cipe
Gam
bia
Guine
aLibe
riaMadagascar
Electricity Internet%
Central AsiaArab States East Asia and Pacific Latin America and the Caribbean South and West Asia sub-‐Saharan Africa

11
or LCR), which refers to the mean number of pupils sharing a single computer available for pedagogical use in national, aggregate education systems. While, the PCR sheds light on current infrastructure to support e-learning, national-level PCRs mask sub-national differences (i.e. digital divide) within a single country. PCR values are frequently low in urban centres indicating greater access, but high in rural and remote areas reflecting scarcity of resources. For example, research in China has shown there is twice the number of computers in urban primary education centres (14:1) than in rural centres (29:1) (Zeng et al., 2012). In contrast, computers are more available in rural areas in Tajikistan due to the policy to provide all schools with a laboratory with the same fixed number of devices regardless of enrolment, which has the effect of favouring pupils in small rural schools over large urban institutions (ADB, 2012). While the PCR indicator does not provide information on the intensity of computer usage, it may be considered as a proxy measure for the quality of computer-assisted instruction (CAI), since there is a relationship between PCR and individual learner time on task using computers. In other words, the lower the ratio, the more potential time each pupil has access to a computer. While some countries such as Uruguay aim at achieving 1:1 ratios across their education systems, the ratio in most countries is typically much greater. While some stakeholders have suggested that ratios around 2:1 or 3:1, which promote collaborative learning, are most effective, the number of learners sharing a single computer may be so high in many developing countries that time on task is too limited per pupil to allow a meaningful learning experience. In some countries, such as India, computers in schools are also frequently shared with the general community, further limiting access if scheduling is not oriented to prioritise pupils (India, 2012). To minimise existing shortages, alternative strategies may potentially improve the availability and management of computer-assisted instruction in schools. For instance, the use of multi-seat computers or networked PCs, where users simultaneously operate from a single central processing unit (CPU) and server while possessing their own individual monitors and keyboards, is one available option. Figure 4 shows the average number of pupils in combined primary and secondary schools that share a
single computer. Computer access is greatest in high income countries in Europe, East Asia, the Caribbean and the Gulf States. For example, PCRs were 6:1 in Japan in 2013, 6:1 in Czech Republic and 8:1 in Qatar in 2012, 4:1 in Singapore in 2011, 2:1 in Cayman Islands and 7:1 in United Arab Emirates in 2010, and 5:1 in the United Kingdom and Republic of Korea, and 4:1 in Barbados in 2009. The middle income country Georgia succeeded in reducing its PCR substantially from more than 200:1 in 2004 to 7:1 in 2012 as a result of spearheading the ambitious Deer Leap programme to ensure a computer in each school (GRID, 2014; UNESCO-UIS, 2014b).

12
Figure 4: Pupil (learner) to computer ratio in combined primary and secondary levels, 2014 or latest year available
Notes: See Statistical Tables for reference years. For the following countries, data only reflect public sector schools: in Central Asia, Azerbaijan; in East Asia and Pacific, China, Japan, Malaysia and Singapore; in Latin America and the Caribbean, Anguilla, Dominican Republic, Montserrat, Saint Lucia, and Trinidad and Tobago; in South and West Asia, Sri Lanka; and in sub-Saharan Africa, Botswana and Rwanda.
Source: UIS database, 2015.
At the other end of the range low income countries typically have very high PCRs reflecting scarce computer resources spread over a minority of schools. Available computers were overstretched in Yemen where 405 pupils on average shared a computer in 2012. Meanwhile in South and West Asia there were 500 or more pupils sharing a computer in Nepal in 2011, while in sub-Saharan Africa 500 or more pupils shared a computer in Guinea and Madagascar in 2013.
In most countries, according to Figure 5, PCRs decrease from primary to secondary levels of education
indicating greater access and reflecting the increasing importance of computer-assisted instruction in both education policy and official curriculum. Computer resources are most abundant in Western Europe and Central and Eastern Europe, where, PCRs were relatively low—typically 10:1 or less in most countries for
24 4
5 56 7 7 7 8 9 9 9 9
10 1012 13 13 13
14
17 17 17 18 18 18 18 1920 20 21
23 23
0
5
10
15
20
25
Caym
an Island
s
Barbados
Singapore
Repu
blic of K
orea
United Kingdo
m
Czech Re
public
Japan
United Arab Emira
tes
Geo
rgia
Qatar
Anguilla
China, Hon
g Ko
ng SAR
Ando
rra
Turks/ Caicos Is.
British Virg
in Is.
Trinidad and
Tob
ago
Oman
Malaysia
China
Colombia
Thailand
Jordan
Saint Lucia
Saint K
itts a
nd Nevis
Kazakhstan
Mon
golia
Dominica
Costa Rica
Chile
Argentina
Panama
Mauritius
Belarus
Ecuado
r
25 27 28 29 29 30 30 32 33 33 33 38 40 4048 52 56 56 57
71 75 7989
95 98110
117122136
0
20
40
60
80
100
120
140
Armen
ia
Cuba
Palestine
Mon
tserrat
Botswana
Saint V
incent/ G
renadine
s
Bosnia and
Herzegovina
Albania
Iran, Islamic Rep
.
El Salvado
r
Azerbaijan
Grenada
Brazil
Rwanda
Egypt
Maldives
Bolivia
Samoa
Kyrgyzstan
South Africa
Paraguay
Bhutan
India
Guatemala
Sri Lanka
Gam
bia
Ghana
Dominican Rep
ublic
Indo
nesia
Yemen
Nep
al
Guine
a
Madagascar
405 >500
Pupil (learne
r) to
com
puter ratio

13
all levels. In contrast computer access was somewhat of a challenge in Italy, Greece, Bulgaria, Romania and Turkey, and particularly so in primary education where the PCR was 15:1 or higher. Figure 5: Pupil (learner) to computer ratio in primary and secondary education by region, 2014 or latest year available
Notes: See Statistical Tables for reference years. Secondary data for Nicaragua, Philippines and Zambia reflects just lower secondary education. For the following countries, data only reflect public sector schools: Asia and the Pacific, China, Malaysia and Philippines; in Latin America and the Caribbean, Anguilla, Montserrat, Nicaragua, Saint Lucia, and Trinidad and Tobago; and in sub-Saharan Africa, Rwanda.
Source: UIS database, 2015.
The greater abundance of computers in secondary education is even more remarkable in many developing countries. For example in Latin America and the Caribbean PCRs in primary education in Grenada and Paraguay were 58:1 and 130:1, respectively, compared to 26:1 and 45:1 in secondary education in 2010. Similar patterns are observable in other regions. For example, in East Asia and Pacific, there were 412 pupils in primary education (412:1) on average sharing a computer in the Philippines in 2012 compared to 49 pupils in lower secondary education (49:1). Meanwhile in the Arab States 120 primary pupils shared a single computer in Egypt in 2010 compared to 25 pupils in secondary education. In South and West Asia, 83 primary pupils shared a computer in the Islamic Republic of Iran in 2012 compared to 21 secondary
m9 15 17 24
m9 10
2638
120
83
2 9 14 9 13
49
14 7 1224 25 21
020406080
100120140
Australia
China, Hon
g Ko
ngSA
R Thailand
Malaysia
China
Philipp
ines
Cambo
dia
Oman
Qatar
Jordan
Palestine
Egypt
Iran
Nep
al
Primary Combined secondary> 500 378
57 8 8 8
10 1012
1517
20
4
7 6 7 86
8 911
13
23
5 6 6 7 6 6
9
5
11 10
22
0
5
10
15
20
25
Estonia
Slovakia
Hungary
Latvia
Sloven
ia
Lithuania
Poland
Croatia
Bulgaria
Romania
Turkey
Primary Lower secondary Upper secondary
1 3 4 10 13 13 17 19 19 22 24 24 28 29 31 37 3846 50 55 58
74
130
m 2 3 7 4 620 23
15 13 144
27 2912 16
2336
1120 26
84
45
0
20
40
60
80
100
120
140
Uruguay
Caym
an Island
s
Barbados
Anguilla
British Virg
in Island
s
Turks a
nd Caicos Is.
Chile
Panama
Saint Lucia
Saint K
itts/ Nevis
Dominica
Trinidad/ T
obago
Cuba
Mon
tserrat
Costa Rica
Ecuado
r
Saint V
incent/ G
renadine
s
Brazil
Argentina
El Salvado
r
Grenada
Nicaragua
Paraguay
Primary Combined secondary
Latin America and the Caribbean
3 3 3 4 46 7 8 8 9 10
16 16
3 3 3
7
2
5 4 4 5 5 6
12
21
2 1
46
m
4 3 4 3
6 6
12
17
0
5
10
15
20
25
Denm
ark
Norway
Spain
Malta
Swed
en
Finland
Cyprus
Belgium
France
Austria
Portugal
Italy
Greece
Primary Lower secondary Upper secondary
23 40 5590
277
m
>500
m m m19 40 1554 51
158 145
240
>500 >500 >500 >500
050
100150200250300350400450500
Mauritius
Rwanda
Botswana
South Africa
Gam
bia
Sao To
me/
Principe
Zambia
Burkina Faso
Guine
a
Madagascar
Lesotho
Niger
Primary Combined secondary
sub-‐Saharan Africa
412 > 500
Western Europe Central and Eastern Europe
East Asia Arab StatesSouth and West Asia
14
pupils; meanwhile computers were exceptionally scarce in schools in Nepal where the primary and secondary PCRs were more than 500:1 and 378:1, respectively, in 2011. Computers were also very scarce in Cambodia and in many sub-Saharan African countries including Zambia, Guinea, Madagascar, Lesotho and Niger where 500 or more secondary pupils shared a computer. While not much is known about computer availability in many countries in sub-Saharan Africa, Rwanda has been able to reduce its PCR in both primary and secondary education to 40:1 due to the significant investments made in the One Laptop Per Child, which manufactures low cost durable computers for schools in developing countries (Rwanda, 2012). Computer resources are also relatively high in Mauritius in 2014 and in Botswana in 2012 where primary level PCRs were 23:1 and 55:1, respectively, compared to 19:1 and 15:1 in secondary education.
Lessons learned and new directions for data collection in ICT in Education ICT is already entrenched in primary and secondary education in many developed countries. In contrast, it is at a particularly embryonic stage in many developing countries, especially in the majority of least developed economies. Anecdotal evidence suggests that new developments related to ICT integration in education are frequent and are occurring in countries of various economic levels. Evidence suggests that for some time, the focus of investment has too often been geared towards making successive waves of new ICTs function in resource-poor education environments – an emphasis that tends toward a techno-centric approach to ICT in education (Isaacs, 2012). Rather, a strategy that prioritises sound pedagogy, training teachers to use ICT effectively to support instruction, and building overall capacity is probably more appropriate. It is expected that the recent Qingdao Declaration will help to galvanise efforts in the direction of integrating ICT across national education systems to maximise educational outputs. Moreover, it is expected that the declaration will also continue to lay the conceptual groundwork to inspire development of a robust statistical framework with targets and specific indicators going forward in the future. To complement national efforts, the UIS is committed to support countries in establishing the appropriate national-level mechanisms and processes for reporting data. To coincide with the increasing recognition of the vital role to collect internationally comparable data on ICT in education, UIS is shifting its recent data collection efforts from a regional to global perspective, which will be conducted biennially with all UNESCO Member States. It is noteworthy that ICT is evolving at an increasingly rapid pace. For example new platforms such as mobile technologies, cloud computing, social media, as well as the hardware used, are transforming education and schools so quickly that Ministries are challenged to remain current in their measurement efforts. Balancing the need for policy relevant indicators that reflect the rapidly evolving ICT in education landscape versus the need for consistency over time to collect internationally comparable time series data, the ICT in education survey instrument must be designed to have a shelf life that permits long-term comparability as well as being flexible in terms of adding new concepts (UNESCO-UIS, 2015b).

15
In the past, the easiest data to collect have been related to school-level ICT infrastructure given that relevant items are contained in a number of countries’ school census forms2. Most common are items related to school electrification and Internet. Numbers of computers in schools are also relatively easier to collect allowing the calculation of pupil-computer ratios. Challenges however do remain. While electrification data have been more straightforward, collecting Internet data disaggregated by type and/ or speed has difficult. Given the work of the Broadband Commission to promote the importance of Broadband within the international developmental agenda, collecting proportions of schools with broadband Internet will increasingly be important. However such data still do not complete the picture since regardless of Internet type, advertised Internet speeds are frequently different from reality. It is most likely too soon to collect upload and download speed in Kbit/second, nevertheless these data should be a future consideration in UIS data collection efforts. Another data collection challenge related to Internet has been collecting information about who is using Internet in schools. In many developing countries, it is unknown if the presence of Internet is intended for pedagogical use, administrative use, or both and while school census forms frequently do not shed light on this, it will be increasingly relevant. The same issue applies to counting computers whereby in many developing countries it is not known to whom they are allocated. To get around this problem, UIS estimates numbers of computers for pedagogical purposes when disaggregated data are missing. Evidence from other countries with disaggregated data show there is a direct relationship between the income level of a country and the proportion of computers allocated to teaching and learning. Therefore using information related to national income level, total computers for pedagogical purposes are estimated and in turn used to calculate pupil-computer ratios where data are missing. In the new global survey, more detailed data will be collected to help shape policymaking as ICT expands across education systems. For example additional computer data disaggregated by device type (e.g. desktop, laptop, and tablet) will be gathered to give more information on the emergence of mobile learning in schools. Meanwhile at the school level more data will be sought including those on deployment patterns (i.e. where computers are located in schools—be it in classrooms, computer labs or in libraries). Again this will be important as mobile learning paradigms emerge and the traditional computer lab decreases to be regarded as the best way to offer ICT to students. Data on pupils enrolled in schools with ICT, and teachers trained and/or using ICT have been more difficult to collect and is often due to the fact that different agencies are involved maintaining data on institutions, enrolments and teachers, respectively. While better coordination at the national level between agencies would greatly benefit the overall data collection process, additional capacity-building for countries also remains an important part of the solution. Finally, understanding that ICT resource inputs alone are inadequate for understanding ICT usage and their impact on student outcomes, additional data on usage are required – more specifically data on how, when, how much, and why teachers and pupils use ICT. As an outcome of a Technical Advisory Panel (TAP) meeting in late 2014—and given the limitations of administrative surveys—UIS recommends that
2 Since schools can have more than one educational (ISCED level), schools are double counted when they have more than one level. Hence, school infrastructure indicators are based on this double counting.

16
school-level surveys administered to stratified random samples of principals, teachers and students separately could greatly help in closing this data gap (UNESCO-UIS, 2015b). Also of particular interest there is a growing interest in open educational resources (OER) and how to measure their usage in schools. However it is also recognised that OER, as a concept, is difficult to define, nor is it well understood by many individuals. Currently the UIS survey contains an item on whether or not schools have OER; however perhaps rather than a single indicator, a cluster of indicators is required to unpack the knowledge sharing and knowledge creation elements of OER (UNESCO-UIS, 2015b). Finally, there is a growing recognition of the need for data related to gender and ICT. In other words, indicators shedding light on the situation of girls and women such as those which can be disaggregated by sex are increasingly in demand. While the UIS currently collects sex-disaggregated data measuring both pupils’ participation rates in programmes offering different types of ICT-assisted instruction, as well as for teachers and their training or use of ICT, additional means to measure gender and ICT should be considered (UNESCO-UIS, 2015b).

17
References:
Asian Development Bank (ADB) (2012). ICT in Education in Central and West Asia. Manila: ADB.
Broadband Commission for Digital Development (2013). Technology, broadband and education: Advancing the Education for All Agenda, A report by the Working Group on Education. Retrieved at: http://www.broadbandcommission.org/work/working-groups/education.aspx.
GRID (Global Resource and Information Directory) (2014). Georgia: Country Profile, Retrieved at: http://www.fosigrid.org/europe/georgia-europe.
India (2012). National policy on information and communication technology (ICT) in school education. New Delhi: Department of School Education and Literacy Ministry of Human Resource Development , Government of India.
Isaacs, S. (2012). Turning on mobile learning in Africa and the Middle East: Illustrative Initiatives and Policy Implications (UNESCO Working Paper Series on Mobile Learning). Paris: UNESCO.
Jones, R. (2003). Local and national ICT policies. In: R. Kozma (ed.), Technology, Innovation, and Educational Change: A Global Perspective. pp. 163-194.
Kozma, R. (ed.) (2003). Technology, Innovation, and Educational Change: A Global Perspective. Eugene: International Society for Technology in Education.
Martínez, A.L., Díaz, D. & Alonso, S. (2009). Primer informe nacional de monitoreo y evaluación de impacto social del Plan Ceibal, 2009. Montevideo: Área de Monitoreo y Evaluación de Impacto Social del Plan Ceibal.
Mudenda, C., D. Johnson, L. Parks and G. van Stam (2014). Power instability in rural Zambia, case Macha. Retrieved at: http://www.cs.ucsb.edu/~davidj/Files/power_zambia.pdf.
Organization for Economic Co-operation and Development (2015). Students, computers and learning. Paris: OECD Publishing.
Practical Action (2013). Poor people’s energy outlook 2013: Energy for community services. Rugby, UK: Practical Action Publishing.
Partnership on Measuring ICT for Development (2011). Measuring the WSIS Targets: A Statistical Framework. Geneva: International Telecommunication Union (ITU).
Rwanda (2012). Rwanda ICT Sector Profile – 2012: Measuring ICT sector performance and tracking ICT for Development (ICT4D) towards Rwanda Socio-Economic Transformation. Kigali: Ministry of Youth and ICT.
UNESCO (2015a). Incheon Declaration: Education 2030: Towards inclusive and equitable quality education and lifelong learning for all, 19-22 May 2015 Incheon, Republic of Korea. Retrieved at: http://en.unesco.org/world-education-forum-2015/incheon-declaration.
UNESCO (2015b). Qingdao Declaration: International Conference on ICT and Post-2015 Education, Seize digital opportunities. Lead education transformation, 23-25 May 2015, Qingdao City, the People’s Republic of China. Retrieved at: http://unesdoc.unesco.org/images/0023/002333/233352E.pdf.

18
UNESCO-UIL (2014). Harnessing the potential of ICTs for literacy teaching and learning: Effective literacy and numeracy programmes using radio, TV, mobile phones, tablets, and computers. Hamburg: UNESCO Institute for Lifelong Learning.
UNESCO-UIS (2015a). Information and communication technology (ICT) in education in sub-Saharan Africa: A comparative analysis of basic e-readiness in schools. Montreal: UNESCO Institute for Statistics.
UNESCO-UIS (2015b). Information and communication technology (ICT) in education statistics: A technical advisory panel (TAP) meeting to advance the global data collection in the post-2015 context, Paris, France, 9-10 December 2014. Retrieved at: http://www.uis.unesco.org/StatisticalCapacityBuilding/Workshop%20Documents/Communication%20workshop%20dox/Paris%202014/Concept%20Note_TAP_Paris_2014.pdf
UNESCO-UIS (2014a). Information and communication technology (ICT) in Asia: A comparative analysis of ICT integration and e-readiness in schools across Asia. Montreal: UNESCO Institute for Statistics.
UNESCO-UIS (2014b). Target 2: Connect all secondary schools and primary schools with ICTs. In Final WSIS targets review: Achievements, challenges and the way forward (Partnership on Measuring ICT for Development) (ed.). Geneva: ITU.
UNESCO-UIS (2013). Information and communication technology (ICT) in five Arab States: A comparative analysis of ICT integration and e-readiness in schools in Egypt, Jordan, Oman, Palestine and Qatar. Montreal: UNESCO Institute for Statistics.
UNESCO-UIS (2012). ICT in education in Latin America and the Caribbean: A regional analysis of ICT integration and e-readiness. Montreal: UNESCO Institute for Statistics.
UNESCO-UIS (2009). Guide to measuring information and communication technologies (ICT) in education. Technical paper No. 2. Montreal: UNESCO Institute for Statistics.
World Bank (2010). Information and Communication Technology for Education in India and South Asia, Volume 1, Extended Summary, infoDev and Price Waterhouse Coopers.
Zeng, H, R. Huang, Y. Zhao and J. Zhang. (2012). ICT and ODL in education for rural development: Current situation and good practices in China. Beijing: UNESCO International Research and Training Centre for Rural Education (INRULED)/ Beijing Normal University, R&D Center for Knowledge Engineering (BNU-KSEI).