Embed Size (px)
Citation preview

1. Utility_Info_
Version 4.00
Utility Name
Assigned EB Number EB-2015-0103
Name and Title
Phone Number 905-532-4640
Email Address [email protected]
Date 24-Feb-15
Last COS Re-based Year 2013
Note: Drop-down lists are shaded blue; Input cells are shaded green.
Tom Barrett, Manager, Rates Applications
PowerStream Inc.
ICM True-Up Model
This Workbook Model is protected by copyright and is being made available to you solely for the purpose of filing your application. You may use and copy this model for that purpose, and provide a copy of this model to any person that is advising or assisting you in that regard. Except as indicated above, any copying, reproduction, publication, sale, adaptation, translation, modification, reverse engineering or other use or dissemination of this model without the express written consent of the Ontario Energy Board is prohibited. If you provide a copy of this model to a person that is advising or assisting you in preparing the application or reviewing your draft rate order, you must ensure that the person understands and agrees to the restrictions noted above. While this model has been provided in Excel format and is required to be filed with the applications, the onus remains on the applicant to ensure the accuracy of the data and the results. The use of any models and spreadsheets does not automatically imply Board approval. The onus is on the distributor to prepare, document and support its application. Board-issued Excel models and spreadsheets are offered to assist parties in providing the necessary information so as to facilitate an expeditious review of an application. The onus remains on the applicant to ensure the accuracy of the data and the results.

2. ICM_Costs
2014
Sheet 2: ICM Capital Cost Data Audited Actual
1 Capital CostsAsset Type
ICP 1 UNDERGROUND CABLE REHABILITATION Asset type must be selected to enable calculations Audited ActualICP 1.1 Poles 24,226
ICP 1.2 Overhead Conductor 19,823
ICP 1.3 Underground Conduit 2,305,442
ICP 1.4 Underground Conductor 723,816
ICP 1.5 Underground Injected Cable 3,890,145
ICP 1.6 Underground Transformers 49,234
ICP 1.7 Overhead Transformers 393
ICP 1.8 Overhead Services 3,551
ICP 1.9
ICP 1.10
Total Underground Cable Rehabilitation 7,016,630$
Asset TypeICP 2 SYSTEM RENEWAL - POLE REPLACEMENTS
Audited ActualICP 2.1. Poles 961,466
ICP 2.2 Overhead Conductor 406,931
ICP 2.3 Underground Conductor 56,172
ICP 2.4 Overhead Transformers 117,810
ICP 2.5 Underground Transformers 12,990
ICP 2.6 Overhead Services 79,026
ICP 2.7 Underground Conduit 19,646
ICP 2.8 System Supervisory Equipment 175
ICP 2.9 Distribution Station Equipment - Normally Primary below 50 kV 146
ICP 2.10 Underground Injected Cable 51
Total System Renewal - Pole Replacements 1,654,412$
Asset TypeICP 3 SYSTEM RENEWAL - STATION REPLACEMENTS Audited Actual
ICP 3.1 Poles 25,605
ICP 3.2 Overhead Conductor 79,225
ICP 3.3 RTU's 79,025
ICP 3.4 Underground Conductor 3,329
ICP 3.5 Underground Transformers 74
ICP 3.6 Overhead Services 509
ICP 3.7 System Supervisory Equipment 320
ICP 3.8 Distribution Station Equipment - Normally Primary below 50 kV 9,923
ICP 3.9 Transformer Station Equipment - Normally Primary above 50 kV 125,164
ICP 3.10
Total System Renewal - Station Replacements 323,174$
Asset Type
ICP 4 SYSTEM RENEWAL - SWITCHGEAR & TRANFORMER REPLACEMENTS Audited Actual
ICP 4.1 Poles 9,421
ICM True-Up Model for Electricity Distributors

2. ICM_Costs
ICP 4.2 Overhead Conductor 2,502
ICP 4.3 Underground Conduit 186,340
ICP 4.4 Underground Conductor 925,519
ICP 4.5 Overhead Transformers 12
ICP 4.6 Underground Transformers 165,200
ICP 4.7 Overhead Services 23,764
ICP 4.8 RTU's -7,819
ICP 4.9 Distribution Station Equipment - Normally Primary below 50 kV 2,217
ICP 4.10 Land Rights 19
Total System Renewal - Switchgear & Transformer ReplacementS 1,307,175$
Asset TypeICP 5 SYSTEM CAPACITY RELIEF Audited Actual
ICP 5.1 Poles 285,853
ICP 5.2 Overhead Conductor 193,612
ICP 5.3 Underground Conduit 87,407
ICP 5.4 Underground Conductor 75,667
ICP 5.5 Overhead Transformers 10,496
ICP 5.6 Overhead Services -470
ICP 5.7 RTU's 2,324
ICP 5.8
ICP 5.9
ICP 5.10
Total System Capacity Relief 654,890$
Total Capital Costs Related to Incremental Capital Projects (ICP) 10,956,281$
Asset Type
OTHER CAPITAL COST Audited Actual
Total Other Capital Costs -$
Total ICM Capital Costs 10,956,281$
2 Aggregated ICM Costs by Category2.1 Capital Account
2.1.1 Poles 1830 1,306,572$
2.1.2 Overhead Conductor 1835 702,093$
2.1.3 Underground Conduit 1840 2,598,835$
2.1.4 Underground Conductor 1845 1,784,503$
2.1.5 Underground Injected Cable 1846 3,890,196$
2.1.6 Overhead Transformers 1849 128,712$
2.1.7 Underground Transformers 1850 227,498$
2.1.8 Overhead Services 1855 106,380$
2.1.9 RTU's 1981 73,531$
2.1.10 System Supervisory Equipment 1980 494$
2.1.11 Distribution Station Equipment - Normally Primary below 50 kV 1820 12,286$
2.1.12 Transformer Station Equipment - Normally Primary above 50 kV 1815 125,164$
2.1.13 Land Rights 1612 19$
2.1.14
Total Capital Costs 10,956,281$
A
B
C

3. Cost_of_Service_Parameters
Sheet 3: Parameters and Rates
2014Cost of Capital
Capital StructureDeemed Short-term Debt Capitalization 4.0%Deemed Long-term Debt Capitalization 56.0%Deemed Equity Capitalization 40.0%Preferred Shares
Total 100.0%
Cost of Capital ParametersDeemed Short-term Debt Rate 2.08%Long-term Debt Rate (actual/embedded/deemed)1 4.15%Target Return on Equity (ROE) 8.93%Return on Preferred Shares
WACC 5.98%
Working Capital AllowanceWorking Capital Allowance Rate 13.0%(% of the sum of Cost of Power + controllable expenses)
Taxes/PILsAggregate Corporate Income Tax Rate 26.00%Capital Tax (until July 1st, 2010) 0.00%
ICM True-Up Model for Electricity Distributors

3. Cost_of_Service_Parameters
Depreciation Rates Account(expressed as expected useful life in years)
Poles - years 1830 45 - rate (%) 2.22%Overhead Conductor - years 1835 40 - rate (%) 2.50%Underground Conduit - years 1840 60 - rate (%) 1.67%Underground Conductor - years 1845 45 - rate (%) 2.22%U/G Injected Cable - years 1846 20 - rate (%) 5.00%Overhead Transformers - years 1849 40 - rate (%) 2.50%Underground Transformers - years 1850 30 - rate (%) 3.33%OH Services - years 1855 40 - rate (%) 2.50%RTU's - years 1981 15 - rate (%) 6.67%System Supervisory Equipment - years 1980 15 - rate (%) 6.67%Distribution Station Equipment - years 1820 30 - rate (%) 3.33%Transformer Station Equipment - years 1815 40 - rate (%) 2.50%Land Rights - years 1612 - no depreciation (ECE) - rate (%) 0.00%

3. Cost_of_Service_Parameters
CCA RatesPoles - CCA Class 47Pole - CCA Rate 8%
Overhead Conductor - CCA Class 47Overhead Conductor - CCA Rate 8%
Underground Conduit - CCA Class 47Underground Conduit - CCA Rate 8%
Underground Conductor - CCA Class 47Underground Conductor - CCA Rate 8%
U/G Injected Cable - CCA Class 47U/G Injected Cable - CCA Rate 8%
Overhead Transformers - CCA Class 47Overhead Transformers - CCA Rate 8%
Underground Transformers - CCA Class 47Underground Transformers - CCA Rate 8%
OH Services - CCA Class 47OH Services - CCA Rate 8%
RTU's - CCA Class 8RUT's - CCA Rate 20%
System Supervisory Equipment - CCA Class 8System Supervisory Equipment - CCA Rate 20%
Distribution Station Equipment - CCA Class 47Distribution Station Equipment - CCA Rate 8%
Transformer Station Equipment - CCA Class 47Transformer Station Equipment - CCA Rate 8%
Land Rights - CCA ClassLand Rights - CCA Rate
Assumptions1 Fiscal calendar year (January 1 to December 31) used.3 Amortization is done on a striaght line basis and no "half-year" rule applied.

4. ICM_Assets_and_Rate_Base
Sheet 4: ICM Assets - Net Book Value2014
Net Fixed Assets - Poles
Gross Book ValueOpening BalanceCapital Additions during year (from ICM Costs) 1,306,572$ Retirements/Removals (if applicable)Closing Balance 1,306,572$
Accumulated DepreciationOpening BalanceAmortization expense during year 29,035-$ Retirements/Removals (if applicable)Closing Balance 29,035-$
Net Book ValueOpening Balance -$ Closing Balance 1,277,537$ Incremental CAPEX 1,277,537$
Net Fixed Assets - Overhead Conductor
Gross Book ValueOpening BalanceCapital Additions during year (from ICM Costs) 702,093$ Retirements/Removals (if applicable)Closing Balance 702,093$
Accumulated DepreciationOpening BalanceAmortization expense during year 17,552-$ Retirements/Removals (if applicable)Closing Balance 17,552-$
ICM True-Up Model for Electricity Distributors

4. ICM_Assets_and_Rate_Base
Net Book ValueOpening Balance -$ Closing Balance 684,541$ Incremental CAPEX 684,541$
Net Fixed Assets - Underground Conduit
Gross Book ValueOpening BalanceCapital Additions during year (from ICM Costs) 2,598,835$ Retirements/Removals (if applicable)Closing Balance 2,598,835$
Accumulated DepreciationOpening BalanceAmortization expense during year 43,314-$ Retirements/Removals (if applicable)Closing Balance 43,314-$
Net Book ValueOpening Balance -$ Closing Balance 2,555,521$ Incremental CAPEX 2,555,521$
Net Fixed Assets - Underground Conductor
Gross Book ValueOpening BalanceCapital Additions during year (from ICM Costs) 1,784,503$ Retirements/Removals (if applicable)Closing Balance 1,784,503$
Accumulated DepreciationOpening BalanceAmortization expense during year 39,656-$ Retirements/Removals (if applicable)Closing Balance 39,656-$
Net Book ValueOpening Balance -$ Closing Balance 1,744,847$ Incremental CAPEX 1,744,847$
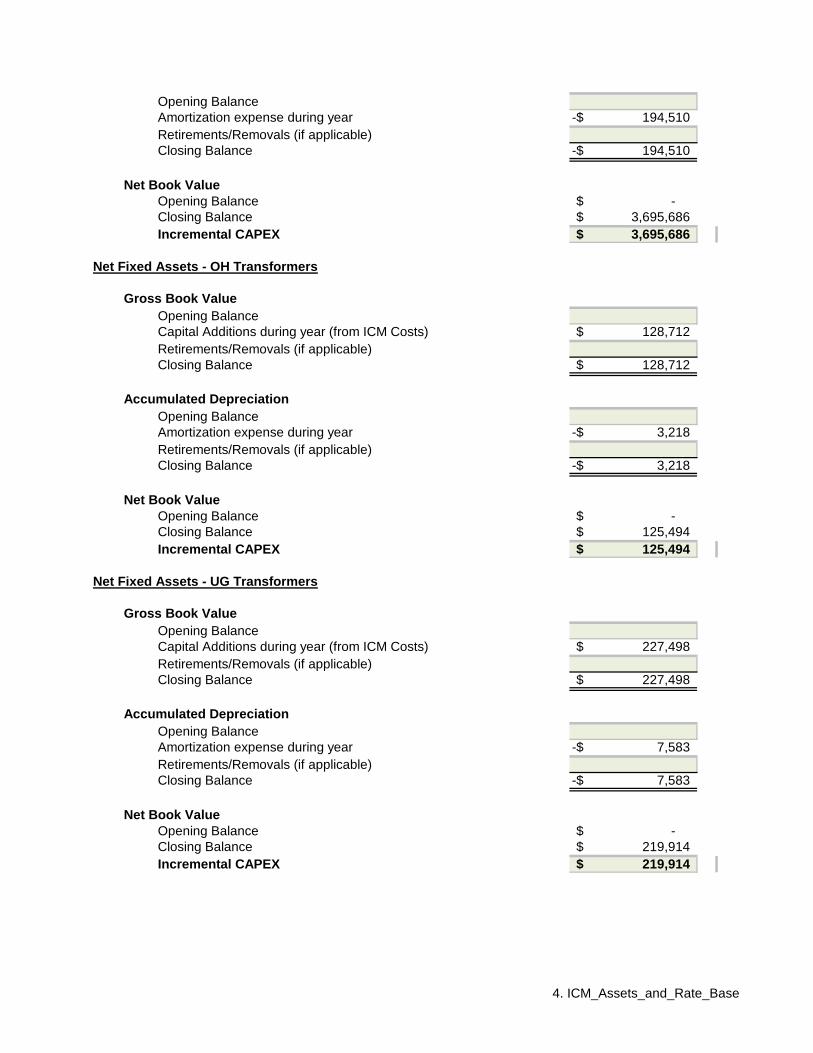
Net Fixed Assets - U/G Injected Cable
Gross Book ValueOpening BalanceCapital Additions during year (from ICM Costs) 3,890,196$ Retirements/Removals (if applicable)Closing Balance 3,890,196$
Accumulated Depreciation
4. ICM_Assets_and_Rate_Base
Opening BalanceAmortization expense during year 194,510-$ Retirements/Removals (if applicable)Closing Balance 194,510-$
Net Book ValueOpening Balance -$ Closing Balance 3,695,686$ Incremental CAPEX 3,695,686$
Net Fixed Assets - OH Transformers
Gross Book ValueOpening BalanceCapital Additions during year (from ICM Costs) 128,712$ Retirements/Removals (if applicable)Closing Balance 128,712$
Accumulated DepreciationOpening BalanceAmortization expense during year 3,218-$ Retirements/Removals (if applicable)Closing Balance 3,218-$
Net Book ValueOpening Balance -$ Closing Balance 125,494$ Incremental CAPEX 125,494$
Net Fixed Assets - UG Transformers
Gross Book ValueOpening BalanceCapital Additions during year (from ICM Costs) 227,498$ Retirements/Removals (if applicable)Closing Balance 227,498$
Accumulated DepreciationOpening BalanceAmortization expense during year 7,583-$ Retirements/Removals (if applicable)Closing Balance 7,583-$
Net Book ValueOpening Balance -$ Closing Balance 219,914$ Incremental CAPEX 219,914$
4. ICM_Assets_and_Rate_Base
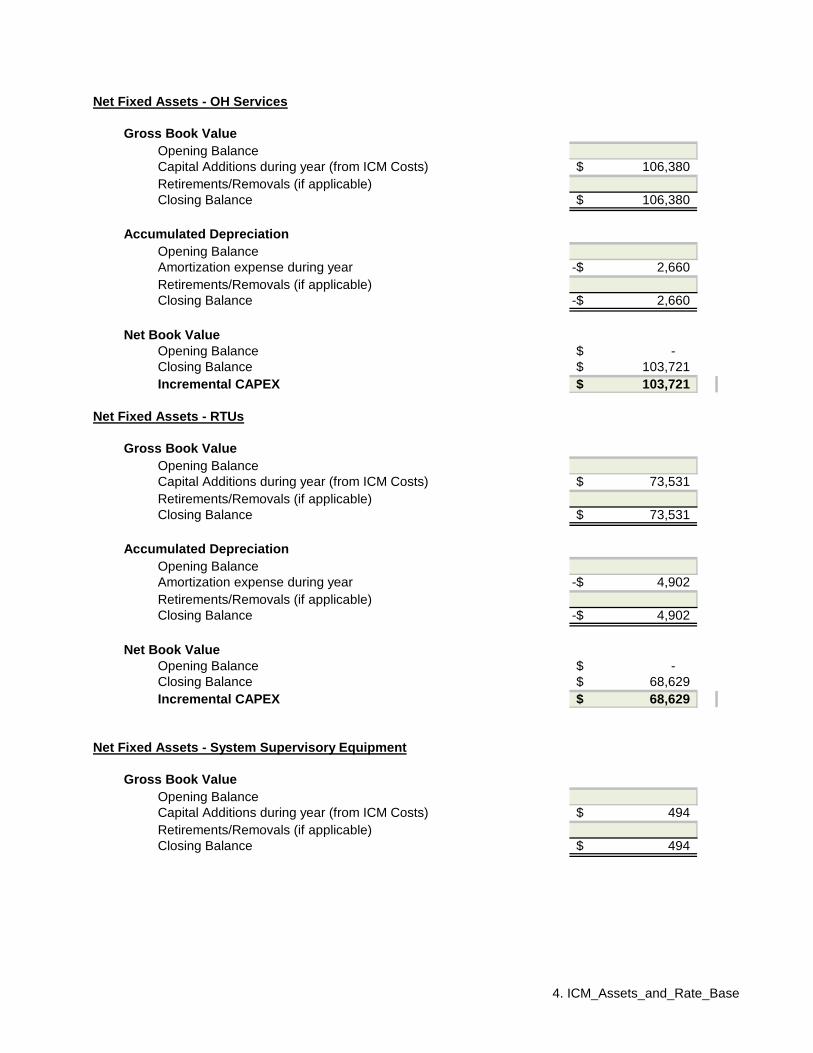
Net Fixed Assets - OH Services
Gross Book ValueOpening BalanceCapital Additions during year (from ICM Costs) 106,380$ Retirements/Removals (if applicable)Closing Balance 106,380$
Accumulated DepreciationOpening BalanceAmortization expense during year 2,660-$ Retirements/Removals (if applicable)Closing Balance 2,660-$
Net Book ValueOpening Balance -$ Closing Balance 103,721$ Incremental CAPEX 103,721$
Net Fixed Assets - RTUs
Gross Book ValueOpening BalanceCapital Additions during year (from ICM Costs) 73,531$ Retirements/Removals (if applicable)Closing Balance 73,531$
Accumulated DepreciationOpening BalanceAmortization expense during year 4,902-$ Retirements/Removals (if applicable)Closing Balance 4,902-$
Net Book ValueOpening Balance -$ Closing Balance 68,629$ Incremental CAPEX 68,629$
Net Fixed Assets - System Supervisory Equipment
Gross Book ValueOpening BalanceCapital Additions during year (from ICM Costs) 494$ Retirements/Removals (if applicable)Closing Balance 494$

4. ICM_Assets_and_Rate_Base
Accumulated DepreciationOpening BalanceAmortization expense during year 33-$ Retirements/Removals (if applicable)Closing Balance 33-$
Net Book ValueOpening Balance -$ Closing Balance 461$ Incremental CAPEX 461$
Net Fixed Assets - Distribution Station Equipment
Gross Book ValueOpening BalanceCapital Additions during year (from ICM Costs) 12,286$ Retirements/Removals (if applicable)Closing Balance 12,286$
Accumulated DepreciationOpening BalanceAmortization expense during year 410-$ Retirements/Removals (if applicable)Closing Balance 410-$
Net Book ValueOpening Balance -$ Closing Balance 11,876$ Incremental CAPEX 11,876$
Net Fixed Assets - Transformer Station Equipment
Gross Book ValueOpening BalanceCapital Additions during year (from ICM Costs) 125,164$ Retirements/Removals (if applicable)Closing Balance 125,164$
Accumulated DepreciationOpening BalanceAmortization expense during year 3,129-$ Retirements/Removals (if applicable)Closing Balance 3,129-$
Net Book ValueOpening Balance -$ Closing Balance 122,034$ Incremental CAPEX 122,034$

4. ICM_Assets_and_Rate_Base
Net Fixed Assets - Land Rights
Gross Book ValueOpening BalanceCapital Additions during year (from ICM Costs) 19$ Retirements/Removals (if applicable)Closing Balance 19$
Accumulated DepreciationOpening BalanceAmortization expense during year -$ Retirements/Removals (if applicable)Closing Balance -$
Net Book ValueOpening Balance -$ Closing Balance 19$ Incremental CAPEX 19$
Additions 10,956,281$ #Incremental CAPEX 10,610,281$ #Total Amortization 346,001-$ #

5. UCC_Calculation
Sheet 6: CCA For PILs Calculation
UCC/Class 47 2014Audited Actual
Opening UCC -$ Capital Additions 10,882,256$ Retirements/Removals (if applicable)UCC Full Year 10,882,256$
CCA Rate Class 47CCA Rate 8%CCA 870,580$ Closing UCC 10,011,676$
UCC/Class 8 2014Audited Actual
Opening UCC -$ Capital Additions RTU's 74,025$ Retirements/Removals (if applicable)UCC Full Year 74,025$
CCA Rate Class 8CCA Rate 20%CCA 14,805$ Closing UCC 59,220$
ICM True-Up Model for Electricity Distributors

Sheet 6: Incremental Capital Adjustment
Return on Rate BaseIncremental Capital CAPEX 10,956,281$ BDepreciation Expense 346,001$ CIncremental Capital CAPEX to be included in Rate Base 10,610,281$ D = B - C
Deemed ShortTerm Debt % 4.0% E 424,411$ G = D * EDeemed Long Term Debt % 56.0% F 5,941,757$ H = D * F
Short Term Interest 2.08% I 8,828$ K = G * ILong Term Interest 4.15% J 246,583$ L = H * J
Return on Rate Base - Interest 255,411$ M = K + L
Deemed Equity % 40.0% N 4,244,112$ P = D * N
Return on Rate Base -Equity 8.93% O 378,999$ Q = P * O
Return on Rate Base - Total 634,410$ R = M + Q
Amortization Expense
Amortization Expense - Incremental C 346,001$ S
Grossed up PIL's
Regulatory Taxable Income O 378,999$ T
Add Back Amortization Expense S 346,001$ U
Deduct CCA 885,386$ V
Incremental Taxable Income 160,386-$ W = T + U - V
Current Tax Rate (F1.1 Z-Factor Tax Changes) 26.0% X
PIL's Before Gross Up 41,700-$ Y = W * X
Incremental Grossed Up PIL's 56,352-$ Z = Y / ( 1 - X )
Ontario Capital TaxIncremental Capital CAPEX 10,956,281$ AA
Less : Available Capital Exemption (if any) -$ AB
Incremental Capital CAPEX subject to OCT 10,956,281$ AC = AA - AB
Ontario Capital Tax Rate (F1.1 Z-Factor Tax Changes) 0.000% AD
Incremental Ontario Capital Tax -$ AE = AC * AD
Incremental Revenue RequirementReturn on Rate Base - Total Q 634,410$ AFAmortization Expense - Total S 346,001$ AGIncremental Grossed Up PIL's Z 56,352-$ AHIncremental Ontario Capital Tax AE -$ AI
Incremental Revenue Requirement 924,059$ AJ = AF + AG + AH + AI

Sheet 7: ICM Funding Adder Revenues
Account 1511 - Sub-account ICM Funding Adder Revenues
Prescribed Interest Rates
Approved Deferral and Variance
Accounts
CWIP Date Year Quarter Opening Balance (Principal)
Funding Adder Revenues
Interest Rate Interest
Principal &Interest(Cumm.)
Board Approved ICM Funding
Adder
Board Approved ICM Funding
Adder (Cumm.)
2006 Q1 Jan-14 2014 Q1 -$ -$ 1.47% -$ -$ -$ -$ 2006 Q2 4.14% 4.68% Feb-14 2014 Q1 -$ -$ 1.47% -$ -$ -$ -$ 2006 Q3 4.59% 5.05% Mar-14 2014 Q1 -$ 81,633.07$ 1.47% -$ 81,633.07$ 83,403.75$ 83,403.75$ 2006 Q4 4.59% 4.72% Apr-14 2014 Q2 81,633.07$ 79,489.14$ 1.47% 100.00$ 161,222.21$ 83,403.75$ 166,807.50$ 2007 Q1 4.59% 4.72% May-14 2014 Q2 161,122.21$ 101,852.75$ 1.47% 197.37$ 263,272.33$ 83,403.75$ 250,211.24$ 2007 Q2 4.59% 4.72% Jun-14 2014 Q2 262,974.96$ 88,915.12$ 1.47% 322.14$ 352,509.59$ 83,403.75$ 333,614.99$ 2007 Q3 4.59% 5.18% Jul-14 2014 Q3 351,890.08$ 96,907.28$ 1.47% 431.07$ 449,847.94$ 83,403.75$ 417,018.74$ 2007 Q4 5.14% 5.18% Aug-14 2014 Q3 448,797.36$ 102,961.39$ 1.47% 549.78$ 553,359.11$ 83,403.75$ 500,422.49$ 2008 Q1 5.14% 5.18% Sep-14 2014 Q3 551,758.75$ 98,095.57$ 1.47% 675.90$ 652,130.58$ 83,403.75$ 583,826.24$ 2008 Q2 4.08% 5.18% Oct-14 2014 Q4 649,854.32$ 93,325.99$ 1.47% 796.07$ 746,252.64$ 83,403.75$ 667,229.98$ 2008 Q3 3.35% 5.43% Nov-14 2014 Q4 743,180.31$ 87,338.40$ 1.47% 910.40$ 834,501.44$ 83,403.75$ 750,633.73$ 2008 Q4 3.35% 5.43% Dec-14 2014 Q4 830,518.71$ 96,981.68$ 1.47% 1,017.39$ 932,500.51$ 83,403.75$ 834,037.48$ 2009 Q1 2.45% 6.61% Jan-15 2015 Q1 927,500.39$ 77,333.33$ 1.47% 1,136.19$ 1,010,970.03$ 69,503.12$ 903,540.60$ 2009 Q2 1.00% 6.61% Feb-15 2015 Q1 1,004,833.72$ 77,333.33$ 1.47% 1,230.92$ 1,089,534.29$ 69,503.12$ 973,043.73$ 2009 Q3 0.55% 5.67% Mar-15 2015 Q1 1,082,167.06$ 77,333.33$ 1.47% 1,325.65$ 1,168,193.27$ 69,503.12$ 1,042,546.85$ 2009 Q4 0.55% 4.66% Apr-15 2015 Q2 1,159,500.39$ 77,333.33$ 1.47% 1,420.39$ 1,246,946.99$ 69,503.12$ 1,112,049.97$ 2010 Q1 0.55% 4.34% May-15 2015 Q2 1,236,833.72$ 77,333.33$ 1.47% 1,515.12$ 1,325,795.45$ 69,503.12$ 1,181,553.10$ 2010 Q2 0.55% 4.34% Jun-15 2015 Q2 1,314,167.06$ 77,333.33$ 1.47% 1,609.85$ 1,404,738.63$ 69,503.12$ 1,251,056.22$ 2010 Q3 0.89% 4.66% Jul-15 2015 Q3 1,391,500.39$ 77,333.33$ 1.47% 1,704.59$ 1,483,776.55$ 69,503.12$ 1,320,559.34$ 2010 Q4 1.20% 4.01% Aug-15 2015 Q3 1,468,833.72$ 77,333.33$ 1.47% 1,799.32$ 1,562,909.21$ 69,503.12$ 1,390,062.47$ 2011 Q1 1.47% 4.29% Sep-15 2015 Q3 1,546,167.06$ 77,333.33$ 1.47% 1,894.05$ 1,642,136.59$ 69,503.12$ 1,459,565.59$ 2011 Q2 1.47% 4.29% Oct-15 2015 Q4 1,623,500.39$ 77,333.33$ 1.47% 1,988.79$ 1,721,458.71$ 69,503.12$ 1,529,068.71$ 2011 Q3 1.47% 4.29% Nov-15 2015 Q4 1,700,833.72$ 77,333.33$ 1.47% 2,083.52$ 1,800,875.57$ 69,503.12$ 1,598,571.84$ 2011 Q4 1.47% 3.92% Dec-15 2015 Q4 1,778,167.06$ 77,333.33$ 1.47% 2,178.25$ 1,880,387.15$ 69,503.12$ 1,668,074.96$ 2012 Q1 1.47% 3.92%2012 Q2 1.47% 3.23%2012 Q3 1.47% 3.23%2012 Q4 1.47% 3.70%2013 Q1 1.47% 3.70%2013 Q2 1.47% 3.17%2013 Q3 1.47% 3.17%2013 Q4 1.47% 3.17%2014 Q1 1.47% 2.89%2014 Q2 1.47% 2.89%2014 Q3 1.47% 2.89%2014 Q4 1.47% 2.89%2015 Q1 1.47% 2.89%2015 Q2 1.47% 2.89%2015 Q3 1.47% 2.89%2015 Q4 1.47% 2.89%
Total Funding Adder Revenues Collected 1,855,500.39$ 24,886.76$ 1,880,387.15$
NOTE: Funding adder revenues are up to December 2014 actuals
This worksheet calculates the funding adder revenues.
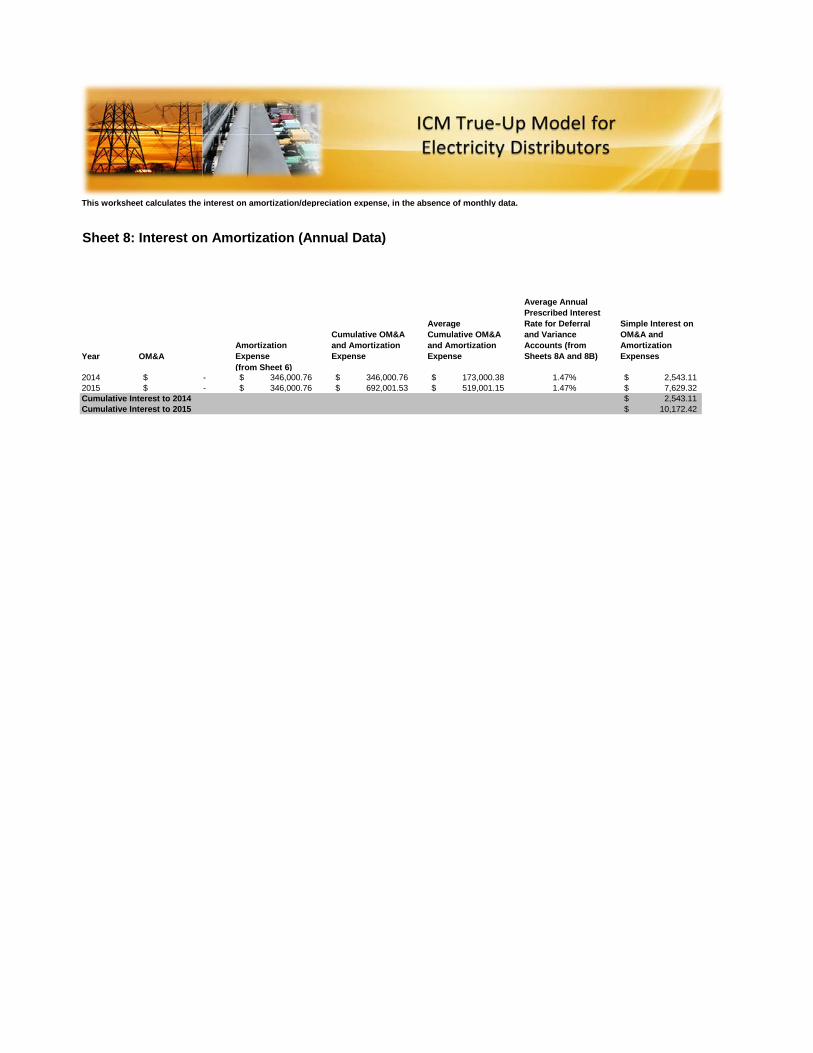
This worksheet calculates the interest on amortization/depreciation expense, in the absence of monthly data.
Sheet 8: Interest on Amortization (Annual Data)
Year OM&AAmortization Expense
Cumulative OM&A and Amortization Expense
Average Cumulative OM&A and Amortization Expense
Average Annual Prescribed Interest Rate for Deferral and Variance Accounts (from Sheets 8A and 8B)
Simple Interest on OM&A and Amortization Expenses
(from Sheet 6)2014 -$ 346,000.76$ 346,000.76$ 173,000.38$ 1.47% 2,543.11$ 2015 -$ 346,000.76$ 692,001.53$ 519,001.15$ 1.47% 7,629.32$ Cumulative Interest to 2014 2,543.11$ Cumulative Interest to 2015 10,172.42$

Sheet 9: ICM Incremental Revenue Requirement
2014 2015 Total
Deferred and forecasted ICM Incremental Revenue Requirement (from Sheet 6) 924,059$ 924,059$ 1,848,118$
Interest on Deferred and forecasted Amortization Expense (Sheet 8) 2,543$ 7,629$ 10,172$
ICM Funding Adder Revenues (from Sheet 7) 927,500$ 928,000$ 1,855,500$
ICM Funding Adder Interest (from Sheet 7) 5,000$ 19,887$ 24,887$
Net Deferred Revenue Requirement 5,898-$ 16,198-$ 22,097-$
This worksheet calculates the ICM Incremental Revenue Requirement.


![[SHIMADZU] 島津製作所 · cc-ms cv-aas, cv-afs, icp-oes, icp-ms, aas pbb/pbde cr(vl) pb/cd icp-oes. icp-ms icp-oes. icp-ms, icp-oes, icp-ms, cc-ms aas cv-aas aas : aas . - icp-oes](https://img.dokumen.tips/doc/110x75/602bef1d6551697710154f3f/shimadzu-eoe-cc-ms-cv-aas-cv-afs-icp-oes-icp-ms-aas-pbbpbde-crvl.jpg)