Embed Size (px)
Citation preview

ICC 2009, Santiago de Chile
Visualization of Glacier Surface MovementSamuel WiesmannInstitute of Cartography, ETH Zurich

2
Outline
Introduction Existing visualizations Describing the data in geographic data cube Shortcomings and problems Approach Outlook Conclusions

3
Introduction
Visualization of glacier surface movement:
Ice flow: velocities
Changes in ice thickness
Changes in glacier length andice covered area
Mass displacement
(change in shape of crevasses, movement of crevasses, …)

4
Existing Visualizations
Vector field … along with isotaches
[Kääb 2005]

5
Existing Visualizations
Streamlines and trajectories
[Kääb 2005][NASA SVS 2006/2009]

6
Existing Visualizations
Velocities: classified and stretched color ramp
[Quincey et al. 2009]
[Giles et al. 2009]

7
Existing Visualizations
Color coded velocities with overlain vectors
[Bolch et al. 2008]

8
Existing Visualizations
Velocity vectors and color coded changes in elevation
[Kääb 1997/2005]

9
Existing Visualizations
Dynamic arrows depict flow conditions
[NASA SVS 2004/2009]

10
Existing Visualizations
Movie of 2.5D retreat simulation
[Jouvet 2008]

11
Geographic Data Cube
The principle I
Time
Variable
Space
point in time (t1)
specific area, e.g. glacier surface
variables from glacier surface (velocity, height, temperature, …)
adopted from [Bahrenberg et al. 1990], [Maidment et al. 2002]
12
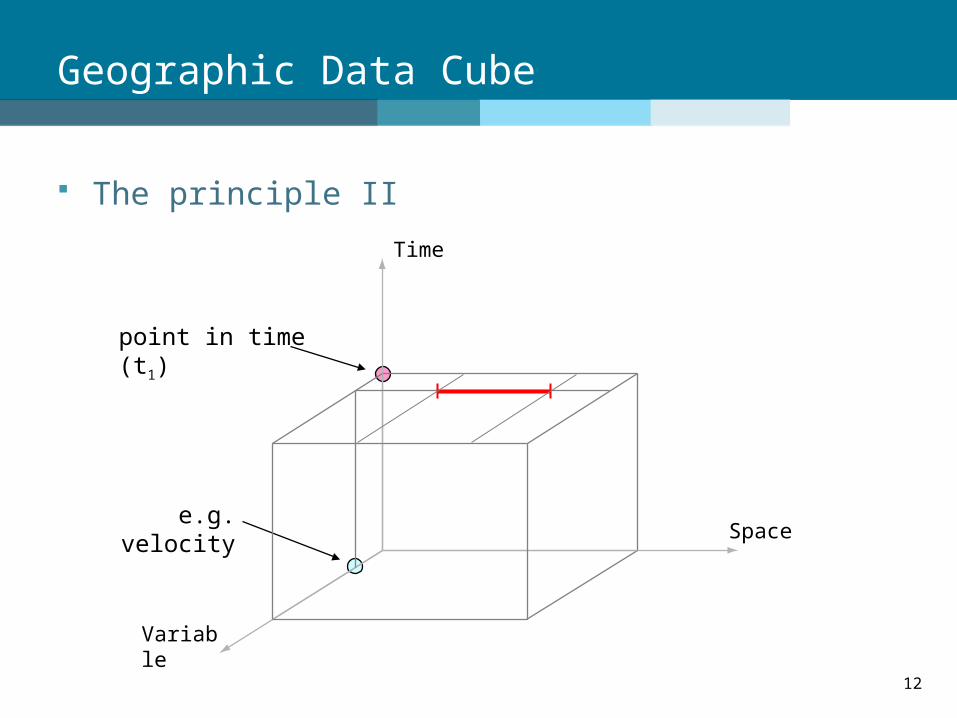
The principle II
Geographic Data Cube
e.g. velocity
point in time (t1)
Time
Variable
Space

13
Situation in a glacier map
Geographic Data Cube
Time
Variable
Space
velocity
heights a.s.l.
direction

14
Geographic Data Cube
Type 1: ca. 50% of analyzed visualizations (N=80) fixed space, 1 point in time, 1 to 4 variables
Time
Variable
Space
[Kääb 2005]

15
The second type I
Geographic Data Cube
Time
Variable
Space
velocity
heights a.s.l.
direction
point in time (t1)
point in time (t2)

16
The second type II
Geographic Data Cube
Time
Variable
Space
velocity
heights a.s.l.
direction
point in time (t1)
point in time (t2)

17
Geographic Data Cube
Type 2: ca. 40% of analyzed visualizations (N=80) fixed space, 2 (or more) points in time,
1 to 3 variables (whereof 1 at different times)
[NASA SVS 2006/2009]
Time
Variable
Space

18
Geographic Data Cube
Type 1: ca. 50% (N=80)
Type 2: ca. 40%
Type 3: ca. 10%fixed space, time animated, usually 1 variable
Time
Variable
Space
Time
Variable
Space
Time
Variable
Space

19
Situation summarized
0% allowing for spatial navigation
0% allowing for thematic navigation
10% allowing for temporal navigation (usually start/stop)

20
Problems which arise
Overlaying symbols when comparing: 1 position (X/Y), 3 values
[Kääb 1996]

21
Problems which arise
Overlaying symbols when comparing: e.g. feature tracking: 4 positions (X/Y), 4 values

22
Main problems
Problem of scale
Integration of time
[Pritchard et al. 2005]

23
Approach
Intended system architecture
DBMS
PostgreSQLand PostGIS
Preprocessing
Userweb-browser
GIS-Server

24
Outlook I
Testing different visualization techniques How to improve? 2D or 3D -- 2D and 3D?

25
Outlook II
A lot of data from many projects Usually processed for only one publication
Bundle the data and re-use it!

26
Outlook III
Compare two glaciers at a certain date Monitor a glacier over a specific time period Compare two glaciers over this period of time
Calculate differences Interpolation
Profiles on-the-fly

27
Outlook IV
Integration of glacier simulation models
Extract potentially dangerous areas
Resource when estimating potential natural hazards
… and many more …

28
Conclusions
Glaciology mostly uses “classic” cartography Bundle the data! GIS and cartography may provide the platform Underlying technique exists and is ready to adapt Improving the visualization and combining tools More efficient gain of knowledge in glaciology

ICC 2009, Santiago de Chile
Visualization of Glacier Surface MovementSamuel [email protected]
Thank you for your attention
30
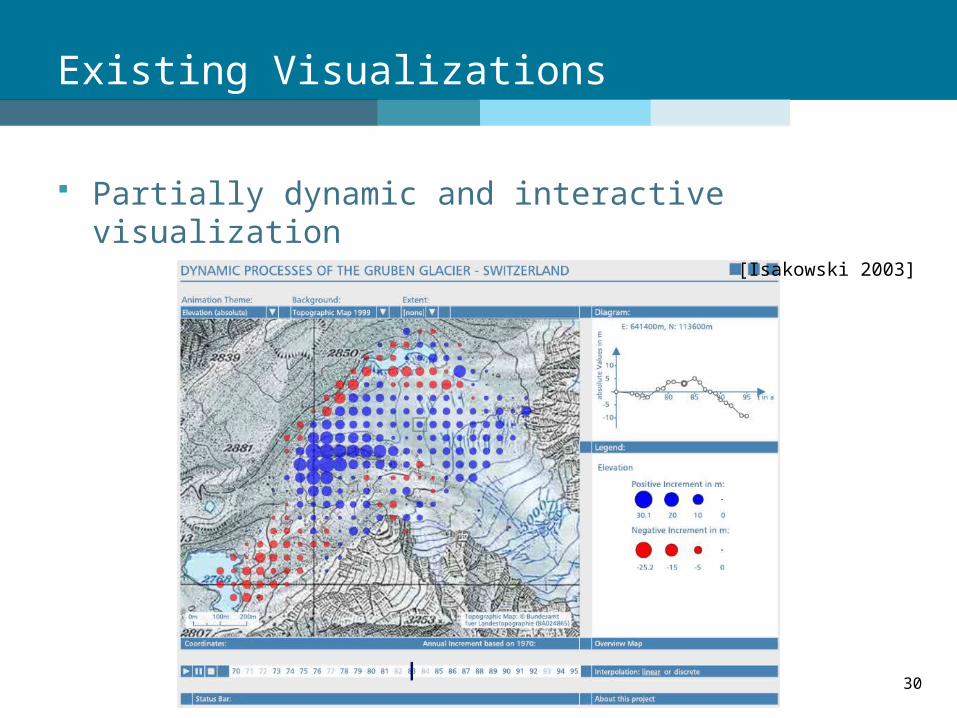
Existing Visualizations
Partially dynamic and interactive visualization
[Isakowski 2003]

31
Data Cube - Time
1 specific point in time anywhere in space any variable Time
Variable
Space

32
Data Cube - Space
1 specific location X/Y/Z any point in time any variable Time
Variable
Space

33
Data Cube - Variable
1 specific variable any point in time anywhere in space Time
Variable
Space