Embed Size (px)
DESCRIPTION
The most comprehensive survey of the internal communication industry today
Citation preview

THE MOST COMPREHENSIVE SURVEY OF THE INTERNAL COMMUNICATION INDUSTRY TODAY
iC SURVEY 2006
CONDUCTED IN PARTNERSHIP WITH THE VMA GROUP

SECTION 2SURVEY RESPONDENTS � DEMOGRAPHYSECTION 2
The iC Survey 2006 is conducted by Karian and Box in association with VMA Group, one of the UK’s leading specialist search and selection consultancies in corporate communications recruitment. Communicators in Business (CiB) also supported the survey and encouraged their members to participate.
iC SURVEY 2006
KARIAN AND BOX is a communication and campaigns agency with the experience and creativity to help organisations: DEVELOP THEIR COMMUNICATIONS STRATEGY, INFRASTRUCTURE AND CAPABILITIES
MOBILISE EMPLOYEES BEHIND CHANGE
ENGAGE EMPLOYEES WITH THEIR BRAND
BUILD AND DEFEND THEIR REPUTATION
2KARIAN AND BOX � iC SURVEY

CONTENTS
3KARIAN AND BOX � iC SURVEY
Introduction ........................................................................
Executive Summary ...........................................................
Section 1: Research Overview .....................................
Section 2: Survey respondents – demography .........
Section 3: Survey respondents – role .........................
Section 4: Internal Communication resources
– team and budget size .............................
Section 5: Communicating organisational strategy
Section 6: Measuring the eff ectiveness of
communications and engagement .........
Section 7: Communication planning .......................
Section 8: Communication Channels ......................
Section 9: Leadership - and their role in
communication .........................................
Section 10: Conclusion ...................................................
Section 11: Footnotes .....................................................
4
5
6
7
13
21
25
27
30
33
38
41
45

4KARIAN AND BOX � iC SURVEY
Internal communication is often seen as the poorer cousin within the wider communications industry. Fewer resources and less credibility are just two of the problems facing those working in internal commu-
nication. Yet the industry has grown, matured
and professionlised. We have seen a sig-nifi cant rise in the numbers working in in-dustry. Budgets have, on the whole, steadily grown. Senior internal communication professionals have increasingly grappled with organisational strategy and helped their employers achieve their corporate goals. Many senior leaders are turning to in-ternal communicators to help them engage and mobilise their employees. Some of those leaders have gone away disappointed – and some have been impressed by their communicator’s business savvy, creativity and dedication.
It is an exciting time to be a commu-nicator – and, in particular, an internal communicator. Lawyers and fi nanciers welcome mergers and acquisition activity. Similarly, communicators should be excited by the opportunities available to them at a time when much of industry and the public sector are going through major change and transformation.
Our organisations are changing. The economies, markets and environments in which we work are changing. Globali-sation, deregulation, outsourcing, privatisa-tion, rationalisation – we are living at time of permanent and complex change. That is both the challenge and opportunity we face as communicators. We can become downhearted at the diffi culties that these changes inevitably bring. Or we can see them as a chance for us to help ourorganisations survive the range of corporate ‘traumas’ that come with change. By so doing, we can raise further our credibility as a profession. But this requires 3 changes of our own. Professionalisation, representation and demonstration. � We have to further professionalise who
we are and what we do – raising our game by raising our skills and the quality of the communications infrastructure we use. � We have to talk as a profession. Given the scope and responsibilities we have, there is no single eff ective professional body that speaks on our behalf. Too often, we are hangers on at someone else’s party – mainly the PR one. We need a voice of our own. We also need a ‘space’ in which we can talk, share and learn.� We need to demonstrate to the organisa-tions we work for that we mean business; that we can make a diff erence. Ultimately, that requires us to demonstrate the tangible links between what we do in our day jobs and the value added to the organisations we work for.
It is true to say that the industry is still young (and, as this survey shows, many of the people working in it are ‘young’). There is much that has changed in our industry and there is much changing still.
That is why we conducted the iC Survey 2006 and why it is important to ask the questions we have asked. What does our profession look like and who works in it? What do we do in our day job? What are the issues we face? What are our perceptions of the organisations we work for and the communications we are ultimately responsible for? How eff ective are our organisations at communicating with their employees? All these questions and more are the foundations of an under-standing of where the profession is today.
We need to know the answers to those questions to see where our industry’s strengths are and where we still have to do more work. Where the benchmarks are today will help us defi ne the eff ectiveness of our own organisation’s communications in the future. We hope that this report con-tributes to the provision of those answers and helps set some of those benchmarks. Ultimately, we hope the report gives you insight into the issues you need to address in your organisations – together with those where you are already ahead of the game.
INTRODUCTIONiC SURVEY 2006
GHASSAN KARIAN
Director n Karian and Box
COMMUNICATORS
SHOULD BE EXCITED
BY THE OPPORTUNITIES
AVAILABLE TO THEM AT
A TIME WHEN MUCH
OF INDUSTRY AND
THE PUBLIC SECTOR
ARE GOING THROUGH
MAJOR CHANGE AND
TRANSFORMATION
EXECUTIVE SUMMARY
5KARIAN AND BOX � iC SURVEY
ChangeOne of the most consistent themes to emerge throughout the survey was that of change. Organisations, in whichever sector, are being overwhelmed by change – structural, organisational and cultural. Sadly, though, internal communication is not, in many cases, having the necessary impact on shaping employee thinkingand behaviour to help them respond to that change.
Furthermore, internal communicators are primarily focused on supporting their organisations through the challenges of structural change – with far less focus on corresponding cultural and behavioural change. This is particularly an issue for the public sector – where change is an increasingly signifi cant factor.
ValueThe survey highlighted the ambigu-ous view that communicators have of whether, and to what extent, they are valued by their organisational leader-ship. One third of communicators are not satisfi ed in their roles, with a similar third of respondents feeling that development opportunities are limited.
LeadershipLeaders are committed to engaging their workforces, but do not always have the will, the time or the wherewithal todeliver on that commitment.
Translating organisationalstrategyMost organisations have a communica-tion strategy that is aligned with that of their organisations. Nonetheless, there remains a huge gap between communi-cators understanding an organisation’s strategy and being able to translate and communicate it into practical meaning which employees can relate to.
The basic infrastructure is in placeMany communicators have the basicinfrastructure in place which enables them to plan, measure and delivercommunications. In each of these areas, however, there are some major limitations on the reach and eff ectiveness of this infrastructure. For example, communica-tion plans are not fully integrated across most organisations, while measurement is often limited to annual temperature checks (with limited follow-up activity).
In the specifi c area of measurement, many organisations are still unable to have a defi nitive and regular view ofwhat their employees think and do. The lack of regular checks on employee awareness, understanding and opinion is limiting organisations’ abilities to tailor and update communications as audience responses shift.
The internal communicator’s profi leIf you are an internal communicator,you are on the whole likely to be young, female and university educated. 70% of internal communication respondents are women, 75% are under 40 and 60% have a degree. Furthermore, a third started their career in internal communi-cation by migrating from PR.
MANY COMMUNICATORS
HAVE THE BASIC
INFRASTRUCTURE IN
PLACE BUT THAT’S AS
FAR AS IT GOES

6KARIAN AND BOX � iC SURVEY
RESEARCH OVERVIEWRESEARCH METHODOLOGY
n We ran a quantitative online survey of com-munication professionals between 10 January and 10 February 2006. Email invitations were sent to 4,370 communicators by Karian and Box, the VMA Group and the CiB (Communi-cators in Business). We received 639 responses, representing a response rate of 14.6%.
Once the quantitative report was compiled, qualitative input was sought from a range of professionals across the communications industry. A sample of Directors of Communica-tion and Heads of Employee Communication
participated in telephone and face–to–face interviews as part of this process.
The data from this survey has been analysed and cross-tabulated and is presented with accompanying commentary throughout this report.
SECTION 1
HOW THE RESEARCH WAS CONDUCTED?
1 Communicating organisation strategy
Measuring the impact of communications23 Communications planning
Communication channels including the role of Line Managers in communication45 The role of organisational leaders in communication
This research project identifi ed 5 core areas of study:
Three further areas of focus were:
1 The demographic make-up of the internal communication industry
The role carried out by internal communication professionals23 The resources allocated to internal communication

SECTION 2
SURVEY RESPONDENTS
This section analyses responses to the survey by function, sector, geography, gender, age and educational background.
FunctionOf those responding to the survey, nearly two thirds have roles solely focused on internal communication, with the remain-ing third responsible for internal com-munication in addition to wider corporate communications activities such as media relations (Figure 2.0).
Sector – overviewA relatively high proportion of responses came from public sector organisations, with two in fi ve respondents working in this sector. This is much higher than the proportion of UK employees working in this sector (20.4% as at 2005 – Source: Offi ce of National Statistics). Nonetheless, much of the data from the survey is ana-lysed by sector – with details of responses in the private, public and Non-Govern-mental Organisation (NGO) sectors.
The data was broken down into three key sectors with the largest percentage of respondents coming from the private sec-tor (Figure 2.1). A more detailed break-down of respondents by sector groups is provided in Figure 2.2.
FIGURE 2.1 OVERVIEW OF RESPONSES BY SECTOR
n NGO sector n Private sector
n Public sector
5%
40% 55%
FIGURE 2.0 RESPONDENTS BY FUNCTION
n Corporate communicators (with internal communication responsibility)
n Internal communicators
35%65%
DEMOGRAPHY
7KARIAN AND BOX � iC SURVEY

SURVEY RESPONDENTS � DEMOGRAPHY
Sector – detailsThe largest private sector groupings came from Financial Services (e.g. Royal Bankof Scotland and Royal & Sun Alliance),Professional Services (e.g. legal oraccountancy fi rms such as Cliff ord Chance, KPMG and a range of design/ communications agencies), Manufactur-ing and Utilities – making up 196 or 58% of private sector respondents (Figure 2.2). n The largest single response group in the private sector was from Financial Services (77 people or 12% of all respondents).n Over a third of public sector respond-ents came from local government, whereas respondents working in national
government departments constituted – 39 people or 13% of public sector respondents. n The 53 respondents from ‘other’ public sector organisations included communica-tors working in local police forces,housing associations and regionaldevelopment agencies.n 59 people (9% of all respondents) work in the health sector – with 46 working in the NHS and the remaining 13 employed in the private health care sector. n A similar public-private sector splitexists with organisations responding from the defence (10 respondents) and broad-casting (8 respondents) sectors.
FIGURE 2.2 NUMBERS OF RESPONDENTS BY SECTOR GROUPS
0
20
40 60 80 100 120 20
Call centre industry/customer service
Engineering and risk management
Environmental
Construction/building/support services
Publishing
IT/Telecommunication
FMCG
Leisure/Travel
Logistics/transport
Pharmaceuticals
Professional services
Utilities
Financial services
Retail
Manufacturing
NGO/research organisation
Broadcasting & media
Defence industry
NHS/health services
Education (University)
Other public sector
National government department
Local government
n Private sector nn NGO n Mix public/private sector n Public sector
5
3
3
24
4
18
5
3
18
24
50
27
77
13
42
33
8
10
59
14
53
39
107
SECTION 2
8KARIAN AND BOX � iC SURVEY
42

9KARIAN AND BOX � iC SURVEY
FIGURE 2.3 PERCENTAGE OF RESPONDENTS BY GEOGRAPHIC AREA IN THE UK
0% 10% 20% 30% 40% 50%
Australia
America
EU
West Midlands
East Midlands
North East
North West
South West
Wales
Scotland
South East
Greater London
2.63
1.57
3.06
3.86
5.10
3.94
8.08
15.54
6.89
40.55
1.56%
7.22
SURVEY RESPONDENTS � DEMOGRAPHY SECTION 2
GeographyOf the total 639 respondents, over 56% are based in London or the South East (Figure 2.3). Geographical variation by sector shows that 43% (see Table 2.0) of private sector respondents are based in London. This compares with 36.3% of public sector respondents who are based in London. To some extent, this refl ects the relatively high proportion of locally based communicators in the public sector. These include those working in councils, the NHS, police forces and housingassociations who responded to thesurvey and provided a broader regional variation from across the UK.
With the survey predominantly focused on UK-based companies, it is unsurprising that only 8% of respondents are based outside the UK (3% in Australia, 2% in USA and 3% in the EU).
Public Private NGO
Scotland 7.5% 6.6% 12.0%
Wales 1.3% 1.9% 0.0%
Greater London 36.3% 43.0% 46.7%
South East 16.3% 15.0% 16.0%
South West 7.9% 5.6% 13.3%
North West 8.8% 8.31% 0.00%
North East 5.4% 2.73% 6.00%
East Midlands 6.2% 4.75% 0.00%
West Midlands 3.8% 3.69% 6.00%
PERCENTAGE OF RESPONDENTS BY UK GEOGRAPHIC AREA AND BY SECTORTABLE 2.0

“THE DATA ON GENDER IS VERY MUCH MIRRORED BY OUR OWN FINDINGS
73% OF OUR INTERNAL COMMUNICATION CANDIDATES ARE FEMALE,
REFLECTING THE HIGH PROPORTION OF WOMEN IN THE INDUSTRY.”
DAVID BROOME, VMA
GenderThe data highlights the strong representation of women in the communications industry – with only a third of total respondents being men (Figure 2.4). It could be argued that the high level of female respondents to the survey is not necessarily representative of the industry. However, these results mirror results from previous industry surveys. This survey is also the largest of its kind in the UK – with the largest sample size in the industry. As such, it provides a fairly strong representation of the industry.
Figure 2.5 below shows that there is an even higher proportion of women working in internal communication than communications generally. Indeed, 70% (Figure 2.5) of respondents whose roles are solely focused on internal communication are women – compared with 59% (Figure 2.6) who work in corporate communications (i.e. those who have responsibility for internal communication in addition to other functional activities such as media relations).
INTERNAL COMMUNICATION RESPONDENTS BY AGEFIGURE 2.5
n Female
n Male
70%30%
CORPORATE COMMUNICATIONS RESPONDENTS BY AGEFIGURE 2.6
n Female
n Male
59%41%
n Female
n Male
66%
34%
RESPONDENTS BY AGE TOTAL COMMUNICATIONS INDUSTRYFIGURE 2.4
SURVEY RESPONDENTS � DEMOGRAPHY
10KARIAN AND BOX � iC SURVEY
SECTION 2

AgeA large majority of communicators are under the age of 40 (Figure 2.7). Three in four of internal communicators and three in fi ve corporate communicators are younger than 40. The single largest age grouping is of those aged between 30 and 40. Both these facts are generally indicative of a younger industry.
Furthermore, there are disparitiesbetween corporate communicators – those who have responsibility for both internal and external communications – and those working purely in internal communication.
Those with ‘corporate’ communica-tions responsibilities tend, on the whole, to be older. A larger segment of ‘inter-nal’ communication respondents were in the 25-30 age range than ‘corporate’ communication respondents. Conversely,
there were nearly double the number of 40-50 year olds who work as
corporate communicators compared to those working as pure ‘internal’ communicators.
When looking at individual re-sponses, we fi nd that the corporate
FIGURE 2.7 RESPONDENTS BY AGE
n Corporatecommunicators
n Internalcommunicators
8.78%
4.42%
26.34%
15.77%
42.44%
42.32%
19.51%
33.65%
2.93%
3.84%
Age
gro
ups
communications category is made up of more senior people – with many being ‘Heads’ or ‘Directors’ of communication. The seniority of role is clearly linked toseniority or age.
Nonetheless, it can also be arguedthat internal communication is a less well-established function in the widercommunications industry. Compared to media relations and investor relations, internal communication is a relative newcomer. As a more junior function, it tends to employ younger people with less professional experience. Therefore, the number of ‘younger’ internal communica-tors far outweighed those in a similar age range who had both internal and external communications responsibilities.
11KARIAN AND BOX � iC SURVEY
SURVEY RESPONDENTS � DEMOGRAPHY SECTION 2
Over 50
40 – 50
30 – 40
25 – 30
18 – 25
0% 10% 20% 30% 40% 50%
THE SINGLE LARGEST
AGE GROUPING IS OF
THOSE AGED BETWEEN
30 AND 40.

high proportion of respondents (24.6%) with postgraduate educational experi-ence (including an MBA, MA, MSc or PhD qualifi cations).
Possible explanations for this may include vocational post-graduate study focused on communications, market-ing or business. It may also highlight the changing nature or ‘worth’ of graduate degrees and the increasing number of those undertaking postgraduate studies to distinguish themselves in the job market.
EducationThe survey data in Figure 2.8 demon-strates the predominance of graduate requirement in both the corporate and internal communication functions. Over 58% have university degrees. Whilst this fi gure may be interpreted as a refl ection of the higher number of graduates in the job market, it is true to say that many communications teams now make having a degree a pre-requisite for joining.
It is also intriguing that there is such a
FIGURE 2.8 COMMUNICATORS BY HIGHEST LEVEL OF EDUCATIONAL ATTAINMENT
3.80
2.63
24.64
58.14
4.34
Other
GCSE/O Level
Postgraduate degree
University degree
BTech/diploma
A level
SURVEY RESPONDENTS � DEMOGRAPHY SECTION 2
12KARIAN AND BOX � iC SURVEY
0% 10% 20% 30% 40% 50% 60%
6.45

ROLES
Length of time in roleOverall, turnover in the industry seems somewhat high – with just over three in fi ve communicators having changed roles in the last three years (62.3% - Table 3.0). The data also highlights some interesting diff er-ences between the private and NGO sectors compared with the public sector.
Whilst about 43% of communicators in the private and NGO sectors have been in their current role for between 1 and 3 years, 26% of public sector respondents say
they have been in their current role for the same length of time. Furthermore, public sector communicators are more
likely to have been in post for either less than one year or for between 3 to 6 years. This
highlights diff erences in recruitment trends. It may be refl ective of a recent slowdown in private sector recruitment and
turnover in the last 12 months.
A slowdown in public sector turnover has been in place for much of the last three years. This mirrors the slowdown in public sector employ-ment growth since
2003. According to the National Statistics Offi ce,
Public Sector employment grew quite considerably
from 1999 and peaked in 2003. Since then, it has begun a marginal decline.
The fi gures below (Table 3.0) also indicate that private sector recruitment and turnover was likely to have been high between 2002 and 2005.
“Internal Communicators tend to move on average every 3-4 years which seems to be the natural lifespan of many internal communication roles which are highly change focused.” David Broome, VMA.
Recruitment experiencesThere are also some interesting diff erences in the experiences of those applying for roles across the diff erent sectors(Table 3.1). � An individual applying for a role in the public sector is more likely to complete an application form, undertake a general inter-view and be required to give a presentation. The proportion of those in the public sector required to undertake an in-tray exercise or give a presentation is double that of re-spondents in the private sector. The number of private sector respondents saying they had to complete an application form was surprisingly low. This could be explained by the more prevalent use of CVs in the private sector – particularly amongst small to me-dium sized fi rms where application forms are not common practice.� Private sector applicants are signifi cant-ly less likely to be required to complete an application form than those in the public sector. But they are twice as likely as public or NGO sector applicants to be required to sit psychometric tests. Again, the number of those taking psychometric tests was a surprisingly high.
How long respondents have been in their current role Public Private NGO All respondents
Under one year 27.61% 25.01% 23.00% 25.94%
1-3 years 26.09% 43.05% 44.44% 36.39%
3-6 years 44.13% 28.09% 32.56% 34.67%
Over 6 years 2.17% 3.85% 0.00% 2.99%
100% 100% 100% 100%
LENGTH OF TIME IN ROLETABLE 3.0
SURVEY RESPONDENTS
13KARIAN AND BOX � iC SURVEY
SECTION 3
THREE IN FIVE
COMMUNICATORS
HAVE CHANGED ROLES
IN THE LAST THREE
YEARS.

Background of current internal com-munication professionalsIt is clear from the data (Figure 3.0) that the crossover between PR / external commu-
Public Private NGO All respondents
Application form 79.78% 44.93% 68.75% 59.94%
General interview 71.91% 63.84% 68.75% 67.29%
Capability based interview 49.18% 52.17% 37.50% 50.25%
Psychometric testing 14.61% 27.46% 12.50% 21.61%
Role play simulation 7.87% 5.80% 0.00% 6.33%
In-tray exercise / simulation 33.60% 15.94% 18.75% 23.08%
Presentation 51.69% 25.99% 31.25% 36.45%
Headhunter interview 9.36% 13.14% 6.25% 11.30%
APPLICATION EXPERIENCETABLE 3.1
BACKGROUND OF INTERNAL COMMUNICATORSFIGURE 3.0
nications into internal communication is a significant one. While this is the case across all sectors, there are other interesting differences in background by sector. For example, looking at Figure 3.0, we can see that 16% of public sector respondents and 19% of those work-ing in NGOs were previously journalists. This compares with barely 2% in the private sector – a surprisingly lower figure than expected. Conversely, HR is a route into internal commu-nication for 11% of private sector respondents – double that of public sector ones. In addition,
SECTION 3
14KARIAN AND BOX � iC SURVEY
SURVEY RESPONDENTS � ROLE
50%
40%
30%
20%
10%
0%
PR/Externalcommunication
HR Marketingcommunications
Operation Straight from school/college/university
Journalism Change/programme management
Sales Other
nn Public n Private n NGO n All respondents
36%
8%
16%
9%
9% 8%
9%
5%4%
11% of those working in the private sector started their internal communication career straight from education.
“Competency based questioning is an interview technique that many internal communication candidates will face, par-ticularly in any large corporates where HR is heavily involved in the interview process. Particularly for more tactical roles, written tests are very common and at a more stra-tegic level, clients tend to test a candidate’s ability to present.” David Broome, VMA.
“CANDIDATES MOVING INTO INTERNAL COMMUNICATION
COME FROM A WIDE RANGE OF BACKGROUNDS, THE MOST
COMMON BEING BROADER CORPORATE OR EXTERNALLY
FACING COMMUNICATIONS ROLES. HOWEVER, IT ALSO AT
TRACTS CANDIDATES FROM WIDER HR ROLES OR THOSE THAT
HAVE WORKED THEIR WAY UP A BUSINESS LINE BEFORE TAKING
ON CHANGE RESPONSIBILITIES AND THEREFORE MAKING A
MORE NATURAL TRANSITION.”
DAVID BROOME, VMA
ONE IN FIVE
COMMUNICATORS ARE
NOW REQUIRED TO SIT A
PSYCHOMETRICS TEST.

SECTION 3SURVEY RESPONDENTS � ROLE
15KARIAN AND BOX � iC SURVEY
All changeOne overriding fi nding from Figure 3.1 is the signifi cant focus on ‘organisational change’ by internal communicators – with over 50% of communicators spending a considerable amount of time on this activity. This refl ects the current state of fl ux many organisations are in, with major structural change being used to reduce costs, improve operational effi ciency and deliver improved service to customers.
Also a high priority is the communication of organisational strategy and goals, with just over 40% of communicators reporting that this takes up a very regular amount of their time.“Nearly all internal communication roles have a strong element of change com-munications - endemic corporate change has resulted in very few internal com-munication roles being about day-to-day channel management.” David Broome, VMA
Culture change: dichotomybetween professional focus and organisational priorityThere is a relatively low focus on commu-nications to change or embed culture, with
FIGURE 3.1 PRIMARY ISSUES OF FOCUS FOR COMMUNICATORS
n 1 n 2 nn 3 n 4 n 5
Operational deliverycommunications
Employee engagementactivity
Brand and culturefocused communications
Organisation change communications
CommunicatingHR related issues
Communicating organisation strategy and goals
Communicatingvision and direction
27.47
28.99
26.37
50.66
17.58
40.66
36.26
5.49 7.69 24.1835.16
2.22 14.44 27.7826.67
5.21 31.28 21.9815.16
1.10 4.6 31.8711.98
3.30 15.38 36.2627.47
2.20 5.49 29.6721.98
2.20 8.79 27.4725.27
0% 20% 40% 60% 80% 100%
Primary issues communicators are currently focused on: Communicators were asked how regularly they focused on a particular set oforganisational issues. Their responses ranged from 1 (never) to 5 (very regularly).
36.5% (Figure 3.1, statement 3) of commu-nicators spending little or no time on this area of activity. Nonetheless, Figure 3.2 highlights that the biggest issue facing nearly 80% of organisations is change to their internal culture. This highlights an interesting dichotomy.
It may indicate that internal communication professionals are not in the driving seat when it comes to internal culture change. Culture change may be a high priority for organisa-tions, but it is likely they are turning to HR, marketing or operational teams to lead that change. Communicators could well play a supporting role – spending relatively less time on helping deliver culture change. Some will say that this is as it should be – communica-tors cannot deliver ‘culture’ on their own. Nor should they be trying. It is the organisation’s operational leadership and the people working in that organisation who should take centre stage in shaping and delivering culture change.
Indeed, it is arguable that culture only changes when individual behaviours change in line with changes to organisational strategy and direction.
“NEARLY ALL INTERNAL
COMMUNICATIONS ROLES HAVE
A STRONG ELEMENT OF CHANGE
COMMUNICATIONS ENDEMIC
CORPORATE CHANGE HAS
RESULTED IN VERY FEW INTERNAL
COMMUNICATIONS R0LES BEING
ABOUT DAYTODAY CHANNEL
MANAGEMENT.”
DAVID BROOME, VMA

Nonetheless, the dichotomy still stands. Culture change is currently the highest priority for organisations (Figure 3.2), but it is an area of activity that communica-tors spend least time on (Figure 3.1). This draws attention to an area of potentially mismatched priorities. Even if communica-tors are not in the driving seat, culture-focused communications should be higher up the agenda for communicators.
Culture-focused communications may not be prioritised for several reasons:n Communicators are spending a large proportion of their time on communicat-ing organisation and process change. They are also focused on communicating their organisation’s vision, strategy and goals. With most internal communicators coming from a PR, journalist or marketing communications background, there may be a pre-disposition or bias towards ‘tell-ing and selling’ the organisation’s vision and strategy. Given the professional skills set of these communicators, this may be an easier and more tangible task than try-ing to change behaviour and culture in an organisation. In other words, it is an area outside the comfort zone of many internal communicators – leading many to avoid it, consciously or otherwise.n Internal communicators may not recognise or know how to apply their communication skills to assist with the culture change process. Techniques aimed at identifying, shaping and changing be-haviour require a degree of specialisation that may be outside the skills set of many communicators. n Organisational leaders may not, for the above reasons and due to commonly-held prejudices (where culture means people and thus equals HR or Organisational Development), turn to communications to play a signifi cant role in culture change. The odd article in the staff newspaper focused on the organisation’s new values or ways of working may beall that is expected from the internal
communications function. Ironically, communications professionals
have a unique and critical role in facilitat-ing culture change. Whilst they cannot lead it, they should play a more signifi cant part in facilitating it – one, which accord-ing to these fi gures, they currently do not.
HR communicationsAnother ‘supporting actor’ role many communicators feel they play is in the communication of HR related issues. Only 17.58% (Figure 3.1) saw this as being a current area of ‘very regular’ focus in their job. Nonetheless, 36.26%% said it was a ‘regular’ focus for them.
This highlights that communicating HR issues constitutes a fairly signifi cant part of a communicators ‘day-job’ – but may not be perceived by communicators as being core to their role.
Key priorities facing organisations in the near futureCommunicators were asked what issues are currently facing their organisation. We have already discussed the issue of change to internal culture. Figure 3.3 also shows a picture of organisations struggling with the reality of structural, market or industry changes. Clearly there is a direct rela-tionship between the two. Market and organisational change has an impact on culture. Change to one usually requires change to the other.
Another derivative of the pressures for change on organisations is the require-ment to cut costs. Figure 3.2 highlights this as the second highest priority many organisations are facing. However, as
MAJOR ISSUES FACING ORGANISATIONS IN THE NEAR FUTURE BY SECTORTABLE 3.2
SECTION 3SURVEY RESPONDENTS � ROLE
16KARIAN AND BOX � iC SURVEY
FIGURE 3.2 MAJOR ISSUES FACING ORGANISATIONS IN THE NEAR FUTURE OVERVIEW
n Introducing new technology
n Market industry changes aff ecting your organisation
n Focus on reducing costs
n Drive to grow your organisationsrevenue/sales
nn Major changes to your internal culture
n Other (please specify)
31.39
52.20 53.09
41.49
76.91
5.05
80%
70%
60%
50%
40%
30%
20%
10%
0%
Public Private NGO
Introducing new technology 37.08% 29.71% 5.00%
Market/ industry changes aff ecting your organisation 50.56% 56.52% 17.50%
Focus on reducing costs 37.19% 75.90% 37.50%
Drive to grow your organisation’s revenue / sales 14.72% 60.14% 47.50%
Major changes to your internal culture 83.78% 66.59% 82.50%
Market/ industry changes aff ecting your organisation 50.56% 56.52% 17.50%
3 OUT OF 4COMMUNICATORS
BELIEVE THAT
CHANGE IN THEIR
ORGANISATION’S
INTERNAL CULTURE IS
A MAJOR ISSUE IN THE
NEAR FUTURE.

table 3.2 shows, there are some distinct diff erences across sector. Reducing costs is a current and major pre-occupation of private sector fi rms – the number of re-spondents citing this as a major issue for their organisation was more than double that for those in the public and NGO sec-tors (Table 3.2).
Change – again…Over 70% of respondents say that change and uncertainty are major factors for org-anisations (Figure 3.3). Clearly this echoes the results displayed in Figure 3.2. How-ever, nearly 50% of respondents also said that their organisations did not manage change communications well (Figure 3.3).
This dissonance could refl ect a frustra-tion over their ability to more eff ectively shape or infl uence ‘change’ commu-
nications in their organisations. Many organisations ‘talk a good talk’ when it comes to communicating change. That ‘talk’ rarely translates into eff ective action and may not be borne out by change that is well managed by the organisa-tion’s leadership. Factors such as a lack of eff ective ‘symbolic communication’ (for example, where leaders preach the need to cut costs but are seen to be exempt from this need) play their part in reducing the impact of change communications.
Furthermore, organisations may focus a lot of their communication team’s atten-tion on the ‘harder’ elements of change – process, technology and structures – and less attention on the ‘softer’ ele-ments – behaviour, ways of working and leadership action.
SECTION 3SURVEY RESPONDENTS � ROLE
17KARIAN AND BOX � iC SURVEY
FIGURE 3.3 COMMUNICATORS’ PERCEPTIONS OF THEIR ORGANISATIONS AND ROLES OVERVIEW
We manage change communicationswell in my organisation
Change and uncertainty are big factorsin my organisation
My organisations leadership understand andsupport what I am doing
I am trusted and empowered to do my jobby my organisations leadership
My organisations leadership get involved in shaping our communications plans
Internal communication is actively involved inshaping and planning the organisations key messages
Internal communication is actively involved in shaping the organisations strategy
Internal communication is valued bymy organisations leadership
I receive the training and coaching I need to improve in my role
I am satisfi ed with the role I am in
16.51 32.19 23.4622.00 5.84
3.33 18.94 28.93 41.96
30.36 35.06 18.57
41.1620.70 26.04
9.43 18.64 31.3028.64 12.00
6.45 13.50 35.6724.22 20.15
13.44 24.44 24.1031.78
6.24
5.57 10.14 34.6333.81 15.84
12.80 19.49 23.0233.08 11.60
12.09 21.58 24.5026.22 15.71
6.84
3.74 12.27
2.88 9.23
Organisations and roles: Communicators were asked if they agreed with a series of statements regarding their role, the relationship between internal communication and their organisation’s leadership, and the perception of internal communication in their organisation. Their responses were on a scale of 1 (strong disagreement with a statement) to 5 (strong agreement with a statement) shown in Figure 3.3.
0% 20% 40% 60% 80% 100%
n 1 n 2 nn 3 n 4 n 5
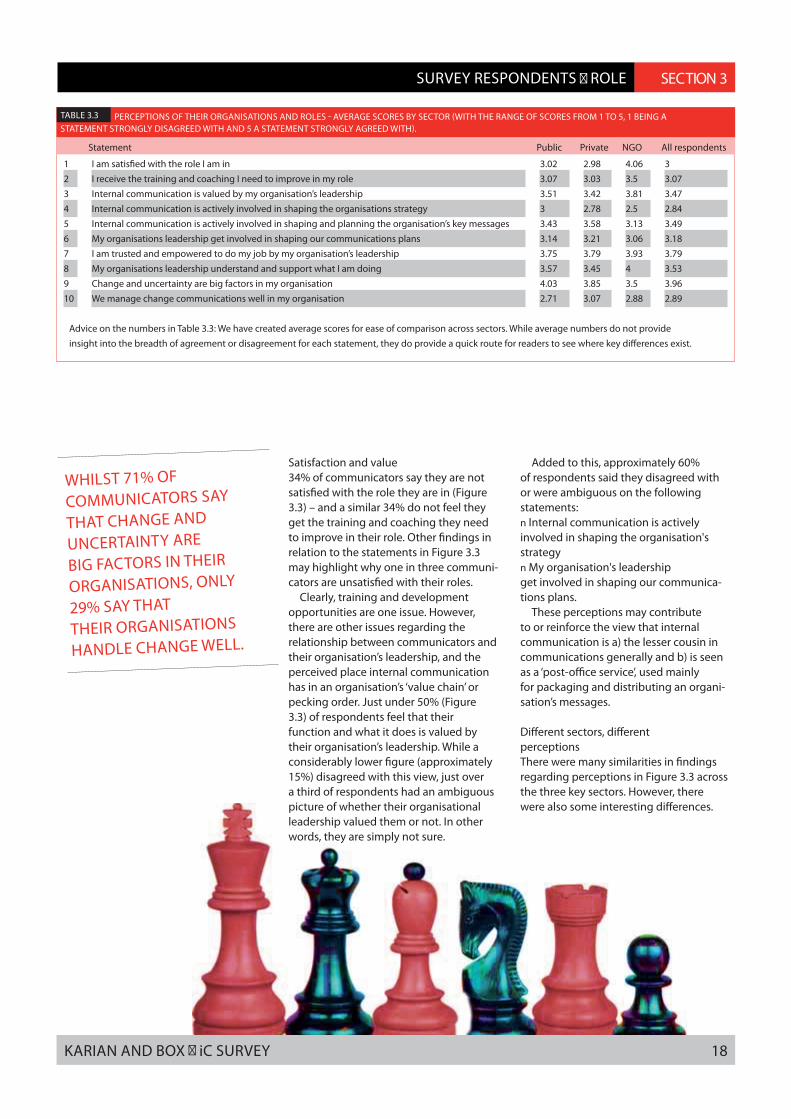
Statement Public Private NGO All respondents
1 I am satisfi ed with the role I am in 3.02 2.98 4.06 3
2 I receive the training and coaching I need to improve in my role 3.07 3.03 3.5 3.07
3 Internal communication is valued by my organisation’s leadership 3.51 3.42 3.81 3.47
4 Internal communication is actively involved in shaping the organisations strategy 3 2.78 2.5 2.84
5 Internal communication is actively involved in shaping and planning the organisation’s key messages 3.43 3.58 3.13 3.49
6 My organisations leadership get involved in shaping our communications plans 3.14 3.21 3.06 3.18
7 I am trusted and empowered to do my job by my organisation’s leadership 3.75 3.79 3.93 3.79
8 My organisations leadership understand and support what I am doing 3.57 3.45 4 3.53
9 Change and uncertainty are big factors in my organisation 4.03 3.85 3.5 3.96
10 We manage change communications well in my organisation 2.71 3.07 2.88 2.89
PERCEPTIONS OF THEIR ORGANISATIONS AND ROLES AVERAGE SCORES BY SECTOR WITH THE RANGE OF SCORES FROM 1 TO 5, 1 BEING A STATEMENT STRONGLY DISAGREED WITH AND 5 A STATEMENT STRONGLY AGREED WITH.
TABLE 3.3
SECTION 3SURVEY RESPONDENTS � ROLE
18KARIAN AND BOX � iC SURVEY
Satisfaction and value 34% of communicators say they are not satisfi ed with the role they are in (Figure 3.3) – and a similar 34% do not feel they get the training and coaching they need to improve in their role. Other fi ndings in relation to the statements in Figure 3.3 may highlight why one in three communi-cators are unsatisfi ed with their roles.
Clearly, training and developmentopportunities are one issue. However, there are other issues regarding the relationship between communicators and their organisation’s leadership, and the perceived place internal communication has in an organisation’s ‘value chain’ or pecking order. Just under 50% (Figure 3.3) of respondents feel that theirfunction and what it does is valued by their organisation’s leadership. While a considerably lower fi gure (approximately 15%) disagreed with this view, just over a third of respondents had an ambiguous picture of whether their organisational leadership valued them or not. In other words, they are simply not sure.
Added to this, approximately 60%of respondents said they disagreed with or were ambiguous on the following statements:n Internal communication is actively involved in shaping the organisation's strategyn My organisation's leadershipget involved in shaping our communica-tions plans.
These perceptions may contributeto or reinforce the view that internal communication is a) the lesser cousin in communications generally and b) is seen as a ‘post-offi ce service’, used mainlyfor packaging and distributing an organi-sation’s messages.
Diff erent sectors, diff erentperceptionsThere were many similarities in fi ndings regarding perceptions in Figure 3.3 across the three key sectors. However, there were also some interesting diff erences.
Advice on the numbers in Table 3.3: We have created average scores for ease of comparison across sectors. While average numbers do not provide
insight into the breadth of agreement or disagreement for each statement, they do provide a quick route for readers to see where key diff erences exist.
WHILST 71% OF
COMMUNICATORS SAY
THAT CHANGE AND
UNCERTAINTY ARE
BIG FACTORS IN THEIR
ORGANISATIONS, ONLY
29% SAY THAT
THEIR ORGANISATIONS
HANDLE CHANGE WELL.

SECTION 3SURVEY RESPONDENTS � ROLE
19KARIAN AND BOX � iC SURVEY
As statement 10 in Table 3.3 shows, communicators in the private sector are more likely to assess the ability of their organisations to manage change com-munications in a positive light – with public sector professionals having the least positive perception of change com-munications in their organisation. This is further illustrated by the contrasting view amongst public sector communicators that change and uncertainty are big fac-tors for their organisations. Clearly, this highlights the transformation taking place in the structuring and delivery of public services – and the relatively newer experi-ence of managing such change in that sector. This compares with private sector businesses that have seen ever increasing waves of organisational change in the last two decades.
There is also a signifi cant diff erence in the area of job satisfaction and opportu-nities, between public and private sector communicators on the one hand and communicators in NGOs on the other.
JUST UNDER 50% OF
RESPONDENTS FEEL
THAT THEIR FUNCTION
AND WHAT IT DOES IS
VALUED BY THEIR
ORGANISATION’S
LEADERSHIP.

20KARIAN AND BOX � iC SURVEY
SECTION 3SURVEY RESPONDENTS � ROLE
Areas of direct responsibilityFigure 3.4 demonstrates that the primary focus for internal communicators is plan-ning with 82% reporting this as an area of high priority in which they are regularly engaged. Campaign management (70%), copywriting (71%) and advising internal clients (70%) are also high up on the list of activities that internal communicators spend a signifi cant proportion of their time engaged in.
One area of activity where commu-nicators say they spend little or no time engaged in is measurement and evalua-tion. 53% say it is an area of regular or very regular focus and priority, compared to 32% who do not. The fact that nearly one in three communicators have limited
FIGURE 3.4 AREAS OF RESPONSIBILITY FOR COMMUNICATORS
13.19
58.24
2.20
3.29 24.1812.09
12.09 28.5724.1821.98
7.69 4.40 54.9515.3817.58
46.04
3.30 24.1815.49 10.99
6.59 29.5615.3823.19 17.58 23.08
42.864.40 25.278.79 18.68
49.45
3.30 20.8810.99 15.38
40.665.49 25.278.79
direct responsibility for measurement may be of some concern. This could be inter-preted as a number of communicators saying that ‘someone else’ has respon-sibility for measurement and evaluation. i.e. it may be carried out as an activity in their organisation, but not by them. However, the fact that the negative score for this statement is so high demonstrates an issue that cannot be dismissed that easily. This is something we will return to in Section 6.
External supplier management
Campaign developmentand management
Communication planning
Advising internal clients oninternal communication
Measurement and evaluation
Managing channnels
Copywriting
Strategy development
n 1 n 2 nn 3 n 4 n 5
19.78
0% 20% 40% 60% 80% 100%
Responsibilities: Communicators were asked whether specifi c responsibilities were areas of regular focus for them. Their responses ranged from 1 (never) through to 5 (very regular)
32% OF COMMUNICATORS
SAY MEASURMENT
AND EVALUATION
IS NOT A REGULAR
FOCUS FOR THEM.

SECTION 2SECTION 4
COMMUNICATION RESOURCESTEAM & BUDGET SIZE
This section provides an insight into resource allocation for internal communication departments.
Together with overview statistics relating to (internal communi-cation) fi nancial and person-nel resources, we assess what organisations of a certain size
spend on internal communication.
Organisations represented in iC survey 2006 A fi rst step in this assessment is to outline the size of the organisations representedby the respondents to this survey1. The largest segment of organisations (24%) represented in the survey are thoseemploying between 250 and 1,000 peo-ple (Figure 4.0). Just under onethird of organisations employ under 1,000 staff .
Clearly the statistics in either Figure 4.0 or Table 4.0 are not representative of the size of organisations in the UK. The National Statistics Offi ce fi gures state that 99.47% of the UK’s 2.07 million businesses employed between 1 and 250 employees. Just under 1,000 businesses employed more than one thousand em-ployees. National Statistics Offi ce fi gures also show that the numbers employed in public and NGO sector organisation (as outlined in Table 4.0) are more represent-ative of those sectors.
It should be noted that the relatively
high number of respondents from private sector organisations employing lessthan 250 people are mainly communica-tions consultants and those working for small communications-focused agencies – many of whom participated in thesurvey via encouragement from Commu-nicators in Business (CiB).
SIZE OF ORGANISATION BY EMPLOYEE NUMBERS
n Under 250 n 250 to 1,000n 1,000 to 5,000 n 5,000 to 15,000n 15,000 to 30,000 nn 30,000 to 50,000n Over 50,000
19%19%
24%
12%9%
12%
5%
FIGURE 4.0
Public Private NGO Total
Under 250 8.19% 15.82% 6.25% 12.31%
250 to 1000 21.98% 13.97% 43.75% 18.64%
1,000 to 5,000 26.37% 20.47% 37.50% 23.66%
5,000 to 15,000 21.48% 18.38% 12.50% 19.31%
15,000 to 30,000 14.29% 12.03% 0.00% 12.32%
30,000 to 50,000 5.49% 11.62% 0.00% 8.61%
Over 50,000 2.20% 7.71% 0.00% 5.14%
SIZE OF ORGANISATION BY EMPLOYEE NUMBERS BY SECTORTABLE 4.0
SECTION 4
21KARIAN AND BOX � iC SURVEY

FIGURE 4.1 INTERNAL COMMUNICATION BUDGET SPEND
0%
5%
10%
15%
20%
25%
20.96
Under £20,000
£20,000 – £50,000
£50,000 – £100,000
£100,000 – £250,000
£250,000 – £500,000
Over £500,000
13.60
9.818.76
22.17
24.70
FIGURE 4.2 INTERNAL COMMUNICATION TEAM SIZE
0%
5%
10%
15%
20%
25%
30%
35%
40%
1 to 3 3 to 10 10 to 20 Over 20
38.04
24.47
20.98
16.52
Internal communication budgets and team resources have, over the past few years, grown as functions have been built up. Clearly there are cyclical downturns, and the current trend for cost cutting across many organisations is having its eff ect on internal communication resources.It is unsurprising that private sector organisations are spending more on internal communication. This is partly due to the resources available in the private sector. It may also be due to private sector organisations having more advanced internal communication functions than those in the public and NGO sectors.The next two charts (Figures 4.1 and 4.2) highlight the amounts organisations allocate to internal communication and the size of com-munications teams – with associated breakdown by sectors (Tables 4.1 and 4.2).
INTERNAL COMMUNICATION TEAM SIZEBY SECTOR
Public Private NGO Total
1 to 3 47.34% 29.15% 62.50% 38.04%
3 to 10 27.58% 23.32% 12.50% 24.47%
10 to 20 8.60% 30.62% 12.50% 20.98%
Over 20 16.48% 16.91% 12.50% 16.52%
TABLE 4.2
INTERNAL COMMUNICATION BUDGET SPENDBY SECTORTABLE 4.1
Public Private NGO Total
Under £20,000 32.33% 10.18% 50.00% 20.96%
£20,000 to £50,000 13.95% 12.88% 18.75% 13.60%
£50,000 to £100,000 23.95% 21.21% 18.75% 22.17%
£100,000 to £250,000 18.14% 30.73% 10.00% 24.70%
£250,000 to £500,000 6.98% 10.61% 2.50% 8.76%
Over £500,000 4.65% 14.39% 0.00% 9.81%
22KARIAN AND BOX � iC SURVEY
SECTION 4COMMUNICATION RESOURCES � TEAM AND BUDGET SIZE
Overview of internal communication budget spend and team size.The resource allocations outlined in Figure 4.1 and Figure 4.2 become more useful when looked at in relation to the size of the relevant organisations. This provides us with benchmark informa-tion on how big communication budgets and teams are relative to organisational size. This benchmark has been done before in other industry research – the best being previous Melcrum research in this area (see www.melcrum.com). However, the relatively large size of the sample in the iC 2006 survey provides a powerful picture of resource allocation to internal communication across the diff erent organisation sizes.

23 KARIAN AND BOX � iC SURVEY
Resource allocation by organisa-tion size
Both Tables 4.3 and 4.4 indicate that there is a general synchronicity between the size of an organisation and the amount of resources (team size andactivity budget) it spends on internalcommunication.
The fi gures demonstrate that there is a positive relationship between organisa-tion size and internal communication resources. That is, as the size of an or-ganisation increases, so does the amount spent on internal communication. The highlighted numbers in Table 4.4 illustrate this relationship.
Nonetheless, an interesting fi nding is how some larger organisations are spend-ing relatively little on internal communica-tion. For example, 23% respondents from organisations with over 50,000 employ-ees said the internal communication team comprised between 1 and 3 people (Table 4.3). 17% of respondents from organisa-tions with 30,000 to 50,000 staff have activity budgets for internal communica-tion of no more than £20,000 (Table 4.4).
Conversely, there are some organi-sations that may be perceived to be spending relatively larger sums on internal
23KARIAN AND BOX � iC SURVEY
SECTION 4COMMUNICATION RESOURCES � TEAM AND BUDGET SIZE
communication given their relative size. For example, 10% of respondents in organisations employing between 5,000 and 15,000 staff reported that their internal communication budget was over £500,000.
Internal communication Team Size
Public Private NGO Over 20
Organisation size (by employee numbers) 1–3 staff 3–10 staff 10–20 staff
Under 250 88.00% 9.30% 0.00% 2.70%
250 to 1,000 82.61% 8.70% 4.25% 4.45%
1,000 to 5,000 66.67% 28.79% 3.03% 1.52%
5,000 to 15,000 42.86% 33.13% 11.92% 11.68%
15,000 to 30,000 25.00% 7.14% 25.00% 42.86%
30,000 to 50,000 7.14% 14.29% 28.57% 50.00%
Over 50,000 22.73% 18.18% 4.55% 54.55%
INTERNAL COMMUNICATION TEAM SIZE BY SIZE OF ORGANISATIONTABLE 4.3
Internal communication budget (excluding staff budget
Organisation size Under £20,000 £20,000 to £50,000 £50,000 to £100,000 £100,000 to £250,000 £250,000 to £500,000 Over £500,000
Under 250 66.07% 17.27% 16.67% 0.00% 0.00% 0.00%
250 to 1,000 62.22% 15.56% 17.78% 4.44% 0.00% 0.00%
1,000 to 5,000 23.56% 26.44% 25.00% 14.06% 10.94% 0.00%
5,000 to 15,000 17.43% 5.07% 27.19% 22.81% 17.40% 10.10%
15,000 to 30,000 23.08% 7.69% 11.54% 30.77% 3.85% 23.08%
30,000 to 50,000 16.99% 8.01% 25.00% 16.60% 33.40% 0.00%
Over 50,000 6.95% 4.15% 2.54% 27.27% 13.64% 45.45%
INTERNAL COMMUNICATION BUDGETS BY SIZE OF ORGANISATIONTABLE 4.4

DEMOGRAPHY
COMMUNICATINGORGANISATIONAL STRATEGY
SECTION 5
Measurement Statement 1 in Figure 5.0 shows that there may be relatively patchy levels of knowledge amongst communicators in relation to employee understanding of and opinion on their organisation’s strat-egy. Just over one third of communicators say their organisations measure employee understanding of strategy and goals. Table 5.0 shows that this equates to a net negative2 of 0.58% between those who disagree3 with this statement versus those who agree with it. This may also be an explanation for the fairly high number of communicators who responded in a neutral way to the other statements in this section. In some respects, communi-
cators do not seem to have a clear picture of what their employees know and think about a range of strategic issues.
I understand…The positive picture from Figure 5.0 (statement 2) is that over two thirds of communicators believe that their internal communication and organisational strate-gies are aligned. Furthermore, just over 50% of respondents agree / strongly agree with the statement that staff in their organisations have a strong under-standing or their operating environments and the priorities for the coming year (Statements 4 and 5).
FIGURE 5.0 PERCEPTIONS OF ORGANISATIONAL STRATEGY COMMUNICATION
1. We measure employee understanding
of business strategy and goals
2.Our internal communication strategyis aligned with the organisation’s strategy
3. Staff understand the organisation’s direction
4. Staff know the key priorities for ourorganisation in the next year or so
5. Staff have a good understanding of ourorganisation’s market/operating environment
6. Staff understand what the organisation’sstrategy means for them in practice
7. Staff feel involved in shapingthe organisation’s strategy
8. The organisation’s leadership see internalcommunication as critical to the delivery
of the organisation’s strategy
9. The organisation’s strategy is in a storyor narrative form that employees can relate to
10. Staff believe in the direciton our organisation is going
0% 20% 40% 60% 80% 100%
Communicating organisational strategy: Communicators were asked if they agreed with a series of statements on the eff ectiveness of communications relating to their organisation’s strategy. Their responses ranged from 1 (strong disagreement with a statement) to 5 (strong agreement with a statement).
n 1 n 2nn 3 n 4 n 5
24KARIAN AND BOX � iC SURVEY
10.02 28.6025.86 20.06 15.23
10.50
3.41 19.64 37.92 28.52
38.04
2.63 40.91 36.91 8.2211.33
11.37 33.95 40.54 11.98
33.57 44.05 12.069.85
30.41 39.03 19.126.43 4.95
40.90 32.91
2.1817.69
32.83 31.75 8.9018.557.97
31.61 30.16 15.02
2.3220.89
44.23 28.07
5.225.51 16.97
2.17
6.33

Showing the diff erence in percentage between those who said they agreed with each of the following statements and those who said they disagreed.
1 We measure employee understanding of business strategy and goals -0.58%
2 Our internal communication strategy is aligned with the organisations strategy +52.52%
3 Staff understand the organisation’s direction +31.17%
4 Staff know the key priorities for our organisation in the next year or so +38.98%
5 Staff have a good understanding of our organisation’s market / operating environment +45.79%
6 Staff understand what the organisations strategy means for them in practice -12.76%
7 Staff feel involved in shaping the organisation’s strategy -50.07%
8 The organisations leadership see internal communication as critical to the delivery of the organisations strategy +14.13%
9 The organisation’s strategy is in a story or narrative form that employees can relate to -35.16%
10 Staff believe in the direction our organisation is going +10.80%
PERCEPTIONS OF ORGANISATIONAL STRATEGY COMMUNICATION TABLE 5.0
25KARIAN AND BOX � iC SURVEY
SECTION 5COMMUNICATING � ORGANISATIONAL STRATEGY
I believe…A generally positive result from these state-ments is the large number of respondents who feel that employees understand the direction of their organisation. The down-side is that far fewer employees are seen to believe in this direction. A net positive of 31% for understanding of organisa-tional direction can be compared with a net positive of only 11% for belief in that direction. This gap is likely to be linked to potential suspicion that employees have of the spin and gloss used by organisa-tions - and ostensibly the communication
channels deployed. Too often, much of the communications employees receive relat-ing to their organisation’s future prospects and strategy is rose-tinted. Employees will see through the spin and, whilst under-standing a strategy, they may not believe it or believe it is achievable.
Table 5.0 also shows the inability of em-ployees to relate to what a strategy means to them in practice. A negative diff erence of nearly 13% in statement 6 highlights that the communications employees receive often fails to convey the impact of an organisation’s strategy and goals on the
daily working lives of its employees. This shows that employees can be intellectually engaged with an organisation’s direction without any concurrent emotional engage-ment. Emotional engagement is impossible when an individual feels that that ‘some-thing’ does not apply to them personally. Equally, engagement is unlikely where communications are passive and require no involvement of or action from individuals.
Communicating organisational strategy: showing the diff erence in % between those who said they agreed with each of the statements and those who said they disagreed4
THERE IS A SIGNIFICANT
GAP BETWEEN THE
PERCENTAGE OF
EMPLOYEES WHO
UNDERSTAND THEIR
ORGANISATIONS
STRATEGY AND THOSE
WHO BELIEVE IN IT.

A ‘story’ to relate to and under-standAn organisation’s strategy does not have to be placed in a narrative form for employ-ees to ‘get it’ or ‘believe it’. But it helps. Just over 50% of communicators say that their organisation’s strategy is not in such a narrative form (Figure 5.0). As children, we learn through the power of story telling. Storytelling is vital to the transmission of culture, morality, norms and the like, and are often communicated implicitly. Furthermore, adults do not lose that inclination towards stories as a logical and compelling form of communication. Placing complicated strategies into simple, meaningful narratives can be a critical fi rst step to communicating them to employees. It enables communica-tors to distil a range of complex messages and facts into a simple story that is more easily followed.
The fact that so few organisations carry out such an exercise may be one of the rea-sons why there is the net negative of 13% (Table 5.0) in relation to employees relating their organisation’s strategy to themselves.
ExcludedThe largest negative in these responses re-lates to the employee belief that they are not involved in shaping their organisation’s strat-egy. Only 9% of those surveyed agreed with the relevant statement compared with 59% who disagreed - a net negative of 50%.
Deep down, internal communication professionals are unlikely to be surprised by this statistic.
It demonstrates that there is a very clear perception of organisations dictating strat-egy with little or no input from their staff . Despite the talk of engagement and involve-ment, these fi gures bear out a diff erent reality. Indeed, this is the perception of those responsible for communicating and ‘selling’ their organisation’s strategy.
Clearly the role of leadership is to set strat-egy. However, there is also an important role for employees to help identify the strategic options and solutions on which strategy is based. Strategy and development is not done in isolation – the exclusion of employ-ees from this process impedes wider support and personal implication
Diff erent sectors, diff erentperceptionsThere is a general uniformity in many of the above results across the three sectors. How-ever, there are three fairly signifi cant diff er-ences between the public and private sectors in relation to some of the statements. The
detailed analysis4 by sector of the data relating to strategy communications shows that:• 38% of public sector communicators said employees understood the direction their organisations were headed in. This compares with 49% in the private sector.• The diff erence between those who agree and disagree with the statement on employees being involved in shaping an organisation’s strategy is also fairly marked. A net negative of 45% in the private sector compares with a net negative of 57% in the public sector. This highlights an interestingly higher likelihood for communicators in the private sector to believe that their employees feel more involved in the shaping of organi-sational strategy. • There is a higher percentage of communi-cators in the private sector (45%) compared to those in the public sector (35%) who say their organisations measure employee understanding of organisational strategy. • Whereas both public and private sector communicators say that their leaders see internal communication as critical to the delivery of their organisation’s strategy, NGOs say quite the opposite. 19% of NGO communicators said this was the case in their organisation – a net negative of 6%. This compared with 45% for private sector communicators and 38% for public sector ones who agreed with statement 8 in Table 5.0 – providing, respectively, net positives of 11% and 18%.
26KARIAN AND BOX � iC SURVEY
SECTION 5COMMUNICATING � ORGANISATIONAL STRATEGY
ONLY 9% OF THOSE
SURVEYED FEEL
STRONGLY THAT
EMPLOYEES IN THEIR
ORGANISATION ARE
INVOLVED IN SHAPING
STRATEGY.

SURVEY RESPONDENTSDEMOGRAPHY
SECTION 2
27 KARIAN AND BOX � iC SURVEY
SECTION 6
MEASURING THE EFFECTIVENESSOF COMMUNICATIONAND ENGAGEMENT
Figure 6.0 shows that there are marginally more communica-tors saying that their organisa-tions regularly measure the impact of communications
(45%) than those who say they do not (37%).
However, 32% of respondents say they link their communication metrics to the organisation’s objectives. This mirrors one of the answers in section 5 (Figure 5.0, statement 1), where only 38% of respondents said they measured employee understanding of organisational strategy and goals. This picture is further rein-forced when communicators were asked what they actually measured when survey-ing employees (Figure 6.1). 35% said their organisations regularly measure employee understanding of key messages.
Ends or means?Communicators were asked what their organisations most regularly measure. Too often, organisations focus on measuring the ‘means’ (the channels we use as com-municators) and not the ‘ends’ (shifts in employee understanding and behaviour).
ChannelsFigure 6.1 highlights a major focus on measuring channel eff ectiveness. At fi rst glance, this may look positive. And if it is part of a wider mix of metrics, then that is how it should be viewed. Nonetheless, it is clear from these fi gures that the link between measuring channels and meas-uring the impact they have on employee understanding of the messages conveyed in them is not strong enough.
The focus on measuring channel ef-fectiveness, on its own, will provide a poor picture of the eff ectiveness of those very same channels. Arguably, the best way to identify if channels are working is to test whether or not the messages transmitted through them are getting through to the target audiences. It is not simply by testing whether a particular channel is favoured by employees that this will happen.
Satisfaction?It could be argued that employee satisfac-tion or engagement is the most important factor impacted upon by communication. This could be the ‘end’ that communica-tors should be measuring. According to
FIGURE 6.0 PERCEPTIONS OF MEASUREMENT
Employee engagement is linked to ourorganisations bonus and reward scheme
We link our communication measurementsto our organisations objectives
We regularly measure the impactof communications on employee
awareness and understanding
42.79 25.99 14.60 12.36
4.34
18.18 27.74 21.79 24.17 8.15
9.25 28.06 18.03 28.63 15.97
Measuring communication: Communicators were asked if they agreed with a series of statements regarding the way they measured the impact of communications in their organisation. Their responses ranged from 1 (strong disagreement with a statement) to 5 (strong agreement with a statement).
0% 20% 40% 60% 80% 100%
n 1 n 2nn 3 n 4 n 5

Figure 6.1, employee satisfaction/engage-ment is the primary focus for communica-tors when they survey employees. This is clearly a good thing. However, the ques-tion communicators need to ask them-selves is whether, when conducting such measurement, they are able to demon-strate tangible and specifi c links between the work they do and the changes in employee understanding and opinion.
Many organisation-wide employee satisfaction and engagement surveys seek to identify the general awareness, under-standing and opinion of employees. Such surveys can provide a useful snapshot, of-ten no more than once a year (see Figure 6.3), of how employees are feeling. These kinds of surveys do not provide a more detailed and accurate picture of what employees are thinking and doing on a day-to-day basis. To do this, organisations must survey more regularly and focus those surveys on the messages being communicated and the opinion/behaviour desired from employees. A broad base of organisations, both in the public and pri-vate sector, conduct these kinds of ‘pulse’ surveys. Organisations like the BBC and British Gas have pioneered the process of taking regular employee pulse checks.
The process of developing and manag-ing the ‘annual’ satisfaction or engage-ment survey can often become the end in itself – not a means to an end. The speed and immensity of change organisations are experiencing, together with the time it takes to process survey data, means
n Yes
n No
46.97%53.03%
INCLUSION OF COMMUNICATIONAND ENGAGEMENT COMPETENCIES IN LINE MANAGER OBJECTIVES OVERVIEW
FIGURE 6.2
FIGURE 6.1 WHAT ORGANISATIONS MOST REGULARLY MEASURE OVERALL RESPONSES AND BY SECTOR
that actionable fi ndings can often be overtaken by events.
This is not to say that such set-piece surveys do not have their place. On the contrary, they can be a useful ‘tempera-ture check’ each year (or whenever they are conducted) – providing senior manag-ers a broad picture of how engaged their staff are. Such surveys are even more powerful when their results are tied to the company’s bonus or reward scheme. It provides a genuine pecuniary incentive (like few other things) for the organi-sation’s leadership to keep their staff engaged.
And yet, as Figure 6.0 shows, this is not something that happens very widely. Only 17% of respondents said their organisa-tions made a link between employee engagement and their organisation’s bonus / reward scheme. This compares with 69% who said they did not.
Another missing link?A slim majority of organisations fail to make communication and engagement competencies part of their line manage-ment objectives, with 47% of those surveyed place such competencies in their line manager’s objectives (Figure 6.2).
However, this masks a stark diff erence between the private sector on the one hand and the public and NGO sectors on the other (Figure 6.2a). While three in fi ve private sector communicators said their organisations placed such competencies in line manager targets, only a third of
28KARIAN AND BOX � iC SURVEY
SECTION 6MEASURING THE EFFECTIVENESS OF COMMUNICATIONS AND ENGAGEMENT
Channel eff ectiveness
61.02
0.8%
0.7%
0.6%
0.5%
0.4%
0.3%
0.2%
0.1%
0%Employee satisfactionand/or engaement
Employee understanding of key messages
Employee behaviour Relationship between employeeengagement and business performance
n Publicn Privatenn NGOn Total
69.91
34.82
25.05
5.26

29 KARIAN AND BOX � iC SURVEY
FIGURE 6.3 REGULARITY OF EMPLOYEE SATISFACTION OR ENGAGEMENT SURVEYS
Private Sector Public Sector
58%42%
INCLUSION OF COMMUNICATION AND ENGAGEMENT COMPETENCIES IN LINE MANAGER OBJECTIVES BY SECTOR
FIGURE 6.2A
n No n Yes
33%67%
public sector respondents said the same. NGO respondents gave a near identical response to communicators in the public sector.
Figure 6.2a may simply demonstrate a greater level of general objective and target setting for line managers in the private sector than in the public sector. In other words, private sector managers have a range of targets to meet – such as fi nancial or sales. A targets or objective-setting culture is more prevalent in the private sector. And with communication skills moving higher up the management agenda, they get included in the wider competency mix of the private sector line manager. As such, it seems likely that private sector fi rms now place a greater onus on their line management to have the necessary communications skills to engage and motivate their teams.
Regularity of satisfaction orengagement surveysEmployee satisfaction or engagement surveys are mainly conducted annu-ally or once every two years. Accord-ing to respondents, just over 50% of organisations check employee satisfac-tion/engagement through a formal survey process once a year (Figure 6.3). A further 26% conduct such surveys once every two years – and up to 15% of organisa-tions survey their employees once every three years or on an ad-hoc basis.
29KARIAN AND BOX � iC SURVEY
SECTION 6MEASURING THE EFFECTIVENESS OF COMMUNICATIONS AND ENGAGEMENT
Quarterly
70%
60%
50%
40%
30%
20%
10%
0%
n Publicn Privatenn NGOn All respondents
2.05
5.37
26.16
51.51
0.48
10.76
3.66
Half yearly Annually Once everytwo years
Monthly Weekly Ad-hoc/not regularly
Once in three years
58% OF PRIVATE SECTOR COMMUNICATORS SAY THEIR ORGANISATIONS
INCLUDE COMMUNICATION SKILLS IN LINE MANAGER OBJECTIVES.

SURVEY RESPONDENTSDEMOGRAPHY
SECTION 2SECTION 7
COMMUNICATIONSPLANNING
0
20
40
60
80
100
DO COMMUNICATORS PREPARE A FORWARD PLAN OF COMMUNICATIONS ACTIVITY FOR THE FOLLOWING YEAR
n Yes n NoPublic Private NGO All respondents
76.19
23.81
83.05
56.25
16.95
43.75
78.99
21.01
FIGURE 7.0
The fi rst thing to say on this subject is that planning is clearly a fundamental part of any communicator’s job and skills set. As was noted in Sec-
tion 3, communications planning is the most regular area of focus for commu-nicators. Four out of fi ve communicators reported that it is a key activity they were engaged in on a regular basis (Figure 3.4). This is reinforced by the fact that nearly four out of fi ve communicators said that their organisations prepare an annual forward plan of communications activity (Figure 7.0). Whilst there are marginally
more private sector than public sector communicators conducting this annual process, there is an interesting divergence when it comes to NGO communicators. Only 56% of NGO communicators say they create communications plans for the coming year (Figure 7.0).
One plan?A less positive picture was found when communicators were asked whether ac-tivity plans from across their organisations were integrated into one overarching communications plan.
Just over half of all communicators say
30KARIAN AND BOX � iC SURVEY
that their overview communication plans do not factor in wider activity from across their organisation (Figure 7.1).
The percentage of private sector com-municators who say that they integrate activity plans from across their organisa-tions (49%) is marginally lower than those who say they do not (51%). This compares with public sector communica-tors – where there is a smaller percentage (46%) who say they do create one com-munications plan that incorporates organ-isation-wide activity. A sizeable number of private sector organisations represented in the survey are relatively small – with 16% employing less than 250 compared with 8% in the public sector employing a similar number (see Figure 4.0). This may explain why there are marginally more private sector organisations than public sector ones with integrated communica-tions plans.
The ability to integrate communications plans and activity into one overarching plan in organisations with, say 25,000 staff and numerous departments / and functions, is a tough challenge. Similarly, many of the NGO communicators partici-pating in the survey work for organisa-tions that are smaller and less complex than private sector equivalents. Hence, the higher percentage (53%) stating that their NGO produced integrated communi-cations plans.
The lack of integrated planning across organisations highlights an obvious but important point. Communication plans that do not incorporate activity from across an organisation represented in the survey are useful up to a point but do not give communicators and organi-sational leaders the information neces-sary to make decisions on priorities. The only way this can be done is to have a comprehensive and integrated picture of what messages are being communicated, to whom, through which channels and at what time.
Clearly this is not easy to deliver - oth-erwise a larger number of organisations

ARE ACTIVITY PLANS FROM ACROSS THE ORGANISATION INTEGRATED INTO ONE COMMUNICATIONS PLAN?
0
10
20
30
40
50
60
FIGURE 7.1
n Yes n No
Public Private NGO All respondents
45.78
54.22
48.68
53.1351.32
46.88 47.75
52.25
SECTION 7COMMUNICATIONS � PLANNING
31KARIAN AND BOX � iC SURVEY
would be doing it already. Nonetheless, using new technology, some organisa-tions are putting in place online planning systems which enable such a ‘dynamic’ planning process. Dynamic planning enables an organisation to prepare and refi ne plans on an ongoing basis. British Gas is one example of where an online planning tool has had major impact on and improved the effi ciency of communi-cations planning.
In a relatively small organisation, this kind of integrated planning is not as much of a major issue. Communication plans which encompass activity from across the organisation can be updated with relative ease. However, the larger the organisation and the more complex the activity, the harder it is to keep an integrated communications plan up to date. A communications plan, even if it successfully integrates activity for the year or quarter ahead, will soon be out of date – and in many cases, irrelevant. The irony is that the larger and more complex an organisation is, the more robust and dynamic its planning processes need to be. In larger organisations, it is true to say that more activity takes place and there-fore there is a greater probability that this activity will change. This observation is, to some extent, borne out by the survey fi ndings relating to the regularity of the planning review process. There is some uniformity across sectors for those who review their plans on a half yearly basis (Figure 7.2). However, public and private sector organisations are far more likely to review their plans on a quarterly basis than those in NGOs, which tend to be smaller and have organisationally simpler structures. As such, NGOs are much more likely to only undertake an annual plan-ning review process.
FIGURE 7.2 REGULARITY OF PLANNING REVIEW PROCESS
60%
50%
40%
30%
20%
10%
0%Annually Half yearly Quarterly Monthly Fortnightly Weekly Ad-hoc/as
required/contuningnn Public n Private n NGO n All respondents
34
27
19
8
01
6

FIGURE 7.3 PERCEPTIONS OF COMMUNICATIONS PLANNING
COMMUNICATIONS � PLANNING
32KARIAN AND BOX � iC SURVEY
SECTION 7
Perceptions of planningThere is an interesting outlook on the
skills the respondents believe they have as compared to the skills of the team that work with / for them. 70% of communi-cators said they have strong communica-tion planning skills – whilst only 45% stated that the rest of their team had similarly strong planning skills (Figure 7.3). The diff erence could indicate self-belief, or it could refl ect the responses of some of the more senior communicators partici-pating in the survey.
Just over 40% of respondents were confi dent that their communications plans refl ected the organisation’s key goals. This could be interpreted as a worrying statistic. However, the word to notice in statement 3 of Figure 7.3 is ‘wholly’. Indeed, the fact that over 40% of communicators believe their organisation’s communications plans are wholly focused on the coming year’s goals should be interpreted positively. How many organisations can truly say that? With the incessant white-noise and confl icting political interests to be found in many organisations, developing a sin-gle-minded communications plan is a sig-nifi cant achievement. Of course, having a plan in such complex organisations is one
thing. Sticking to it is quite diff erent.One area of planning weakness relates
to the availability of a process to prioritise communications activity in an organisa-tion’s plans. Only 38% of communicators indicated that such a process existed in their organisation. This was exactly the same percentage who said that such a process did not exist in their organisation.
Furthermore, there are two factors which are critical to successful communi-cation planning:1. the support of an organisation’s leader-ship in ensuring plans are adhered to.2. the ability of a communications team to be fl exible in adapting plans to chang-ing circumstance.
My team has strongcommunications planning skills
I have strong communicationsplanning skills
Our communication plans arewholly focused on the organisation’s
key goals for the coming year
We have a process for prioritising communications acitivity in our plans
0% 20% 40% 60% 80% 100%
n 1 n 2nn 3n 4n 5
Planning: Communicators were asked if they agreed with a series of statements regarding the way communications were planned in their organisations. Their responses ranged from 1 (strong disagreement with a statement) to 5 (strong agreement with a statement).
13.56
26.02
12.91
12.23
31.26
34.04
31.03
25.55
39.36
25.09
29.76
24.29
11.96
4.39
20.47
27.12
5.82
10.82
3.86
ONLY 38% OF
COMMUNICATORS
SAID THAT THEIR
ORGANISATIONS
LACKED A PROCESS
WITH WHICH
TO PRIORITISE
COMMUNICATIONS
ACTIVITY.
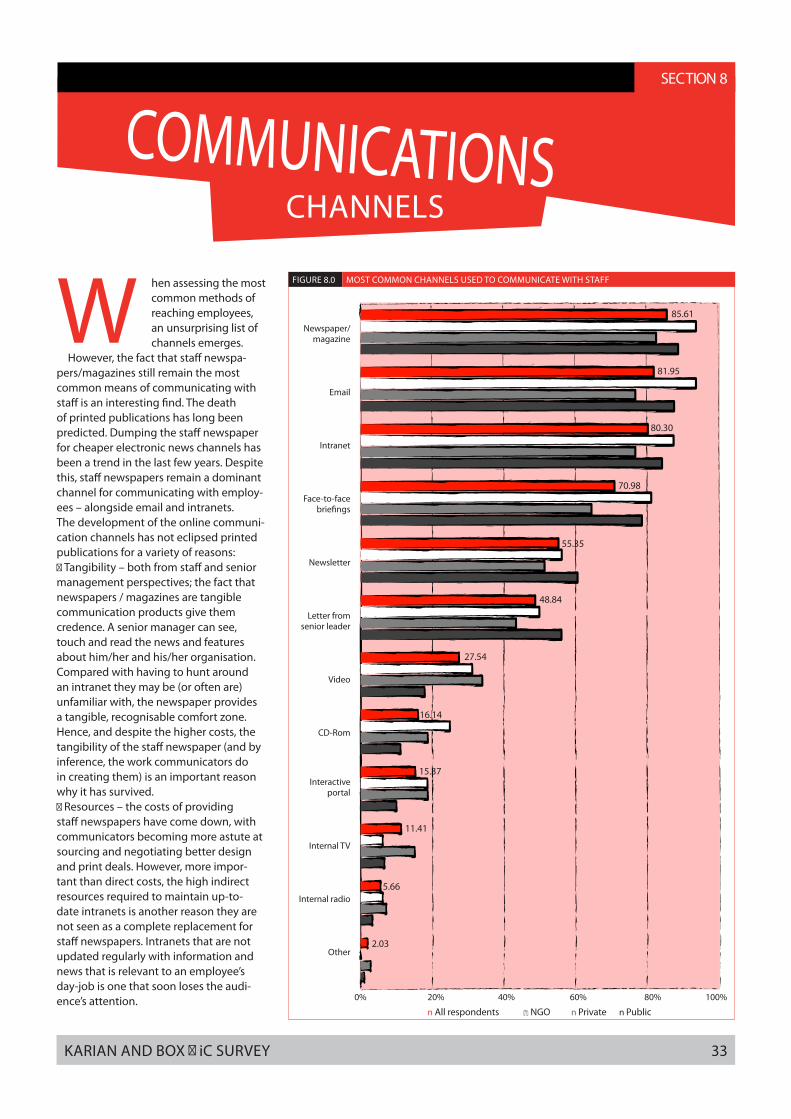
SECTION 2SECTION 8
COMMUNICATIONSCHANNELS
33KARIAN AND BOX � iC SURVEY
When assessing the most common methods of reaching employees, an unsurprising list of channels emerges.
However, the fact that staff newspa-pers/magazines still remain the most common means of communicating with staff is an interesting fi nd. The death of printed publications has long been predicted. Dumping the staff newspaper for cheaper electronic news channels has been a trend in the last few years. Despite this, staff newspapers remain a dominant channel for communicating with employ-ees – alongside email and intranets. The development of the online communi-cation channels has not eclipsed printed publications for a variety of reasons:� Tangibility – both from staff and senior management perspectives; the fact that newspapers / magazines are tangible communication products give them credence. A senior manager can see, touch and read the news and features about him/her and his/her organisation. Compared with having to hunt around an intranet they may be (or often are) unfamiliar with, the newspaper provides a tangible, recognisable comfort zone. Hence, and despite the higher costs, the tangibility of the staff newspaper (and by inference, the work communicators do in creating them) is an important reason why it has survived. � Resources – the costs of providing staff newspapers have come down, with communicators becoming more astute at sourcing and negotiating better design and print deals. However, more impor-tant than direct costs, the high indirect resources required to maintain up-to-date intranets is another reason they are not seen as a complete replacement for staff newspapers. Intranets that are not updated regularly with information and news that is relevant to an employee’s day-job is one that soon loses the audi-ence’s attention.
FIGURE 8.0 MOST COMMON CHANNELS USED TO COMMUNICATE WITH STAFF
n All respondents nn NGO n Private n Public
Newspaper/magazine
Intranet
Face-to-face briefi ngs
Newsletter
Letter from senior leader
Video
CD-Rom
Interactive portal
Internal TV
Internal radio
Other
85.61
0% 20% 40% 60% 80% 100%
81.95
80.30
70.98
55.35
48.84
27.54
16.14
15.37
11.41
5.66
2.03

SECTION 8
34KARIAN AND BOX � iC SURVEY
COMMUNICATIONS � CHANNELS
� Prioritisation – some communicators are becoming better at prioritising which channels are best suited for communicat-ing which kinds of information. Intranets and more dynamic, instantly updated electronic channels are better suited to news and information. However, they are not always best suited to more discursive features – those that help provide context and understanding. These are best ‘chan-nelled’ through staff newspapers and magazines.
The survival and revival of the newspa-pers and magazines has left many organi-sations with more than one key route for communicating with staff . The numbers in Figure 8.0 show a large percentage of organisations that have both an intranet and staff newspapers. Whilst costing more to maintain both, the diff erent routes are likely to be eff ective for reaching diff erent audiences for diff erent purposes.
EmailThe prevalence of email as an easy and convenient means by which to com-municate to staff is demonstrated by the statistics in Figure 8.0. Four in fi ve communicators say their organisations use email as a common form of commu-nicating to employees. The very conven-ience of emails makes them a positive tool for communicating quick information to audiences. Nonetheless, given the
relatively impersonal nature of email and the deluge of emails individuals receive, overuse of this channel is an issue.
Ironically, many organisations now have policies and training programmes encour-aging staff to use email less. However, en-couraging employees to not use email as often is made diffi cult if communicators continue to use it as a primary channel.
Multi media channelsJust over a quarter of the communicators surveyed reported that their organisa-tions use videos as a common route to communicate messages to staff (Figure 8.0). Whilst a relatively expensive option, video is a tool used by a third of private sector fi rms – double the usage in the public sector. CD-Roms are also used fairly commonly – both as an ad-hoc/ irregular channel and as an ongoing one (for example, in the form of an interactive multi media magazine for on-the-road British Gas engineers).
Perceptions of communication channels
A positive picture emerges from these results regarding the use of channels to communicate key organisational mes-sages. More than 50% of organisations (Figure 8.1, Statement 1) tend to both incorporate their organisation’s messages into internal channels and ensure that
Channel and message integration: Communicators were asked if they agreed with a series of statements regarding the eff ectiveness of their organi-sation’s communication channels. Their responses ranged from 1 (strong disagreement with a statement) to 5 (strong agreement with a statement).
n 1 n 2 nn 3 n 4 n 5
FIGURE 8.1 PERCEPTIONS OF COMMUNICATION CHANNELS
We ensure that internal channels alwaysincorporate our organisation’s key messages
We use our channels in an integrated way tomaximise the impact of our messages
Most of our organisation’s communication channels are interactive and enable employee feedback
We know what kind of publications/programmes our employees read/watch outside work
Written communications in ourorganisation are clear and concise
We have clear guidelines for deciding whichchannels are used for which purposes
6.27 9.83 20.76 37.01 16.14
7.24 15.20 22.71 36.99 17.86
9.25 32.45 29.32 6.9622.10
0% 20% 40% 60% 80% 100%
41.47 30.30 16.43 3.428.39
9.25 10.52 28.80 8.5547.94
7.99 23.67 24.61 12.5031.19
channels areintegrated to maximise the impact of those messages (Statement 2).
However, this positive perspective is not as strongly shared by communicators in the public sector. Whereas 60% of private sector communicators agree they use channels in an integrated way and incorporate messages in their channels, only 45% of public sector communicators can say the same. Furthermore, there is an interesting split between public and private sector organisations on the use of guidelines to decide how channels are used. Public sector organisations are marginally more likely than private and NGO sector ones to have such guidelines. Overall, 43% (Figure 8.1, statement 6) of all organisations surveyed say they have guidelines to help decide on which chan-nels are used for which purposes.

SECTION 8COMMUNICATIONS � CHANNELS
0
20
40
60
80
100
FIGURE 8.2 EXISTENCE OF A FACE TO FACE BRIEFING PROCESS
86.42
13.58
78.74
21.26
81.25
18.75
81.91
18.09
n Yes
n No
Public Private NGO All respondents
One way streets?The principle of ensuring that commu-nication channels are interactive and provide a mechanism for feedback is only fully practiced by up to 30% of communi-cators (Figure 8.1, statement 3). However, 42% of communicators do not believe that most of their channels allow for employee feedback.
Assessed by sector, it is clear that private sector employee channels are more interactive than public sector and NGO equivalents. Only 12.5% of NGO and 29% of public sector communicators feel most of their channels are interactive. This compares with 44% of private sector communicators who feel the same way about their channels.
(Not) A full understanding of audiencesThe survey highlighted the limited nature of communicators understanding em-ployee cultural and social traits. Just over 10% of those surveyed said they knew what kinds of publications and pro-grammes their employees viewed outside of work. Although this may sound some-what intrusive, the ability for organisa-tions to get a comprehensive understand-ing of their employees social mores is an important step towards identifying the most eff ective ways of communicating with them in work. It is true to say that employees do not walk into work and become completely diff erent people from who they are at home, and it is a point that many organisations overlook.
Knowing which newspapers your em-ployees read, what TV they watch, how they travel to and from work, how they socialise and so on is just as important as knowing whether they prefer access-ing information via your staff newspaper or your company intranet. And yet few organisations go to the lengths of fi nding this kind of information out. It is for the reasons given above (that seeking such information may be seen as intrusive and as being outside the work domain and therefore irrelevant) that companies often do not seek this information.
Face-to-face communicationsThe fact that face-to-face communica-tions is not the most common means of communicating with staff may, at fi rst glance, seem a worrying one. It is accept-ed that face-to-face briefi ngs, discussion and involvement between managers and their teams is the most eff ective means of getting messages across, understood and accepted. But it is not always the easiest to make happen.
Having regular face-to-face communi-cation is not always possible if staff are on the road, away from a regular place of work, or work from home. That is one of the main reasons the survey fi ndings puts face-to-face communication as the fourth most common – with 71% of respond-ents saying it is used regularly to commu-nicate with staff (Figure 8.0).
A more positive fi gure is that 82% (Fig-ure 8.2) of communicators say that their organisation has a face-to-face briefi ng process. What this tells us is that many
0
10
20
30
40
50
60
70
80
FIGURE 8.3 ARE BRIEFING PROCESSES MANDATORY IN ORGANISATIONS?
n Yes
n No
Public Private NGO All respondents
44.54
55.46
62.37
37.63 38.46
61.54
54.10
45.90
35KARIAN AND BOX � iC SURVEY
42% COMMUNICATORS
DO NOT BELIEVE
THEIR CHANNELS
GENUINELY ENABLE
TWOWAY INTERACTIVE
COMMUNICATIONS
WITH STAFF.
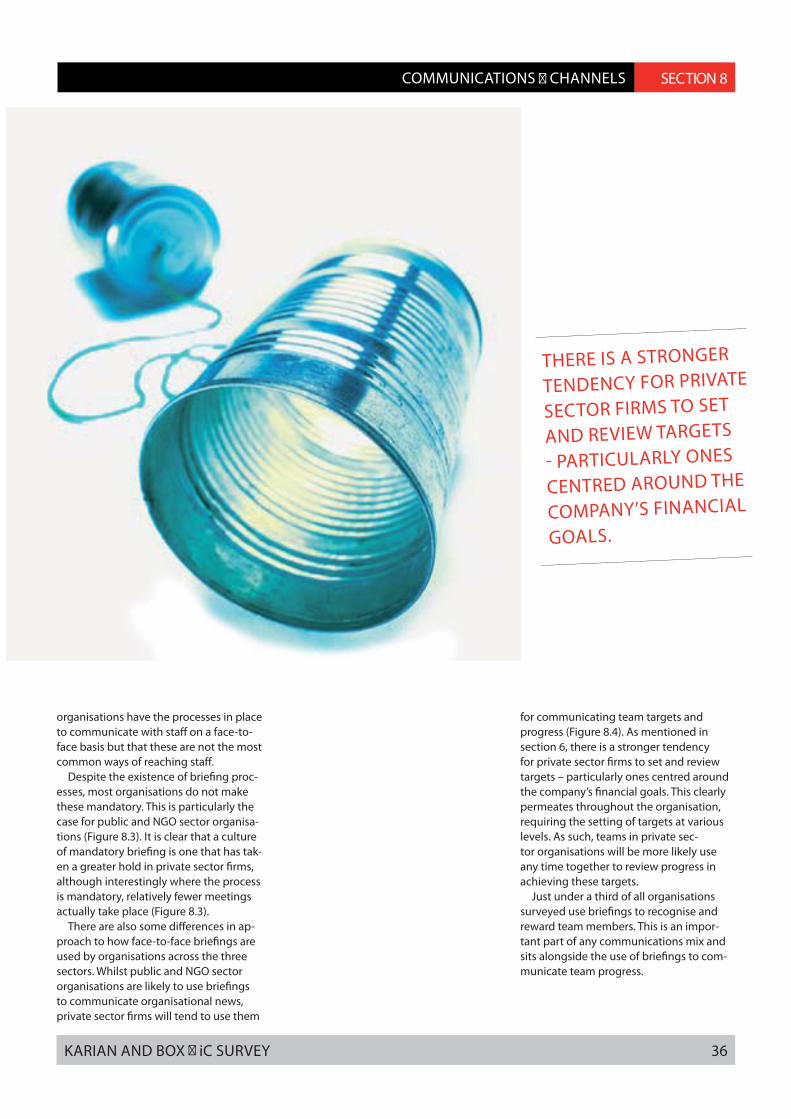
SECTION 8COMMUNICATIONS � CHANNELS
36KARIAN AND BOX � iC SURVEY
organisations have the processes in place to communicate with staff on a face-to-face basis but that these are not the most common ways of reaching staff .
Despite the existence of briefi ng proc-esses, most organisations do not make these mandatory. This is particularly the case for public and NGO sector organisa-tions (Figure 8.3). It is clear that a culture of mandatory briefi ng is one that has tak-en a greater hold in private sector fi rms, although interestingly where the process is mandatory, relatively fewer meetings actually take place (Figure 8.3).
There are also some diff erences in ap-proach to how face-to-face briefi ngs are used by organisations across the three sectors. Whilst public and NGO sector organisations are likely to use briefi ngs to communicate organisational news, private sector fi rms will tend to use them
for communicating team targets and progress (Figure 8.4). As mentioned in section 6, there is a stronger tendency for private sector fi rms to set and review targets – particularly ones centred around the company’s fi nancial goals. This clearly permeates throughout the organisation, requiring the setting of targets at various levels. As such, teams in private sec-tor organisations will be more likely use any time together to review progress in achieving these targets.
Just under a third of all organisations surveyed use briefi ngs to recognise and reward team members. This is an impor-tant part of any communications mix and sits alongside the use of briefi ngs to com-municate team progress.
THERE IS A STRONGER
TENDENCY FOR PRIVATE
SECTOR FIRMS TO SET
AND REVIEW TARGETS
PARTICULARLY ONES
CENTRED AROUND THE
COMPANY’S FINANCIAL
GOALS.

n 1 n 2 nn 3 n 4 n 5
Perceptions of line manager com-munication
Many organisations recognise the need for team leaders with strong, motiva-tional communication skills. Sadly, that recognition does not always translate into tangible investment or action.
Figure 8.5 fi nds that 50% of commu-nicators agreed with the statement that strong communication skills were key in a line manager’s role. However, barely a third of communicators say their organi-sations insist on line managers having communications/engagement in their per-formance targets. This is far outnumbered by those who strongly/ very strongly disa-greed with the relevant statement – with nearly 50% disagreeing with it.
Communicators do not believe that line managers have the necessary skills for ef-fective team engagement. Only 13% stat-ed that this was the case in their organi-sation – dwarfed by the 48% who stated the opposite (Figure 8.5). This issue has developed into one of the main bugbears of many an internal communicator. You can produce as many glossy publications and whizz-bang intranets, but how do you get line managers to play their role as eff ective communicators and motivators? This comes down to investment in team leaders and the development of skills. There is also an issue with the perception of what makes a line manager a good communicator. A team leader could be a good communicator – regularly talking with their team, engaging and motivating
SECTION 8COMMUNICATIONS � CHANNELS
37KARIAN AND BOX � iC SURVEY
FIGURE 8.4 DIFFERENT USES OF THE BRIEFING PROCESS
n Totalnn NGOn Privaten Public
60.9
80%
70%
60%
50%
40%
30%
20%
10%
0%Organisational news and information
52.83
10.72
30.18
40.2
6.7
Team targets and progress
Team training Team recognition and reward
Organisationalstrategy and goals
Other
FIGURE 8.5 PERCEPTIONS OF LINE MANAGEMENT COMMUNICATION
Line managers havecommunications and
engagement as part of their performance targets
Strong communications and engagement skills are key
requirements of a line mana-ger’s role in our organisation
Line managers have the skills necessary for eff ective team
communication/engagement
Line managers have theresources support and training
to develop their communica-tion skills where needed
18.80
0% 20% 40% 60% 80% 100%
30.7218.33 25.39 6.89
21.1819.367.42 26.44 23.58
40.1338.118.06 10.78
2.90
30.7936.697.39 19.31 5.80
them – without being good at conducting the formal cascade briefi ngs expected of them in many organisations. Hence, they are seen as poor ‘communicators’, when in fact they may be quite the opposite.
Nonetheless, compounding the issue is the lack of resources and support available to team leaders to develop specifi c com-munication skills. Only 25% of commu-nicators felt that their organisations pro-vided the necessary levels of support, with
45% (Figure 8.5) suggesting a signifi cant lack of support. What is the solution to this problem? Only a handful of organisa-tions will be prepared to invest signifi cant sums into genuinely developing their team leaders’ engagement skills-set. So, organi-sations need to fi nd lower-cost ways to educate and mobilise their line manage-ment army – and a few already are.
Line management communication: Communicators were asked if they agreed with a series of statements regarding the eff ectiveness of their organisation’s line management as communicators and regarding how line management was used as a communications ‘channel’. Their responses ranged from 1 (strong disagreement with a statement) to 5 (strong agreement with a statement).

SECTION 2SECTION 9
LEADERSHIP ROLE INCOMMUNICATION
38KARIAN AND BOX � iC SURVEY
0 20 40 60 80 100% %
FIGURE 9.0 PERCEPTIONS OF LEADERSHIP COMMUNICATION
A culture of open two way communication and feedback exists in my organisation
The leadership regularly seekfeedback and input from employees
The leadership put in the timeneeded to engage employees
The leadership are committed toengaging the workforce
The leadership 'walk the talk'leading by example
The organisations leadership communicate agreed, consistent messages
n 1n 2nn 3n 4n 5
8.50
27.75
25.52
9.95
36.00
23.61
23.744.
826.25
33.86
28.8813.14 17.7335.28
4.97
14.048.30 33.0332.32 12.31
25.0411.06 24.8732.76 6.27
14.886.54 35.1234.18 9.27
Leadership communication: Communicators were asked if they agreed with a series of statements regarding the eff ectiveness of their organisation’s senior leadership team as communicators and regarding how leaders thought and behaved in relation to staff engagement. Their responses ranged from 1 (strong disagreement with a statement) to 5 (strong agreement with a statement).
The fi rst thing to note from these responses is the relative ambiguity conveyed. More than any other set of statements through the survey, these con-
sistently scored high ‘3’s. This ambiguity can be explained by the picture that emerges from the statements in sec-
tion 9. In short, it is a picture where leaderships have the intent to genuinely engage employees - but not the will, the wherewithal or the time to actually deliver on that intent. Hence communi-cators may be hedging their bets about the eff ectiveness of their organisation leaders genuinely communicating and engaging staff .
Senior leaders will say the right thing. But management clichés about staff be-ing an organisation’s most valuable asset is often met with cynicism. In some cases, that cynicism is well placed. Numerous leaders will mouth platitudes of this kind without really thinking about it, let alone meaning it. But countless more, indeed the majority, genuinely do want to harness the power of their people. This survey shows us that 45% of communica-tors believe that their leadership really do
mean it (Figure 9.0, statement 4) . They are committed to engaging their work-force. But beyond staying on message (another positive fi nding), that is the sum-total of the good news.
Over a third of the people surveyed could not really say one way or another how committed their leadership was to either communication with or engage-ment of their people. This is a vital factor in whether communicators can truly play a role in improving an organisation’s performance. It is clear that if com-munications are not directly linked to an organisation’s objectives, measurement of its eff ectiveness is, at best, loose. This will continue to be the case, unless the leadership themselves can be engaged and convinced that communication will help them deliver active support in achieving their goals.
31% OFCOMMUNICATORS SAY
THEIR ORGANISATIONS
LEADERSHIP ‘WALKS
THETALK’ AND LEADS
BY EXAMPLE.

Open feedback channels, genuine two-way communication, face-to-face time engaging staff – all these are the preserve of a minority of organisations. Less then a third of communicators said their organi-sations had a culture of open, two-way communication. A similar number said their leadership sought out feedback.
These fi gures are not refl ective of the fact that many organisations do have two-way channels and feedback proc-esses. Indeed, 63% of communicators said (Figure 9.1) their organisation had a formal process to provide their leaders
with feedback. Nonetheless, what the responses to the statements in Figure 9.0 tell us is that these processes are not part of a wider cultural approach of genuine two-way communication.
Walking the talk?Less than a third of communicators surveyed (Figure 9.2) said their leaders participated in uncontrolled, ‘walk-the-shop-fl oor’ sessions as common practice. It could be argued that to get leaders out, talking to and engaging with their peo-ple, is near-on-impossible when organisa-
0
10
20
30
40
50
60
70
80
FIGURE 9.1 EXISTENCE OF A FORMAL FEEDBACK PROCESS TO LEADERS
n Yes
n No
Public Private NGO All respondents
58.42
41.57
67.54
32.46
56.25
43.75
63.36
36.64
0 20 40 60 80 100
0 20 40 60 80 100
FIGURE 9.2 METHODS OF FACETOFACE COMMUNICATION LEADERSHIP MOST COMMONLY ENGAGED IN
27.70
31.10
18.08
10.79
10.44
27.00
20.8922.88
27.17
3.94
8.94 26.7023.90 21.66 18.80
7.91 23.1219.65 27.24 22.07
Uncontrolled, ‘walk-the-shopfl oor’ discussions
Controlled focus groups
Two way, small group discussions
One way, mass briefi ngs
n 1n 2nn 3n 4n 5
SECTION 9
39KARIAN AND BOX � iC SURVEY
LEADERSHIP ROLE IN COMMUNICATIONS
Methods of leadership communication: Communicators were asked whether specifi c methods of face-to-face communication were commonly used by leaders. Their responses ranged from 1 (never) through to 5 (very commonly).
tions are going through so much change. Leader’s diaries are fi lled with board meetings, project meetings, operational review meetings, stakeholder discussions, and the like. When are they going to fi t in time to spend, at the very least, an hour or so a week with staff ?
Surely this has to be the point. At a time when so many organisations are undergoing fundamental change, they need to be out there with staff . More importantly they need to be seen to be out there. And that is where some of the solutions lie. For instance, a leader visiting a site doesn’t need to meet everyone. But she/he does need to ensure, via the good offi ces of internal communication, that staff at the site know about it and, in particular, know about the action taken by her/him as a result of issues raised. As every good PR person knows, perception is all.
In smaller organisations, a leader has a greater chance of being able to talk to large numbers of staff . A former President of the Rolls-Royce oil and gas division was legendary for being on fi rst name terms with all 1,000 of his staff in Ohio. That is not possible in organisations of tens of thousands. But that is where the skills of the internal communication team come into play. in helping getting leaders seen to be out there with staff . Of course, the perceptions need to be based on a heavy dose of reality.
In fact, the statistics in Figure 9.2 do not

tell an overly gloomy picture. In addition to a third of communicators saying their leaders commonly conduct informal walk-abouts, 46% said their leaders commonly engage in two-way discussion groups. However, a disappointing statistic is the prevalence of one way, mass briefi ngs, where leaders talk at staff . 45% of com-municators suggested that these were the most common means of face-to-face contact staff head with their leaders.
Regularity of face-to-facecommunicationsFigure 9.3 shows that over 30% of com-municators said their leaders engaged in face-to-face communications on a quarterly basis. While private sector lead-ers are marginally more likely to conduct quarterly face-to-face communications,
SECTION 9
40KARIAN AND BOX � iC SURVEY
LEADERSHIP ROLE IN COMMUNICATIONS
public sector and NGO leaders tend towards monthly.
A poorer picture emerges when we see in Figure 9.3 that 34% of communi-cators said their leadership engaged in face-to-face communication once every 6 months or less. Indeed, within this group, 22% said their leaders conducted such communications less than once every 6 months.
FIGURE 9.3 REGULARITY OF FACETOFACE COMMUNICATION LEADERSHIP ENGAGE IN
40%
35%
30%
25%
20%
15%
10%
5%
0%
More than oncea week
Weekly Fortnightly Monthly Quarterly Half yearly Less than once every 6 months
3.4
6.2
3.5
24
31
12
22
n Publicn Privatenn NGOn Total

41KARIAN AND BOX � iC SURVEY
CONCLUSION
Revolution in our workingenvironmentsThe fi rst is the unprecedented scale and pace of change that communicators across all sectors are contending with. Organisational, structural, market-driven, cost-focused change – all have a signifi -cant impact on internal culture and these are the primary challenges facingcommunicators now and for the foresee-able future.
The survey further highlights the limited impact communicators are having on en-suring that this change is communicated eff ectively.
The internal communication profession has developed in the last 10 years. None-theless, the pace of organisational change has outstripped the profession’s own change. Its ability to provide the kind of advice and support needed is insuffi cient for the nature of the challenges facing much of industry and the public sector.
In short, many organisations have the internal communication skills sets and tools needed for a very diff erent kind of working environment. Many apply the communication approaches and tech-niques more appropriate to a ‘business as usual’ environment – at a time when they should be supporting organisations as they face wholesale transformation and revolution.
It is not that these techniques and ap-proaches are wrong. They are simply inad-equate for the situations communicators are increasingly being asked to deal with.
A ‘box-ticking’ cultureThe good news is that internal communi-cation is a profession that has many of the basics in place. When assessing whether they have the right internal communica-tion strategy and infrastructure for engag-ing their staff , organisations are able to tick many of the right boxes.
Beyond a limited number of organisa-
tions, however, that is as far as it goes. Boxes are ticked, requirements are fulfi lled – job done.
We would suggest that the ‘job’ is not done. The limited eff ectiveness of what communicators are doing and how that impacts on employee understanding, opinion and behaviour at a time of major change is evident.
What does this box-ticking culture look like? Here are 3 common examples that emerge from the iC 2006 research.n There is a communication strategy that is linked to the organisation’s own strategy. However, communicators are not able to translate this organisational strategy into messages that staff can relate to, understand in personal terms, believe in or support.n There is a communication planning sys-tem in place. But it is limited to the central activity and does not include the broader organisational activity. It is diffi cult to drill down by message, audience, segment and the like. As such, communicators seem unable to genuinely plan or manage mes-sages.n There is an annual satisfaction survey and occasional use of online pulse surveys. Yet rarely is there a systematic means to regularly check employee awareness, understanding, opinion and support of key messages.
Getting genuine cut-through with and engagement of staff is clearly a priority for most organisations. Nonetheless, for many, that ‘cut-through’ is simply not happening. This could be happening for a number of reasons:1. Organisational culture – a lack of will from many organisational leaders to go beyond the limited scope of a box-tick-ing culture. Creative approaches that are genuinely inclusive of and involve staff are outside the comfort zone of some organi-sational leaders. This is compounded by the inability or unwillingness of communi-

CONCLUSION
42 KARIAN AND BOX � iC SURVEY
cators to challenge that conservatism and educate leaders on the art of the possible – what can be achieved if the organisa-tion is willing to communicate creatively with and involve staff . 2. Limited capabilities – a lack of the right competencies and behaviours needed to enable the translation of com-munication strategy into activity that hits home with staff . Many communicators have not yet developed the competencies necessary to do this. The focus has been on developing skills associated with build-ing / managing communication strategy and infrastructure. This has been an important part of the development of the internal communication profession. But it has inhibited the development of the broader skills set required to develop and deliver communications that genuinely make a diff erence. 3. Diff erent focus – the focus of many communicators has been on getting the basics in place and on delivering ‘busi-ness as usual’ communications. This has left many communicators with little time to acquire the skills outlined above. Most communication consultancies and industry suppliers are also focused on supporting organisations in getting the basics right.
Without the right culture, without the necessary skills set, time or support, it is understandable why most organisations are still focused on getting the basics right and not moving up a gear. That is the challenge most will face over the next 5 years.
The profession’s next phase of developmentThe fact that many organisations are still getting the basics right is not necessarily a problem. It simply refl ects the evolving nature of the internal communication profession. After all, it is still a young one. Compared with the marketing or
PR industries, internal communication is still at a relatively early stage in terms of its journey of professional development, delivery and credibility.
The internal communication profession has already come a long way in the last 10 years. It has shifted focus every fi ve years or so. n The early 1990s saw a focus on internal communicators getting their strategies right – and having them aligned to or-ganisational strategyn The late 1990s saw a signifi cant growth in the numbers employed in the profes-sion and a focus on professional skills and developmentn The fi rst half of this decade has been more concerned with developing, re-shaping and improving the infrastructure communicators use – for example, install-ing and/or refi ning planning and meas-urement systems.
Not all organisations have followed this linear trajectory. Some will be at diff er-ent stages. Some are coming new to internal communication as a professional resource in their organisations. Many are going through the inevitable cycle many organisations go through – setting up the internal communication function, building and developing, hitting an organisational trauma, cost-cutting and downsizing, fol-lowed by re-building and re-shaping.
The second half of this decade (and beyond) will be about taking the industry onto the next level of development.
SECTION 10
THE INTERNAL COMMUNICATION
PROFESSION HAS ALREADY COME A LONG
WAY IN THE LAST 10 YEARS. IT HAS
SHIFTED FOCUS EVERY FIVE YEARS OR SO.

The next phase for the professionTalking the language of our organisations, matching communication structures to or-ganisational structures (through business partnering, for instance) are vital com-ponents to building a credible functional profession. But this kind of functional de-velopment only takes the profession part of the way. It does not necessarily lead to an actual impact on employee opinion and behaviours. That requires a diff erent kind of working, diff erent communication approaches and, ultimately, a diff erent culture within the profession.
Understanding changeCommunicators can thrive on the fact that organisations are facing unprec-edented levels of change. But they need to see this as an opportunity and not a daunting prospect. And they need to be ready for it.
The next stage will involve the internal communication profession learning from and applying many of the approaches used by those working in change man-agement.
The rigorous training of senior internal communicators in change management techniques will not be enough. Middle managers need to be grounded in these approaches and techniques earlier in their careers. The profession needs to access the training and resources needed to enable them to talk the language of change management. The alternative for many internal communicators would be to continue to be seen as glorifi ed ‘post offi ce’ clerks.
A marketing-led approachA further path for many internal commu-nicators will be to learn from and borrow the best ideas and techniques of the marketing profession.n Getting a deep and sophisticated un-derstanding of audiences – using an audi-ence’s prejudices and levels of understand-
ing and awareness as the starting point for any communication which is aiming to achieve an organisation’s objectives. n Creative use of narratives – telling compelling stories which audiences can understand and relate to. Using simple, ‘rationale’, easily digestible and highly personal narratives to engage staff both intellectually and emotionally.n Inspiration and imagination – organisa-tions need to move their communications focus from beyond the purely ‘logical’ one. Internal communicators need to learn the art of using emotion to engage and involve staff .
There are some who have already set off on the journey of this next phase of the profession’s development. Some know that this is the direction they need to be heading in. Most, however, do not currently have the necessary capabilities and/or leadership support to move in that direction as quickly as they would like. There are others who are yet to be convinced that they even want to begin the journey, but are open-minded and willing to learn.
Of course, in every profession, there will be those that will resist change. There will be the point of view that pursuing a pseudo-marketing approach cannot and will not realise the internal communica-tion profession’s primary objective: help-ing organisations to engage staff in order to achieve organisational objectives and improve performance. They are both right and wrong.
Why right? On their own, using creative internal communication and marketing techniques will not achieve a desired objective. The right HR proc-esses, incentives, reward and recognition mechanisms, leadership behaviours and much more need to be in place to deliver real engagement with an organisation, its brand, its strategy and goals.
43 KARIAN AND BOX � iC SURVEY
CONCLUSION SECTION 10
A FUTURE PATH FOR MANY INTERNAL
COMMUNICATORS WILL BE TO LEARN
FROM AND BORROW THE BEST IDEAS AND
TECHNIQUES OF THE MARKETING PROFESSION.

Why wrong? Creating high-impact communications that hit home, that are fundamentally based on your audience’s prejudices, and that raise awareness, understanding, support and inspiration are the key towards getting real staff engagement and action. For example marketeers cannot impact the soaring wholesale price of coff ee beans. But they help mitigate the eff ect of this variable on sales of coff ee by clever use of marketing techniques that can keep people buying coff ee. Similarly, communicators are there to help create and shape communications that make a diff erence to staff opinion and behaviour – factoring in the range of other variables that also impact what staff think and do (such as those outlined previously).
What does all this mean for the profession?This next phase of the profession’s de-velopment will see a wholesale ‘raid and plunder’ on the marketing profession by organisations wanting to further develop their internal communication teams and activities. This means:n There should and will be a transfer of personnel from marketing into internal communication. This can be a positive and symbiotic process – as many market-ing teams shrink, good marketeers can broaden their skills set or acquire a new adopted profession. Good internal com-municators should welcome the infl ux as it will hasten new, more creative ways of working.n Applying a range of skills and ap-proaches used in both change manage-ment and external marketing to the way internal communicators do their jobs. More eff ective audience segmentation and better market research – these are only some of the changes that will help internal communicators hone their exist-ing competencies to create truly eff ective communications.n A new way of thinking. Applying the kinds of creative thinking used in advertis-ing, direct marketing and the like will enable communicators to better translate complex organisational concepts, issues and messages into powerful, bite-size, verbal and visual representations that staff understand and relate to.
There should also be a further develop-ment and improvement of the profes-sion’s infrastructure and tools. Planning and measurement need particular focus.
n The need for integrated, ongoing, year-round dynamic planning is still a bugbear for many organisations. Solutions exist but they are not always cost-eff ective and are not always user-friendly.n The need for dynamic, regular metrics that give organisations a much better gauge of what their employees are think-ing and doing. These cannot be self-selecting pulse checks that give skewed results or annual temperature checks (useful for a strategic understanding of where employee satisfaction or engage-ment).
And fi nally…At a time of change and uncertainty, internal communication faces a test of its credibility and ability to deliver. This should not be seen negatively. On the contrary, it should be embraced. The pro-fession has travelled far in the last dec-ade. And the challenges of major change posed to internal communicators are the opportunity they need to travel even further towards professional credibility.
Just as lawyers see mergers and acquisitions as lucrative and professional opportunities, so too should internal communicators view the changes facing our organisations as an opportunity. We have the chance as a profession and as individuals to make a positive and meas-urable diff erence to the performance of those organisations.
This will only happen if we go beyond simply ‘ticking boxes’ - thinking and working more imaginatively. We must take more radical approaches to ensure we engage the hearts and minds of our organisation’s employees.
With change so prevalent, internal communication is vital to the success of so many organisations. As such, a lot rides on what we do and how we do it.
Thus, one thing is clear; this is an exciting time to be a communicator – and particularly an internal communicator.
44KARIAN AND BOX � iC SURVEY
CONCLUSION SECTION 10
WITH CHANGE SO PREVALENT, INTERNAL
COMMUNICATIONS IS VITAL TO THE
SUCCESS OF SO MANY ORGANISATIONS.
AS SUCH, A LOT RIDES ON A WHAT WE
DO AND HOW WE DO IT.

45KARIAN AND BOX � iC SURVEY
SECTION 11
FOOTNOTES
4 Page 21Note that the percentages in Figure 4.0 represent percentages of organisations represented in the survey and not indi-vidual communicators.
4 Page 24Net positive or negative results relating to perception mean the diff erence between those who agree / strongly agree with a statement (those scoring a statement a 4 or a 5) and those who disagree / strongly disagree with a statement (those scoring a statement a 1 or a 2). For this purposes, we exclude those who give a statement a 3 as this is seen as a neutral score.
4 Page 24In Table 5.0 the four categories of agree-ment (agree and strongly agree) and disa-greement (disagree and strongly disagree) are collapsed into 2 general ones for easier comparisons
4 Page 24The statistics relating to perceptions by sector are not provided in detail as there is a general uniformity on most of the statements. We have only highlighted those areas where that uniformity does not exist.