Embed Size (px)
Citation preview

Infrastructure Blue Ribbon Commission
Final Report
Palo Alto’s Infrastructure: Catching Up, Keeping Up, and Moving Ahead
December 22, 2011


Palo Alto’s Infrastructure Catching Up, Keeping Up, and Moving Ahead
INFRASTRUCTURE BLUE RIBBON COMMISSION
Final Report
December 22, 2011

IBRC FINAL REPORT ii
Acknowledgments Seventeen commissioners participated in the Infrastructure Blue Ribbon Commission (IBRC), with staff liaisons assigned to each committee. The participation and efforts of all and their commitment to our community has been extraordinary.
IBRC Co-‐chairs Leland Levy, Ray Bacchetti Staff liaisons Steve Emslie, Richard Hackmann
Above Ground Committee Mark Michael, chair David Bower Brent Butler Bob Stillerman Gary Wetzel Staff liaisons Steve Emslie,
Phil Bobel Finance Committee Mark Harris, chair Stephen Levy John Melton Jim Olstad Alex Panelli Greg Tanaka Staff liaisons Lalo Perez,
Joe Saccio Surface Committee James Schmidt, chair Marc Berman Ralph Britton Patricia Markevitch Staff liaisons Mike Sartor,
Elizabeth Ames
Infrastructure Management Working Group Ralph Britton, chair Leland Levy Stephen Levy Jim Olstad Alex Panelli Bob Stillerman Staff liaison Phil Bobel
Public Safety Working Group Ray Bacchetti, co-chair Mark Harris, co-chair David Bower Brent Butler James Schmidt Staff liaisons Mike Sartor,
Elizabeth Ames MSC/Embarcadero East Working Group Mark Michael, chair Marc Berman Patricia Markevitch John Melton Greg Tanaka Gary Wetzel Staff liaison Matt Raschke
Finance Working Group Stephen Levy, co-chair Jim Olstad, co-chair Mark Harris John Melton Staff liaisons Lalo Perez,
Joe Saccio Futures Working Group Bob Stillerman, chair Mark Michael Alex Panelli Greg Tanaka Gary Wetzel Staff liaison Steve Emslie And with gratitude for the additional support of these staff members: Karol Galucci Nancy Nagel Lisa Navarett Danille Rice
Many other staff members contributed significantly to this effort: Daren Anderson, Greg Betts, Holly Boyd, Matt Brunnings, Dennis Burns, Catherine Capriles, Miguel Chacon, Charles Cullen, Kenneth Dueker, Valerie Fong, Pete Hazarian, Dennis Huebner, Judge Luckey, Tarun Narayan, Murdo Nicolson, Tatiana Pham, Jaime Rodriguez, Cara Silver, Joe Teresi, Steven Turner, Curtis Williams, Mike Wong.
While all have done great service, we wish especially to acknowledge: Beverly Cory, our editor who, at a late date, waded into a mountain of prose and numbers and helped bring order, accuracy, look, tone, and as much narrative style as a document with 17 authors will permit. Phil Bobel, our link to the Public Works department who was with us every inch and dollar of the way explaining, listening, and affirming the significance of our work. Richard Hackmann, liaison to the co-chairs and our mainstay from the City Manager’s office who did everything we asked of him with intelligence, grace, and a commitment to this 14-month effort.

IBRC FINAL REPORT iii
Contents
Executive Summary .................................................................. 1 Introduction ............................................................................. 19 1. Infrastructure Management ................................................ 25 2. The Cost of Catch-up and Keep-up ..................................... 32 3. Public Safety Facilities ....................................................... 40 4. Municipal Services Center/Embarcadero East Corridor ..... 51 5. Finance ................................................................................68 6. The Future ...........................................................................93 Commentaries and Dissents ...................................................105 Appendices A. City of Palo Alto: Civic Infrastructure ............................ 121 B. City Council Charge to IBRC ......................................... 123 C. Description of Infrastructure Database ........................... 124 D. Report of the Surface Committee ................................... 125 E. MSC Area Usage by Department ................................... 139 F. Sea Level Rise Projection ............................................... 140 G. Freeway-Visible Auto Dealerships ................................. 141 H. Working Paper on Cubberley Site .................................. 142 I. Other Long-Term Funding Alternatives ......................... 149 J. Comparison of Tax Rates and Recent Election Results 151 K. List of City Structures and Their Age ............................. 155 L. Learning from Other Progressive Cities ......................... 156 M. Technology Considerations ............................................ 159 N. Future Ideas for Consideration ........................................ 162 O. Summary: Futures Working Group ................................ 164

IBRC FINAL REPORT iv

IBRC FINAL REPORT 1
Executive Summary
In October 2010, the City Council appointed a 17-member Infrastructure Blue Ribbon Commission (IBRC) to look out 25 years and tackle a four-part challenge. Our conclusions, summarized briefly below, are the basis for this report.
What is the state of Palo Alto’s infrastructure? Over the years Palo Alto has built up a wide array of infrastructure
assets. In the competition for civic funds, infrastructure has suffered. As a result, the City has underfunded its infrastructure maintenance in
the amount of over $2 million per year. IBRC refers to these as keep-up needs.
At the same time, the City permitted the infrastructure underfunding to accumulate, building a backlog of catch-up needs totaling over $40 million.
Five major facilities, including the police headquarters and two fire stations, have been allowed to fall below current standards of safety, capacity, and functionality.
What can we do to resolve these problems? Increase current levels of spending on catch-up and keep-up by
$6 million per year. Replace the existing Public Safety Building and replace two older fire
stations at Rinconada Park and Mitchell Park at an estimated cost of $79 million.
Fund a major study of the Municipal Services Center and the region along East Bayshore and Embarcadero East to assess the new & replacement needs and the area’s commercial and civic potential. The eventual cost is currently estimated at $100 million.
How can the City prevent a recurrence in the future? Create an Infrastructure Management System that will track the
condition and use of all City infrastructure and provide the basis for budgeting and longer-range projections.

EXECUTIVE SUMMARY
IBRC FINAL REPORT 2
Create a single point of responsibility for infrastructure assessment, management, budgeting, and accountability.
Implement policies and practices that assure accountability for eliminating catch-up, maintaining keep-up, and planning ahead for the kind of infrastructure the community needs and expects.
How will it be paid for? We present four alternatives for the Council’s consideration. Three alternatives include a tax increase to offset annual needs and
long-term borrowing to finance new facility construction. Should the current Cubberley contracts with the Palo Alto Unified
School District be terminated in the near future, realized savings could be used in place of a tax increase.
In its final section, the IBRC report looks to the future: What would it take to keep Palo Alto at the leading edge of progressive cities?
IBRC-‐Recommended Funding Alternatives
Alternative 1-‐A
Public safety facilities funded by a General Obligation (GO) bond (requiring a two-‐thirds vote).
MSC complex funded by a utility revenue bond (for Utilities Department occupancy) and an additional source, such as rental income from potential private commercial users.
Catch-‐up, keep-‐up, and other new & replacement funded by a 3/8 percent sales tax increase (requiring a majority vote).
Alternative 2-‐A
Public safety facilities funded by a GO bond.
MSC complex funded by a utility revenue bond and an additional source (such as rental income).
Catch-‐up, keep-‐up, and other new & replacement funded by Cubberley expense savings.
Alternative 1-‐B
Public safety facilities funded by certificates of participation (COPs) paid with funds from a parcel tax (requiring a two-‐thirds vote) plus a business license tax (requiring a majority vote).
MSC complex funded by a utility revenue bond and an additional source (such as rental income).
Catch-‐up, keep-‐up, and other new & replacement funded by a 3/8 percent sales tax increase.
Alternative 2-‐B
Public safety complex funded by COPs paid with Cubberley expense savings or by a 3/8 percent sales tax.
MSC complex funded by a utility revenue bond and an additional source (such as rental income).
Catch-‐up, keep-‐up, and other new & replacement funded by a 3/8 percent sales tax or with Cubberley expense savings.

EXECUTIVE SUMMARY
IBRC FINAL REPORT 3
The Commission’s Approach
The City’s infrastructure assets have a finite life. How long they last is a function of how they get used, how close to obsolescence they drift, and how well we take care of them. It is this last – how well we take care of them and, to a lesser extent, how the City’s needs change – that determines the annual upkeep and periodic investments required of the City and its residents.
Palo Alto has fallen behind in this responsibility. Studies have identified parts of the problem, but none have laid out a comprehensive solution. The City Council charged the Infrastructure Blue Ribbon Commission (IBRC) as follows:
to provide a recommendation to the City Council on infrastructure needs, priorities, projects and associated funding mechanisms to address the infrastructure backlog and future needs. (Appendix B)
IBRC decided to look out 25 years. Our work, particularly financial figures, however, is most accurate when applied to the near future.
In preparing this report, we have appreciated the willing and strong support from City staff. The Commission gathered data, visited nearby cities, and methodically explored problems, circumstances, and solutions. The result: 20 recommendations, grouped by section within the report.
Three terms are used throughout this report to name aspects of infrastructure responsibility that require differing solutions:
Catch-up - Sometimes called deferred maintenance or backlog, this term refers to the accumulation of needed repairs for which remedies are overdue. Deferred maintenance can increase repair costs, shorten component lifetimes, and lead to emergency repairs.
Keep-up - This category combines two elements:
Operating maintenance refers to routine upkeep such as repairing broken equipment, servicing machinery, filling potholes, painting, and other routine and preventive maintenance that is required to keep the facilities, parks, streets, and sidewalks safe and operational.
Planned maintenance refers to (1) a systematic approach to repairing or replacing building systems such as roofs, HVAC, electrical, and plumbing systems to maintain and extend the life of the facility and keep the building in good operating condition; and (2) for streets, sidewalks, parks, and other surface assets, a systematic repair and replacement cycle designed to achieve targeted levels of functionality.

EXECUTIVE SUMMARY
IBRC FINAL REPORT 4
New & replacement - This category refers to rehabilitating or reconstructing substandard buildings as well as to building new facilities to either replace existing ones or expand the City’s capital assets.
In assessing and projecting costs and revenues, the Commission has used constant 2011 dollars throughout. As the City proceeds with efforts to resolve its budget challenges, budget projections and inflation rates will change. Timing is another variable. When can various elements in our recommendations reasonably move forward? In the sections on Infrastructure Management and Finance, we propose tools for dealing with these key variables and for adjusting future projections.
We define infrastructure as just about everything the City owns and maintains that does not move, with the exception of equipment and supplies. A summary list can be found in Appendix A.1
IBRC has seen its task as both quantitative – to assess the extent of our community’s infrastructure and its annual and long-term cost – and qualitative – to honor the role infrastructure plays in sustaining a community in which people want to live, work, raise a family, transact business, enjoy themselves, and retire.
Section 1: Infrastructure Management
Problem Identification and Findings The problem that gave rise to the Commission is the same problem that demonstrates the need for more systematic infrastructure management: significant unfunded City infrastructure needs. As we began our task and asked for data on the full picture of our infrastructure, we found that the staff did not have such a picture ready at hand. They had to construct it bit by bit, scouring various data sets to identify all the relevant information. Both IBRC and staff agreed that a more effective and robust Infrastructure Management System (IMS) was needed. Further, it had to be the backbone of any effort to assure that infrastructure needs would annually be front and center in capital budgeting.
In addition, we found these deficiencies and have made recommendations to address them:
1 IBRC elected not to include the Utilities, the airport, nor the other Enterprise Funds, except insofar as their work overlapped with other City departments involved in infrastructure, such as Public Works for street maintenance. Because Utilities focuses sharply on the infrastructure for which it is responsible and has protocols for maintenance, along with oversight by the Utilities Advisory Commission, it was not part of the problem that led to the formation of IBRC.

EXECUTIVE SUMMARY
IBRC FINAL REPORT 5
Infrastructure funding lacks an imperative priority in the annual City budgeting process.
There is no single point of responsibility for infrastructure management, funding, and accountability.
Dedicated funding would better match the continuing cost of infrastructure keep-up than does annual budget competition.
Software for the IMS must link easily to the City’s other management software systems.
Recommendations The demands of infrastructure maintenance cannot be ignored. They do not go away. Collectively they represent an enormous investment, and the stewardship of that investment is one of the primary responsibilities of the City Council and City management. To strengthen this management, IBRC makes seven recommendations:
1-1 Establish an Infrastructure Management System (IMS) to maintain an up-to-date inventory of the City’s infrastructure, its catch-up and keep-up needs, and available funding. Such a management tool will support ongoing staff and Council attention to infrastructure budgeting, planning, and accountability. This system should integrate with programs the City now uses to manage infrastructure and finance.
The Commission has outlined in Appendix C the elements of an IMS it believes are necessary.
1-2 Establish a single point of responsibility, at a high level, for infrastructure management. This position should be within the City Manager’s office.
In IBRC findings, diffuse responsibility was a common thread. Creating a senior position in the City Manager’s office is one key way to focus responsibility.
1-3 Require that an IMS summary report be presented to the City Council as the lead element in each year’s General Fund Budget review, and that it highlight any gaps in infrastructure funding.
Because infrastructure includes the bulk of the City’s capital assets, a report on the status of those assets and the resources required to maintain them should be plainly and transparently put forth at the start of each budget cycle.

EXECUTIVE SUMMARY
IBRC FINAL REPORT 6
1-4 Establish a permanent public commission, appointed by the City Council, to give ongoing oversight to infrastructure maintenance, to consider and make recommendations regarding future infrastructure needs, and to assure proper attention to the City’s physical assets. This commission should have as its staff liaison the Director of Planning.
Another way to focus responsibility is to provide a voice for infrastructure at the level of a Council-appointed commission, charged with assuring the proper upkeep, development, and stewardship of the City’s capital assets.
1-5 Establish a policy that the City Manager, in coordination with the public commission on infrastructure, report to the City Council at least twice a year on infrastructure.
With a working IMS and more stringent infrastructure management, the Council should expect focused reports on how well that system is functioning and what problems still exist.
1-6 Dedicate sufficient funding to infrastructure on a long-term basis.
Dedicated funding is the partner of good management and the right policies.
1-7 Mandate periodic audits of infrastructure maintenance by the City Auditor.
IBRC was impressed by the City Auditor’s Infrastructure Report Card (2008). We believe that reports similar in scope and depth will help keep infrastructure stewardship front and center.
Section 2: The Cost of Catch-‐up and Keep-‐up
Problem Identification and Findings Though assembling data in spreadsheet form was arduous and time-consuming, staff produced extensive tabulations on the magnitude of the catch-up and keep-up obligations. IBRC members, working with staff, evaluated these numbers. Through a collaborative process, we reduced totals where feasible and increased them where necessary. The resulting numbers represent IBRC’s best judgment. This section of the report identifies the revenue required – specific investments for those needs that are one-time in nature, and continuing funding for those that are ongoing.
Catch-up or deferred maintenance. The annual shortfall in keep-up has led to a deferred maintenance backlog that now amounts to $41.5 million.

EXECUTIVE SUMMARY
IBRC FINAL REPORT 7
If unattended, this backlog will result in increased maintenance costs, shortened component lives, and increased emergency repairs. A complete list of catch-up items appears in section 2. IBRC recommends that the catch-up needs be addressed at approximately $4.2 million per year over the next ten years. Thereafter, this same amount should be devoted to the other new & replacement needs that are anticipated.
Keep-up or annual maintenance. The 2011–12 budget allocates $30.0 million to operating maintenance and the CIP (Capital Improvement Projects). Commission-assembled data, however, indicates that to truly “keep up,” the total should be $32.2 million per year. At 2012 funding rates, this results in an estimated annual shortfall of $2.2 million into the foreseeable future.
The keep-up need includes an average of $1.5 million in “pop-up” items introduced in the midst of each average budget year which take funding from planned projects and create more catch-up. This figure is derived from staff analysis of several years of budgeting and spending; on average, $1.5 million a year has been allocated for projects not initially budgeted.
New & replacement. IBRC recommends five facilities for upgrade or replacement: the Public Safety Building, Fire Stations 3 (Rinconada) and 4 (Mitchell Park), the Municipal Services Center, and the Animal Services Center. These facilities are listed as “major projects” in table 1-1 and are discussed in sections 3 and 4 of this report. Table 1-1 also lists “other projects” for action after 2021.
Recommendations Recommendations for financing these needs are found in section 5.

Table 1-‐1 City of Palo Alto Infrastructure Management System Summary of Needs, Funding Sources, and Funding Gaps (in millions of dollars) -‐-‐-‐-‐-‐-‐-‐-‐ CATCH-‐UP -‐-‐-‐-‐-‐-‐-‐-‐ -‐-‐-‐-‐-‐-‐-‐-‐-‐-‐-‐-‐-‐-‐-‐-‐-‐-‐-‐-‐-‐-‐-‐-‐-‐-‐-‐-‐-‐-‐-‐-‐-‐-‐-‐-‐-‐-‐-‐-‐-‐-‐-‐-‐-‐-‐-‐-‐-‐-‐-‐ KEEP-‐UP -‐-‐-‐-‐-‐-‐-‐-‐-‐-‐-‐-‐-‐-‐-‐-‐-‐-‐-‐-‐-‐-‐-‐-‐-‐-‐-‐-‐-‐-‐-‐-‐-‐-‐-‐-‐-‐-‐-‐-‐-‐-‐-‐-‐-‐-‐-‐-‐-‐-‐ NEW & REPLACEMENT Deferred & Unbudgeted Operating Maintenance Planned CIP Maintenance Total Keep-‐up Facility Needsg
Annual FY Needs Sources Gap Needsa Sourcesb Gap Needsc Sourcesd Gap Needs Sources Gap
Major projects
2011-‐12 $ 4.2 -‐ $ (4.2) $ 16.8 $ 15.2 $ (1.6) $ 15.4 $ 14.8 $ (0.6) $ 32.2 $ 30.0 $ (2.2)
Public Safety Building -‐ replace $ 65.0
2012-‐13 4.2 -‐ (4.2) 16.8 15.2 (1.6) 15.4 14.8 (0.6) 32.2 30.0 (2.2)
Fire Station 3 -‐ replace 6.7
2013-‐14 4.2 -‐ (4.2) 16.8 15.2 (1.6) 15.4 14.8 (0.6) 32.2 30.0 (2.2)
Fire Station 4 -‐ replace 7.5
2014-‐15 4.2 -‐ (4.2) 16.8 15.2 (1.6) 15.4 14.8 (0.6) 32.2 30.0 (2.2)
MSC -‐ replace 93.0
2015-‐16 4.2 -‐ (4.2) 16.8 15.2 (1.6) 15.4 14.8 (0.6) 32.2 30.0 (2.2)
Animal Services -‐ replace 6.9
5 Years Other projects
2017-‐21 $ 20.5 $(20.5) $ 84.0 $ 76.0 $ (8.0) $ 71.0 $ 73.3 $ 2.3 $ 155.0 $ 149.3 $ (5.7)
Civic Center Plaza deck 16.0
2022-‐26 84.0 76.0 (8.0) 81.6 73.3 (8.3) 165.6 149.3 (16.3)
Los Altos Treatment SIte 2.0
2027-‐31 84.0 76.0 (8.0) 74.1 73.3 (0.8) 158.1 149.3 (8.8)
Byxbee Park Phase II 3.6
2032-‐36 84.0 76.0 (8.0) 77.3 73.3 (4.0) 161.3 149.3 (12.0)
Highway 101 Bike/Ped Bridge 10.0
TOTAL $ 41.5e $(41.5) $ 420.0 $380.0 $(40.0) $ 381.0 $ 367.2 $(13.8) $ 801.0e $ 747.2 $ (53.8)
TOTAL $ 210.7
Cubberleyf
– $ 7.0
– $ 11.9
Notes: All figures are in 2011 dollars. Details may not match totals due to rounding. a. Operating Maintenance Needs were increased from current levels by 10 percent from staff analysis to provide the appropriate level of long-‐term infrastructure service. b. Operating Maintenance Sources are the FY 2012 Adopted Budget amount, continued over 25 years. c. Planned CIP Keep-‐up Needs come from staff and working group analysis: $1.5M per year added for unbudgeted proposals based on historical analysis. d. Planned CIP Revenue Sources are assumed to be continued General Fund transfer of $10.5 million (the 2012 amount, continued unchanged over 25 years) and $4.3 million in non-‐General Fund sources. e. Excludes recategorizations between catch-‐up and keep-‐up after 12/1/2011 totaling under $1 million. f. $7 million of Cubberley catch-‐up and $11.9 million of Cubberley CIP are included in the above 25-‐year figures. These represent potential savings if lease arrangements no longer apply. g. New & Replacement needs listed by project with no assumed time frame for implementation.

EXECUTIVE SUMMARY
IBRC FINAL REPORT 9
Section 3: Public Safety
Problem Identification and Findings The current Public Safety Building located at 275 Forest Avenue (customarily known as police services) has been the subject of five separate studies to address its problems and their remedies. The two most recent, in 1998 and 2006, both strongly recommended replacing the building. As community attention and commitment to emergency preparedness has grown, so has the importance of a Public Safety Building that can withstand intense natural and man-made events such as earthquakes, terrorist attacks, or civil unrest.
The Public Safety Working Group examined the current building, studied the work of the 2006 Blue Ribbon Task Force, and visited the new San Mateo police building (the size of the city and the department are roughly comparable to Palo Alto). The working group also spent time with key staff to learn how the building functions relative to the demands made upon it, and what might be the consequences if an earthquake or other catastrophic event rendered the building unusable. Because the probabilities of a major seismic event on the San Andreas or Hayward faults in the next 20 to 30 years are 21 and 32 percent, respectively, the probability of an unusable Public Safety Building has to be taken seriously.1
Among the failings of the current facility are these:
Failure to meet Essential Services building codes and Occupational Safety and Health Administration (OSHA) requirements.
Insufficient, poorly designed space for evidence processing, evidence storage, locker rooms, holding cells, materials storage, meeting rooms, vehicle parking, training, prisoner transfer, supplies, and tactical vehicles.
An inadequate and difficult-to-use Emergency Operations Center. Windowless 911 dispatch center in basement location (vulnerable to
earthquake or blast). No blast protection on sides and underneath (city parking garage).
Regarding Fire Stations 3 and 4, a 2005 consultant study found “extensive structural, code, and operational deficiencies,” and recommended
1 Forecasting California’s Earthquakes – What Can We Expect in the Next 30 Years? USGS Fact Sheet 2008-3027, p. 4.

EXECUTIVE SUMMARY
IBRC FINAL REPORT 10
replacement or significant upgrade. The working group examined this study, visited the stations as well as two in Mountain View, and talked with fire personnel. Besides being vulnerable to earthquakes, these two stations have insufficient space to safely house the larger engines needed to accommodate developments in firefighting, rescue operations, and emergency medical response. Modern engines now fill the apparatus bays, leaving very little room for personnel to maneuver to the sides and rear. Living quarters for fire personnel in these one-story buildings are not adequately separated from hazardous fumes. Storage and shop space is insufficient for supplies and equipment, nor is there adequate space for drying hoses after use.
Recommendations
3-1 Build a new Public Safety Building (PSB) as soon as possible on a new site, incorporating the Police Department, the Fire Department administration, the Communications Center, the Emergency Operations Center, and the Office of Emergency Services.
Public safety should be a top priority for any city, but that priority has been dangerously deferred in Palo Alto. An initial action should be site acquisition, preferably the Park Avenue (or equivalent) site previously identified by the 2006 Task Force. The Commission reviewed rebuilding at the present site, splitting public safety into multiple facilities, and exploring further interagency collaborations. None of these compared favorably.
3-2 Rebuild and significantly upgrade Fire Station 3 (Newell and Embarcadero) and Station 4 (Middlefield and East Meadow) at their present sites as soon as possible.
These two stations, built in the middle of the last century, do not meet current earthquake codes and have become increasingly inadequate for the multiple functions they are intended to support.
Possible disaster scenarios were explored. Each underscored the need for facilities that are safe, functional, adequate to perform over a wide range of public safety situations, and, most important, will be standing and operational in and after a disaster.
Estimated costs for the recommended police and fire facilities are $79.2 million. Financing should be by long-term borrowing as recommended in section 5.

EXECUTIVE SUMMARY
IBRC FINAL REPORT 11
Section 4: Municipal Services Center / Embarcadero East Corridor
Problem Identification and Findings The Municipal Services Center (MSC) and the Animal Services Center (ASC) are located on 16 acres of City-owned land on East Bayshore Road between Embarcadero and San Antonio. The trucks and equipment used by the Utilities Department and the Department of Public Works, along with their shops, service bays, offices, and storage spaces, are housed or parked there.
The Utilities Department is vital to City operations, to emergency responses, and to recovery in the case of a major disaster. As an emergency response facility, the MSC can never be closed. A 2003 study determined that the MSC and ASC had deteriorated due to a combination of normal wear and tear, seismic vulnerabilities, and functional obsolescence.
The City has explored the possibility of a land exchange with auto dealers on Embarcadero East. Highway 101 frontage adds to the commercial potential of auto dealers, and relocating to Embarcadero is equally satisfactory for many departmental functions currently housed at the MSC.
IBRC findings were as follows:
Both the MSC and ASC require either extensive repairs or rebuilding, although investigating alternatives to City-delivered animal services also deserves consideration.
While the MSC could be split up and relocated to sites with less total acreage, it would be necessary to identify potential sites in Palo Alto to house the existing functions.
The MSC’s current location may hamper delivery of services in a seismic or flood emergency.
Sales tax revenue to the city from auto dealers has declined significantly since 2000.
The City houses staff in high-rent offices that could be relocated to the Embarcadero East corridor if that area were developed for office use.
Because the Council has already directed Public Works to commission a consultant study of that area, IBRC has focused on describing the range of options that should inform the consultant process:
Static option. Renovate or replace the MSC and ASC at their present locations, consistent with the existing Baylands Master Plan, and with no additional land required. This would risk continued decline in auto

EXECUTIVE SUMMARY
IBRC FINAL REPORT 12
sales tax revenues, jeopardize emergency response capability, and provide no lower-cost office space for City uses.
Dynamic option. Widen the parameters of the consultant study to re-imagine possibilities. These could include relocating routine and emergency response functions west of Bayshore, swapping land with auto dealers, developing the Embarcadero East corridor, transferring City functions from downtown to less expensive quarters in newly developed space, and redeveloping the City-owned vacated space for income-producing uses.
Recommendations
4-1 Expand the scope of the MSC/ASC consultant study to include the possibility of establishing an auto dealer cluster or other economic development project on East Bayshore Road and to consider the best use of parcels the City may acquire on the Embarcadero East corridor.
4-2 Obtain current appraisals of the market value of the MSC site on East Bayshore Road and the auto dealer parcels on Embarcadero Road.
4-3 Update the City’s disaster response and resiliency and evaluate the risk of no or limited access to the MSC in the event of a disaster.
4-4 Update the Baylands Master Plan regarding the MSC site and the Embarcadero East corridor.
4-5 Perform economic impact analyses of the different scenarios for repair or replacement of the MSC.
4-6 Review the plan for delivering animal services to the City, the contractual obligations of the ASC to provide services to adjacent communities, and the possibility of a closer relationship with regional providers such as the Silicon Valley Animal Control Authority.
4-7 Study long-term alternatives for optimization of the Civic Center block.

EXECUTIVE SUMMARY
IBRC FINAL REPORT 13
Section 5: Finance
Problem Identification and Findings The problems leading to the formation of IBRC were caused in part by under-budgeting for catching up and keeping up with infrastructure needs. This occurred in the context of Palo Alto’s broad range of financial obligations. The recommendations that follow, therefore, deal primarily with generating new funds. We do not propose reallocation of funds that are budgeted for ongoing City functions. The elements and magnitude of the costs to be covered are shown in tables 5-3 and 5-4.
Table 5-‐3 Additional Annual Infrastructure Funding Required (in millions of dollars)
Catch-‐up, Keep-‐up, and Other New & Replacement Projects
Keep-‐up $ 2.2 per year
Catch-‐up and Other New & Replacement 4.2 per year TOTAL $ 6.4 per year Catch-up, keep-up, and other new & replacement projects reflect ongoing costs that must be built into continuing Operating and Capital Budgets. The keep-up number ($2.2 million/year) refers to normal maintenance; the catch-up and other new & replacement number ($4.2 million/year) refers to an identified list of $41.5 million in backlogged projects that will be spread over ten years, with the prospect of a similar sum for the following ten years for other new & replacement.
For the ongoing needs, we recommend continuing sources of financing and describe a sales tax, business license tax, and parcel tax. The Commission’s preference is for a sales tax.
Table 5-‐4 Funding Required for Major New & Replacement Projects (in millions of dollars)
Estimated Cost Total Public Safety Facilities Public Safety Building Fire Station 3 Fire Station 4
$ 65.0 6.7 7.5
$ 79.2
Municipal Services and Animal Services Municipal Services Center Animal Services Center
93.0 6.9
99.9
TOTAL MAJOR PROJECTS $ 179.1

EXECUTIVE SUMMARY
IBRC FINAL REPORT 14
In all likelihood the City will want to act on the public safety facilities first because the Municipal and Animal Services centers will be the subject of a major consultant study before Council priorities in that region are set. As the report text makes clear, the estimate of $99.9 million is based on relocating the ASC and rebuilding the MSC with additional offices to house staff currently located in rental space along Elwell Court. It did not include rebuilding the Utilities Control Center (UCC) building. Additional configurations should be analyzed in the consultant study.
One potential part of the financing equation involves savings from ending the City’s lease of the school district’s share of the Cubberley site. Briefly in the full report and at greater length in a working paper appendix, the Commission elaborates on the rationale for not renewing the Lease and Covenant Not to Develop that has been in place since 1989. IBRC estimates a net savings of $6.1 million annually from letting the agreements lapse and recommends those savings be reallocated within the City’s budget.
Financing Alternatives
The Commission recommends four financing alternatives, any of which will successfully fund the needed infrastructure investment. We do so without prioritizing them. Because different pros and cons are associated with each alternative, we believe a choice among them is properly in the Council’s purview. The four recommended alternatives appear in a box on page 2.
Dedicated Funding and Reserves
The section next confronts the question of how to assure that both the additional and the current funding for infrastructure will continue to be available as needed. To ensure that, IBRC recommends the Council dedicate 23 percent of the City’s General Fund budget for this purpose. How that sum is calculated appears in table 5-7.

EXECUTIVE SUMMARY
IBRC FINAL REPORT 15
Table 5-‐7 Need for Dedicated Annual Infrastructure Funding
Dollar Amount
(millions) Percent of
General Fund Revenue (Current) (Recommended)
OPERATING MAINTENANCE (Keep-up)
2011–12 Operating Maintenance Budget $ 15.2 10.5% 10.5% Additional needs 1.6 1.1
Total Operating Maintenance need 16.8 10.5% 11.6%
CIP MAINTENANCE (Catch-up & Keep-up)
2011–12 CIP Maintenance Budget 10.5 7.2% 7.2% General Fund interest transfer 1.0 0.7 0.7 Gas tax/grants/other already dedicated 3.2 2.3 2.3 Additional needs 4.8 3.3
Total CIP Maintenance need 19.5 10.2% 13.5%
TOTAL Catch-up and Keep-up 36.3
Less gas tax/grants/other already dedicated – 3.2 – 2.3 – 2.3 TOTAL dedication needed $ 33.1 18.4% 22.8%
Next, we recommend the establishment of two reserves: 1. An Operating Maintenance Reserve would be funded through the annual
infrastructure allocation to provide for that year’s existing infrastructure requirements, retaining any balances to smooth year-to-year fluctuations.
2. A Strategic Construction Reserve would deal with longer-term needs and opportunities, to be funded by asset sales, windfalls, Stanford Development Agreement funds, and such other transfers as the Council may determine.
Finally, we describe infrastructure-related uses of the Stanford Development Agreement funds. These reflect potentially transformative uses of those funds.
Recommendations
5-1 Consider four recommended alternatives for funding one-time investments and ongoing infrastructure needs. These alternatives do not include reallocations within current City budgets except for the possibility of funds that now pay for the Cubberley lease.
5-2 Direct the City Manager to dedicate 23 percent of General Fund revenue annually to infrastructure. Require a supermajority of six council member votes to reduce any year’s infrastructure funding below 23 percent. Require that any reductions below 23 percent shall be restored over the succeeding three years.

EXECUTIVE SUMMARY
IBRC FINAL REPORT 16
5-3 Establish an Operating Maintenance Reserve to manage infrastructure budgeting and smooth year-to-year fluctuations, and a Strategic Construction Reserve to deal with unanticipated infrastructure needs and opportunities.
5-4 Decline to renew the Cubberley Lease and Covenant Not to Develop. This will free $6.1 million annually and avoid a substantial portion of the capital upkeep expenditures of $18.9 million and annual maintenance expenditures of $800,000.
Section 6: The Future
IBRC established a Futures Working Group (FWG) to identify additional trends and possibilities for infrastructure planning and investments. This section and the accompanying appendices identify trends such as the growth and changing demographics of Palo Alto’s population and examples of technology advances that will impact future infrastructure planning.
Explicit attention to what the City might do over the next 25 years to assure that Palo Alto remains a desirable place to live, work, and visit has been missing. The City’s Comprehensive Plan (Comp Plan) provides a ten-year vision for Palo Alto and a framework under which future projects may be evaluated.2 In this context, our recommendations encourage bold forward thinking toward infrastructure for the City that preserves our heritage while continuing to serve Palo Alto’s constituents well.
Renewing our infrastructure presents both a challenge and a timely opportunity: the average age of the 84 structures with known construction dates is 50 years.
While predicting the future is difficult, our chances for long-term sustainability can be improved by:
Vision – requiring that the City report on the future beyond the horizon of our current Comp Plan.
Engagement – engaging with other forward-thinking municipalities. Involvement – inviting private citizens and business entities alike into
the thought process.
IBRC proposes joint action with the City Planning department and citizen groups, as well as discussions with other progressive cities. We believe
2 Embracing the New Century: Palo Alto 1998–2010 Comprehensive Plan, p. I-1.

EXECUTIVE SUMMARY
IBRC FINAL REPORT 17
that by establishing processes to encourage future thinking, new and exciting ideas will emerge.
The recommended new infrastructure commission would, as part of its charge, advise the City on future infrastructure needs and plans. Among the factors influencing those recommendations are population trends, raising questions that include land use, building height restrictions, mixed-use zoning, and reuse of sites such as Cubberley.
Other areas for attention include:
Municipal best practices. We advocate learning from other progressive cities as well as from think tanks and universities, with initiatives such as a Palo Alto-hosted “smart cities” conference for exchanging ideas.
Technology infrastructure. Infrastructure that leverages emerging trends and technologies, some of it in conjunction with the Utilities Department, is a natural direction for Palo Alto. Possible areas include wireless infrastructure, the Smart Grid, alternative energies, technologies for aging demographics, and advanced healthcare. Community members with expertise in these areas can enhance City infrastructure planning with the intellectual riches Palo Alto enjoys.
Leasing of assets. The City might consider taking advantage of real estate prices by charging market rates for City-owned leased space wherever possible.
Possible future projects. Speculating about future infrastructure possibilities can be a fruitful means of turning imagination into action. In an appendix our report provides, as a basis for discussion, these possibilities: a Community Services Center, an extension of the Embarcadero East concept posed in section 4, a Palo Alto conference center, a start-up incubator, and a Palo Alto wireless network.
Timeline and project costing. IBRC notes that a single timeline for infrastructure planning must necessarily be a set of overlapping timelines for different initiatives. Moreover, these timelines should have accompanying cost estimates so that financial implications are understood in advance. We specifically recommend that the Comp Plan include economic analyses for its programs.
Asset management. The City has a portfolio of infrastructure assets that must be managed with respect to use, continued investment, and ultimate disposition. The IMS should be used to help make these long-term judgments.

EXECUTIVE SUMMARY
IBRC FINAL REPORT 18
Future Idea Bank. To capitalize on the talent and ideas of our residents, the City should establish a Future Idea Bank into which all could deposit their ideas for enriching the community’s future.
Recommendations
IBRC has not made formal recommendations in the Future section. Rather, we intend this section and related appendices to be a set of stimulating possibilities for the future. The Comp Plan is quite detailed but its sections age, and a 25-year horizon is difficult to keep in sight.
A city of Palo Alto’s character and capacity cannot afford to have the future happen to it. A process for actively determining our own destiny needs to find its way into the hierarchy of the City’s priorities.
Commentaries and Dissents
To a commission of 17 individuals dealing with as complex and consequential a matter as Palo Alto’s infrastructure, agreement does not come easily. Thanks, however, to thoroughgoing discussions and ample collegiality, there were few issues on which some commissioners did not agree with a majority of their colleagues or wished to amplify their views. This section contains eight commentaries and dissents, each signed by one or more commissioners. All are expressed in their own words and printed with no editing or response.

IBRC FINAL REPORT 19
Introduction
Infrastructure – the term encompasses essentially all the City owns that does not move on wheels or rest on a floor. For a city of its size, Palo Alto has a significant amount of infrastructure, including hundreds of acres of parks and open space in the baylands and foothills, libraries throughout the community, performing- and fine-arts centers, community centers, and much more. A summary list (Appendix A) enumerates buildings and parks along with miles of streets and sidewalks, fire hydrants, bridges, levees, and an urban forest.
In its broadest sense, everything that happens in Palo Alto, both public and private, requires or relies on the proper functioning of our infrastructure. Without streets, sidewalks, and bridges, we could not get to our destinations. Without police, fire, and medical response facilities, we would not be safe in our homes or in public. Without parks, playgrounds, and open spaces, there would be less opportunity for recreation and the enjoyment of our environment. With no City Hall or Municipal Services Center, we would be without community services, utilities, and other vital functions. Without libraries or cultural resources for fine arts and theatre, the richness of our lives and those of our children would be diminished. Infrastructure is a key element in Palo Alto’s attractiveness to residents and businesses – indeed, to its competitiveness overall.
Palo Alto’s Aging Infrastructure
Our infrastructure has a finite life; just how long it lasts depends on the City’s stewardship. Roofs need to be replaced, roads repaved, broken fans fixed, worn turf restored. Medians, streetlights, and tennis courts wear out. Some assets become obsolete as new uses and new requirements arise. There will always be technology upgrades, departmental reorganizations, new directions in emergency preparedness, new concerns about safety. Thus, the need for upgrades is added to needs for ongoing repair and upkeep. To these are added the demands for modern libraries, contemporary community centers, and business district renewal. Taken together, infrastructure makes a significant claim on the City’s resources. For some time, however, Palo Alto’s infrastructure has been underfunded.
INRODUCTION
IBRC FINAL REPORT 20
As Palo Alto’s infrastructure has aged, maintenance needs have become more pronounced. At the same time, the City’s revenue-raising flexibility has diminished. In recent years, despite accounting for almost 19 percent of the City’s budget, Palo Alto’s infrastructure maintenance has continued to deteriorate.
The Infrastructure Blue Ribbon Commission (IBRC)
Three recent comprehensive reports all emphasized that aging infrastructure and an inadequate plan for dealing with it were major concerns for the City.4 Actions were taken to abate some aspects of the problem, but they failed to produce a long-term plan to address it comprehensively.
In May 2010, as a result of these concerns, the Council authorized formation of the Infrastructure Blue Ribbon Commission (IBRC) and appointed 17 residents to serve. The Commission began its work in November 2010, charged “to provide a recommendation to the City Council on infrastructure needs, priorities, projects and associated funding mechanisms to address the infrastructure backlog and future needs.” Seven guiding questions accompanied this charge (see Appendix B).
As a Commission, our process has included 31 public Commission meetings, two study sessions with the Council, a session with the Planning and Transportation Commission and another with the Council Finance Committee, and well over 200 other meetings of our committees and working groups, as well as meetings with other cities, between commissioners and staff, and with individuals who provided assistance.
Infrastructure as a Priority
Palo Alto is a wonderful community because successive generations have enhanced our public realm with significant civic investments. Although most infrastructure assets have been developed with public funds, private benefactors such as Lucie and Ruth Stern (Lucie Stern Community Center) and Morris Frost (Junior Museum) have also contributed. Palo Alto has long been a visionary community whose residents value cultural, intellectual, and physical pursuits.
4 (1) Kitchell Associates, Facility Assessment Report, Job No. 3466A3, February 22, 2008; (2) Leadership ICMA, General Fund Infrastructure Opportunity Report, September 2009; (3) City Auditor, Infrastructure Report Card for Palo Alto, March 4, 2008.

INTRODUCTION
IBRC FINAL REPORT 21
The excellence of a community is more than the sum of its parts, but each element must function well for a city to be successful. When we allow the elements to deteriorate, the fabric of the city may be weakened, making it less attractive for its residents over time.
Many Palo Altans likely view their community as an extension of their homes. Just as we must regularly maintain and upgrade our personal residence, so the City must keep up its infrastructure. For both the individual and the City, the consequences of failing to maintain assets are the same: rundown appearance, deteriorating serviceability, and greater expense overall.
The Work of IBRC
To address the sprawling challenges of Palo Alto’s infrastructure problems, IBRC initially created three committees: Finance, Surface (streets, sidewalks, parks, etc.), and Buildings. These committees did basic research and analysis into the scope and detail of these three domains.
Subsequently, the Commission redeployed into five working groups to study specific aspects of the City’s infrastructure that merited deeper analysis. These working groups (1) confirmed the need for and studied the development of an Infrastructure Management System, (2) analyzed current City data to determine Palo Alto’s existing catch-up and keep-up needs; (3) researched the needs of the City’s public safety facilities, (4) explored the opportunity represented by the Municipal Services Center and the Embarcadero East corridor, (5) worked out the financial considerations, and (6) considered opportunities for the future.
Members of the City staff offered significant support throughout our efforts, responding to commissioners’ questions and providing the basic information on which our understanding and consideration of options depended. For this IBRC is deeply grateful.
Early in the process, IBRC elected not to include the Utilities, the airport, nor the other Enterprise Funds, except insofar as their work overlapped with other City departments involved in infrastructure, such as Public Works for street maintenance. Because Utilities focuses sharply on the infrastructure for which it is responsible and has protocols for maintenance, along with oversight by the Utilities Advisory Commission, it was not part of the problem that led to the formation of IBRC.
IBRC also elected to leave with the San Francisquito Creek Joint Powers Agreement, the Santa Clara Valley Water District, and the Army Corps of

INRODUCTION
IBRC FINAL REPORT 22
Engineers those matters associated with Bay water levels and San Francisquito Creek, including bridges, dams, and levees.
Definition of Terms
Throughout this report we use several terms, some of the Commission’s devising and some that are in common use in our City’s management and budgeting systems. We italicize the first three terms throughout the report for emphasis because they frame a practical way of thinking and talking about infrastructure management and stewardship.
Catch-up - Sometimes termed deferred maintenance or backlog, catch-up refers to the accumulation of needed repairs for which remedies are overdue. Inattention to this backlog inevitably results in increased maintenance costs, shortened component life, and increased emergency repairs. A roof overdue for replacement will leak, damaging both building structure and contents; a road that wears down will require costs to repair that can be 10 to 40 times greater than the cost of periodic maintenance.
Keep-up - This category combines two elements: Operating maintenance refers to routine upkeep such as repairing
broken equipment, servicing machinery, and painting interiors and exteriors.
Planned maintenance refers to the periodic repair or replacement of such major items as roofs and electrical and plumbing systems to maintain a facility and extend its life. It is generally financed by the Capital Improvement Program (CIP) budget and is therefore often referred to as CIP maintenance.
In an analogy to a car, operating maintenance is like a 10,000 mile tune-up; planned maintenance is like new brakes, tires, or engine.
New & replacement - This refers to extensive rehabilitation or reconstruction of buildings which are unsafe or have dropped below appropriate standards of service through age, use, or evolving requirements of community service. This category also refers to new construction required as new services are provided within the community.
General Fund - The primary or catchall fund of the City government, similar to a firm’s general ledger account, the General Fund records each asset and liability that is not assigned to a special purpose fund. It provides the resources necessary to sustain the day-to-day activities and thus pays for all administrative and operating expenses. When governments or

INTRODUCTION
IBRC FINAL REPORT 23
administrators talk about balancing the budget, they typically mean balancing the budget for their General Fund.
General Fund Operating Budget - The plan adopted by City Council each year, laying out the revenues and expenses that support the general services delivered to the community, including public safety, libraries, parks, and public works.
Enterprise Funds - City operations that are financed and operated in a manner similar to a private enterprise, primarily in the Utilities Department.
Capital Budget - A plan of proposed outlays on physical assets and the means of financing them for the current fiscal period. Includes both CIP maintenance and New & Replacement.
Capital Improvement Program (CIP) - Projects related to the acquisition, expansion, rehabilitation, or major maintenance of the City’s buildings, equipment, parks, streets, and other public infrastructure.
Organization of This Report
This report has, in addition to the Executive Summary, six principal sections plus 15 appendices that are referenced in the body of the report and add useful supplementary material. Where individual commissioners want to comment on or dissent from Commission findings, those remarks are found prior to the appendices.
The six sections of the report reflect how the Commission understood the infrastructure challenge and prioritized the means of addressing it.
Section 1 deals with infrastructure management. We consider this the core of our findings and the center of our recommendations. In this section we identify the reasons why the City fell behind in infrastructure maintenance and recommend tools and policies to avoid this happening again.
Section 2 quantifies the catch-up and keep-up needs that the Commission and staff identified and summarizes what is needed to address them.
Section 3 concerns public safety facilities, specifically a Public Safety Building and two fire stations; the Commission describes their present condition and recommends that they be replaced.
Section 4 addresses the Municipal Services Center on East Bayshore and some options for that area, particularly land swaps with auto

INRODUCTION
IBRC FINAL REPORT 24
dealers and the potential of the Embarcadero East corridor for commercial, civic, and possibly other development. The City Council approved a project in the 2012 Capital Budget for a study of the MSC. IBRC has applied a wide-angle lens to the matter, resulting in a recommended expansion of the study’s scope to include greater exploration of the region’s potential.
Section 5 examines the financing of our recommendations for catch-up, keep-up, and new & replacement facilities. Four alternative financial scenarios are proposed.
Section 6 looks to the future and the ways that Palo Alto can move closer to the leading edge of progressive cities with the kind of infrastructure that enriches the community and keeps it a desirable place in which to live, to work, to play, to raise children, and to retire.
In Summary
This Commission has been acutely aware that Palo Alto’s attractiveness, sustainability, and vitality as a community is inherently linked to the quantity and quality of its infrastructure, and that maintaining and enhancing Palo Alto’s level of infrastructure requires careful evaluation of the economics. The IBRC report reflects our considered judgment as to the major infrastructure needs facing the City in the foreseeable future and how to finance them. Further, it presents a context and a strategy for keeping abreast of catch-up, keep-up, and new & replacement requirements now and into the future.

IBRC FINAL REPORT 25
SECTION 1
Infrastructure Management
Management of the City’s infrastructure is a difficult task made more so by diffused and confusing lines of responsibility and authority within the City structure.
Tasked with analyzing the City’s infrastructure to determine current and future needs, IBRC began by attempting to take an inventory of all City assets. We found it disappointingly difficult to assemble a citywide inventory. Because the relevant information was in several departments, there was no single authoritative source of infrastructure information, no single point of responsibility for management. Thus, the basic identification and compilation of infrastructure needs took several months of the Commission’s work, even with help from City staff, who created a detailed master spreadsheet and database (available online) to show where we stand today.5
Defining a system for infrastructure management was not part of the Commission’s original charge, but we quickly saw it was the foundation on which all else would be built. Properly constructed, it would enable staff to monitor facility conditions, forecast maintenance needs, factor inflation, and assemble usage data. And, it would provide decision makers with invaluable cost and funding data.
Several outside consultants6 as well as the City Auditor (2008) have recommended that the City put in place such a system, widely used in industry and government and available commercially.
IBRC’s findings have substantiated these previous recommendations. We strongly recommend that such a system be developed and installed as soon as possible.
5 http://www.cityofpaloalto.org/civica/filebank/blobdload.asp?BloblD=29619 6 (1) Kitchell Associates, Facility Assessment Report, Job No. 3466A3, February 22, 2008; (2) Leadership ICMA, General Fund Infrastructure Opportunity Report, September 2009; (3) Adamson Associates, Building Management Study, September 1997; Traffic and Transportation, June 1997; Parks Management Study, January 1998.

INFRASTRUCTURE MANAGEMENT
IBRC FINAL REPORT 26
Findings
1. Palo Alto has no comprehensive system for managing its infrastructure. Responsibility for maintenance has been divided among Public Works, Community Services, Transportation, and Administrative Services. The City has lacked an overall system for maintaining and integrating infrastructure information.
2. Incorporated for more than 100 years, Palo Alto has a substantial inventory of older assets. Thus systematic management of infrastructure facilities becomes an increasingly vital need.
3. Incomplete and fragmentary data and dispersal of authority have affected the City’s ability to assess and prioritize overall needs, to develop strategies for longer-term maintenance and replacement, and to prepare for the future. It is imperative that the City Council and City staff be well informed about the overall state of the City’s infrastructure and the consequences of budgeting actions and delays.
4. In the competition for City funds, the delay of infrastructure projects in deference to other perceived needs is an all-too-common occurrence. Additionally, although the Council reviews and approves the City budget annually, new items are often proposed and approved in the middle of each fiscal year. In recent years, the effect of these “pop-up” items has been to add an average of $1.5 million per year to the Capital Budget.
Recommendations
In response to the City’s fragmentation of infrastructure management, IBRC recommends a number of changes in how infrastructure is tracked, managed, and brought before the City Council in its annual budget process.
1-1 Establish an Infrastructure Management System (IMS) to maintain an up-to-date inventory of the City’s infrastructure, its catch-up and keep-up needs, and available funding. Such a management tool will support ongoing staff and Council attention to infrastructure budgeting, planning, and accountability. This system should integrate with programs the City now uses to manage infrastructure and finance.
As noted above, this call to systematize infrastructure management with an IMS reiterates recommendations made by outside consultants and by the City Auditor.

INFRASTRUCTURE MANAGEMENT
IBRC FINAL REPORT 27
1-2 Establish a single point of responsibility, at a high level, for infrastructure management. This position should be within the City Manager’s office.
This recommendation reflects IBRC findings that management of Palo Alto’s infrastructure is diffused through a number of City departments, that responsibilities are unclear, and that no comprehensive inventory or needs analysis exists.
1-3 Require that an IMS summary report be presented to the City Council as the lead element in each year’s General Fund Budget review, and that it highlight any gaps in infrastructure funding.
The nature of capital assets is that they rarely have advocates among the citizenry until they have seriously deteriorated; hence their upkeep is easy to defer. It is imperative, therefore, that a clear, comprehensive report be presented to the Council in connection with its budget deliberations each year, and that it contain a summary of maintenance needs together with funding availabilities in order to highlight any deficiencies. IBRC believes that this report will be the most valuable output of the Infrastructure Management System and the best insurance that infrastructure won’t be overlooked. Table 1-1 shows our prototype IMS summary.
1-4 Establish a permanent public commission, appointed by the City Council, to give ongoing oversight to infrastructure maintenance, to consider and make recommendations regarding future infrastructure needs, and to assure proper attention to the City’s physical assets. This commission should have as its staff liaison the Director of Planning.
1-5 Establish a policy that the City Manager, in coordination with the public commission on infrastructure, report to the City Council at least twice a year on infrastructure.
Palo Alto has traditionally employed citizen commissions to assure ongoing public attention to areas of particular importance. Because our infrastructure provides the physical underpinnings for the delivery of all City services, it merits the oversight of a public commission.
1-6 Dedicate sufficient funding to infrastructure on a long-term basis.
As stated, support of infrastructure has almost no public constituency until significant needs have appeared. Because of this, infrastructure funding tends to lose ground in the competition for civic resources. Excepting the gas tax, Palo Alto has no funding source dedicated to infrastructure. Without dedicated funding, backlogs are likely to persist and Palo Alto’s asset base is at risk of continued decline.

INFRASTRUCTURE MANAGEMENT
IBRC FINAL REPORT 28
In recent years, approximately 19 percent of the General Fund has been spent on infrastructure. This needs to increase to 23 percent to properly fund catch-up and keep-up requirements. IBRC’s recommendation for dedicated funding is discussed in detail in the Finance section of this report (section 5).
1-7 Mandate periodic audits of infrastructure maintenance by the City Auditor.
Good business practices call for regular audits of significant assets. This could be done by the City Auditor or an outside firm. The City Auditor’s audit of street maintenance (2006)7 and Infrastructure Report Card for Palo Alto (2008) were valuable resources for IBRC. Such audits can also assess ways to improve the functioning of infrastructure management and the IMS.
Components of an Infrastructure Management System
The System There is no question that Palo Alto needs a comprehensive Infrastructure Management System. Toward that end IBRC has worked with staff to develop the infrastructure database described in Appendix C. The next step is building a system that fully integrates with Palo Alto’s existing software. This action must be assigned a high priority or the data we have will become stale before it can be used.
Management
The system database will support record-keeping, analysis, strategy, and accountability for all elements of the City’s infrastructure, including buildings, parks, streets, sidewalks, athletic facilities, and the urban forest. For each asset, a specified staff member must be assigned the responsibility of keeping information current. Functions will include the following: Entering facility description, including updated replacement cost. Keeping the maintenance history; noting the extent of deferred
maintenance. Regular updating of facility condition, including one- to five-year
maintenance and/or replacement needs. Estimating longer-term requirements.
7 Palo Alto City Auditor, Audit of Street Maintenance, March 21, 2006.

INFRASTRUCTURE MANAGEMENT
IBRC FINAL REPORT 29
The Finance Department will be responsible for identifying the funding source (or gap) for each element.
All IMS information will be available both to department heads and to the Director of Infrastructure Management within the City Manager’s office. It will be the Director’s job to determine if maintenance is current or if catch-up is required. The IMS will make it possible to do this on a facility-by-facility basis and project needs out into the future, taking inflation into account.
Figure 1-‐1 A comprehensive Infrastructure Management System (IMS).

INFRASTRUCTURE MANAGEMENT
IBRC FINAL REPORT 30
Reports to the Council
An important aspect of the system, as we envision it, will be its ability to provide a one-page financial report to City Council members summarizing all infrastructure keep-up and catch-up needs and any financing gaps that may exist or be forecast.
Table 1-1 represents such a one-page report. It is the 25-year overview of infrastructure maintenance and replacement needs, together with the financing that is currently anticipated (“Sources”). The difference between needs and sources is shown as the “Gap.”
In table 1-1, catch-up and keep-up have annual requirements. The new & replacement projects, however, represent larger capital investments, so these are not shown with specific timetables.
The first five years would be presented in annual projections, thereafter in 5-year increments.
The IMS summary, as part of the budget process, will give decision makers a clear status of infrastructure maintenance (keep-up), the degree to which we have fallen behind (catch-up), and the major capital expenditures to anticipate (new & replacement).
Using the IMS
The IMS is a tool that will be useful only if continually kept current. Thus, management of the management system is of critical importance. And, because infrastructure is spread across the city, a strong recommendation of IBRC is to place responsibility for overseeing infrastructure within the City Manager’s office.
We believe that important reasons for the deterioration of Palo Alto’s infrastructure are the fragmentation of infrastructure management and the lack of useful, useable information. The IMS will force that information up through the system and place it before the City Council in a form that will give clear focus to their infrastructure decisions.

Table 1-‐1 City of Palo Alto Infrastructure Management System Summary of Needs, Funding Sources, and Funding Gaps (in millions of dollars) -‐-‐-‐-‐-‐-‐-‐-‐ CATCH-‐UP -‐-‐-‐-‐-‐-‐-‐-‐ -‐-‐-‐-‐-‐-‐-‐-‐-‐-‐-‐-‐-‐-‐-‐-‐-‐-‐-‐-‐-‐-‐-‐-‐-‐-‐-‐-‐-‐-‐-‐-‐-‐-‐-‐-‐-‐-‐-‐-‐-‐-‐-‐-‐-‐-‐-‐-‐-‐-‐-‐ KEEP-‐UP -‐-‐-‐-‐-‐-‐-‐-‐-‐-‐-‐-‐-‐-‐-‐-‐-‐-‐-‐-‐-‐-‐-‐-‐-‐-‐-‐-‐-‐-‐-‐-‐-‐-‐-‐-‐-‐-‐-‐-‐-‐-‐-‐-‐-‐-‐-‐-‐-‐-‐ NEW & REPLACEMENT Deferred & Unbudgeted Operating Maintenance Planned CIP Maintenance Total Keep-‐up Facility Needsg
Annual FY Needs Sources Gap Needsa Sourcesb Gap Needsc Sourcesd Gap Needs Sources Gap
Major projects
2011-‐12 $ 4.2 -‐ $ (4.2) $ 16.8 $ 15.2 $ (1.6) $ 15.4 $ 14.8 $ (0.6) $ 32.2 $ 30.0 $ (2.2)
Public Safety Building -‐ replace $ 65.0
2012-‐13 4.2 -‐ (4.2) 16.8 15.2 (1.6) 15.4 14.8 (0.6) 32.2 30.0 (2.2)
Fire Station 3 -‐ replace 6.7
2013-‐14 4.2 -‐ (4.2) 16.8 15.2 (1.6) 15.4 14.8 (0.6) 32.2 30.0 (2.2)
Fire Station 4 -‐ replace 7.5
2014-‐15 4.2 -‐ (4.2) 16.8 15.2 (1.6) 15.4 14.8 (0.6) 32.2 30.0 (2.2)
MSC -‐ replace 93.0
2015-‐16 4.2 -‐ (4.2) 16.8 15.2 (1.6) 15.4 14.8 (0.6) 32.2 30.0 (2.2)
Animal Services -‐ replace 6.9
5 Years Other projects
2017-‐21 $ 20.5 $(20.5) $ 84.0 $ 76.0 $ (8.0) $ 71.0 $ 73.3 $ 2.3 $ 155.0 $ 149.3 $ (5.7)
Civic Center Plaza deck 16.0
2022-‐26 84.0 76.0 (8.0) 81.6 73.3 (8.3) 165.6 149.3 (16.3)
Los Altos Treatment SIte 2.0
2027-‐31 84.0 76.0 (8.0) 74.1 73.3 (0.8) 158.1 149.3 (8.8)
Byxbee Park Phase II 3.6
2032-‐36 84.0 76.0 (8.0) 77.3 73.3 (4.0) 161.3 149.3 (12.0)
Highway 101 Bike/Ped Bridge 10.0
TOTAL $ 41.5e $(41.5) $ 420.0 $380.0 $(40.0) $ 381.0 $ 367.2 $(13.8) $ 801.0e $ 747.2 $ (53.8)
TOTAL $ 210.7
Cubberleyf
– $ 7.0
– $ 11.9
NOTES: All figures are in 2011 dollars. Details may not match totals due to rounding. a. Operating Maintenance Needs were increased from current levels by 10 percent from staff analysis to provide the appropriate level of long-‐term infrastructure service. b. Operating Maintenance Sources are the FY 2012 Adopted Budget amount, continued over 25 years. c. Planned CIP Keep-‐up Needs come from staff and working group analysis: $1.5M per year added for unbudgeted proposals based on historical analysis. d. Planned CIP Revenue Sources are assumed to be continued General Fund transfer of $10.5 million (the 2012 amount, continued unchanged over 25 years) and $4.3 million in non-‐General Fund sources. e. Excludes recategorizations between catch-‐up and keep-‐up after 12/1/2011 totaling under $1 million. f. $7 million of Cubberley catch-‐up and $11.9 million of Cubberley CIP are included in the above 25-‐year figures. These represent potential savings if lease arrangements no longer apply. g. New & Replacement needs listed by project with no assumed time frame for implementation.

IBRC FINAL REPORT 32
SECTION 2
The Cost of Catch-‐up and Keep-‐up
Although we have not yet developed the Infrastructure Management System described in section 1, use of the database described there has enabled IBRC to estimate the size of the City’s existing deferred infrastructure maintenance (catch-up) and the underfunding of annual maintenance (keep-up), as well as to prioritize several larger facilities for replacement. This section details that information and notes the funding gaps that exist.
As a result of collaboration with IBRC, the Public Works department has painstakingly documented all known projects relating to infrastructure. These 1,300 projects, with costing and timing, have been collated in the master infrastructure spreadsheet that represents our best view of the City’s infrastructure needs. Because of its size, the document could not be reproduced in our report. It is available for download from the City’s website.8
The Commission has taken this detailed needs data and consolidated it into table 2-1 (catch-up) and table 2-2 (keep-up). Table 2-2 summarizes the data in five-year periods. The Public Works data, as captured in the master infrastructure spreadsheet, contains more than 90,000 data entries.
The master infrastructure spreadsheet has shortcomings that have been acknowledged by the Commission and by City staff:
Some of the data is old and may not reflect current conditions. For example, the Kitchell report dates from 2008 and MSC projections from 2003.
Buildings leased out to non-City affiliates (mostly nonprofits) are not included.
Projects discussed in this report’s Future section are also not included. This report recommends clearing the backlog of catch-up over a ten-
year period. That time may see an increase, however, because money not spent in a timely fashion on maintenance often increases the amount needed by the time it is spent.
There may be redundancy in some projects.
8 http://www.cityofpaloalto.org/civica/filebank/blobdload.asp?BloblD=29619

COST OF CATCH-‐UP AND KEEP-‐UP
IBRC FINAL REPORT 33
All cost and revenue estimates use uninflated dollars. The effect of inflation could be to raise costs relative to revenue.
The master infrastructure spreadsheet is simply a presentation of the City’s project data, not a comprehensive tool for analysis, reporting, or tracking of projects.
Deferred Maintenance, or Catch-‐up
For a number of years the City has underfunded keep-up maintenance, causing a considerable backlog of deferred (catch-up) maintenance to accumulate. A list of selected assets and their deferred maintenance costs appears in table 2-1. Among the facilities earmarked for significant catch-up are Cubberley (on lease from the school district) – $7.0 million, streets – $6.1 million, parks – $5.6 million, sidewalks – $3.7 million, and the Baylands – $3.0 million. The total is $41.5 million.
If unattended, a backlog of deferred maintenance inevitably leads to increased maintenance costs. Indeed, the cost of deferred maintenance can amount to multiples of the cost of timely maintenance.
Given the fixed capacity of the Department of Public Works to carry out projects itself and to supervise outside contractors, IBRC recommends that the catch-up needs be addressed at the rate of $4.2 million per year over the next ten years until deferred maintenance is eliminated. This time
Table 2-‐1. Deferred (Catch-‐up) Maintenance FY 2011–12 (dollars in thousands)
Summary by Asset Animal Services Center $ 30 Arastradero Preserve 407 Arts Center 79 Baylands 2,996 Bridges 100 Civic Center Office Building 332 Cubberley 6,967 Fire Stations 129 Foothill Park 2,171 Garages 1,154 Golf Course 810 Junior Museum & Zoo 221 Lawn Bowling 66 Libraries 548 Lots: Parks & Parking Resurfacing 224 Lucie Stern 669 Mitchell Park 831
Municipal Services Center $ 992 Parks 5,559 Parking Assessment District 943 Restrooms 250 Rinconada Park 40 Sidewalks 3,700 Stanford-‐Palo Alto Parks 1,257 Street Lights 200 Street Medians 1,448 Streets 6,098 Transportation: Signals, Signage 1,825 Ventura 1,224
Summary by Category Buildings 12,014 Parks 14,378 Surface 14,936 Not Categorized $200 Total $ 41,528
NOTE: Figures do not reflect recategorizations between catch-up and keep-up after 12/1/2011 totaling under $1 million.

COST OF CATCH-‐UP AND KEEP-‐UP
IBRC FINAL REPORT 34
frame will allow City staff time to plan and implement projects in an orderly manner and work efficiently with outside contractors.
Annual Maintenance, or Keep-‐up
For annual maintenance, Palo Alto uses two budget categories, operating maintenance and Capital Improvement Projects (CIP). The basic difference is dollar value per project; projects over $50,000 generally are CIP. In calculating total keep-up needs, we have summed the two.
In the 2011–12 budget, $30.0 million is allocated for operating maintenance and the CIP. Our analysis, however, indicates that maintenance budgets have been historically underfunded by an average $2.2 million per year (hence the need for catch-up). To truly “keep up,” the City should allocate approximately $32.2 million per year to maintenance.
Our keep-up total includes $1.5 million in “pop-up” items, or those items introduced in the midst of an average budget year. This figure is derived from staff analysis of several years of budgeting and spending; on average, $1.5 million a year has been allocated for projects not initially budgeted.
IBRC has derived keep-up CIP needs from the detailed analysis contained in the Public Works Department’s master infrastructure spreadsheets. Public Works breaks each facility into maintenance elements to allow detailed assessments. Table 2-2 shows a summary of keep-up, by facility.
A multi-year schedule for keep-up requirements is necessarily more accurate in nearer years than farther out. The advantage of having a dynamic IMS is that needs will regularly be updated and kept current. As a result, estimates for each successive one-year and five-year period will be accurate for budgeting and five-year financial forecasts, and estimates for years farther out will be useful for long-range projections.
The Gap
As table 1-1 shows, catch-up and keep-up together will have a combined shortfall of $6.4 million per year. This maintenance “gap” will not come as a surprise to Palo Alto residents. It is one of the principal reasons for forming IBRC in the first place.
IBRC’s challenge has been not only to identify the extent of the gap, but to determine ways to close it. Toward that end, we have developed a set of funding alternatives. These are presented in section 5 (Finance).

COST OF CATCH-‐UP AND KEEP-‐UP
IBRC FINAL REPORT 35
Table 2-‐2 Keep-‐up Maintenance Needs (dollars in thousands)
ALL KEEP-‐UP MAINTENANCE
5 Years 2012–16
5 Years 2017–21
5 Years 2022–26
5 Years 2027–31
5 Years 2032–36
25 Years TOTAL
Summary by Asset Animal Services $ 0 $ 0 $ 227 $ 175 $ 22 $ 424 Arastradero Preserve 0 264 157 243 220 883 Art Center 2,050 0 278 0 79 2,408 Backflow 250 0 0 0 0 250 Baylands 617 1,469 865 1,329 901 5,181 Bridges 50 0 100 0 100 250 Byxbee Park 0 0 0 0 88 88 Civic Center Office Building 617 700 480 750 300 2,847 Cubberley 3,276 1,288 3,569 1,365 2,402 11,901 Fire Stations 403 80 176 301 446 1,405 Foothill Park 350 1,475 2,533 2,199 996 7,553 Garages 500 0 20 0 0 520 Golf Course 817 895 1,127 1,024 796 4,659 Junior Museum and Zoo 1,049 0 95 73 0 1,218 Lawn Bowling 0 0 148 66 43 257 Library 0 18 741 293 411 1,462 Los Altos Treatment Plant 250 0 0 0 0 250 Lots: Parks & Parking Resurfacing 500 82 812 264 327 1,985 Lucie Stern 1,305 166 479 302 232 2,484 Medians 0 1,579 2,283 840 1,352 6,054 Mitchell Park 1,300 2,074 644 1,548 944 6,510 Multi-‐site Projects 17,021 18,496 18,446 18,446 18,446 90,854 Municipal Services 1,492 645 1,110 645 873 4,764 Parking Assessment District 0 137 1,247 448 511 2,343 Parks and Open Space 5,583 4,160 5,008 5,058 7,988 27,798 Rinconada Park 1,785 815 1,104 377 73 4,153 Sidewalks 3,625 5,400 5,400 5,400 5,400 25,225 Stanford-‐Palo Alto Parks 775 2,189 276 2,792 167 6,199 Street Lights 700 0 0 0 0 700 Streets 19,545 19,000 19,000 19,000 19,000 95,545 Transportation: Signals Signage 9,247 2,293 7,367 3,133 6,807 28,846 Ventura 715 167 0 211 594 1,687
Totals by Asset ($ thousands) $ 73,821 $ 63,390 $ 73,693 $ 66,281 $ 69,516 $346,701
NOTE: Totals exclude $1.5 million per year for unbudgeted items approved by the Council, based on historical analysis.

COST OF CATCH-‐UP AND KEEP-‐UP
IBRC FINAL REPORT 36
New & Replacement
Palo Alto owns an inventory of civic buildings that range from smaller structures to the 90,000 square foot City Hall. For the most part, these buildings are in good working order, needing only routine maintenance and periodic renewal of parts that wear out over time, such as roofs, exterior paint, and electrical systems. As stated in the report by Kitchell Corporation (2008), most of the City’s buildings are “relatively well built public buildings” and “almost all . . . could be renovated to extend their life indefinitely.” Thus, the bulk of the City’s buildings are projected as needing only scheduled (keep-up) maintenance to extend their useful life until such time as a cost-benefit analysis indicates a need for major overhaul or replacement.
The Commission has singled out five City facilities which it recommends for upgrade or replacement: the Public Safety Building, Fire Station 3 (Rinconada Park) and Station 4 (Mitchell Park), the Municipal Services Center, and the Animal Services Center. These facilities are listed as “Major projects” in table 1-1 and are discussed in depth in sections 3 and 4 of this report.
Looking further ahead, a number of other new & replacement items will also need to be addressed. Four are listed as “Other projects” in table 1-1; they are not discussed individually in this report, but will be referenced throughout as other new & replacement projects. IBRC recommends, therefore, that the funds utilized for catch-up during the first ten years be thereafter redirected to offset these other new & replacement needs.
Maintenance of Surface Assets
The term surface assets refers to infrastructure that lies on the City’s surface: streets, medians, sidewalks, parking lots, parks, and so on. For most surface assets, catch-up and keep-up are merged within the normal maintenance cycle; like painting the Golden Gate Bridge, repair and maintenance happen continuously. The following two examples demonstrate this. As noted above, deferred maintenance of sidewalks and streets amounts to $9.8 of the total $41.5 catch-up backlog.
Sidewalks
Maintenance of the City’s 283 miles of sidewalks results less from use and more from the perpetual battle between tree roots and concrete. Maintenance generally involves two approaches:

COST OF CATCH-‐UP AND KEEP-‐UP
IBRC FINAL REPORT 37
Repair of offsets of three-fourths inch or more through shaving the cement or paving with asphalt to smooth the offset (see figure 2-1). Repairs occur as these hazards are brought to the attention of the Public Services Division of the Department of Public Works. Sidewalks damaged in other ways are, on a case by case basis, repaired as needed.
Dividing the city into 23 sidewalk districts for major repairs, district by district, over a 30-year cycle. Although this concept has been in place for some time, budgets have proven inadequate to maintain it. The recommended budget increase will enable recovery of the 30-year repair cycle.
In addition to these two approaches, special projects such as ADA-compliant curb cuts are scheduled as necessary.
It is the responsibility of the City Council to set the standard to be achieved, using a steady citywide approach to offset repair and a district-by-district approach to major refurbishing. Data derived from the recommended IMS will update the status and quantify the cost.
Streets
Palo Alto maintains 473 lane-miles of streets. They are the City’s most significant surface asset, and their health varies. Street condition is measured on a Pavement Condition Index (PCI) scale from 1 to 100. Streets rated 59 or lower are considered “at risk” or “poor” (see figure 2-2).
In 2010, Palo Alto’s average rating for streets was 73, placing it below many neighboring communities rated on the same scale:
Los Altos: 82 Santa Clara: 80 Redwood City: 78 Atherton: 77 Los Altos Hills: 77 Mountain View: 76 Sunnyvale: 75 Palo Alto: 73 Cupertino: 70 Menlo Park: 63

COST OF CATCH-‐UP AND KEEP-‐UP
IBRC FINAL REPORT 38
Figure 2-‐1. Asphalt is often the mediator in the continuous battle between roots and sidewalks.
Figure 2-‐2. Street condition on Greer Road between Embarcadero and Channing, rated 38 on the PCI Index (“very poor to serious”).

COST OF CATCH-‐UP AND KEEP-‐UP
IBRC FINAL REPORT 39
Figure 2-3 shows the overall effect of funding and carrying out increased catch-up and keep-up maintenance on Palo Alto’s streets. At present, 20 percent of Palo Alto’s streets are rated under 60. IBRC recommends that, by 2021, no Palo Alto street carry a PCI rating below 60. This will raise the City average to 85 while eliminating all at-risk roads. (For the complete report of the IBRC Surface Committee, see Appendix C.)
Figure 2-‐3. Projected improvements in maintaining Palo Alto’s streets. The maroon bars show the percent of Palo Alto streets now in each PCI category. Blue shows what we plan for 2021.
Although other elements of the City’s infrastructure are not subject to a Condition Index and so cannot be quantified as readily as streets, IBRC believes that this chart generally reflects the impact that the Commission’s recommendations for implementation of a comprehensive IMS will have throughout the City, lifting overall infrastructure quality and eliminating deferred maintenance.

IBRC FINAL REPORT 40
SECTION 3
Public Safety Facilities
Public safety encompasses police, fire, medical response, rescue, utilities, intracity collaboration, intercity mutual aid agreements, shared services, and more. Central to the delivery of public safety services are the buildings that house their providers. In contrast to generic office buildings, facilities used by public safety agencies must be configured and equipped to be integral parts of the work their occupants do. That involves evidence storage, shops for repairing specialized equipment, holding cells and prisoner processing, separated decontamination areas and equipment, communications and technical tools, secure space for specialized vehicles, ammunition storage, sleeping quarters, emergency operations capacity, and a large number of other special aspects.
Moreover, these public safety buildings must be built to Essential Services building codes designed to keep them secure and functional in natural and man-made disasters. When these buildings decline into substandard or unsafe conditions, both those who use them and the community that depends on them are placed in jeopardy. With these factors in mind, the Commission focused its efforts on the Public Safety portion of City Hall and Fire Stations 3 and 4.
Problem Statement
Public Safety Building
The Public Safety Building (PSB) at 275 Forest opened 41 years ago and became inadequate shortly thereafter. The shortcomings began as annoyances when overcrowding required squeezing functions into spaces not designed for them. A first instance of this problem started with the need to create a second locker room for female officers (there were none when the building was originally designed) and eventually five rooms to accommodate all who needed lockers.
Over time, legal requirements grew, building code requirements changed, community service needs (e.g., special events, visiting dignitaries) increased, and information technology burdens on the building leapfrogged ahead. What were previously annoyances became severe constraints, hampering the City’s first responders in discharging their duties. Three

PUBLIC SAFETY FACILITIES
IBRC FINAL REPORT 41
needs assessments of the Police Department and the building housing it were completed between 1985 and 1998. The third of those (1998) was in response to a Council directive “to initiate the formal process needed for site selection and construction of a new public safety building.”
Meanwhile, conditions had incrementally and steadily deteriorated relative to potential threats in the form of terrorism, earthquake, pandemics, and the like. The City grew, as did different kinds of crime (e.g., computer fraud, identity theft). Criminal codes and law enforcement techniques expanded, along with demands on the Police Department for communications, technology, special equipment, and other crime-fighting and emergency response capabilities. In reaction, the Council sought a fourth needs assessment and formed a Blue Ribbon Task Force that delivered its report in 2006. The opening sentence of the Executive Summary read: “The Task Force recommends in the strongest possible terms that the City proceed expeditiously to build a new Public Safety Building.”
The 2006 Task Force paid close attention to justifications for the size of a new Public Safety Building. Previous studies had recommended numbers as high as 70,000 square feet.9 The estimate with which the Task Force began its work was just over 58,000 square feet, a figure arrived at by the City, the Police Department, and the consulting architectural firm, which specialized in public safety buildings. After a space-by-space review by the Task Force, that starting number was further reduced by 15 percent to 49,600 square feet, a number which it declared to be “the smallest possible size Public Safety Building consistent with present and longer term functional need.”
Nothing that our working group saw or heard contradicts that conclusion. We did note, however, that one feature might be reexamined to achieve a small further reduction. On a visit to the San Mateo Police Department, we observed that they had combined their Emergency Operations Center, a training room, and a public meeting room into one flexible space where technology enables conversion on demand for any of those uses.
The economic recession of 2008 caused cancellation of City action recommended by the 2006 Blue Ribbon Commission to acquire a purchase option on a new site. No other action had been taken. In 2011, the City is five years closer to an inevitable major earthquake and vulnerable to the other man-made and natural dangers that have grown more probable. When rather than whether an earthquake will strike is the appropriate way to pose the earthquake question. Because the issue is so often put that way, we
9 City of Palo Alto, CMR:349:05.

PUBLIC SAFETY FACILITIES
IBRC FINAL REPORT 42
cannot let familiarity anesthetize us to its stark truth. Moreover, the likelihood that an earthquake would render the current building inoperable is linked to the severity of a seismic event. Should the building collapse or for other reasons be declared unsafe to use, we must acknowledge that emergency response will be sharply reduced and the recovery of responsive and dependable public safety will be uneven and slow.
Fire Stations
Of the City’s eight fire stations, two (Station 3 at Embarcadero and Newell, and Station 4 at East Meadow and Middlefield) are more than 50 years old and in especially hazardous condition. According to a senior Fire Department official, they were originally built to the standard of homes with large garages (see figure 3-1). Because City staff judged these buildings to have “extensive structural, code, and operational deficiencies,” the City commissioned a study in 2005 which found that they “do not meet the current requirements of the California Building Code, Essential Services Act, Americans with Disabilities Act, the National Fire Protection Association, and the Occupational Safety and Health Act.”
Both Stations 3 and 4 are earthquake vulnerable, lack sufficient space for emergency supplies, lack safe separation of living quarters from the fumes
Figure 3-‐1. Palo Alto Fire Station 3 lacks sufficient space for modern equipment and does not meet current seismic standards. It was built in 1948 to codes that are now significantly out of date.

PUBLIC SAFETY FACILITIES
IBRC FINAL REPORT 43
of engines and hazardous materials, and can barely hold the two engines located at each as those vital pieces of equipment have grown in size and capacity over the years. For example, Station 3 has only 12 inches of space between engines and the back wall of the apparatus bay. Contemporary fire stations typically have drive-through bays to avoid the unsafe need to back in the engines, a maneuver that risks damage to engines and buildings alike and often requires stopping traffic on the roads fronting the stations.
In our study of public safety facilities, IBRC focused attention on police, fire, communications, and emergency management. As we learned over several months of visits, interviews, conversations, and review of past studies, Palo Alto’s public safety facilities cannot be relied upon to deliver the level of services the community has come to expect: protection from unusual hazards, quick emergency response, and reliable recovery from disaster.
A City-commissioned “Fire Services Utilization and Resources Study” (2011) recommended that the City “replace or significantly upgrade Stations 3 and 4 at or near their present locations.”10 The study further noted that these two locations are “good overall and could not be eliminated without degrading coverage” (service delivery time). In their present condition, “there are few options to expand services provided by these stations, even if the need were justified.”
In addition to firehouse condition and location, the study made department-wide recommendations about more efficient deployment of medical emergency responders to reduce the use of engines when smaller emergency medical units could be dispatched. These recommendations deal with management, staffing, cross-training, and dispatch system methodology: all are management issues outside IBRC scope.
As for more specific infrastructure issues, the study made the point that Palo Alto firehouses are generally small “and this fact limits the deployment changes which the fire department could make.” Given that emergency incidents are estimated to increase from 7,938 in 2010 to 9,417 in 2020,11 structural soundness and flexible capacity seem to the Commission strong justification for recommending that Fire Stations 3 and 4 be brought up to a standard that will serve the City well for the next several decades.
10 “Fire Services Utilization and Resources Study” prepared by TriData Division, System Planning Corporation, and ICMA Center for Public Safety Excellence, January 2011, p. 97. 11 2011 TriData/ICMA Study, p. 37.

PUBLIC SAFETY FACILITIES
IBRC FINAL REPORT 44
Findings
The IBRC Public Safety Working Group based its findings on the following:
• Careful study of six previous reports.12 • Detailed discussions with Dennis Burns, Interim Director of Public
Safety and Chief of Police; Catherine Capriles, Acting Deputy Fire Chief; Ken Dueker, Director, Office of Emergency Services; and Sgt. Patty Lum, Palo Alto Police Department.
• Examination with principals of Hohbach-Lewin (structural engineers) and Stoecker-Northway (architects) of their 2010 feasibility study of rebuilding the PSB at its current site.
• Tours of the current PSB, Fire Stations 3 and 4, the San Mateo Police Department, and Mountain View Fire Stations 1 and 5.
Principal findings were as follows:
1. The current PSB is not designed to facilitate the efficient flow of police activities. It is overcrowded. It lacks the capacity to accommodate increased use of technology or future service demands. And, it falls short of OSHA (Occupational Safety and Health Administration) and other legal specifications (see figure 3-2).
2. Fire Stations 3 and 4 were built near the midpoint of the last century and are poorly designed and too small for their current uses.
3. The current PSB and Fire Stations 3 and 4 are vulnerable to damage in a severe earthquake that could render them inoperable for an extended period. The U.S. Geological Survey (USGS) estimates the probability of a large earthquake in the next 30 years on the nearby San Andreas Fault at about 21 percent and on the Hayward fault at 32 percent;13 further, it notes that the 1989 Loma Prieta earthquake at 6.9 was not “the Big One.”14
12 (1) 2003–2004 Santa Clara County Grand Jury Inquiry into Police Evidence Rooms in Santa Clara County, August 2004; (2) Fire Stations No. 3 and 4 Replacement Needs Assessment Study, April 2005; (3) Blue Ribbon Task Force Report on the Public Safety Building Project, June, 2006; (4) Feasibility Study, Palo Alto Public Safety Building 275 Forest Avenue, Palo Alto, CA, May 2010; (5) Fire Services Utilization and Resources Study, January 2011; (6) Toward a Resilient Future: A Review of Palo Alto’s Emergency Preparedness, March 2011. 13 US Geological Survey, “2008 Bay Area Earthquake Probabilities,” http://earthquake.usgs.gov/ regional/nca/ucerf/ 14 US Geological Survey (2007), Putting Down Roots in Earthquake Country: Your Handbook for the San Francisco Bay Region, http://earthquake.usgs.gov/regional/nca/prepare/index.php

PUBLIC SAFETY FACILITIES
IBRC FINAL REPORT 45
Figure 3-‐2. Evidence storage for the Palo Alto Police Department (left) is well below current law enforcement standards and is cramped for space. Current standards call for updating Palo Alto to a system like the evidence storage lockers used by San Mateo (right).
4. The current PSB lacks blast protection from outside and below (see figure 3-3). The PSB and fire stations were built for the last century’s public safety and community service needs, not for current and projected emergency response services.
5. Estimated replacement costs are Public Safety Building – $65 million; Fire Station 3 – $6.7 million; Fire Station 4 – $7.5 million. [Note: These estimates are several years old and would need to be redone with specific designs in mind. In the case of the contemplated Public Safety Building, its contents would include elements not included in the previously estimated structure, namely, an Office of Emergency Services and the administrative component of the Fire Department. These are together estimated to add another 7,500 square feet plus allowances for circulation and shared spaces, additions which have been included in the $65 million estimate. In the case of Fire Station 4, the 2005 cost estimate includes a meeting room no longer needed since the construction of the Mitchell Park Community Center; this removes approximately 1,000 square feet from the conceptual design.]

PUBLIC SAFETY FACILITIES
IBRC FINAL REPORT 46
Recommendations
In view of the findings, IBRC recommends the following actions:
3-1 Build a new Public Safety Building as soon as possible on a new site, incorporating the Police Department, the Fire Department administration, the Communications Center, the Emergency Operations Center (EOC), and the Office of Emergency Services.
The current PSB is unsafe and vulnerable. Its inadequacies in terms of capacity, operational efficiency, technology, and flexibility were well documented in the 2006 Blue Ribbon Task Force study and have not improved with time. Public safety should be a top priority for any city but – in terms of proper facilities – that priority has for many years been dangerously deferred in Palo Alto. An imperative initial action should be site acquisition, preferably the Park Boulevard (or equivalent) site previously identified by the 2006 Task Force. It is unlikely that a new facility will be less expensive or cheaper to finance in the future. The City should proceed with one of the suggested financing options (discussed in section 5 of this report) as soon as possible.
Figure 3-‐3. The Palo Alto Police Department garage is open at both ends and sits above the city public parking garage. Being so situated renders it extremely insecure, vulnerable to penetration or blasts from both outside and below. A more defensible design would have just one secured entry point located away from the vehicle fleet.

PUBLIC SAFETY FACILITIES
IBRC FINAL REPORT 47
3-2 Rebuild and significantly upgrade Fire Station 3 (Newell and Embarcadero) and Station 4 (Middlefield and East Meadow) at their present sites as soon as possible.
Fire Stations 3 and 4 are more than 50 years old, do not meet current earthquake codes, and have become increasingly inadequate as engines have grown in size. Demands for hazardous materials processing, equipment storage, and safer conditions for the personnel housed there have also grown, and the role of these stations in emergency preparation and response has increased.15
Options NOT Recommended for Further Consideration
Rebuild a Public Safety Building at the present site. This would require two years of dislocation, moving departments to alternate site(s) and returning them at great cost with no residual value from the several million dollars required for temporary relocation. Municipal parking would lose approximately 100 public parking spaces and several City functions would have to be relocated. Ingress and egress to and from the municipal parking garage to accommodate public and police parking would be clumsy and hazardous. The resulting building would still lack blast protection, allow no room for flexibility and expansion, require relocation of existing City Hall functions, fail to achieve the level of structural integrity of a new building, and is unlikely to be economical in the long run.
Split locations for public safety functions. It has been argued that separating functions to take advantage of different levels of stringency in building code requirements would reduce construction costs, since not all elements would need to be built to the more stringent Essential Services codes. That course is not recommended because it would require duplicated features at separate sites, reduce face-to-face communication, increase travel time for those with business at more than one site, and have many of the same defects of the present site if that site were retained as part of a multi-site set of Public Safety Buildings. When police, communications, the EOC, and other functions are mobilized for a major incident, such as a kidnapping, riot, search for a shooter, or plane crash, public safety must function as a single unit, a
15 The Fire Services Utilization and Resources Study, January 2011, recommended consolidation of Fire Stations 2 and 5 to save on operating costs. We reviewed this recommendation but considered it pertinent to City public safety operations rather than infrastructure.

PUBLIC SAFETY FACILITIES
IBRC FINAL REPORT 48
difficult requirement to meet if functions are scattered in multiple locations.
Participate in an intercity facility. Interagency collaborations are in place – mutual-aid agreements, joint use of emergency communications and firefighting with Stanford, and a virtual communications network to facilitate backup in allied municipalities. More such arrangements conceivably could be established. Major intercity mergers of functions are, however, problematic. They have a mixed record of success, oblige careful study, take a long time to assess, and may increase response times and the potential for disagreements over deployment when concurrent demands are high.
Possible Scenarios If No Action Is Taken
Although the City maintains a mobile emergency operations center (MEOC) that can be deployed in the short run and for particular events, this center is not a substitute for a permanent facility. No matter what the emergency, sustaining operations is the key to public safety. Intact facilities are, in turn, key to sustainability. Following are a number of possible events that could jeopardize public safety if no action is taken.
Serious earthquake. A Public Safety Building operates around the clock and the calendar; it is indispensable in and after a disaster. Major damage to our PSB from an earthquake of significant magnitude could render useless the Emergency Operations Center, the Communications (911) Center, both the police and public garages, and the rest of the current structure. Impaired would be emergency assessment, response, and recovery, both immediate and long-term. Even if there were no collapse, building systems (electricity, plumbing, safe ingress and egress) and building integrity could be compromised and facilities rendered unsafe and unusable. Though an earthquake of 7.0–7.5 or worse would do damage far beyond the scope of public safety, a functioning PSB is critical to reliable emergency communications inside and outside the city (including the Utilities Department), to emergency management over the longer term (which could be many months), to maintenance of order and stability on streets and in commercial and residential districts, to suppression of criminality triggered by post-earthquake disorder, and to meeting comparable demands.
Loss of Fire Stations 3 and 4 would cause probable loss of life and injuries among firefighters living there, inaccessibility to engines and equipment, loss of the neighborhood Incident Command function that

PUBLIC SAFETY FACILITIES
IBRC FINAL REPORT 49
fire stations serve for community emergency response, and severe overtaxing of the other fire stations and equipment that remain in operation.
The more severe the earthquake, the more severe and protracted the consequences. As occurred with Katrina in New Orleans, cleanup and rebuilding could be slow and difficult. Some residents, City staff, and businesses could leave, City revenues could plummet, and crime would be likely to increase. In such circumstances, a fully functioning Public Safety Building (and the ability to deliver police, fire, utility, and emergency communication services) would be critical in mitigating the consequences of wide damage and shortening the recovery period.
Terrorist attack. Such attacks can take many forms. They could be attacks on the current PSB itself, which is poorly protected from any kind of blast or incendiary assault. The building could be rendered inoperable, killing and injuring many officers and staff and blocking all vehicles in police and public garages other than those on the streets at the time of attack. If chemical, radioactive, or biological weapons were involved in such an attack, the damage would be multiplied many times if response capability were compromised.
If a PSB were free-standing and not closely connected to other public or high-density buildings, it could better withstand chemical or biological terrorism. Protection would not be perfect, but such a building could be sealed until the event subsided and staff could operate key communications and emergency operating functions over electronic networks until it was safer to have officers circulate in the community.
Civil unrest. The current PSB, by virtue of its structure and location, would be difficult to defend and to keep fully operational in the event of marches, riots, and other disruptions of the sort affecting Stanford in the 1960s and ’70s (and, indeed, cities today). A building in another location, away from co-located “targets” like City Hall, protected by a perimeter that was readily defensible, would enhance the City’s capacity to respond.
Other disasters. Pandemics, floods, airplane crashes, pipeline explosions, and other natural or man-made emergencies and disasters will place heavy demands on a public safety function that may require housing officers and communications staff, stockpiling food or medical supplies around the clock, and other responses that the current PSB is inadequate to deal with.

PUBLIC SAFETY FACILITIES
IBRC FINAL REPORT 50
There are many public safety implications to disruption of normal functions in a city of our size and complexity, no matter what the cause. Here are some examples of the commerce, transportation, and other services that people expect to have when needed:
Reuniting school children and parents in an orderly and expedited manner.
Providing access to prescription drugs. Assisting people dependent on medical devices, care, and treatments. Assuring access to and security of Stanford Hospital. Securing access to fuel for public and private vehicles. Helping critical City staff who live outside Palo Alto to get to
their jobs. Maintaining communication within the community and with
surrounding jurisdictions and other emergency responders. Ensuring continuity of City government and emergency
response and recovery. Suppressing crime. Responding to events brought about by the stress of post-disaster
conditions, such as domestic disruption, competition for resources, mental breakdowns, and so forth.
The Challenge of Complacency
Palo Alto has long been a relatively safe, peaceful, and well-ordered city. Many residents and visitors see patrol cars circulating around town. Few have reason to call on police, firefighters, or paramedics or to have public safety personnel call on them. Response times following 911 calls are short; police, fire, and emergency medical staff are well trained, competent, courteous, and firm; and the many aspects of public safety in a complex and active city are normally handled quietly and efficiently.
In truth, so much of what keeps the police, fire, and related public safety functions naturally out of sight is also what minimizes public awareness of their importance. The community takes for granted responses that depend upon many conditions. Chief among those conditions are facilities that are safe, functional, adequate in their capacity to enable performance over a wide range of public safety situations, and, most important, will be standing and operational in and after a disaster.

IBRC FINAL REPORT 51
SECTION 4
Municipal Services Center / Embarcadero East Corridor
The Municipal Services Center (MSC) and the Animal Services Center (ASC) are currently located on the southwestern edge of the Baylands, off US 101 (Bayshore Freeway), as seen in figure 4-1. These aging facilities have been in need of upgrade or replacement for many years. That situation has not changed. However, some new possibilities have emerged, offering to transform the problem site into an opportunity for Palo Alto to optimize its infrastructure and enhance the delivery of services. This section of the IBRC report explores multiple scenarios for upgrading the MSC and ASC facilities while creating room for economic development along the Embarcadero East corridor in a fiscally responsible and exciting way.
Inasmuch as the City has already budgeted for a professional consultant study of MSC repair costs, the working group on the MSC/ASC has focused on identifying appropriate issues for that consultant to consider.
Figure 4-‐1. Aerial photo of the current MSC site. Appendix E shows a diagram of site usage by department.

MSC/EMBARCADERO EAST
IBRC FINAL REPORT 52
Problem Statement
The City of Palo Alto owns 16.1 acres of land on East Bayshore Road where it currently operates a number of critically important municipal services, including the operations of the Public Works, Utilities, Community Services, Stores and Warehouse, and Animal Services departments.
The MSC site lies in a flood zone on the east side of the freeway. This location creates risks and exposures related to resiliency and disaster recovery; a damaging flood, earthquake, or other catastrophic event could prevent or impede the movement of emergency response vehicles into the city and/or disrupt the Utilities Department’s emergency operations center currently housed at the MSC. In addition to these risks, a failure to pursue business development projects related to the location of the MSC might create certain economic risks. Potential economic redevelopment of the MSC site would help protect the City’s sources of sales tax revenue, a critical component of the City’s budget.
As shown in table 1-1 in section 1 of this report, the total cost of major infrastructure projects is estimated to be approximately $211 million, of which $93 million is earmarked for MSC building replacement and another $6.9 million for relocating the animal shelter. Thus, approximately 47 percent of the City’s total current backlog of major infrastructure projects relates just to the MSC and ASC.
While this report focuses proportionately more attention on the MSC, the City’s strategy and plans for Animal Services merit reexamination. City staff has evaluated the cost of moving Animal Services to a nearby site at the former Los Alto Sewage Treatment Plant (LATP) (see figure 4-2). Meanwhile, the ASC has had a contract with the City of Mountain View to provide animal control services for an estimated $450,000 per year; this contract expires in 2014. In November 2011 the Mountain View City Council received a report that recommended switching its animal control services to the Silicon Valley Animal Control Authority in Santa Clara, noting that “Palo Alto has identified its Animal Control Services Center as being functionally obsolete and in need of extensive repairs and seismic upgrades.”16 The contract requires a one-year notice of intent to terminate, but the Mountain View Council voted to make the switch.17 Cost-cutting
16 City of Mountain View, Police Department/City Manager’s Office, “Animal Control Services,” Council Report for the meeting November 1, 2011; downloaded from mountainview.granicus.com. 17 “Mountain View Council dumps Palo Alto animal control service,” Palo Alto Online, November 7, 2011.

MSC/EMBARCADERO EAST
IBRC FINAL REPORT 53
Figure 4-‐2. The existing MSC/ASC site lies between the Oregon and San Antonio freeway interchanges. The LATP site along San Antonio offers a potential location for a new Animal Services facility.
was a priority, and lower-cost services from County providers offered a feasible solution.
Palo Alto officials regret the Mountain View City Council’s decision, noting that repairs have been made to the ASC in recent years to address termite damage, roof condition, and functioning of the HVAC system, along with other issues. Still, Palo Alto needs to take this loss of revenue into account while also considering the option of obtaining its animal services through Santa Clara County or the Silicon Valley Animal Control Authority, as other cities do.
Background and History
The City’s original MSC was built in 1914 on land leased from Stanford University on El Camino Real. Beginning in 1964, the City began to relocate its services to the current site across the freeway, and by 1972, the relocation was complete. Certain parks and golf course maintenance
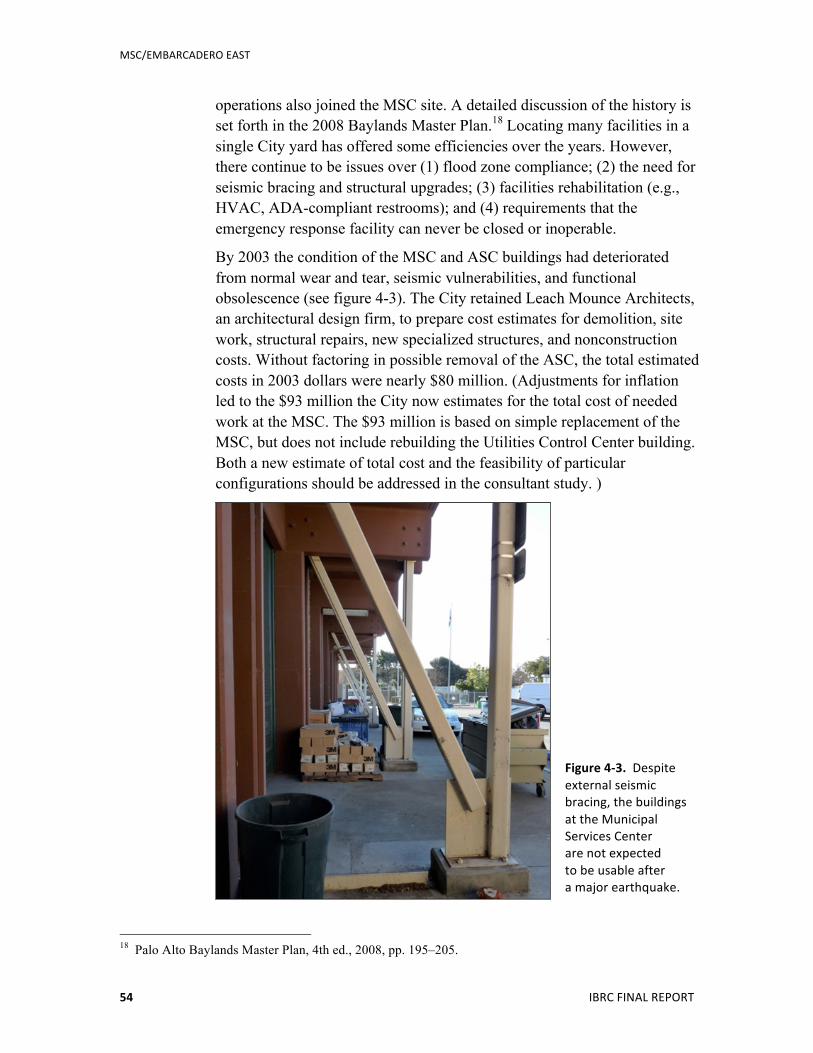
MSC/EMBARCADERO EAST
IBRC FINAL REPORT 54
operations also joined the MSC site. A detailed discussion of the history is set forth in the 2008 Baylands Master Plan.18 Locating many facilities in a single City yard has offered some efficiencies over the years. However, there continue to be issues over (1) flood zone compliance; (2) the need for seismic bracing and structural upgrades; (3) facilities rehabilitation (e.g., HVAC, ADA-compliant restrooms); and (4) requirements that the emergency response facility can never be closed or inoperable.
By 2003 the condition of the MSC and ASC buildings had deteriorated from normal wear and tear, seismic vulnerabilities, and functional obsolescence (see figure 4-3). The City retained Leach Mounce Architects, an architectural design firm, to prepare cost estimates for demolition, site work, structural repairs, new specialized structures, and nonconstruction costs. Without factoring in possible removal of the ASC, the total estimated costs in 2003 dollars were nearly $80 million. (Adjustments for inflation led to the $93 million the City now estimates for the total cost of needed work at the MSC. The $93 million is based on simple replacement of the MSC, but does not include rebuilding the Utilities Control Center building. Both a new estimate of total cost and the feasibility of particular configurations should be addressed in the consultant study. )
Figure 4-‐3. Despite external seismic bracing, the buildings at the Municipal Services Center are not expected to be usable after a major earthquake.
18 Palo Alto Baylands Master Plan, 4th ed., 2008, pp. 195–205.

MSC/EMBARCADERO EAST
IBRC FINAL REPORT 55
In 2006 the City Council conducted a study of the MSC that included discussions between the Mayor’s Retail Attraction Committee and auto dealers who had expressed interest in an auto dealer cluster along the Bayshore Freeway. The City had suffered a precipitous decline in sales tax revenues: in 2000, seven auto dealers were generating about $3.1 million in sales tax revenues; by 2006, this had declined to five dealers generating about $1.9 million. The auto dealers indicated that sales might increase substantially with a freeway-visible site, noting the potential marketing synergies from having several dealers in a cluster.19 The City invested substantial time and expense in further analysis of a possible “land swap” with auto dealers; however, jeopardized by the recession of 2008–2009, these plans were put on the shelf.
Noting signs of an economic recovery, the City and the auto dealers have now renewed their discussions, with good reason: by 2010, sales tax revenues from auto dealers had further declined to less than $1.3 million. Just two dealers remained on Embarcadero Road in 2011, on parcels zoned as PC-4847 and PC-4846.
Most of the issues set forth in the 2006 MSC/Auto Dealer Study Session remain relevant. The lack of any immediately available 15- to 17-acre alternative site for the MSC operations suggests that a split-site option may be more feasible. Possible sites include the 7-acre site comprising the Honda and Audi dealerships on Embarcadero Road and the LATP site with 6.5 usable acres. Because City operations could not shut down during a move, this project would entail a multi-year implementation plan with complicated staging issues. Concluding that this would be a complex and challenging project, the 2006 Study Session identified four key questions:
Are split sites acceptable? Is there sufficient economic benefit to the City? Can we accommodate staging and efficiency challenges? Are we willing to make required land use changes?
The Need for an Expanded Study
City staff has created a Capital Improvement Project (CIP) for a Municipal Services Center Facilities Study (PE-12004) at an estimated cost of $100,000. Such a study is intended to analyze options for locating City functions, personnel, and equipment currently housed at the MSC/ASC.
19 Minutes from MSC/Auto Dealer City Council Study Session, July 17, 2006.

MSC/EMBARCADERO EAST
IBRC FINAL REPORT 56
After extensive review, IBRC has concluded that existing cost estimates to replace the MSC and ASC are out of date and not based upon actual bids from contractors. Moreover, a pivotal question has not been addressed by the City Council: should the MSC and/or ASC facilities remain at the Baylands site, or would some of these operations be better placed at other locations (the split-site option)?
Pursuing the split-site option could generate opportunities for commercial development at the current East Bayshore Road location, as well as City acquisition of land along the Embarcadero Road corridor east of the Bayshore Freeway. This approach not only would address risks related to disaster recovery and emergency response, but also would support economic development and alleviate the secondary risk of declining sales tax revenue without adversely impacting the Baylands Master Plan.
IBRC believes that the planned MSC Facilities Study needs to be expanded beyond its current projected scope, taking into account elements of the current situation described in this report.
Analysis of the Current Situation
Sited on land classified by FEMA as a flood plain, the MSC facilities are therefore subject to more stringent building code restrictions. In the long term, global climate trends may continue to produce warming conditions that raise the level of water in the San Francisco Bay. Additionally, all of Palo Alto falls within an active seismic zone; a recent study found it likely that one in five freeway overpasses in the Bay Area could fail in a severe earthquake and become impassable.20 Getting service and emergency response vehicles into Palo Alto from the current MSC site depends on intact overpasses.
The Association of Bay Area Governments (ABAG) has conducted analyses of various disaster scenarios and their possible effects on infrastructure systems. ABAG notes that infrastructure is critical to a safe and resilient economy and that disruptions can lead to disproportionate economic impact.21 An example of what can happen is Japan’s experience after the March 2011 earthquake and tsunami. Disaster response was hindered when emergency and utility repair vehicles were reportedly caught in gridlock and blocked from the communities in crisis.
20 Transportation for America, “New Report Ranks Deficient Bridges by Metro Areas,” October 19, 2011, http://t4america.org/ 21 ABAG Earthquake and Hazards Program: Local and Regional Long-Term Disaster Recovery Issue Paper, March 3, 2010.

MSC/EMBARCADERO EAST
IBRC FINAL REPORT 57
All of the Utilities and a portion of the Public Works operations at the MSC are emergency response operations. In case of a major earthquake or other catastrophe that causes failure of freeway overpasses, emergency response is likely to be impaired. Developing a plan for a new operations center should consider siting it west of Bayshore to mitigate this potential problem. A secondary need is to site the operations center out of the flood zone or deal with flood risks in the construction plans.
In addition to unexpected catastrophes, a widely recognized long-term disaster is unfolding. According to projections of the San Francisco Bay Conservation and Development Commission (BCDC), the sea level of the Bay could well rise 16 inches by the middle of this century. This will continue until, by the end of the century, a 55-inch sea level rise is anticipated (see Appendix F).22 Sea level rise is a significant consideration for the viability of the MSC and ASC sites. Some experts have explored the potential cost of strengthening levees, dikes, or other barriers to hold back rising water levels, but such projects are estimated to cost orders of magnitude more than the alternative of relocating critical facilities to higher ground.
Another situation to consider is that the Utilities Department is currently located in three different sites: the MSC, City Hall, and rented space on Elwell Court. Development of a new, consolidated operations center, including a multi-story office building in addition to the shops and other operations now at the MSC, would allow for increased efficiencies in the delivery of Utilities services. As an additional benefit, consolidation would eliminate the rented offices on Elwell Court and open up space in City Hall, allowing City functions such as the Development Center to move into City Hall from its current rented space downtown. Estimated savings on office rent for the City would be over $875,000 per year. Public Works also has office staff at both the MSC and City Hall and could consider relocating some staff to the operations center to improve operating efficiency. The sizing of the operations center to fill these needs, in both land area and building space, must be identified as a major output of the expanded study report.
Planning for repurposing the MSC site must begin with a plan to relocate the operations that currently reside at the MSC. Foremost among these are Utilities and Public Works operations, which together occupy about 47 percent of the building space and over 36 percent of the land area at the MSC (see Appendix E). Lack of an easily identifiable site to which these
22 San Francisco BCDC, San Francisco Bay Scenarios for Sea Level Rise, 2007, http://www.bcdc.ca.gov/planning/climate_change/index_map.shtml

MSC/EMBARCADERO EAST
IBRC FINAL REPORT 58
operations could be relocated has over the years been a major stumbling block in plans to repurpose the MSC site into a revenue generator for the City. Identification of a suitable site(s) for relocating these operations must be included in the statement of work for the MSC study and identified as a major output of the study report.
An Overview of the Options
IBRC believes that timely action is needed to make the necessary repairs to the MSC and ASC. Indeed, because of the emergency response and disaster recovery implications, these projects have some degree of urgency. The Commission sees two distinct options for moving forward:
“Static” option. This would involve renovating the MSC and/or the ASC at their current locations. There would be no need to review policies set forth in the Baylands Master Plan, and no additional land would need to be acquired. However, the static option would not be without risk. Sales tax revenues from auto dealers have declined and may be further reduced if one or more dealers leave Palo Alto. There are economic resiliency and disaster response risks associated with the current MSC location. In addition, the City’s need to rent very expensive office space in the downtown area would not be mitigated by this option. Possible variations on the static option are described in the following pages.
“Dynamic” option. This approach is far more complex and would create many more opportunities. It would begin with splitting the functions now at the MSC and relocating each to new sites that would enhance the delivery of services. For example, because both Utilities and Public Works bear significant responsibility for emergency response, moving to a site or sites west of Bayshore would have considerable benefit. The ASC and the parks and golf maintenance operations might relocate to the LATP site, an idea that has been preliminarily studied by City staff. The City could then negotiate with auto dealers for the development of a freeway-visible auto dealer cluster on East Bayshore Road, perhaps giving the City ownership of parcels along the Embarcadero East corridor where two auto dealers are currently located.
Because Embarcadero East is now home to numerous office buildings, restaurants, and a potential hotel development, the 7-acre parcel available to the City in a land swap with auto dealers might be considered for office

MSC/EMBARCADERO EAST
IBRC FINAL REPORT 59
space to alleviate the City’s current costs of renting space downtown. While the dynamic option has many variables and challenges, we note a recommendation from IBRC that police services at the Civic Center be moved into a new Public Safety Building, most likely in the California Avenue/Park Boulevard area. Opening new office space for City employees along the Embarcadero East corridor and repurposing the police headquarters space (or replacing it altogether) could lead to revitalizing the Civic Center complex, particularly if some municipal employees shift to a new Embarcadero East building.
IBRC recommends that the budgeted consultant study of MSC and ASC replacement be expanded to include both the static and dynamic options. Please note that both options conform to the current developmental footprint and there will be no encroachment into the Baylands. The consultant should be asked to identify potential costs or benefits, including any significant risks associated with either option. In addition, the estimated costs of relocating or repairing and upgrading the ASC should be compared with the cost of contracting with a County agency for animal control services, assuming an acceptable level and quality of service can be maintained. Due to the expanded scope of the requested study, the CIP amount should be increased as needed.
A Preliminary Look at Some Options
The City has a wide range of potential scenarios to address future needs that are currently met by the services based at the MSC. Each of these involves different costs, risks, and benefits.
1. Minimal change. This is in essence the static option. It assumes that all City operations now at the MSC and ASC will remain in the same location, and that bids will be sought for any necessary repairs or improvements needed to comply with regulations applicable to the flood zone, seismic conditions, and emergency operation responsibilities. No impact on the Baylands Master Plan is contemplated, nor would there be any City acquisition of land on the Embarcadero East corridor. The LATP site would remain vacant. Efficiencies of functions located on the single site would be retained. Resiliency and disaster response concerns would not be mitigated.
2. Rebuild MSC at the same site. This variation on the static option would involve a project to demolish and replace all of the MSC and the ASC structures in their current location. Although out of date and therefore inaccurate, cost estimates from the 2003 study provide a

MSC/EMBARCADERO EAST
IBRC FINAL REPORT 60
rough idea of the potential cost. While the cost of completely rebuilding the MSC may be higher than the first option, all other factors would be similar.
3. Utilize LATP for ASC and golf/parks maintenance. Either of the first two options could be modified by selective relocation of some City functions that may not provide essential synergies with the Utilities and Public Works activities. For example, the LATP site (see figure 4-4) might be favored as a new location for the ASC and some of the golf course and parks maintenance operations. By moving certain City functions out of the MSC, the concept of a freeway-visible auto dealership on East Bayshore could become feasible. In this scenario, the Utilities and Public Works buildings might be rebuilt in the back portion of the 16-acre MSC site, leaving the front portion open for other uses.
4. Embarcadero East corridor land swap. If the City negotiates a transaction with auto dealers that results in “swapping” approximately 7 acres of freeway-visible property on East Bayshore Road for the current auto dealer parcels on Embarcadero Road (highlighted in figure 4-5), this leads to the split-site option for MSC operations noted in the 2006 City Council Study Session. Presumably, there would be
Figure 4-‐4. The LATP site, annexed to Palo Alto in 2008, offers a relocation possibility for some City services, including the ASC.

MSC/EMBARCADERO EAST
IBRC FINAL REPORT 61
a plan to accommodate all of the current MSC operations at a combination of the Embarcadero Road parcels PC-4847 and PC-4846, the back portion of the MSC site, and the LATP site. Both the City and the auto dealers would expect a freeway-visible auto dealer cluster to result in increased sales and tax revenues. Appendix G shows related concept drawings for freeway-visible dealerships.
There may be other possibilities for improvements along the Embarcadero East corridor, consistent with City policies and the Baylands Master Plan. For example, upon assuming direct control of the airport, the City may find it desirable to plan a restaurant–conference center between the golf course and airport.
5. Land swap + resiliency. The City is mindful of the risks of having the MSC operations on the edge of the Baylands, in particular, those risks related to flood zone, seismic, and disaster response issues. If this concern is a priority, acquisition of land west of Bayshore Freeway for Utilities and Public Works would mitigate such risks, although such property acquisition presents its own inherent difficulties.
Figure 4-‐5. Aerial view of Embarcadero East, showing auto dealer parcels highlighted in pink between Ming’s Restaurant and Faber Place.

MSC/EMBARCADERO EAST
IBRC FINAL REPORT 62
A possible location might be found in the East Meadow Circle/Fabian Way area. In this scenario, the Embarcadero East corridor parcels offered to the City by the auto dealers need not be used for fleet maintenance, warehouse, and Utilities/Public Works operations. Instead, consistent with adjacent properties, the 7-acre parcel could be developed as attractive office space. Currently, due to insufficient office space at City Hall, the City rents additional space in the expensive downtown area; this cost might be lowered or eliminated if City employees were located in a new building on the Embarcadero East corridor.
6. Complex infrastructure interdependencies. What might the future bring? How should we plan for interdependencies in the allocation of the City’s infrastructure investments? Based on other needs and priorities, the City may face important decisions about the disposition of the police services at the Civic Center. If the City Council and the voters were to approve a new Public Safety Building, then the City could consider the best future use of the existing public safety facility and the land it occupies. If the City also takes steps to acquire City-owned office space on the Embarcadero East corridor, there may be new public and private uses and activities on the Civic Center block. Indeed, the price per square foot of office space in the Civic Center may be the highest in Palo Alto. A long-term plan to capture this value by relocating some of the operations currently located at City Hall might yield an economic windfall to the community.
The City needs to consider the interrelationships among the following: the expected redevelopment of Cubberley in the next ten years by the opening of a new secondary school; the option for the City to develop community center facilities on its 8-acre parcel on Middlefield Road; a new Public Safety Building in the California Avenue area; improvements along the Embarcadero East corridor; acquisition of land in the East Meadow Circle/Fabian Way area for Utilities and Public Works; strengthened resiliency and disaster response. Taken together, all may create a roadmap for continuous improvement of the environment and services enjoyed by Palo Alto.
Financial Impacts
IBRC feels there is a lack of data needed to evaluate the overall financial impact of different plans to deal with future operation and maintenance of the MSC and ASC. Such data would ideally encompass both the expense

MSC/EMBARCADERO EAST
IBRC FINAL REPORT 63
and the revenue sides of the equation and perhaps some quantification of the economic and disaster resiliency risks. Given the many different paths the City might consider, it would be helpful for the City Council to narrow the universe of choices into a short list. Such direction would enable the consultant to deliver up-to-date estimates of project costs and associated revenue impacts in order to reach a final recommendation. The minutes of the MSC/Auto Dealer Study Session in 2006 address many of these issues, although the assumptions and relevant facts must be updated to reflect present conditions.
An important financial consideration – and opportunity – arises because the Utilities Department is a primary tenant at the MSC. As a regulated utility, the Palo Alto Utilities Department may finance the reasonable and necessary cost of facilities required for its operations through issuance of utility revenue bonds. Thus, a significant portion of the costs associated with the split-site option – namely, costs attributed to the Utilities needs – would not be subject to ballot approval. As suggested in IBRC’s analysis of financing options (section 5 of this report), the remaining costs might be financed with income from revenue-producing initiatives in the redesigned MSC/Embarcadero East area.
Sales tax is an important component of the City’s financial stability. The City recognizes a need to pursue economic development strategies that enhance the benefits for businesses to locate in Palo Alto and, for that reason, has begun to consider the creation of an auto dealer cluster along East Bayshore Road. A similar analysis might pertain to transient occupancy taxes and the City’s revenue source from hotel operations or sales tax revenue from retail stores.
The MSC site thus presents an opportunity to increase revenue generation for the City. If this 16-acre site adjacent to the freeway were open to appropriate commercial development, respecting the environmentally sensitive character of the Baylands, a range of potential revenue-generating uses might be contemplated. One might foresee new retail activities such as auto dealerships or big-box retail outlets, perhaps development of a hotel and restaurant complex, or a corporate business campus. Thus, while optimizing certain City operations by relocating them to new facilities closer to their end users, the City-owned property could itself be optimized in an aesthetically pleasing manner for a combination of economic development and resiliency benefits.

MSC/EMBARCADERO EAST
IBRC FINAL REPORT 64
How We Studied the Issues
In its review, the working group on the MSC had substantial support from many individuals. Key elements of the review process included these:
A tour of the entire MSC facility accompanied by Steve Emslie, the Deputy City Manager; Matt Raschke, Public Works Senior Engineer; and Thomas Fehrenbach, Economic Development Manager. This included a tour of the ASC conducted by Sandra Stadler, Animal Services Superintendent.
A tour of the auto dealerships on Embarcadero Road conducted by John Anderson (owner, Anderson Honda) and Charley Burton (owner, Carlson Audi). Together with City staff, the auto dealers explained the pros and cons of revisiting the land swap proposal studied by the City Council in 2006.
A meeting with the City’s Utilities and Public Works departments, the primary tenants at the current site, who confirmed a high level of interest in pursuing plans to relocate their operations.
Materials reviewed by the working group included these:
Baylands Master Plan (2008) and the policies enumerated therein with respect to the MSC and the ASC.
MSC/Auto Dealer Study Session (2006). Cost estimates for replacement of the MSC and ASC, found in the
“Infrastructure Future Needs - Backlog” table in the Palo Alto Capital Budget, FY 2012.
IBRC has conducted meetings open to the public, inviting input and feedback from residents. The MSC Working Group has made an effort to understand concerns and potential objections to the recommendations we are making. We realize that our community places a high value on the environmentally sensitive characteristics of the Baylands, which may lead to concerns about continuing to operate Utilities, Public Works, warehouse, fleet maintenance, and Animal Service functions at that site, or concerns about commercializing part or all of the 16 acres. Any such questions would be relevant to the recommended consultant study, with further opportunity for public involvement and comments.
The following lists summarize the IBRC findings and recommendations related to the MSC/ASC site.

MSC/EMBARCADERO EAST
IBRC FINAL REPORT 65
Findings
1. The present condition of the MSC necessitates either extensive repairs or rebuilding in order to maintain essential City services and comply with applicable codes and regulations.
2. The current layout of the MSC is not space efficient; the operations currently located there could be based on less acreage.
3. Although certain repairs were made to the ASC in recent years, in order to enhance delivery of services and revenue to the City the ASC would require further work to bring it to current standards, or it should be relocated to a new facility.
4. Options for relocating the City operations now based at the MSC site to other areas of the City might be more advantageous for those operations while creating an opportunity for revenue generation at the current site.
5. The Comprehensive Annual Financial Report (CAFR) for FY 2010 shows that sales tax revenues provided approximately 15 percent of the City’s General Fund; however, sales tax revenue from auto dealers has steadily declined (see figure 4-6). As a corollary, the number of auto dealers in Palo Alto declined from seven in 2000 to three in 2011. Carlsen Porsche relocated from Embarcadero Road, and Ford, Nissan, and Volvo vacated sites on El Camino Real. Two dealerships remain on Embarcadero East (Honda and Audi), and a third (Toyota) is located on Middlefield Road.
Figure 4-‐6. Sales tax revenue from auto dealerships has declined from over $3.1 million in 2000. Although not shown in this graph, sales tax revenue in 2011 stands at less than $1.3 million.

MSC/EMBARCADERO EAST
IBRC FINAL REPORT 66
6. The City has been renting 6,361 square feet of office space in the downtown area (the Development Center, at 225 Hamilton) at an approximate annual cost of $400,000 in the most recent complete year.
7. If the current Public Safety portion of City Hall becomes available for rental upon completion of a new Public Safety Building, City staff projects that rental may generate around $5.50 per square foot per month on up to 20,000 square feet.
8. Caltrans announced plans to open bids in November 2011 for a Highway 101 Auxiliary Lane (Project No. 04-4A3304). Construction of an auxiliary lane will entail removal of the landscape strip along the East Bayshore frontage road, replacing it with a new concrete barrier and mounted chain link fence. This freeway-widening work will remove foliage now partially screening the MSC site from passing motorists. A sensible response would be either to plan for improving the visual aspects of the MSC site or to consider the site for freeway-visible businesses.
Recommendations
4-1 Expand the scope of the MSC/ASC consultant study to include the possibility of establishing an auto dealer cluster or other economic development project on East Bayshore Road and to consider the best use of parcels the City may acquire on the Embarcadero East corridor.
4-2 Obtain current appraisals of the market value of the MSC site on East Bayshore Road and the auto dealer parcels on Embarcadero Road.
4-3 Update the City’s disaster response and resiliency and evaluate the risk of no or limited access to the MSC in the event of a disaster.
4-4 Update the Baylands Master Plan regarding the MSC site and the Embarcadero East corridor.
4-5 Perform economic impact analyses of the different scenarios for repair or replacement of the MSC.
4-6 Review the plan for delivering animal services to the City, the contractual obligations of the ASC to provide services to adjacent communities, and the possibility of a closer relationship with regional providers such as the Silicon Valley Animal Control Authority.
4-7 Study long-term alternatives for optimization of the Civic Center block.

MSC/EMBARCADERO EAST
IBRC FINAL REPORT 67
This report is intended to be useful to City Council and staff in determining what to request from an expanded consultant study. In simplest terms, IBRC believes the goals of this study should be to (1) consider all relevant issues, including both the static and dynamic options we have described, (2) identify the most cost-effective solutions, (3) mitigate any significant risks, and (4) confer the greatest benefit to the City and its residents in locating its municipal services, including the Public Works and Utilities operations.

IBRC FINAL REPORT 68
SECTION 5
Finance
The City Council asked IBRC to identify infrastructure funding needs and sources and to make recommendations for financing the identified needs. The need for infrastructure investment has been described in previous sections. Resources that are currently available for infrastructure funding are presented later in this section (table 5-1). The difference between recommended investment levels and currently budgeted funding levels results in funding “gaps.” The Commission has identified options for filling these gaps; these options and the Commission’s recommendations are presented in this section.
Potential revenue sources for funding are considered separately for three categories of infrastructure needs: catch-up, keep-up, and new & replacement.
In addition, we describe alternatives that assure required funding is available by dedicating specific annual revenue amounts to infrastructure and creating restricted infrastructure reserves.
Major Findings Related to Financing Palo Alto’s Infrastructure
The City’s current General Fund Operating Budget and Capital Improvement Program (CIP) funding levels are insufficient to fully fund the recommended infrastructure investments. There are no current funding sources for the major facility projects described in section 3 (new public safety facilities) and section 4 (the MSC/ASC), nor for the catch-up and other new & replacement projects described in section 2. In addition, there are annual funding gaps to adequately maintain existing infrastructure—the keep-up funding needs also described in section 2.
Given the current obligations and commitments of the General Fund, the City can provide sufficient funding for infrastructure only by some combination of added revenue sources, new borrowing, and/or offsetting expense reductions that may lead to cutbacks in general service levels.
The existing cost estimates for the public safety facilities (recently updated) and the municipal service facilities (outdated) total $179

FINANCE
IBRC FINAL REPORT 69
million. These numbers will be updated as the projects move closer to initiation, but we have used these cost estimates to illustrate the long-term borrowing options for funding these projects.
An additional $6.4 million is needed annually (in 2011 dollars) to eliminate the catch-up backlog, to fully fund keep-up maintenance, and to provide funding for the other new & replacement projects recommended by IBRC.
In November 2011, the City moved toward developing a new master plan for the former Cubberley High School site. In Appendix H, IBRC explains its thinking about the financial relationship with the Palo Alto Unified School District (PAUSD) as defined in the Lease and Covenant Not to Develop agreement entered into in 1989. We make the case that $6.1 million of the $7.1 million annual payments (in 2011 dollars) now going to the school district can reasonably be reappropriated to direct City uses when the agreement lapses on December 31, 2014. On that basis we have included, for the Council's consideration, the $6.1 million among the alternatives for filling the current infrastructure funding gaps. In addition, there will be reduced spending needs if the Cubberley-related catch-up and keep-up funding needs are eliminated.
The current financial climate provides a rare window of opportunity to construct major facilities. Public financing costs are at an historically low level, and construction costs are extremely competitive compared to previous eras. Additionally, the City is viewed favorably by the financial community and has the capacity to successfully issue bonds to raise the capital needed to finance major infrastructure projects.
Assumptions About Inflation, Interest Rates, and Construction Costs
There is always uncertainty about trends in inflation, interest rates, construction costs, and timing. This is a time of extraordinary uncertainty with record low interest rates, lower than normal construction costs, and an uncertain environment for economic growth and inflation. In developing forecasts of infrastructure funding gaps and developing financing options, the Commission made the assumptions described below. If projects are delayed or financing sources are selected that realize revenue well into the future, the cost of the recommended program could increase dramatically.

FINANCE
IBRC FINAL REPORT 70
Inflation
All of the cost estimates and revenue forecasts are stated in 2011 dollars. There are two caveats: (1) whether the cost estimates for major capital projects like the public safety facilities will be greater or less than the cost estimates previously developed, and (2) whether inflation will affect the cost and revenue components of the Commission’s funding alternatives equally, or whether cost and revenue inflation rates will be different and therefore alter the funding gaps identified by the Commission.
In recent years the growth rate of General Fund costs has increased faster than the growth rate of General Fund revenue sources as a result of (1) the impact of the recession on revenues, and (2) the rapid rise in costs associated with health and retirement benefits. The current Palo Alto Long Range Financial Forecast anticipates a continuing budget imbalance between the growth rates of costs versus revenues. The City staff and Council are taking steps to move toward a future where costs and revenues are in balance. For example, the recent agreement with the firefighters will reduce staff costs by $1.0 million in fiscal year 2012 and $1.6 million in 2013. An updated Long Range Financial Forecast will be available soon.
The Commission’s financing recommendations anticipate and assume that the growth rate in General Fund costs and revenues will be similar over the next 25 years; we did not attempt to incorporate assumptions of different inflation rates for costs and revenues into the financing plans. If costs continue to grow at rates in excess of revenues, that set of circumstances will present a significant challenge to providing public services and restoring infrastructure to acceptable levels. It will also mean that additional revenues in excess of the amounts recommended in this report will be needed to fund the recommended infrastructure expenditures.
The infrastructure management planning tool that IBRC recommends in section 1 includes a method for incorporating different inflation rates and the Long Range Financial Forecast into future revisions of infrastructure needs and financing. As staff and the City Council develop new Long Range Financial Forecasts and receive information on new construction costs, the IMS tool will allow decision makers and residents to see the implications of future inflation trends.
Interest Rates
In the Commission’s recommendations, the public safety and municipal services facilities will be funded by long-term borrowing. The interest rate used in our forecasts is the ten-year average for long-term borrowing. Current long-term interest rates are substantially below the ten-year

FINANCE
IBRC FINAL REPORT 71
average as shown in figure 5-1 below. If the City moves quickly on any of these recommended projects, the impact of borrowing costs on residents will be less than shown in our financing options.
Recent data presented to IBRC by staff indicate that the ten-year average interest rate on General Obligation 30-year bonds is 4.67 percent but that the current rate is 3.55 percent. For certificates of participation (COPs), the ten-year average rate is 5.52 percent but the current rate is 4.50 percent. For utility revenue bonds, the ten-year average rate is 4.75 percent and the current rate is 3.64 percent.
Construction Costs
For the catch-up and new & replacement projects, existing cost estimates were used. IBRC recognizes that updated cost estimates will be developed as the major projects move forward. As a result, the amount needed for funding these projects may be greater or less than the forecasts we have used.
Construction costs are now lower than they were during the last construction boom when many of the cost estimates were developed. A national construction cost index developed by Turner Construction shows a 15 percent decline in average costs from the peak in 2009. If the City can act quickly on the major construction projects, costs may well be lower than the existing estimates. A 2010 contract for City Hall infrastructure
Figure 5-‐1. Long-‐term interest rate trends.

FINANCE
IBRC FINAL REPORT 72
improvements was 53 percent below estimates; a 2011 contract for reroofing at City Hall was 19.5 percent below estimates; and another 2011 project, related to storm drains, was 30 percent below estimates.23
Summary of Infrastructure Funding Needs
Catch-‐up
Palo Alto currently has $41.5 million (in 2011 dollars) in catch-up infrastructure needs (described in section 2); these reflect repairs that would have been done already if funds had been available. There are no current revenue sources to fund these catch-up projects, so IBRC is proposing various funding alternatives for the entire $41.5 million and spreading those expenditures over a ten-year period at $4.2 million per year. The catch-up funding needs would be reduced by $7.0 million if the backlog of Cubberley-related projects were to be eliminated from the City’s responsibility.
Keep-‐up
The Commission identified two sets of keep-up infrastructure maintenance needs: one related to the maintenance done regularly within the Operating Budget, and one related to the larger ongoing maintenance and repair projects in the City’s Capital Improvement Program. The background for these needs forecasts is included in section 2 and in the master spreadsheet the Commission has posted on the City’s website.24
As shown in table 5-1, the City allocates $15.2 million per year from the Operating Budget for infrastructure maintenance. Staff estimates the need as approximately 10 percent higher, or $16.8 million per year, to provide the level of service commensurate with the community’s expectations.
A gap of $40.0 million for the next 25 years, or approximately $1.6 million per year, results from the shortfall of operating maintenance needs versus currently available resources. The gap assumes that all of the currently available operating maintenance resources continue to be available in the future.
23 Details can be found in City Manager’s Reports 320:10 and 103:11 and Staff Report ID#1869, August 1, 2011. 24 http://www.cityofpaloalto.org/civica/filebank/blobdload.asp?BlobID=29619

FINANCE
IBRC FINAL REPORT 73
Table 5-‐1 Keep-‐up Needs and Current Funding Sources FY 2012–2036 (millions of dollars)
25-‐Year Total Per Year Needs Sources Gap Needs Sources Gap
Operating Maintenance Budget $ 420.0 $ 380.0 $ (40.0) $ 16.8 $ 15.2 $ (1.6)
Capital Improvement Program 380.0 367.2 (13.8) 15.4 14.8 (0.6)
TOTAL $ 801.0 $ 747.2 $ (53.8) $ 32.2 $ 30.0 $ (2.2)
NOTES: All figures in 2011 dollars. Details may not match totals due to rounding. Operating maintenance sources are the FY 2012 Adopted Budget amount continued over 25 years. Operating maintenance needs were increased from current levels by 10 percent based on staff analysis to avoid future additions to catch-‐up. Planned CIP keep-‐up needs come from staff and working group analysis, with $1.5M per year added for unbudgeted items approved by the Council based on historical analysis. Planned CIP revenue sources are assumed to consist of $10.5 transfered from General Fund and $4.3 million in non-‐General Fund sources (FY 2012 Annual Budget amounts continued unchanged over 25 years).
Funding for the Capital Improvement Program falls short by $600,000 of the estimated annual need of $15.4 million. This includes an average of $1.5 million per year which a review of recent CIP budgets indicates is spent on projects not originally budgeted in the CIP but added later by City councils in response to proposals received after the budget year has begun. IBRC recommends that the Council anticipate these unbudgeted proposals and plan for sufficient revenues to fund the identified keep-up maintenance needs in the Capital Improvement Program. Thus, the total keep-up funding needs of $32.2 million include $1.5 million per year to account for unbudgeted Council-approved projects making a claim on CIP revenues that would otherwise be available for CIP keep-up needs.
Table 5-2 shows a breakdown of the CIP revenue sources.
Table 5-‐2 Current CIP Revenue Sources
Provided from General Fund $ 10.5 million Transfer from General Fund interest 1.0 million Gas tax 1.8 million Other fees and transfers 0.7 million Grants 0.8 million Current revenue sources TOTAL $ 14.8 million
The total of $2.2 million per year in needed additional keep-up funding is calculated by combining the gaps in the Operating Budget ($1.6 million) and CIP Budget ($0.6 million). This keep-up funding gap could be reduced by approximately $500,000 per year if the Cubberley-related keep-up expenses ($11.9 million over the next 25 years) were eliminated from the City’s responsibility.

FINANCE
IBRC FINAL REPORT 74
Major New & Replacement Projects
The Public Safety Building and Fire Stations 3 and 4 are grouped together as public safety facilities with a previous cost estimate of $79.2 million.
The Municipal Services Center and Animal Services Center are grouped together. Earlier and now outdated cost estimates totaled $99.9 million. The Commission is recommending a set of innovative approaches to these upgrades, with specifics and cost estimates to be fleshed out by a consultant team hired by the City. However, to illustrate the long-term borrowing costs for financing these facilities, the existing cost estimates are used.
None of these projects has a current funding source, and IBRC is recommending alternative strategies to finance them.
The Commission anticipates that a new municipal services complex can be designed to include revenue-producing land uses that would reduce the cost of replacing the existing facilities. The IMS will assess the incremental operating costs of new, replacement, and renovated space and include those costs in budget recommendations.
In the case of the Public Safety Building, if the existing space is vacated, there will be different annual maintenance costs for public safety as well as potential revenue from reuse of the existing facility. However, in this report, the Commission only includes strategies which finance the total capital costs for these facilities.
Other New & Replacement Projects
IBRC has identified $32 million in other new & replacement infrastructure investments as described in section 2. These projects currently have no funding source.
The Timing of Infrastructure Spending
To simplify the funding analyses, the Commission grouped the funding needs as follows:
Catch-up, Keep-up, and Other New & Replacement Projects. These are considered in this report as one group for financing purposes. Though smaller than the major facilities, these are long-term assets or annual needs; therefore, it is appropriate that they be funded by a tax or other annual source.

FINANCE
IBRC FINAL REPORT 75
The catch-up backlog will be funded and completed over a ten-year period at $4.2 million per year. This is based on conversations with staff about a reasonable schedule for completing all of these projects in addition to the other new & replacement projects.
The remaining other new & replacement projects ($3.3 million per year) will be scheduled in the ten years following 2021. However, to anticipate some additional projects that will undoubtedly appear, IBRC recommends planning for continued funding of $4.2 million per year.
Additional keep-up funding needs were identified as $2.2 million per year.
As a result, catch-up, keep-up, and the other new & replacement projects require additional annual funding of approximately $6.4 million ($1.6 million in the Operating Budget and $4.8 million in the CIP Budget) per year over at least the next 20 years (see table 5-3 and figure 5-2).
Table 5-‐3 Additional Annual Infrastructure Funding Required (in millions of dollars)
Catch-‐up, Keep-‐up, and Other New & Replacement Projects Keep-‐up $ 2.2 per year Catch-‐up and Other New & Replacement 4.2 per year
TOTAL $ 6.4 per year
Figure 5-‐2 Recommended 25-‐year funding for catch-‐up, keep up, and other new & replacement projects.

FINANCE
IBRC FINAL REPORT 76
Major New & Replacement Projects. The public safety and municipal services facilities were kept as separate funding needs in the analysis. These two major new & replacement complexes will also be funded and completed in the next ten years. Because of their size, it is appropriate that they be funded by long-term debt vehicles.
Action on the facilities in the major consultant study (MSC/ASC) will necessarily be ready for review later than the public safety facilities. In assessing the analysis below, we recommend that the reader consider the $79 million for public safety and the $100 million for the MSC/ASC as separate projects in respect to the timing of long-term debt.
A preliminary borrowing analysis concludes that each $50 million in borrowing costs financed by General Obligation bonds or utility revenue bonds requires between $3.0 and $3.3 million per year, depending on interest rates. So if the combined cost of the major projects is $179 million, then the annual cash repayment costs from borrowing would be $10.6–11.7 million per year. Looked at separately, the General Obligation bond cost for public safety facilities would be $4.7–5.2 million, and for the MSC/ASC, $5.9–6.5 million per year. Financing with certificates of participation (borrowing paid for out of General Fund sources) would be approximately 15 to 20 percent higher.
Table 5-‐4 Funding Required for Major New & Replacement Projects (in millions of dollars)
Estimated Cost Total Public Safety Facilities Public Safety Building Fire Station 3 Fire Station 4
$ 65.0 6.7 7.5
$ 79.2
Municipal Services and Animal Services Municipal Services Center Animal Services Center
93.0 6.9
99.9
TOTAL MAJOR PROJECTS $ 179.1

FINANCE
IBRC FINAL REPORT 77
Long-‐Term Funding Alternatives
IBRC reviewed a number of alternatives to fund the large and long-term projects (the public safety and MSC/ASC facilities). Three long-term funding alternatives are recommended for consideration:
General Obligation (GO) bonds certificates of participation (COPs) utility revenue bonds
The other alternatives reviewed (but not recommended) by IBRC are described in Appendix I.
General Obligation Bonds
The most common form of long-term capital project financing for cities and school districts is the use of General Obligation (GO) bonds. GO bonds require a two-thirds vote for approval. They are funded by a property tax on all city property owners. Generally, two-thirds is paid by residents, one-third by business. While GO bonds can be issued for different lengths of time, the most common are 30-year bonds.
In Palo Alto, GO bonds funded both the recent library and school infrastructure improvements. The library bond currently adds $15.50 per $100,000 in assessed value to each property owner’s tax bill, or about $125 per year for a home appraised at $800,000.
Certificates of Participation
Certificates of participation (COPs) are debt instruments issued by a jurisdiction and repaid by an identified revenue stream from within the issuing jurisdiction’s budget. No public vote is required.
These are the major differences between COPs and GO bonds:
COPs do not require a vote of the electorate, but the interest rate is higher, so annual debt service costs are approximately 15 to 20 percent greater.
COPs need an identified repayment source, unlike GO bonds which, if approved, provide their own added-taxes repayment source.
Utility Revenue Bonds
Palo Alto’s Utilities, being independent enterprises, issue bonds backed by their revenues. For the municipal services (MSC/ASC) project, a substantial portion of these facilities supports the operations of the Enterprise Funds. Depending on the final configuration and physical

FINANCE
IBRC FINAL REPORT 78
locations of the various MSC facilities, the financing of a majority of the capital cost can be provided by utility revenue bonds. As an order of magnitude calculation, if the Utilities Department portion of new MSC facilities costs $50 million, then utility rates would have to be raised between 1 and 2 percent to cover the additional annual debt service. About 70 percent of the cost would be borne by commercial customers.
This type of funding for the MSC envisions repurposing of the site and generation of rental income to fund the remainder of the development. Because the stream of rental income would not be available until construction is completed, the City would have to obtain bridge financing during the construction period.
Table 5-‐5 Homeowner Costs for General Obligation Bonds
Facility
Funds Borrowed
Cost per $800,000 in Assessed Value
Public Safety Facilities $ 79.0 million $184 per year
MSC and ASC $ 99.9 million $232 per year
NOTE: January 2011 average appraised value, Palo Alto single family home: $794,800. Santa Clara County Appraiser’s Office.
For purposes of illustrating long-term borrowing options, we estimate costs for GO bonds using the ten-year average for interest rates noted earlier. The borrowing costs are shown in table 5-5.
Annual Funding Alternatives
IBRC reviewed a number of alternatives for additional annual funding; we include three of these, summarized below, in one or more of the recommended infrastructure funding alternatives described later in this section. For background, see Appendix J, which presents a comparison of selected Palo Alto taxes with those in other jurisdictions and a summary of recent tax and bond elections. The Appendix J data comes from the California City Finance website under the topic Local Tax Votes.25
Sales Tax Increase
In the past three years, 50 cities in California have adopted sales tax increases ranging from 1/8 percent to 1 percent. Most of the sales tax increases were for general purposes, which require a majority (50 percent) vote. Some increases were for specific purposes, requiring a two-thirds
25 http://www.californiacityfinance.com/

FINANCE
IBRC FINAL REPORT 79
majority vote. In the November 2011 election, five more cities increased their sales tax rate by between 1/8 and 1 percent while four sales tax increases were defeated.
At present Palo Alto has an 8.25 percent sales tax rate, which is the minimum level required for cities in San Mateo and Santa Clara counties. San Mateo and Campbell have 8.50 percent sales tax rates, while the rate in all other cities in San Mateo and Santa Clara counties currently stands at 8.25 percent. The City of San Jose is considering asking voters to raise the sales tax in 2012.
A 3/8 percent sales tax rate increase would yield an additional $7.9 million in annual revenue; it would add 37.5 cents to each $100 in purchases.
Business License Tax (BLT)
An analysis by City staff prepared for the November 2009 election estimated that the proposed business license tax would raise $3.3 million per year.26
Most cities in San Mateo and Santa Clara counties have a business license tax while Palo Alto does not. In the November 2011 election, Redwood City was one of six cities to pass an increased or new business license tax. One vote failed.
A business license tax requires a majority (50 percent) vote.
Parcel Taxes
A parcel tax is a fixed amount, identical for all parcels regardless of use, size, or value. Cities are increasingly asking voters to approve parcel taxes for services as documented in Appendix J. In the November 2011 election, eight cities increased or adopted a new parcel tax, one city extended an existing tax, and four parcel tax votes failed.
A parcel tax requires a two-thirds vote.
A $200-per-year parcel tax would yield approximately $4 million in additional annual revenue with approximately two-thirds paid by single-family home owners.
Sales Tax Recommended Over Combination of Parcel Tax and BLT
If the City Council plans to use new tax revenues to meet the $6.4 million in annual infrastructure needs we identified, the Commission recommends the use of a 3/8 percent sales tax increase that would produce annual
26 http://www.cityofpaloalto.org/depts/asd/business_license_tax/default.asp

FINANCE
IBRC FINAL REPORT 80
Figure 5-‐3 Alternative ways to raise tax revenues to meet the identified annual needs for infrastructure.
revenue of approximately $7.9 million (in 2011 dollars). The Commission considers this preferable to the combination of a $200-per-year parcel tax (yielding $4 million, two-thirds paid by homeowners) and a business license tax of the same magnitude as the recently defeated proposal (or $3.3 million per year).
These are the reasons for the Commission’s choice:
A single new tax is preferred to two new taxes. The business license tax had strong opposition in the last election. A parcel tax requires a two-thirds vote, while a general sales tax
increase requires a majority (50 percent) vote. A parcel tax is usually imposed for a time period much shorter than the
20 to 30 years of infrastructure funding needed.
Nonetheless, in one of the recommended funding alternatives, we have shown how a two-tax combination could be used.
Cubberley Savings
In July 2011, the City Council asked IBRC to examine the infrastructure implications of the current Cubberley Lease and Covenant Not to Develop. The Lease is a special case because it combines a complex legal and financial agreement, involves a facility that affects 34 current occupants and serves many of the City’s residents, and was created to deal with conditions that no longer pertain. The financial implications are substantial and play an important role in the City’s capacity to achieve its budget priorities. The submission of our report coincides with the initiation of a City/school district process, making timely our comments on this relationship and a recommendation about it so that the new process can consider them.
On the basis of our review, the Commission has noted possible Cubberley-related savings that could result from the City/school district discussion.

FINANCE
IBRC FINAL REPORT 81
These potential savings are included in two of the recommended funding options to meet the City’s annual infrastructure needs. Our reasoning about the Cubberley relationship is summarized in the box and discussed at greater length in our working paper in Appendix H.
About Cubberley
The Commission’s review recognizes that the conditions that existed in 1989 when the PAUSD and the City entered into this historic and farsighted agreement have changed dramatically and are no longer operative. The PAUSD has stated its intention to reuse the Cubberley site for a secondary school within the next several years. Once this happens, the City will no longer be leasing the facility and will have no obligation to pay the rent, currently estimated at $4.6 million for fiscal year 2011–12.
In addition to the reuse of Cubberley, the school district has declared its intention to reuse unused sites and is expanding school capacity through its Measure A Strong Schools Bond, as recently demonstrated in its purchase of 525 San Antonio for $8.5 million. Based on these district actions, the Commission concluded that the Covenant Not to Develop school sites – intended to save public land and provide the district with school sites should the school-age population recover from the low levels of the 1980s (which it has) – is now outdated and the annual City payment of $1.8 million provides no commensurate public benefit.
Entered into more than 22 years ago, the agreement has accomplished its intended purpose. It is now time for the City and the school district to determine whether the two public entities should enter into a new, mutually beneficial arrangement or simply let the current agreement lapse.
The Commission notes the potential impact on the numerous tenants that currently use the Cubberley facility. The largest single tenant, the Foothill DeAnza Community College District, is very likely to vacate the facility within the remaining time frame of the lease, leaving unleased a significant portion of the facility owned by both the City and PAUSD. These changes are among the topics the newly established process will address.
In closing this brief summary, we note that the Commission’s Futures Working Group calls out three possibilities for the City’s 8-acre portion: to continue to use the buildings for community services, to sell this property, or to repurpose it for newly conceived and imaginatively designed community spaces.
See Appendix H for a full discussion of the Commission’s findings and conclusions on Cubberley.

FINANCE
IBRC FINAL REPORT 82
Other Annual Funding Sources The Commission reviewed a number of other major city taxes, including the utility users’ tax, the transient occupancy (hotel) tax, and the tax on property transactions. In each case, Palo Alto has an existing tax rate that is at or near the top level for all cities in the state and immediate vicinity (see Appendix J). As a result, these taxes were not considered further as annual infrastructure funding sources.
Funding Infrastructure Needs Within the Existing General Fund Financial Structure As shown earlier in table 5-3, infrastructure catch-up and keep-up needs and the other new & replacement projects require $6.4 million in additional annual funding, if existing funding remains at current levels.
The Commission considered that an evaluation of current General Fund spending was not within the scope of our core mission. From the information provided by City staff, we understand that there is currently a structural deficit within the City’s General Fund that the Council had been addressing prior to the formation of IBRC. The Commission supports the Council’s aggressive efforts to reduce future General Fund deficits through operating efficiencies and enhanced revenue recovery from user fees that better reflect the cost of service at every opportunity.
Funding Alternatives Recommended by the Commission
The Commission recommends four alternatives, any of which will fund the needed infrastructure investment:
Two alternatives (1-A and 1-B) are funded with new taxes and borrowing.
Two alternatives (2-A and 2-B) include Cubberley savings but have different approaches to funding the major project borrowing needs.
In addition, we identified another alternative which does not fully fund the recommended investments and which is, therefore, not recommended to the City Council for consideration.

FINANCE
IBRC FINAL REPORT 83
Alternative 1-‐A Public safety facilities funded by a GO bond (requiring a two-thirds
vote). MSC complex funded by a utility revenue bond and an additional
source, such as rental income from potential private commercial users. Catch-up, keep-up, and other new & replacement funded by a
3/8 percent sales tax increase (requiring a majority vote).
Alternative 1-‐B Public safety facilities funded by COPs paid with funds from a parcel
tax (requiring a two-thirds vote) plus a business license tax (requiring a majority vote).
MSC complex funded by a utility revenue bond and an additional source (such as rental income).
Catch-up, keep-up, and other new & replacement funded by a 3/8 percent sales tax increase.
Alternative 2-‐A Public safety facilities funded by a GO bond. MSC complex funded by a utility revenue bond and an additional
source (such as rental income). Catch-up, keep-up, and other new & replacement funded by Cubberley
expense savings.
Alternative 2-‐B Public safety complex funded by COPs paid with Cubberley expense
savings or by a 3/8 percent sales tax. MSC complex funded by a utility revenue bond and an additional
source (such as rental income). Catch-up, keep-up, and other new & replacement funded by a
3/8 percent sales tax or with Cubberley expense savings.
Alternative 3 – Not Recommended No new taxes or borrowing. The recommended infrastructure investments require $179 million in
long-term borrowing and $6.4 million in additional annual funding. Cubberley savings could provide $6.1 million per year.
Table 5-6 summarizes the four recommended alternatives.

FINANCE
IBRC FINAL REPORT 84
Table 5-‐6 Recommended Options for Funding Sources
Alternative 1-A Alternative 1-B Alternative 2-A Alternative 2-B
Public safety facilities GO Bond COP paid by parcel tax & BLT
GO Bond COP paid by Cubberley savings or 3/8 cent sales tax
Municipal service facilities
Utility bond + Utility bond + Utility bond + Utility bond +
Keep-up, catch-up, and other new & replacement
3/8 cent sales tax 3/8 cent sales tax Cubberley savings
3/8 cent sales tax or Cubberley savings
Pros and Cons of Each Alternative
The Commission has chosen not to make a single recommendation to the City Council for financing the infrastructure needs identified in this report. Instead, this report proposes four alternatives, all of which will fully fund the infrastructure needs, along with a discussion of the advantages and disadvantages of each alternative. These are our principal reasons for not making a single recommendation: Decisions about renegotiating or terminating the Cubberley lease are
the subject of an ongoing discussion with the City and school district.
Decisions about assessing the appropriate timing of bond and tax elections should rest with the City Council, and these decisions will affect the financing alternatives and their timing.
In addition, no single alternative was supported over all others by a majority of the Commission.
In each alternative recommended by IBRC, long-term facility needs are funded with long-term borrowing, while annual needs and the other new & replacement projects are funded by additional annual appropriations from revenues. Also in each alternative, the municipal services facilities are funded by a utility revenue bond plus an additional bridge funding source. It should not be difficult for the City to provide that bridge funding. As discussed in section 4, IBRC found that reconfiguration and upgrading of the current MSC/ASC would create revenue-generating opportunities.
Public Safety Facilities: GO Bonds versus COPs
For long-term borrowing, a General Obligation bond is a lower-cost approach than certificates of participation. The ten-year average interest rate for GO bonds is 4.67 percent while the ten-year average rate for COPs is nearly 1 percent higher at 5.52 percent.

FINANCE
IBRC FINAL REPORT 85
A GO bond needs a two-thirds voter majority for approval. The vote requirement can be considered an advantage of GO bonds because they would then be funded with the explicit approval of voters. This characteristic of GO bonds could also be considered a disadvantage if a particular project is considered vital but the City Council feels voters would not provide a two-thirds majority.
A GO bond would provide for the most expedient construction time frame for public safety facilities because an election could be held in November 2012. COPs would require an additional revenue source. Assuming sales tax revenues would be dedicated to ongoing infrastructure first, the needed revenue stream to issue COPs would not be available until 2015 and might significantly increase the cost of the public safety replacement projects, if the Council selected a scenario that uses Cubberley savings.
Commission members have a variety of personal views about the current mood of voters for new taxes, but we realize that the City Council would conduct polling before deciding on future tax or bond elections and that the economic climate could be different when such votes are scheduled.
As a result, the Commission included alternatives for funding the public safety facilities with either GO Bonds or COPs.
Alternatives 1-‐A and 1-‐B Compared to Alternatives 2-‐A and 2-‐B The advantage of Alternatives 1-A and 1-B is that they fully fund the identified infrastructure needs even if Cubberley savings are not available.
In both Alternatives 1-A and 1-B, new tax or bond funding sources and associated elections are needed. For Alternative 1-A, a GO bond and sales tax increase are required. If a GO bond is not considered viable, then for Alternative 1-B, three new sets of taxes are required.
The disadvantage of Alternatives 1-A and 1-B compared to Alternatives 2-A and 2-B is that they require two or three new tax sources and elections, which could delay or negate the Commission’s recommended infrastructure program.
Alternative 3
The Commission rejects Alternative 3 for these reasons:
The mandate of the Commission was to identify funding needs and sources.
The Commission was not charged with evaluating General Fund spending for identifying non-tax or bond funding options, such as reducing current services or employee compensation.

FINANCE
IBRC FINAL REPORT 86
The Commission considers that a proposal for no new taxes will result in the identified infrastructure needs not being addressed at all, or not being addressed in a timely manner, which is contrary to the Commission’s findings that such infrastructure expenditures are in the best interests of residents.
Timing Issues
IBRC recognizes that the revenues required to fund the City’s infrastructure needs are not all currently available. The earliest that a tax or GO bond election could be held is November 2012, and the funds would not be available until sometime after the election. The Cubberley lease is not set to expire until 2014, so any savings likely would not start until 2015.
Thus, regardless of the funding alternative the Council ultimately adopts, there will be a short-term deficit in funding if the Council wants to proceed with the recommended infrastructure program in 2012–13. To delay the program for even a year is likely to require further annual revenue dedication beyond the additional $6.4 million indicated in this report. The City should at least dedicate the additional funds needed for capital keep-up and catch-up ($4.8 million) for the 2012–13 budget year. This could be achieved through a loan or grant from the Stanford Development Agreement funds, the main purpose of which is City infrastructure (it is recommended later in this section that these Stanford payments be put into a Strategic Construction Reserve). Once a firm new revenue source is established, the Strategic Construction Reserve can reimburse the Stanford Development Agreement funds as actual revenues allow.
Making Sure the Money Is Available for Annual Infrastructure Funding Needs
To avoid future deferred maintenance of the City’s infrastructure once facilities are improved to satisfactory standards, the City needs to adopt certain policies. Similarly, the City needs a procedure to insure that the funds identified as needed for the catch-up and other new & replacement projects are available in future CIP budgets.
With our recommendations for an Infrastructure Management System as described in section 1, the Commission has laid out a plan for the City to use the IMS to update infrastructure needs and funding sources and to

FINANCE
IBRC FINAL REPORT 87
develop annual General Fund and CIP budgets to fully fund infrastructure for Palo Alto. Thus the Council will be fully aware of the required need.
An additional safeguard is to have a dedicated source of funding equal to the average projected needs. As indicated previously in this report, to adequately finance infrastructure catch-up, keep-up, and the historical average of unanticipated needs will require at least an additional $6.4 million dollars a year (in 2011 dollars) over the time span designated for the Commission’s review.
Table 5-7 shows that a total of $16.8 million is needed for dedication to operating maintenance. This includes the $15.2 million in existing funding plus the $1.6 million in additional funding that the Commission recommends.
In addition, a total of $19.5 million is needed each year for dedication to infrastructure CIPs (including the approximately $3.2 million in gas tax and other revenues already dedicated to infrastructure CIP projects). The $19.5 million includes $14.7 million in existing funding plus the $4.8 million in additional annual funding the Commission recommends.
Together, these annual funding needs total approximately 23 percent of the General Fund budget.
Table 5-‐7 Dedicated Annual Funding Needed for Infrastructure Maintenance
Dollar Amount
(millions) Percent of
General Fund Revenue (Current) (Recommended)
OPERATING MAINTENANCE (Keep-up) 2011–12 Operating Maintenance Budget $ 15.2 10.5% 10.5% Additional needs 1.6 1.1
Total Operating Maintenance need 16.8 10.5% 11.6% CIP MAINTENANCE (Catch-up & Keep-up)
2011–12 CIP Maintenance Budget 10.5 7.2% 7.2% General Fund interest transfer 1.0 0.7 0.7 Gas tax/grants/other already dedicated 3.2 2.3 2.3 Additional needs 4.8 3.3
Total CIP Maintenance need 19.5 10.2% 13.5% TOTAL Catch-up and Keep-up 36.3
Less gas tax/grants/other already dedicated – 3.2 – 2.3 – 2.3 TOTAL dedication needed $ 33.1 18.4% 22.8%

FINANCE
IBRC FINAL REPORT 88
Recommendations for Dedicated Funding
There are two alternative approaches to dedicated infrastructure funding: (1) allocate a fixed percentage of General Fund revenues each year to infrastructure, or (2) identify a specific revenue source or sources for dedication to infrastructure maintenance and rehabilitation. The Commission considered both of these alternatives using the annual Utilities Equity Transfer as a possible specific revenue source.
The Commission recommends that the City adopt the fixed percentage approach. Specifically, we recommend that Council dedicate approximately 23 percent of General Fund revenue, divided approximately equally between the Operating Budget and the CIP Budget (see table 5-7), to fund infrastructure each year. Table 5-7 shows that currently 18.4 percent of the General Fund budget (or $26.7 million, using $145 million as the current budget total) is devoted to infrastructure. The IBRC-identified need, however, is for 22.8 percent.
In order to insure that this funding dedication is preserved into the future, the Commission recommends that the City adopt a formal policy embodying the following:
1. That the City Manager dedicate 23 percent of General Fund revenue to maintaining and improving the City’s infrastructure, the amount to be divided between the Operating Budget and the CIP.
2. That a supermajority of six Council Member votes be required in order to reduce any year’s infrastructure funding below 23 percent.
3. That any reductions below 23 percent shall be restored over the succeeding three years.
Infrastructure Reserves
Since 2004, the current Infrastructure Reserve has been depleted from a peak of $36 million in 2004 to less than $4 million today. At the same time, the catch-up backlog is currently more than $40 million. Although a very laudable attempt to address the infrastructure at the time, the reserve has clearly fallen short.
The Commission’s review of the purposes and uses of this reserve indicated that there are two substantially different uses of the funds, and

FINANCE
IBRC FINAL REPORT 89
that the reserves could be better managed if two reserve funds were established rather than one, as follows:
Operating Maintenance Reserve
An Operating Maintenance Reserve would operate similarly to the Enterprise Funds reserve accounts. This reserve would be the repository for each year’s dedicated revenue allocation. It would fund both operating and CIP expenditures. Any funds not used in the current year would remain in the reserve for use the following year, in effect balancing variations in costs from year to year. This would insure that the dedicated revenue is always used to fund infrastructure costs, if not in the current year, then in future years. Such a reserve should start off with a positive balance; transferring the remaining balance in the current Infrastructure Reserve would be a practical way to launch this reserve.
The reserve should be subject to Council-approved minimum and maximum parameters, just as with the Enterprise Fund reserve accounts. We recommend a minimum of 10 percent of expected average five-year expenditures and a maximum of 20 percent.
Because planned infrastructure keep-up and catch-up costs for the first five-year period (exclusive of the new library projects) are estimated to total $182 million, or an average of $36 million per year, we recommend initially that the fund be built to a level of between $3.5 and $7.0 million (the 10–20 percent minimum/maximum).
If in the future the balance fell below the minimum, then the Council would budget an additional transfer sufficient to meet minimum requirements. If the balance in this reserve exceeds the maximum at the end of a fiscal year, the surplus could then be reallocated to the General Fund, if the Council so chose.
Strategic Construction Reserve
The Commission recommends a Strategic Construction Reserve for the following purposes:
Funding for new projects or projects too large for inclusion in the operating budget but too small for issuing bonds.
Funding the replacement of “minor” facilities or seed money for a major replacement – feasibility and design phases – where the project itself would likely be financed by issuing bonds.
As a source of leveraging funds on projects that appear desirable but cannot be funded fully on their own or that serve only a small segment of the community.

FINANCE
IBRC FINAL REPORT 90
A unique opportunity (such as land acquisition) that would require immediate action.
Participation in public/private partnerships.
The Strategic Construction Reserve would be funded as follows:
Any asset sale. The proceeds should go to this reserve unless the sale had been previously identified to help pay for a specific project.
That portion of the Stanford Development Agreement funds earmarked for infrastructure.
Replenished as legally allowed after the sale of bonds for the project the funds helped establish.
One-time “windfalls” if the Council deems it appropriate. Interest earnings on the reserve itself.
Had the Strategic Construction Reserve been in effect in previous years, for example, it could have been used for these needs:
Initial design work for the new libraries and community center, prior to GO bond financing.
Purchase of the Los Altos Treatment Plant site. Funding the MSC Study in the current year’s CIP.
With the exception of unique opportunities where timing may be of the essence, appropriations from the Strategic Construction Reserve should go through the normal CIP budget cycle and be subjected to life-cycle costing prior to project approval. In the Commission’s review of cities that are described as models for infrastructure planning, subjecting projects to this type of scrutiny emerged as a common theme.
Stanford Development Agreement Funds
IBRC believes that at least a portion of the Stanford Development Agreement payments should be used for long-term, legacy projects that will be transformative and have a visible impact on Palo Alto’s future. We have identified potential uses that meet these objectives, directly support key recommendations emanating from this report, and, in themselves, provide leverage to develop new General Fund revenue.
We recommend that all payments received from Stanford for infrastructure be held in the Strategic Construction Reserve, earmarked for one or more of the following uses:

FINANCE
IBRC FINAL REPORT 91
Repurposing of the Public Safety Building. The present Public Safety facilities in City Hall are sited on some of the most valuable commercial real estate in the world. After the new Public Safety Building is completed and the current police and other public safety functions are moved, the current space can be redeveloped into a valuable downtown office building and a substantial new revenue stream for the City.
Repurposing of the MSC site. The MSC site has high commercial value and can be repurposed to create a new revenue stream for the City. To accomplish this, existing City operations at the MSC must be relocated. While the Utilities Department has the financial capacity to fund its own relocation, the relocation of other operations such as Animal Services, Community Services, fleet maintenance, and warehousing must be paid from non-utility fund sources.
Repurposing of the Cubberley site. The future use of this site depends on planning currently underway jointly by the City and the school district. One possible outcome is that the City retains ownership of the land and buildings that it currently owns. If that occurs, the site will need to be redeveloped for whatever future purpose(s) the City chooses.
State-of-the-art fixtures and equipment. Because of the restrictions on the use of GO bonds, funds from other sources are often required to fully outfit and equip new facilities. This was the case with the libraries. The reserve could be a source of funds for future projects that would be financed by GO bonds and subject to such restrictions. For example, should the Council decide to finance the new Public Safety Building and fire stations with GO bonds, then this reserve could be used to purchase leading-edge, state-of-the-art equipment and technology to best serve the public in the 21st century.
Leadership in Energy and Environmental Design’s (LEED) Platinum Energy Efficiency Standards. Sustainability is one of the key criteria established for the use of the Stanford Development Agreement funds. These payments could be used to fund the incremental difference between LEED Platinum Efficiency Standards and current City of Palo Alto energy efficiency standards for a new City buildings and major replacements. Public Works estimates that this would add 1 or 2 percent to the cost of major projects.

FINANCE
IBRC FINAL REPORT 92
In Conclusion
Continuous underfunding of the City’s infrastructure has led to the situation Palo Alto faces today. To bring the City’s current portfolio of assets up to standard and avoid this problem in the future, an additional $6.4 million annually is required. The City will also need an additional $179 million dollars for the replacement of critical municipal structures.
In this section we have proposed a number of ongoing revenue sources to finance the proper maintenance of the existing infrastructure, along with a recommended dedicated revenue stream and infrastructure reserves to assure its success. We have also outlined the means to finance the critical replacement projects through the appropriate use of several forms of bond financing – General Obligation bonds, utility revenue bonds, certificates of participation – and a Strategic Construction Reserve to provide seed money to finance additional new major replacements that are likely to come into play over the next 25 years.
In summary, the recommendations for financing are as follows:
5-1 Consider four recommended alternatives for funding one-time investments and ongoing infrastructure needs. These alternatives do not include reallocations within current City budgets except for the possibility of funds that now pay for the Cubberley lease.
5-2 Direct the City Manager to dedicate 23 percent of General Fund revenue annually to infrastructure. Require a supermajority of six council member votes in order to reduce any year’s infrastructure funding below 23 percent. Require that any reductions below 23 percent shall be restored over the succeeding three years.
5-3 Establish an Operating Maintenance Reserve to manage infrastructure budgeting and smooth year-to-year fluctuations, and a Strategic Construction Reserve to deal with unanticipated infrastructure needs and opportunities.
5-4 Decline to renew the Cubberley Lease and Covenant Not to Develop. This will free $6.1 million annually and avoid a substantial portion of the capital upkeep expenditures of $18.9 million and annual maintenance expenditures of $800,000.
It is imperative that a financing program be put into place as expeditiously as possible to eliminate catch-up, prevent its return, and effectively address future needs.

IBRC FINAL REPORT 93
SECTION 6
The Future
The primary mission of IBRC was to review infrastructure needs that have been currently identified, to recommend which investments should be funded, and to identify financing sources for these investments. As to the future, the Commission recognized that there will be additional infrastructure needs as Palo Alto grows and changes. The Commission established a Futures Working Group (FWG) to identify additional trends and possibilities for infrastructure planning and investments that may arise over the next 25 years. This section and its accompanying appendices identify trends such as the growth and changing demographics of Palo Alto’s population and provide examples of upcoming technology advances that will impact future infrastructure planning.
As a working group, we considered what the City could do over the next 25 years to best assure that Palo Alto remains a desirable place to live, work, and visit. One key to sustaining and enhancing the municipal environment and services is giving continual attention to the needs of our community through a forward-looking process. The Comprehensive Plan (Comp Plan) provides a vision for Palo Alto and a framework under which future projects may be evaluated. This vision should guide decisions relating to future infrastructure. The 2007 revision of the Comp Plan “integrates the aspirations of the City’s residents, businesses, neighborhoods, and officials into a bold strategy for managing change.”26 In this context, our recommendations for future infrastructure encourage bold forward thinking toward an infrastructure for the City that preserves our heritage while continuing to serve its constituents well.
Renewing our infrastructure presents both a long overdue challenge and a timely opportunity. Appendix K contains a list of City structures and their construction dates. Many are old: the average age of the 84 structures with known construction dates is 50 years.
26 “Embracing the New Century: Palo Alto 1998–2010 Comprehensive Plan,” revised July 2007, p. I-1.

THE FUTURE
IBRC FINAL REPORT 94
While predicting the future is difficult, our chances for long-term sustainability can be improved by the following:
Vision – requiring that the City report on the future beyond the horizon of our current Comp Plan.
Engagement – engaging with other forward-thinking municipalities. Involvement – inviting private citizens and business entities alike into
the thought process.
The FWG recommends joint action with the City Planning Department and discussions with citizen groups and other progressive cities as methods of extending the view many years ahead. We intend that this section of the report be complementary and respectful of the Comp Plan that currently looks to the future of our City. Furthermore, we do not intend to limit or restrict ideas for the future. By introducing new processes within the planning cycle to encourage creative thinking, new and exciting ideas will emerge.
We have looked at other cities for lessons to be learned or “better practices” that may be emulated. Many progressive municipalities focus attention well into the future, and there may be valuable ideas in interacting and collaborating with a select group of cities.
A recent joint IBRC study session with the Planning and Transportation Commission (PTC) posed the question whether the PTC might be a home for 25-year forward thinking and for continuing the preliminary work about long-term future infrastructure. Although the PTC’s answer was not definitive, it is clear that their plate is already full and to accept such an expanded charter may not be feasible. Hence, in section 1 of this report, IBRC makes the recommendation to establish a permanent public commission for infrastructure oversight. We deliberated on whether the City would best be served by a new commission or by simply extending the charter and priorities of an existing commission. There was agreement that in order to address the current issues and avoid a recurrence of infrastructure issues and concerns, a separate commission was called for.
The FWG strongly suggests that this new commission be separate from existing committees and commissions in order to increase the visibility of the infrastructure agenda to the City Council. Although the FWG generated many interesting ideas for future City infrastructure, we feel the proposed infrastructure commission will evaluate and recommend projects for the coming years. Whereas the current City Council has taken a proactive approach to existing infrastructure problems, a new commission with

THE FUTURE
IBRC FINAL REPORT 95
access to future City Councils will ensure that this focus is not lost as Council Members change.
This new commission should work with City staff to help in the selection and implementation of the new Infrastructure Management System, help introduce any requisite changes to the collection of infrastructure and project data, as well as focus on future-oriented thinking about City infrastructure and help manage any advisory groups or other future initiatives that may arise. The proposed infrastructure commission may decide to meet jointly with the Planning and Transportation Commission to avoid overlap. The Planning Department, in developing its Comp Plan, would thereby have two agencies of influence for that plan.
In this section we propose ideas that will result in further exploration and development of infrastructure projects. Additionally, we make recommendations on policies and processes by which the City can expand on what IBRC has begun.
Future Challenges and Opportunities
Looking to the future, the FWG believes the City’s growth, demographic changes, and continual advances in technology will present challenges and opportunities related to infrastructure. These include, for example:
Replacing some of the aging buildings that contribute to costly maintenance each year.
Leveraging new technologies for services requiring infrastructure. Offering improved and innovative services to fulfill the City’s vision. Optimizing land and structures for the best delivery of key City services
(asset management).
Whereas in the past Palo Alto has been a leader with its City-owned utilities, green utility incentives and programs, telecommunications services, recycling, and other innovative municipal services, we now witness the City lagging: neighboring cities have taken advantage of redevelopment agencies to rebuild their infrastructure, attract major businesses, and manage their infrastructure without falling behind in building upkeep and maintenance. In contrast to Palo Alto, the City of Mountain View funds all its keep-up projects annually. Additionally, it has a form of infrastructure reserve that is protected from non-infrastructure uses. Santa Clara, San Jose, Sunnyvale, and to a large extent Redwood City have rebuilt their downtown centers and City Halls within the last decade. Mountain View offers a Performing Arts Center and Shoreline

THE FUTURE
IBRC FINAL REPORT 96
Amphitheater for cultural, music, and dance events. Stanford is constructing the Bing Center and offers its on-campus residents high-speed Internet access by virtue of a relationship with Google.
Where is Palo Alto in relation to its neighbors? Mountain View and other cities created redevelopment districts that substantially enabled the financing of city rebuilding projects. Palo Alto has chosen not to utilize such redistricting. Consequently, the City does not benefit from the fiscal advantages of redevelopment zones and therefore needs to find other sources of financing to fund its projects. The new commission will need to address the financing issues as part of its charter.
Goals and Objectives of the Futures Working Group
An objective of the Futures Working Group has been to stimulate the thought process and discussion that will deliver the right set of buildings, facilities, and asset use to keep Palo Alto a thriving and progressive environment for its private citizens and business residents. We have begun what we hope will become an ongoing thought-to-action process that leverages the community, our business partners, and our City government to keep Palo Alto at the forefront of attractive communities.
We have focused on infrastructure needs relating to the following: demographic changes technology changes best practices of municipal governments optimization of City assets based on cost and benefit to the City (asset
management) We believe that the City’s capital planning cycle, especially as it relates to infrastructure, should be strengthened. This includes periodic reviews to determine if the City should retain, repurpose, or dispose of certain assets, as well as consider if new assets are required. Some form of prioritization or cost-benefit analysis may be applicable: the FWG recognizes that our aging assets tend to suffer high operating maintenance costs, and that some assets may have higher usage or confer more desirable benefits than others. There are opportunities for cost avoidance by repurposing or selling costly assets. The catch-up and keep-up costs of modern buildings are significantly less than those of the legacy structures. The selection of an Infrastructure Management System, discussed in section 1 of this report, should include asset management tools to aid in this process.

THE FUTURE
IBRC FINAL REPORT 97
We believe that the City would be well served by a more business-friendly environment, including incentives for locating business activities and headquarters within the City. We recommend a number of initiatives for consideration by the City for creating such an environment. A conference center, start-up incubator, and “smart cities” conference are examples of such incentives.
Revenue for future infrastructure projects might come from new sources such as sale of City assets, new services such as wireless provision, rental of City property at market rates; or public-private partnerships, especially with regard to technology-related projects.
Demographics
Planning Department data are shown in tables 6-1 to 6-3.27 They project that the number of households will increase over the next ten years with these trends (also shown in figure 6-1): Significant increases in the number of school-age children. Reduced percentage of productivity-aged residents (18 to 64 years). Increasing household size from 2.43 persons per household in 2010 to
2.53 persons per household in 2020. Ten percent increase in the 65 and older age group.
A member of the FWG met with Bob Golton, Facilities and Bond Program Manager for the Palo Alto Unified School District (PAUSD). The district uses data from Lapkoff & Gobalet Demographic Research to conclude the need for increasing school capacity in Palo Alto.28 Mr. Golton predicts the need for a fourth middle school and third high school in Palo Alto sometime in the future, and indicated the Cubberley property to be one likely choice for the new schools. Mr. Golton has stated that these are his predictions and opinions, and do not reflect in any way the official position of the PAUSD. Further study and discussions between the City and the school district are underway.
The Association of Bay Area Governments (ABAG) would like to see an even higher population for Palo Alto. Their goal is for Palo Alto to accommodate 3,210 additional households,29 which at 2.53 persons per unit would increase the population to 72,524 residents by 2020. As there are
27 Curtis Williams, Palo Alto Planning Director, (Age_HHSize_2020Estimates.pdf) and Growth Projections and Census Data (IBRC_ Futures_Planning_08.12.11.pdf). 28 Lapkoff & Gobalet Demographic Research, Inc. District-wide Enrollment Forecasts, Palo Alto Unified School District, December 8, 2010. 29 ABAG Projections 2009, cited in City of Palo Alto CMR:240:10, May 12, 2010.

THE FUTURE
IBRC FINAL REPORT 98
significant differences between the ABAG targets and the City’s projections, the City needs to determine what level of additional housing it is able to absorb in the future. Implicit in this assessment are zoning regulations and requirements that may be affected by population growth.
Table 6-‐1 City Population by Age Group 1970–2020 (projected)
1970 1980 1990 2000 2010 2020 Under 5 years 3,205 2,192 2,764 2,970 3,506 3,954 5 to 17 years* 14,310 10,262 6,999 9,436 11,573 14,135 18 to 64 years* 32,662 35,393 37,390 37,052 38,318 39,550 65 years and over 5,789 7,378 8,747 9,140 11,006 12,376
Total 55,966 55,225 55,900 58,598 64,403 70,015 Incr (decr) over prior 10-year period – 1.3% 1.2% 4.8% 9.9% 8.7%
Figure 6-‐1. City population by age group, 1970–2020 (projected).
Table 6-‐2 Palo Alto Population, Percentage by Age Group 1970–2020 (projected)
1970 1980 1990 2000 2010 2020 Under 5 years 5.7 4.0 4.9 5.1 5.4 5.6 5 to 17 years* 25.6 18.6 12.5 16.1 18.0 20.2 18 to 64 years* 58.4 64.1 66.9 63.2 59.5 56.5 65 years and over 10.3 13.4 15.6 15.6 17.1 17.7
Total 100.0 100.0 100.0 100.0 100.0 100.0
Note: Percentages may not total 100 due to rounding.

THE FUTURE
IBRC FINAL REPORT 99
Table 6-‐3 Growth by Age Group, 2010–2020 (projected) Percent Change
2010/2020 Under 5 years 10.6 % 5 to 17 years* 19.8 18 to 64 years* 1.2 65 years and over 10.3 Total all ages 8.7 %
Whereas the school-age population is projected to grow at 20 percent, the productivity-age cohort barely increases over the same 10-year period. The sharp increase in the under-5 category suggests an increasing need for school-age services beyond 2020. As noted previously, there is public discussion of PAUSD’s use of the Cubberley site for in anticipation of a student population that will exceed the current capacity of the City’s middle and high schools. Should this occur, the questions then become: what would become of the current tenants of the Cubberley facilities, and what should the City do with the 8 acres it owns?
The FWG notes three options for the City-owned portion of Cubberley:
Status quo – make no change to existing structures or current use of those structures.
Sell our property – the PAUSD has right of first refusal if this is offered for sale.
Repurpose – replace the current buildings on the site with either new buildings or designate some other use (e.g., athletic fields). New buildings could serve the community in much the same way that Cubberley buildings currently do, by providing space for non-City activities and businesses that may be displaced when the PAUSD acts on its plans to create a new campus.
Potential effects of demographic change need to be further explored by investigating questions such as these:
What are the consequences for land use, given an expanding population in a city that has fixed boundaries?
Should current building height restrictions be selectively relieved to accommodate growth?
Should mixed use be encouraged, such as occurs on California Avenue with retail, residential, and business tenants in a single building?
THE FUTURE
IBRC FINAL REPORT 100
The Planning Department and the proposed infrastructure commission should be tasked with further analysis of demographic data and implications for Palo Alto infrastructure.
Municipal “Best Practices”
Many cities have addressed social, environmental, and technology infrastructure needs in preparing for the future. In the interest of learning from such cities, we have selected a handful that have progressive and forward-looking plans and programs (see Appendix L). The FWG does not recommend adopting any specific programs from the cities featured in Appendix L. However, we do believe that it is important for Palo Alto to exchange ideas and learn from the experiences of other progressive cities. We further believe that there are lessons to be gleaned from think tanks and universities. Such organizations should be considered for the exchange of ideas regarding the future of Palo Alto.
Palo Alto could take the lead in hosting a “smart cities” conference, assembling City Managers, Council Members, and City staff from different municipalities, as well as experts and interested members of the public, for an exchange of ideas on planning infrastructure for the future.
Technology Infrastructure
The City should actively consider infrastructure that leverages emerging trends and technologies. Several current technologies, if deployed in a sensible manner, could bring value to the City, both in terms of services to its constituents and revenue. These include the following (further explored in Appendix M):
Wireless infrastructure Smart Grid Alternative energies Technologies for aging demographics Advanced healthcare
Where appropriate, investigations should be coordinated with the City’s Utilities Department. We are aware of ongoing investigations of some of these technologies for Palo Alto. The new infrastructure commission should supplement these activities by forming advisory boards that include Palo Alto residents with interests and background in technology, environment, infrastructure, sustainability, and the arts and recreation.

THE FUTURE
IBRC FINAL REPORT 101
Leasing of Assets
The City owns assets for providing services to residents (e.g., the Art Center) as well as buildings that are leased to organizations such as preschools or nonprofits. We recognize that the City favors many non-City service providers with below-market lease arrangements. In light of the high value of local real estate, the City could in the future offset its infrastructure costs and generate revenue by charging market rates to tenants who do not require subsidies. The PAUSD, with its intended purchase of the former childcare facilities on San Antonio Road, is also considering renting, at market rates, available space at that site.
Possible Future Projects
The Futures Working Group has discussed possible projects to enhance Palo Alto’s future. These projects have not been endorsed by IBRC but provide a basis for discussion:
Community Services Center Extension of the Embarcadero East concept discussed in section 4 Palo Alto conference center Start-up incubator Palo Alto wireless network
These five projects are discussed in Appendix N.
If the City decides to develop the Embarcadero East corridor, as discussed in section 4 of this report, exciting opportunities arise. By considering alternative uses for the golf course and redevelopment of that area with hotels, restaurants, and a convention center, this locale, ideally positioned near Baylands recreational resources, could become another attractive region of the City.
An Embarcadero East center could house City services currently using rented office space. Migration of City staff to the new location could allow the current City Hall to be converted to a municipal/commercial center, an ideal arrangement given its close proximity to the city center and transportation services. If police services are moved out of their current site, as discussed in section 3, then the redevelopment of the entire Civic Center plaza becomes a possibility.

THE FUTURE
IBRC FINAL REPORT 102
Timeline and Project Costing
A 25-year view of the City correlates with internal City processes according to the timeline shown in figure 6-2. The current fiscal year, with the approval of the annual budget, commits funds to projects. For each annual budgeting cycle, a five-year view of future spending on Capital Improvement Projects (CIPs) is performed and presented. As indicated in this timeline, there does not appear to be any City staff responsibility for plans beyond Year 10.
Palo Alto’s Comp Plan is typically a 10- to 12-year view. The Comp Plan process, unlike environmental impact assessments, requires no analysis of financial impacts. We believe for future updates, economic analysis should be an integral Comp Plan component.
The City Council has expressed an interest in extending the planning horizon, and the FWG recommends the extended view as well. We believe there should be a “home” within City staff to study, report on, and recommend actions based on long-term trends in population, technology, and government. The logical home for this function is the City’s Planning Department, which would work collaboratively with the proposed new infrastructure commission. We see the City’s Planning Department extending its mission out 25 years and reflecting that time frame in the City’s Comp Plan.
The City is likely to undertake projects with different characteristics of immediacy and longevity. There may be projects with very long-term perspectives that will span many transitions of City Councils and changeover in staff. City processes for these varying terms should be adjusted accordingly.
Figure 6-‐2. Palo Alto’s planning system fails to look beyond Year 10.

THE FUTURE
IBRC FINAL REPORT 103
Future projects involve many unknowns. Nevertheless, the City will need to consider future infrastructure needs beyond the catch-up, keep-up, and new & replacement projects currently under consideration.
Asset Management
The FWG suggests that the City review its current policies and procedures for managing its infrastructure assets. This should include a regular review to determine if assets should be retained, repurposed, or disposed of, as well as to consider if new assets are required. Aging assets tend to require higher operating maintenance costs, and some City assets may be more useful than others. We believe that an Infrastructure Management System should include asset management tools.
Future Idea Bank
Finally, the FWG proposes establishing a Future Idea Bank to serve as a repository for ideas related to City infrastructure. Palo Alto residents may suggest ideas, providing a name and address for follow-up. The Idea Bank is intended to be a collection of the “raw idea” thinking of residents. Ideas may be expressed by a few words or by a few short descriptive sentences. As we see it, the Idea Bank would be made available to the public on the City’s website. The set of ideas should be reviewed regularly by City staff and presented to the City Council from time to time.
Conclusion
Palo Alto needs to start thinking now about future needs and how to fund them.
The proposed new infrastructure commission will have as part of its charter an important role in shaping what Palo Alto’s future infrastructure will be, and it will be active in defining the projects that will keep Palo Alto a desirable place to live and work. The commission will work closely with the Planning Department, with members of the community, and with other progressive cities to develop plans and ideas for presentation to the City Council.
The FWG has started a thought process that we hope the City continues and incorporates into its planning cycles to help Palo Alto offer progressive services to its residents and businesses.

THE FUTURE
IBRC FINAL REPORT 104

IBRC FINAL REPORT 105
Infrastructure and Competitiveness Commentary
The Commission’s report identifies many reasons why immediate attention to the City’s infrastructure challenges will benefit residents. I want to add economic competitiveness as an additional reason.
My work involves studying the Silicon Valley and California economies. Recently I participated in a study of high tech employers in Silicon Valley. The study identified access to entrepreneurs and talented workers as the key competitive advantage of locating in Silicon Valley.
This means that world-class infrastructure investments are not only a benefit for residents, they are increasingly an imperative of economic competitiveness. This is especially true for Silicon Valley where we are striving to attract entrepreneurs and talented workers and their families to make the Valley their home. They won’t want to work here if they don’t want to live here and raise their families.
A recent survey of CEOs in Silicon Valley states the infrastructure imperative clearly. The Silicon Valley Leadership Group 2011 CEO Survey reported “a deteriorating state infrastructure in areas ranging from public education to public transportation has added to the difficulties of recruiting the best workforce, finding them housing and educating their children to be tomorrow’s world-class workforce.”
Infrastructure investment is one of those unique opportunities where improving the quality of life for residents simultaneously improves our economic competitiveness.
Stephen Levy

IBRC FINAL REPORT 106
Infrastructure Commission Dissent The recommendation to which we are dissenting reads as follows:
1-4 Establish a permanent public commission, appointed by the City Council, to give ongoing oversight to infrastructure maintenance, to consider and make recommendations regarding future infrastructure needs, and to assure proper attention to the City’s physical assets. This commission should have as its staff liaison the Director of Planning
We understand and appreciate the intention behind this recommendation which reflects a deep concern that adequate attention has not been paid to present and future infrastructure and that, without an entity with appropriate authority in place, adequate attention will not be paid in the future. Our dissent has two parts:
1. Regarding the “ongoing oversight” function, we believe that an effective Infrastructure Management System (IMS) operating under a single point of management responsibility can accomplish what is needed. Incorporating methods for public accountability for eliminating catch-up and properly funding and managing keep-up will keep infrastructure in the spotlight. Such accountability will be a major product of the proposed IMS. Moreover, the management tools this Commission recommends will provide for the most effective and economical deployment of staff and expenditure of funds on behalf of infrastructure maintenance and renewal.
If a commission were added to this oversight function, it would, we believe, consume a great deal of management effort without commensurate pay-off and would add another governing entity to an already large number of commissions, committees, boards, and similar entities. Instead of providing a clear and compelling voice for infrastructure, it could simply be another voice arguing for different priorities in the annual budget process. The core objective of IBRC, and of the charge the Council provided, was to assure the valid and reliable assessment of infrastructure needs and a commitment to fund those needs.
A direct line from the City Manager to the Council in addressing that core objective each year can be an effective and efficient means to that end.
2. Regarding the “future infrastructure needs” function, we believe that should become part of the charge of the Planning and Transportation Commission in order to assure a close connection with the Comprehensive Plan. Although it may be necessary to reassess that Commission’s scope and operations in order to handle this additional responsibility, placing the futures advocacy function

IBRC FINAL REPORT 107
anywhere else would leave it unmoored in relation to city planning, budgetary influence, and management priorities.
Although we strongly believe that ongoing oversight should reside in the City Manager’s Office, there is an interim step that could address some of the concern of the majority of the Commission without establishing a permanent new Infrastructure Commission. This approach would be to create a five-person, one-year Implementation Team that would work with staff, the City Manager, and the Council to assure that those among IBRC’s recommendations adopted by the Council become part of the City’s ongoing policy and management priorities. Members could be drawn from the current IBRC membership, from other relevant commissions, and from new applicants.
Ray Bacchetti Ralph Britton
Mark Harris Le Levy
John Melton Mark Michael
Greg Tanaka

IBRC FINAL REPORT 108
Public Safety Dissent I believe that the commission’s recommendation for replacement of Fire Stations #3 and #4 is premature. Additional evaluation needs to be done to determine the full extent of infrastructure for fire and emergency services (which may be much larger, and require significantly more funding). Given the imminent restructuring of Fire Services under the Public Safety department, the recommendation is best left to that department.
The Fire Stations (FS) #3 and #4 are clearly in need of money in order to make them safer and more efficient in the event of emergency. Based on a study done in 2005 by the Fire Department itself, it was estimated that these two building required $14.2M in capital to replace them with larger and more modern structures. It is premature to recommend spending this large sum of money without first considering other options to enhance the City’s emergency response and public safety capability, options that the IBRC has not had time to address. Additionally, there are other Fire Stations that are in need of upgrade, update, consolidation31 or replacement that should be visibly identified on the list of city projects and considered prior to seeking funding for FS #3 and #4. We should better understand and disclose to the public the full extent of infrastructure needs prior to seeking funding for this first, necessary part. Furthermore, with the announcement of the new Public Safety function in the City organization, any changes to fire/public safety infrastructure should be addressed after any organizational changes are done.
The Fire Stations currently house emergency medical response teams and facilities in addition to the traditional fire equipment and fire personnel. The City auditor’s report32 is instructive in its reporting of services provided by the Fire Department over a one year period. That report states that there were 182 fire incidents during that period, of which 11 were residential structure fires. This corresponds to an incident every 48 hours on the average, and a residential structure fire once every 33 days.
Medical response, on the other hand had 4432 incidents over the same one-year period, or about 12 incidents per day on average. Clearly medical response is the considerably more frequently needed service. Emergency medical response has increased at a rate of 5% per year since 2000, whereas fire response has declined slightly.
The number of emergency medical calls is high. We wish to optimize response times for medical emergencies. I ask the question: Is our emergency medical capability 31 The “Fire Services Utilization and Resources Study, Final Report,” January 2011 recommends consolidation of Fire Stations 2 and 5, as one example. 32 City of Palo Alto, Service Efforts and Accomplishments Report for Fiscal 2010.” January 2011

IBRC FINAL REPORT 109
optimally served by its co-location in fire stations? Shouldn’t we be considering medical response more heavily in our analysis of the Fire Department capabilities, especially given the projections for increasing numbers of senior citizens in our community? Furthermore, since our fire stations represent the City’s service for emergency and disaster, are we adequately equipped for response to earthquakes, floods, other acts of nature, terrorism? Do we need other capabilities, equipment, personnel than we currently have? Do we have an opportunity to revisit our needs before spending money? Can disaster/emergency response capabilities, equipment and personnel be shared with neighboring communities?
There is an opportunity for the City to re-evaluate its organization of the fire services with the creation of the new Public Safety department at City Hall. Prior to spending the $14.2M on fire station rebuild, which is tantamount to being able to deliver the exact same services we have today, we should first evaluate our emergency response capability and consider ways of improving the City’s emergency response capability and optimizing emergency services around those services that are most in demand. The commission’s early work with City staff revealed that “the recent fire staffing study, which noted that all of our fire stations are woefully out of date and far too small for their intended purpose.”33 The recommendation for fire station infrastructure should be delayed until the full scope is better understood and we can present to the public the full cost of Public Safety infrastructure for the City.
I would recommend that the new Public Safety office of the City be tasked with addressing these questions in collaboration with the new infrastructure commission.
Bob Stillerman
33 Fire Station Survey, Acting Deputy Chief Catherine Capriles, April 2011

IBRC FINAL REPORT 110
Cubberley Lease Recommendation Commentary In July 2011 the City Council asked the Commission to look at the Cubberley lease. A group of Commission members undertook that task with the help of staff. Their report, reproduced in Appendix H, concludes that conditions have changed since the original agreement between the City and School District and that many of the original reasons for the current arrangement are no longer present.
I accept the conclusion of my colleagues.
The Commission was then faced with two decisions – (1) whether to recommend terminating the current lease arrangement and (2) whether to recommend that the City allocated the resulting cost savings to infrastructure.
The Commission has made no specific recommendation as to the use of any savings from terminating the Cubberley lease and, instead, has illustrated the impact of using these savings for infrastructure purposes as well as other options for funding infrastructure that do not include Cubberley savings. I agree with this approach.
The Commission has voted to recommend terminating the current Cubberley lease. I am uncomfortable with that recommendation for the following reasons:
1. I believe such a recommendation is beyond the main scope of the Commission’s charge from the City Council.
2. I believe this recommendation will detract attention from the major work conducted by the Commission – to identify infrastructure funding needs and propose ways to develop the required funding. I worry that public discussion of our year’s work in identifying and studying infrastructure needs and funding possibilities will be diverted into a discussion of this one potentially contentious issue.
3. The City Council and School District have recently set up a process to review the existing lease arrangement. This means that the Commission’s findings about the lease as summarized in Appendix H will get immediate attention. My feeling is that a Commission recommendation at this time to terminate the lease is premature before the information that will be gathered in the City/school district discussion process is evaluated.
Stephen Levy

IBRC FINAL REPORT 111
Finance Dissent IBRC should recommend a specific financing plan in the report.
The following is a specific financing recommendation that fully funds all proposed catch-up, keep-up, and new infrastructure work while minimizing the net effect on citizens and businesses: 1. Terminate Cubberley Lease ASAP: this will free up at least $6 million annually, plus
it will relieve approximately $7 million in infrastructure backlog.
2. Use all of the Stanford contribution to fund entire current Infrastructure backlog (the amount that Stanford is paying is approximately the same amount as our backlog ex-Cubberley).
3. Devote ~$2 million of $6+ million in annual Cubberley savings to fully fund keep-up maintenance activities;
4. Allocate $4+ million annually of Cubberley savings to be used to partially or fully fund a COP for Public Safety facilities (if not sufficient to fully fund, then adopt an appropriate sales tax);
a. Freeing up existing PA Police Department space for City Services located in leased space (and thus saving operating budget funds);
5. A utility bond to finance Utilities’ share of the space in a new, relocated MSC
a. Reiterating that our electricity rates will still be significantly lower than PG&E even after accounting for this new bond
b. Freeing up the existing 101-adjacent site for auto dealers, possibly generating significant lease and/or sales tax revenue
Alex Panelli Jim Schmidt

IBRC FINAL REPORT 112
Finance Commentary
It is generally agreed by the IBRC that it is sound financial practice to match operating expenses with operating revenues. We consider that ongoing maintenance of our infrastructure be managed as an operating expense in the annual budgeting cycle. The operating maintenance costs (“keep up”) are estimated at approximately $33M per year, not counting new construction and future projects.
In the past decade these operating maintenance expenses have not been fully funded through operating revenues. This is evident in the backlog of $41M that currently appears on the City’s books and which is discussed in detail in this report. Additionally, the pot of money allocated in the City’s reserves for infrastructure has been depleted, going from $36M in FY 2004 to $1M in FY 2012. The trend is clear: keep up is underfunded through ordinary operations and the rainy day fund has been emptied. This trend needs to be reversed.
One of the problems that the IBRC was asked to address is how to deal with the backlog of infrastructure projects. One of IBRC’s stated objectives, and explicit in our recommendations, is that the City take specific near term actions to address the problem directly and to impose policy changes to assure that this problem does not recur. Consequently, IBRC is recommending that revenues be dedicated to infrastructure projects and that reserves be established to treat fluctuations year over year, that may be required for the infrastructure ‘needs.’
It is perhaps unreasonable to assume that the City can easily recover sufficient operating capital to cover the backlog. Hence, this report recommends a number of options to the City Council for funding that backlog over an extended (10-year) period.
The commission has considered traditional funding sources that the City may avail itself of, including additional burden on the constituency: taxpayers and ratepayers, and future savings from termination of the Cubberley lease. The commission has not specifically studied or recommended other sources of revenue to the General Fund as follows:
Transfers of Development Rights (TDRs) Sale of assets (discussed in the report under the futures discussion) New sources of revenue to the City Market priced rental rates to leasees of City buildings Re-pricing of City services

IBRC FINAL REPORT 113
Public/private partnerships for funding of infrastructure Reductions in other operating expenses in the City budget (not in the remit of IBRC)
We believe it important that these sources of revenue be considered prior to imposing yet additional burdens on our citizens.
Bob Stillerman Greg Tanaka

IBRC FINAL REPORT 114
Dedicated Funding Dissent IBRC has learned that funding for our infrastructure had been neglected, resulting not only in a backlog of capital projects but insufficient attention to maintenance, repair and upgrades to facilities needed for the City’s community services. To remedy this, IBRC recommends that 23% of the General Fund be dedicated to infrastructure and that payments to Palo Alto from the Development Agreement with Stanford be sequestered in one or more reserve accounts and dedicated to infrastructure needs.
While desperate times may call for desperate measures, sequestration and budgetary entitlements are controversial solutions. It may be not only unwise but also unnecessary to impose a requirement for dedication of a fixed percentage of the General Fund for infrastructure needs. Indeed, unpredictable future events and inevitable fluctuations in the rate of inflation will require adjustment to changing circumstances and community needs.
What is the best process for ensuring reliable funding for Palo Alto’s infrastructure needs?
Reserves aren’t inviolate – they can be manipulated by different techniques, such as understating amounts deemed to be adequate to meet the specific need, or perhaps by simply excluding certain expenses from what the reserve covers. Thus, it may be more practical to arm the Council and the City’s staff with a stronger process and better tools – specifically a more robust Infrastructure Management System that provides accurate and timely information of the true and complete costs, as well as benefits, of the City's infrastructure. A decision-making process that would best protect the public interest in viable City infrastructure is one that is well informed by an IMS, is accountable at a high level of City management, is fully transparent via periodic analysis and reporting to the Council, and is communicated to the residents for their feedback, input and ultimate sanction via the ballot box.
Mark Michael Greg Tanaka David Bower

IBRC FINAL REPORT 115
Revenue Dedication Dissent Summary: There are sufficiently serious shortcomings in the logic and numbers being used by the Commission to determine the 23% revenue dedication recommendation being made in this Report to prompt this commentary.
Among other forecasting analysis decisions, the Commission has opted to assume and present all financial data in current 2011-dollars over the projected 25-year period. Actual inflation factors used by the City in its Long Range Financial Forecast (LRFF) assume higher inflation in costs than in revenues, which results in extended/expanding future operating cash shortfalls. The possible consequences of the Report’s choices to not present the potential effects of varied inflation factors may result in funding recommendations that do not fully address nor fully correct the infrastructure backlog problem.
The problems arise from the projected infrastructure expense and future inflation assumptions and one-time starting data used in initial determinations regarding funding gaps, and the lack of adequate scenarios testing, to this point, to validate or refine these foundational gap assumptions and resulting recommendations.
Key examples are (refer to table 1-1 and its notes):
1) using (and projecting) a static one-time 2011-dollars number for Operating Maintenance infrastructure expense of $15.2 million (that has been simply-and-mechanically straight-line projected over the next 25 years) versus an inflation adjusted (using the City’s 4.24% factor) figure (in effect for and averaged over the first 5 years) which is $16.5 million, and which results in implied higher cash funding needs of $1.3 million per year (over the first 5 year period, alone), and
2) using a currently calculated 2011-dollars Operating Maintenance/CIP backlog “catch-up” total of $41.5 million that has been evenly-and-mechanically divided into ten 1 year increments of $4.15 million per year) versus applying the 3.90% City-provided inflation factor which sums to an inflation-adjusted projected total of $49.6 million…. which further results in implied higher cash funding needs of $8.1 million over the same 10 year period.
Thus, the Report does not present a fully-accurate more-comprehensive financial analysis because it is limited to one very simplistic assumption regarding future inflation; that City revenues and expenses (and infrastructure costs) are non-inflated or equal-inflated over the next 25 years (refer to Finance Section-Inflation, page 70).
This presentation choice passes over-or-around actual and available staff-prepared City revenue and expense projections in the current Long Range Financial Forecast (LRFF)

IBRC FINAL REPORT 116
and the related actual and compiled costs of projected infrastructure outlays with embedded City-accepted inflation assumptions.
As alternatives-and-evidence of the impacts of both “inflation” timings and new sources “additional revenues” timings, certain select scenarios testing extracts from a simplified-modified cash flow template have been included in a table at the end of this dissent/commentary (block corners A152, A184, AD152, AD184).
These calculations for 23% and 25% dedication testing have only had one addition/modification made to staff-vetted numbers (numbers previously and exactly drawn from the staff-prepared LRFF and the newly-compiled Public Works inventory-of-infrastructure-needs). The Report has made reference for the need (supporting justification for the 3/8% sales tax increase recommendation) to continue $4.15 million (in 2011 dollars) spending for smaller-unspecified new-and-replacement in the 10 outlying years (2022-2031) after current “catch-up” is completed. Those future 10 years of infrastructure expenditure, adjusted by a City-used inflation factor of 3.90%, have been added to the “dedications testings” noted above (refer to Lines 162 of the following table items).
These rudimentary scenarios testings indicate (referring to Lines 171 and 184) some potentially substantial variations (or uncertainties) in projected future cash positions (near-term and longer-term) for the cumulative Operating Maintenance Reserve (as proposed on page 89) and its funding source, the General Fund Operating Budget….. given the levels of hypothetical General Fund revenue dedications (23% or 24% or 25%).
By example, the Version 23% infrastructure needs (Line 171) are initially and increasingly underfunded…. “catch-up” never gets “caught up”.
By example, the Version 25% infrastructure needs (Line 171) successfully builds cash reserves for infrastructure, but at substantial ($10-12 million levels) added deficit pressures to near-term General Fund Operating Budget cash projections.
By example, if BOTH the 3/8% sales tax increase is approved-and-fully contributive starting in year 2013 AND the FULL realization of “Cubberley savings” is applied to “back-fill” the General Fund Operating Budget “cash holes” starting in FY 2015, then….. all other factors being stable…..the City’s long-term General Fund cash position improves dramatically over an extended period of time, starting 8 to 10 years out (Lines 184). This scenario implies several options for the City including: a source of funding to finance COP’s for the larger, future Infrastructure projects mentioned in the Report, potential structural relief from the City’s current projected longer-term operating deficits, and/or a possible sunset provision or reduction in the 3/8% sales tax increase sometime in the future.
Conversely, if there is ANY reduction in the projected realization of future “Cubberley savings” (Lines 180) because of other demands or allocations, those reductions will

IBRC FINAL REPORT 117
create dollar-for-dollar cash decreases in the intertwined projected cash positions of the Infrastructure Reserves and the City’s General Fund.
Stated in other ways, as reinforcement of the above concerns:
There is no doubt that dedicating, as a minimum, 23% of revenue versus the current 18.4% will make a major contribution to infrastructure maintenance. However, this 23% figure was based on a first order-of-magnitude analysis of the identified needs without taking into account the actual planned project scheduling to implement the recommended infrastructure plan (as has been presented in the main body of this report) and the potentially erosive effects of inflation.
Several member of the Commission have worked very closely with both Public Works and Administrative Services staff to take the information gathered on infrastructure needs and preliminarily develop an expanded Long Range Financial Forecast (LRFF) cash flow template incorporating those findings. Although the model template (as used and referenced above) needs much more refinement (the core of the IMS recommendation, which is fully supported here), it is the only tool currently available that could be used to combine the City’s current LRFF with the identified infrastructure needs and the untested financing options presented in this Report.
Even though rudimentary, this is a critical tool in that it demonstrates varying “cash flow” impacts of certain Report recommendations on the General Fund’s operating funding and capital funding over the 25 year time horizon.
Running a very limited set of scenarios (23%, 24% and 25% dedications) based on the earliest possible dates that new revenues or savings would occur for the two major sources of additional ongoing funding identified by the Commission – a 3/8% increase in the sales tax and Cubberley savings (and again, stated for reinforcement of our concerns) results in:
In the short run, the City will have a major revenue (“cash shortfall”) gap if it determines to embark immediately on both ongoing recommendations for infrastructure catch-up and keep-up and/or financing of the major projects. This can be addressed by either finding a short-term source of additional cash funding on the order of $5 million or by deferring the infrastructure restorations plan until a new revenue stream (or streams) is actually secured. Such a delay could greatly increase the cost of the plan, however.
In the long run, there should be sufficient revenue and cost savings generated by the two new sources (if fully and continuingly realized) to offset current general fund operating maintenance needs and ongoing new infrastructure needs, including major replacement CIP’s financed through COP’s. At 23% of GF revenue dedication, the infrastructure restoration program will likely be underfunded and the general fund will receive a major (long-term) cumulative

IBRC FINAL REPORT 118
cash-inflow windfall. The reverse is true at a 25% level dedication – the infrastructure restoration program will be overfunded and will, reciprocally, create additional “cash flow gap” pressures for the General Fund
Under the Sales Tax/Cubberley scenario, a net cash flow stream from the General Fund could be available to finance (fund repayment of) COP’s for Public Safety structures, but not until fiscal year 2015-16 at the earliest.
These complex-and-inter-related “available cash” issues are partially addressed within the Finance and IMS sections of the Report, and are re-summarized below for added emphasis because of their importance:
That the expanded LRFF be an integral part of the IMS.
That the City determine the appropriate level of additional “funding advances” needed to initiate the new infrastructure restorations program, and the method(s) for their continued funding prior to institution/initiation of any new revenue streams.
A caveat that the 23% dedication may not cover proposed infrastructure Operating Maintenance catch-up and keep-up plans, and that it is likely the General Fund will have to make additional balancing allocations at the onset of each fiscal year to the Operating Maintenance Reserve to meet the recommended lower limit cash balance for that Reserve.
If the City decides to utilize the enhanced revenue/expense savings approach as recommend by this Commission (3/8%sales tax increase AND Cubberley lease termination) to fund major public projects with Certificates of Participation, then that should become a clear City policy so that when those CASH BUDGET INFUSIONS become available – whether in 2015 or earlier or later – they will be allocated for major public purpose infrastructure investment, and NOT AVAILABLE to fund ongoing General Fund Operating Budget expenditures.
Conclusion: The City’s prior formal Infrastructure Reserve has declined (in part because of operating budget pressures and cumulative annual operating deficits) over the last few years from a one-time peak of $36 million in 2004 to less than $4 million today, along with a continuing build-up to a $40+ million current infrastructure backlog. These sobering facts amplify the need for thoughtful consideration of the dissent counter-point topics (and increased cautions and awareness) cited above. They add both weight and pause to the other very thoughtful references, recommendations and facts as presented in the main body of this Commission’s work.
Jim Olstad Mark Harris Bob Stillerman Alex Panelli

152 Calculation using 23.0% of General Fund revenues for infrastructure FY 2012 2013 2014 2015 2016 2017 2018 2019 2020 2021 2022 2023 2024 2025 2026 2027 2028 2029
153
154 23.0% revenue dedication (from line 28) $33,653 $34,154 $35,290 $36,503 $37,720 $39,044 $40,446 $41,816 $43,094 $44,383 $45,795 $47,253 $48,760 $50,316 $51,924 $53,585 $55,301 $57,074
155 Gas Tax only source (from line 46) $1,764 $1,764 $1,764 $1,764 $1,764 $1,764 $1,764 $1,764 $1,764 $1,764 $1,764 $1,764 $1,764 $1,764 $1,764 $1,764 $1,764 $1,764
156 Other sources (from line 58 - no interest transfers) $2,426 $1,470 $1,516 $1,564 $1,613 $1,664 $1,716 $1,770 $1,826 $1,884 $1,943 $2,004 $2,067 $2,132 $2,200 $2,269 $2,340 $2,414
157
158 Total JO-derived Annual Infrastructure Sources $37,843 $37,388 $38,570 $39,830 $41,098 $42,472 $43,926 $45,350 $46,684 $48,031 $49,502 $51,021 $52,591 $54,213 $55,888 $57,618 $59,405 $61,252
159
160 CIP Budgets Needs (from line 69) $18,350 $14,746 $16,401 $15,778 $14,096 $18,073 $15,036 $14,554 $16,544 $19,094 $30,807 $25,752 $19,546 $21,278 $19,455 $27,211 $24,246 $24,400
161 Unexpected CIP cushion as per IBRC (from line 70) $1,500 $1,559 $1,621 $1,685 $1,752 $1,821 $1,894 $1,969 $2,047 $2,128 $2,212 $2,299 $2,390 $2,485 $2,584 $2,686 $2,792 $2,903
162 Catch-Up (inflation adjusted) Needs (from line 73) $4,153 $4,315 $4,483 $4,658 $4,839 $5,028 $5,224 $5,428 $5,640 $5,860 $6,088 $6,326 $6,572 $6,829 $7,095 $7,372 $7,659 $7,958
163 Optimal Operating Maintenance Needs (from line 75) $1,623 $1,692 $1,764 $1,839 $1,917 $1,998 $2,083 $2,171 $2,263 $2,359 $2,459 $2,563 $2,672 $2,785 $2,903 $3,027 $3,155 $3,289
164
165 CIP "plus" Needs Subtotal $25,627 $22,312 $24,269 $23,960 $22,605 $26,921 $24,236 $24,122 $26,493 $29,441 $41,566 $36,940 $31,181 $33,377 $32,036 $40,295 $37,852 $38,550
166 Operating Maintnance Needs (inflation adjusted) $15,208 $15,853 $16,525 $17,226 $17,956 $18,717 $19,511 $20,338 $21,201 $22,099 $23,036 $24,013 $25,031 $26,093 $27,199 $28,352 $29,554 $30,808
167
168 Total JO-derived Annual Infrastructure Needs $40,835 $38,165 $40,794 $41,186 $40,561 $45,638 $43,747 $44,460 $47,694 $51,540 $64,602 $60,953 $56,212 $59,470 $59,236 $68,648 $67,406 $69,357
169
170 23.0 Maintenance Reserve Surplus or Deficit -$2,991 -$777 -$2,224 -$1,356 $537 -$3,166 $179 $890 -$1,010 -$3,509 -$15,100 -$9,932 -$3,621 -$5,257 -$3,348 -$11,030 -$8,001 -$8,105
171 23.0 Maintenance Reserve Cumulative Result -$2,991 -$3,769 -$5,992 -$7,348 -$6,811 -$9,977 -$9,798 -$8,908 -$9,917 -$13,426 -$28,526 -$38,458 -$42,080 -$47,337 -$50,685 -$61,715 -$69,716 -$77,821
172
173 Cash NET-Net (GF Operating Budget Cash Flow Effect)
174 23.0% revenue (from line 154) -$33,653 -$34,154 -$35,290 -$36,503 -$37,720 -$39,044 -$40,446 -$41,816 -$43,094 -$44,383 -$45,795 -$47,253 -$48,760 -$50,316 -$51,924 -$53,585 -$55,301 -$57,074
175 Cancelled infrastructue transfer (from line 42) $10,478 $10,892 $11,334 $11,787 $12,288 $12,780 $13,291 $13,823 $14,376 $14,951 $15,549 $16,171 $16,818 $17,491 $18,190 $18,918 $19,674 $20,461
176 Cancelled interest transfer (from line 47) $1,000 $1,000 $1,000 $1,000 $1,000 $1,000 $1,000 $1,000 $1,000 $1,000 $1,000 $1,000 $1,000 $1,000 $1,000 $1,000 $1,000 $1,000
177 Operating Maintnance Needs (from line 166) $15,208 $15,853 $16,525 $17,226 $17,956 $18,717 $19,511 $20,338 $21,201 $22,099 $23,036 $24,013 $25,031 $26,093 $27,199 $28,352 $29,554 $30,808
178 Subtotal effect on GF operating budget cash -$6,967 -$6,409 -$6,431 -$6,490 -$6,476 -$6,547 -$6,644 -$6,655 -$6,517 -$6,333 -$6,210 -$6,069 -$5,911 -$5,733 -$5,535 -$5,315 -$5,072 -$4,805
179
180 Cubberley Savings (from line 110) $0 $0 $0 $3,365 $6,954 $7,186 $7,425 $7,672 $7,928 $8,192 $8,464 $8,746 $9,037 $9,338 $9,649 $9,971 $10,303 $10,646
181 3/8 % Sales tax increase effects (from line 88) $0 $7,851 $8,146 $8,457 $8,790 $9,137 $9,502 $9,773 $10,022 $10,290 $10,616 $10,952 $11,299 $11,656 $12,025 $12,406 $12,798 $13,203
182
183 GF Operating plus Infrastructure Adjusted Net -$6,967 $1,441 $1,715 $5,332 $9,267 $9,776 $10,283 $10,790 $11,432 $12,149 $12,871 $13,629 $14,426 $15,262 $16,140 $17,061 $18,029 $19,044
184 Cumulative GF Operating Budget Cash Effect -$6,967 -$5,526 -$3,811 $1,521 $10,788 $20,564 $30,847 $41,637 $53,069 $65,218 $78,089 $91,718 $106,143 $121,405 $137,545 $154,606 $172,635 $191,679
152 Calculation using 25.0% of General Fund revenues for infrastructure FY 2012 2013 2014 2015 2016 2017 2018 2019 2020 2021 2022 2023 2024 2025 2026 2027 2028 2029
153
154 25.0% revenue dedication (from line 28) $36,580 $37,124 $38,359 $39,677 $41,001 $42,439 $43,963 $45,452 $46,841 $48,243 $49,777 $51,362 $53,000 $54,691 $56,439 $58,245 $60,110 $62,037
155 Gas Tax only source (from line 46) $1,764 $1,764 $1,764 $1,764 $1,764 $1,764 $1,764 $1,764 $1,764 $1,764 $1,764 $1,764 $1,764 $1,764 $1,764 $1,764 $1,764 $1,764
156 Other sources (from line 58 - no interest transfers) $2,426 $1,470 $1,516 $1,564 $1,613 $1,664 $1,716 $1,770 $1,826 $1,884 $1,943 $2,004 $2,067 $2,132 $2,200 $2,269 $2,340 $2,414
157
158 Total JO-derived Annual Infrastructure Sources $40,770 $40,358 $41,639 $43,005 $44,378 $45,867 $47,443 $48,987 $50,431 $51,890 $53,484 $55,130 $56,831 $58,588 $60,403 $62,277 $64,214 $66,215
159
160 CIP Budgets Needs (from line 69) $18,350 $14,746 $16,401 $15,778 $14,096 $18,073 $15,036 $14,554 $16,544 $19,094 $30,807 $25,752 $19,546 $21,278 $19,455 $27,211 $24,246 $24,400
161 Unexpected CIP cushion as per IBRC (from line 70) $1,500 $1,559 $1,621 $1,685 $1,752 $1,821 $1,894 $1,969 $2,047 $2,128 $2,212 $2,299 $2,390 $2,485 $2,584 $2,686 $2,792 $2,903
162 Catch-Up (inflation adjusted) Needs (from line 73) $4,153 $4,315 $4,483 $4,658 $4,839 $5,028 $5,224 $5,428 $5,640 $5,860 $6,088 $6,326 $6,572 $6,829 $7,095 $7,372 $7,659 $7,958
163 Optimal Operating Maintenance Needs (from line 75) $1,623 $1,692 $1,764 $1,839 $1,917 $1,998 $2,083 $2,171 $2,263 $2,359 $2,459 $2,563 $2,672 $2,785 $2,903 $3,027 $3,155 $3,289
164
165 CIP "plus" Needs Subtotal $25,627 $22,312 $24,269 $23,960 $22,605 $26,921 $24,236 $24,122 $26,493 $29,441 $41,566 $36,940 $31,181 $33,377 $32,036 $40,295 $37,852 $38,550
166 Operating Maintnance Needs (inflation adjusted) $15,208 $15,853 $16,525 $17,226 $17,956 $18,717 $19,511 $20,338 $21,201 $22,099 $23,036 $24,013 $25,031 $26,093 $27,199 $28,352 $29,554 $30,808
167
168 Total JO-derived Annual Infrastructure Needs $40,835 $38,165 $40,794 $41,186 $40,561 $45,638 $43,747 $44,460 $47,694 $51,540 $64,602 $60,953 $56,212 $59,470 $59,236 $68,648 $67,406 $69,357
169
170 25.0 Maintenance Reserve Surplus or Deficit -$65 $2,193 $845 $1,819 $3,817 $229 $3,696 $4,526 $2,738 $350 -$11,118 -$5,823 $619 -$882 $1,167 -$6,370 -$3,192 -$3,142
171 25.0 Maintenance Reserve Cumulative Result -$65 $2,128 $2,973 $4,791 $8,608 $8,837 $12,533 $17,060 $19,798 $20,148 $9,030 $3,207 $3,826 $2,944 $4,111 -$2,259 -$5,451 -$8,593
172
173 Cash NET-Net (GF Operating Budget Cash Flow Effect)
174 25.0% revenue (from line 154) -$36,580 -$37,124 -$38,359 -$39,677 -$41,001 -$42,439 -$43,963 -$45,452 -$46,841 -$48,243 -$49,777 -$51,362 -$53,000 -$54,691 -$56,439 -$58,245 -$60,110 -$62,037
175 Cancelled infrastructue transfer (from line 42) $10,478 $10,892 $11,334 $11,787 $12,288 $12,780 $13,291 $13,823 $14,376 $14,951 $15,549 $16,171 $16,818 $17,491 $18,190 $18,918 $19,674 $20,461
176 Cancelled interest transfer (from line 47) $1,000 $1,000 $1,000 $1,000 $1,000 $1,000 $1,000 $1,000 $1,000 $1,000 $1,000 $1,000 $1,000 $1,000 $1,000 $1,000 $1,000 $1,000
177 Operating Maintnance Needs (from line 166) $15,208 $15,853 $16,525 $17,226 $17,956 $18,717 $19,511 $20,338 $21,201 $22,099 $23,036 $24,013 $25,031 $26,093 $27,199 $28,352 $29,554 $30,808
178 Subtotal effect on GF operating budget cash -$9,894 -$9,379 -$9,500 -$9,664 -$9,757 -$9,942 -$10,161 -$10,291 -$10,265 -$10,192 -$10,192 -$10,178 -$10,151 -$10,108 -$10,050 -$9,974 -$9,881 -$9,768
179
180 Cubberley Savings (from line 110) $0 $0 $0 $3,365 $6,954 $7,186 $7,425 $7,672 $7,928 $8,192 $8,464 $8,746 $9,037 $9,338 $9,649 $9,971 $10,303 $10,646
181 3/8 % Sales tax increase effects (from line 88) $0 $7,851 $8,146 $8,457 $8,790 $9,137 $9,502 $9,773 $10,022 $10,290 $10,616 $10,952 $11,299 $11,656 $12,025 $12,406 $12,798 $13,203
182
183 GF Operating plus Infrastructure Adjusted Net -$9,894 -$1,529 -$1,354 $2,157 $5,987 $6,381 $6,766 $7,154 $7,685 $8,290 $8,889 $9,520 $10,186 $10,886 $11,625 $12,402 $13,220 $14,081
184 Cumulative GF Operating Budget Cash Effect -$9,894 -$11,422 -$12,776 -$10,618 -$4,631 $1,749 $8,515 $15,669 $23,354 $31,644 $40,532 $50,052 $60,238 $71,124 $82,749 $95,151 $108,371 $122,452

152 Calculation using 23.0% of General Fund revenues for infrastructure
153
154 23.0% revenue dedication (from line 28)
155 Gas Tax only source (from line 46)
156 Other sources (from line 58 - no interest transfers)
157
158 Total JO-derived Annual Infrastructure Sources
159
160 CIP Budgets Needs (from line 69)
161 Unexpected CIP cushion as per IBRC (from line 70)
162 Catch-Up (inflation adjusted) Needs (from line 73)
163 Optimal Operating Maintenance Needs (from line 75)
164
165 CIP "plus" Needs Subtotal
166 Operating Maintnance Needs (inflation adjusted)
167
168 Total JO-derived Annual Infrastructure Needs
169
170 23.0 Maintenance Reserve Surplus or Deficit
171 23.0 Maintenance Reserve Cumulative Result
172
173 Cash NET-Net (GF Operating Budget Cash Flow Effect)
174 23.0% revenue (from line 154)
175 Cancelled infrastructue transfer (from line 42)
176 Cancelled interest transfer (from line 47)
177 Operating Maintnance Needs (from line 166)
178 Subtotal effect on GF operating budget cash
179
180 Cubberley Savings (from line 110)
181 3/8 % Sales tax increase effects (from line 88)
182
183 GF Operating plus Infrastructure Adjusted Net
184 Cumulative GF Operating Budget Cash Effect
152 Calculation using 25.0% of General Fund revenues for infrastructure
153
154 25.0% revenue dedication (from line 28)
155 Gas Tax only source (from line 46)
156 Other sources (from line 58 - no interest transfers)
157
158 Total JO-derived Annual Infrastructure Sources
159
160 CIP Budgets Needs (from line 69)
161 Unexpected CIP cushion as per IBRC (from line 70)
162 Catch-Up (inflation adjusted) Needs (from line 73)
163 Optimal Operating Maintenance Needs (from line 75)
164
165 CIP "plus" Needs Subtotal
166 Operating Maintnance Needs (inflation adjusted)
167
168 Total JO-derived Annual Infrastructure Needs
169
170 25.0 Maintenance Reserve Surplus or Deficit
171 25.0 Maintenance Reserve Cumulative Result
172
173 Cash NET-Net (GF Operating Budget Cash Flow Effect)
174 25.0% revenue (from line 154)
175 Cancelled infrastructue transfer (from line 42)
176 Cancelled interest transfer (from line 47)
177 Operating Maintnance Needs (from line 166)
178 Subtotal effect on GF operating budget cash
179
180 Cubberley Savings (from line 110)
181 3/8 % Sales tax increase effects (from line 88)
182
183 GF Operating plus Infrastructure Adjusted Net
184 Cumulative GF Operating Budget Cash Effect
2030 2031 2032 2033 2034 2035 2036
$58,906 $60,799 $62,755 $64,776 $66,864 $69,022 $71,252
$1,764 $1,764 $1,764 $1,764 $1,764 $1,764 $1,764
$2,490 $2,569 $2,649 $2,733 $2,819 $2,908 $2,999
$63,160 $65,132 $67,168 $69,273 $71,447 $73,694 $76,015
$25,590 $27,220 $46,510 $27,391 $26,168 $29,584 $33,069
$3,018 $3,137 $3,261 $3,391 $3,525 $3,665 $3,810
$8,268 $8,591 $0 $0 $0 $0 $0
$3,428 $3,573 $3,725 $3,883 $4,047 $4,219 $4,398
$40,304 $42,521 $53,497 $34,664 $33,740 $37,468 $41,276
$32,114 $33,475 $34,895 $36,374 $37,917 $39,524 $41,200
$72,418 $75,997 $88,391 $71,038 $71,657 $76,992 $82,476
-$9,257 -$10,865 -$21,223 -$1,766 -$210 -$3,298 -$6,461
-$87,078 -$97,943 -$119,166 -$120,932 -$121,142 -$124,440 -$130,901
-$58,906 -$60,799 -$62,755 -$64,776 -$66,864 -$69,022 -$71,252
$21,280 $22,131 $23,016 $23,937 $24,895 $25,890 $26,926
$1,000 $1,000 $1,000 $1,000 $1,000 $1,000 $1,000
$32,114 $33,475 $34,895 $36,374 $37,917 $39,524 $41,200
-$4,512 -$4,192 -$3,844 -$3,464 -$3,053 -$2,607 -$2,126
$11,000 $11,367 $11,745 $12,136 $12,540 $12,958 $13,389
$13,621 $14,052 $14,497 $14,956 $15,429 $15,917 $16,421
$20,109 $21,226 $22,398 $23,628 $24,916 $26,268 $27,685
$211,788 $233,014 $255,413 $279,040 $303,957 $330,224 $357,909
2030 2031 2032 2033 2034 2035 2036
$64,028 $66,086 $68,212 $70,408 $72,678 $75,024 $77,448
$1,764 $1,764 $1,764 $1,764 $1,764 $1,764 $1,764
$2,490 $2,569 $2,649 $2,733 $2,819 $2,908 $2,999
$68,283 $70,418 $72,625 $74,905 $77,261 $79,696 $82,211
$25,590 $27,220 $46,510 $27,391 $26,168 $29,584 $33,069
$3,018 $3,137 $3,261 $3,391 $3,525 $3,665 $3,810
$8,268 $8,591 $0 $0 $0 $0 $0
$3,428 $3,573 $3,725 $3,883 $4,047 $4,219 $4,398
$40,304 $42,521 $53,497 $34,664 $33,740 $37,468 $41,276
$32,114 $33,475 $34,895 $36,374 $37,917 $39,524 $41,200
$72,418 $75,997 $88,391 $71,038 $71,657 $76,992 $82,476
-$4,135 -$5,578 -$15,766 $3,867 $5,604 $2,703 -$265
-$12,729 -$18,307 -$34,073 -$30,206 -$24,602 -$21,898 -$22,164
-$64,028 -$66,086 -$68,212 -$70,408 -$72,678 -$75,024 -$77,448
$21,280 $22,131 $23,016 $23,937 $24,895 $25,890 $26,926
$1,000 $1,000 $1,000 $1,000 $1,000 $1,000 $1,000
$32,114 $33,475 $34,895 $36,374 $37,917 $39,524 $41,200
-$9,635 -$9,479 -$9,301 -$9,097 -$8,867 -$8,609 -$8,322
$11,000 $11,367 $11,745 $12,136 $12,540 $12,958 $13,389
$13,621 $14,052 $14,497 $14,956 $15,429 $15,917 $16,421
$14,987 $15,939 $16,941 $17,995 $19,102 $20,266 $21,489
$137,438 $153,378 $170,319 $188,314 $207,416 $227,682 $249,171

IBRC FINAL REPORT 121
APPENDIX A -‐ CITY OF PALO ALTO: CIVIC INFRASTRUCTURE
1. Basic Services34 City Hall (built 1970): 90,000 square feet (with 260,000 square feet
of public underground parking) Public Safety Building (1970): 24,000 square feet Municipal Services Center (1966) ~ 83,000 square feet on 16 acres Fire and Medical Response:
Station 1 Alma Street (1965) Station 2 Hanover (Stanford) (1965) Station 3 Rinconada Park (1948) Station 4 Meadow/Middlefield (1953) Station 5 Arastradero (1962) Station 6 Serra (Stanford) (1968) Station 7 Sand Hill Road (1968) Station 8 Foothills Park (1986) 2,700 fire hydrants
2. Surface Assets Streets: 473 lane miles Sidewalks: 283 miles Street trees: ~ 37,000 trees of 230 species Bridges: 74 bridges (for which Palo Alto has full or partial responsibility) Levees (for which Palo Alto has partial responsibility) Dams: 2 earthen dams Paved bike paths: 8.5 miles off-road (not including Foothills Park, Pearson-
Arastradero Preserve) Hiking/biking trails: 35.3 miles (Baylands Preserve, Foothills Park, Pearson-
Arastradero Preserve)
3. Recreation and Culture 34 parks: ~ 4,200 acres Golf course Swimming facility 4 community centers 5 libraries Junior Museum and Zoo Art Center 2 Little League baseball parks 2 interpretive centers (at Baylands and Foothills parks)
34 In addition to these listings, Palo Alto’s Electric, Gas, Water, Refuse, Storm Drain, and Wastewater enterprises own and maintain infrastructure in connection with their provision of services to Palo Alto residents. The mandate of IBRC has excluded these not-for-profit enterprises which are essentially self-funding and self-financing.

APPENDIX A: CIVIC INFRASTRUCTURE
IBRC FINAL REPORT 122
Recreation and Culture, cont. Lawn Bowling Green & Clubhouse Community Theatre Children’s Theatre Community gardens
4. Properties Leased to Nonprofits Gamble House & Gardens (Gamble Garden Center) Bryant Street Police & Fire House (Avenidas) Williams House (Museum of American Heritage) Roth Building (Palo Alto History Association) Winter Lodge (Winter Club) Sea Scout Building Girl Scout Building
(The above facilities are leased for $1/per year; annual maintenance is the responsibility of lessees.)
Camp Fremont Hostess House (MacArthur Park Restaurant) Portion of the former Cubberley School (8 acres)

IBRC FINAL REPORT 123
Appendix B -‐ City Council Charge to IBRC 1. What is the complete listing of the City’s infrastructure backlog and
future needs? What criteria should be used to prioritize this list of projects?
2. Are there ways the City’s infrastructure needs can be prioritized into five-year increments that can be financed and also effectively implemented given current staff resources?
3. What are potential financing mechanisms that could be used to address the City’s infrastructure needs? Should there be a one-time financing mechanism or some ongoing source of infrastructure funding? What are the options for each of these choices?
4. Is a bond measure the best mechanism for funding the infrastructure backlog? If so, when should this move forward and how could it be structured?
5. How can public/private partnerships be leveraged as an infrastructure funding mechanism?
6. How are City project cost estimates developed, and are these in alignment with other local jurisdictions?
7. How do Enterprise Fund infrastructure projects intersect with General Fund infrastructure projects?

IBRC FINAL REPORT 124
Appendix C -‐ Description of Infrastructure Database Key requirements
1. Contains a listing of all general fund assets, organized into the following tiers: Facility Type / facility / building or unit / component / sub-component / sub-sub-component.
2. For each tier, has the ability to identify an essentially unlimited number of attributes, including:
Annual maintenance needs, CIP needs, lease information, book value, acquisition data, depreciation data.
3. For each annual maintenance and CIP need, has the ability to include and track:
Dollar estimate of need (with and without inflation) / estimates of dates needed / actual expenditures (staff/contractor/hardware breakout ) /actual dates installed.
4. Has the ability to compile a Budget Needs Plan for any future year or group of years.
5. Has the ability to include revenue sources by year, matched to needs where the source is dedicated.
6. Has the ability to compile a Revenue Plan, matched to a Budget Needs Plan, for any year or group of years, and compute differences.

IBRC FINAL REPORT 125
Appendix D -‐ Report of the Surface Committee REPORT OF THE SURFACE COMMITTEE TO THE INFRASTRUCTURE BLUE RIBBON COMMISSION CITY OF PALO ALTO JULY 20, 2011 Revised November 1, 2011 MEMBERS Jim Schmidt, Chair Marc Berman Ralph Britton Pat Markevitch STAFF LIAISONS Mike Sartor Elizabeth Ames
CONTENTS Introduction Streets Medians Sidewalks Parks, Open Space & Golf Trees Trails Traffic Signals Transportation Improvements Street Lights Dams/Bridges Parking Lots Flood Control Resources List

APPENDIX D: SURFACE REPORT
IBRC FINAL REPORT 126
INTRODUCTION This report was prepared by the Surface Committee of the Palo Alto Infrastructure Blue Ribbon Commission (IBRC) with the assistance of Elizabeth Ames, Senior Engineer for the City.
The report summarizes the recommendations of the Committee divided into twelve sections. Each section contains one recommendation and provides cost estimates of three kinds: current funding level, incremental annual funding recommended above current annual level and estimated annual average over 25 years to achieve the committee’s recommendations. These estimates do not account for possible outside revenue sources including gas tax funds, park development impact fees and miscellaneous grants. Estimates for future years do NOT include any inflation factor and are subject to change given that their level of accuracy diminishes over time. The Committee gathered its information from four sources: background information prepared for the Commission (IBRC Briefing Materials, dated October 2010); presentations by City of Palo Alto (CPA) department heads and key staff (see resources list); meetings with appropriate staff from three adjacent cities – Redwood City, Menlo Park, Mountain View; and a field trip with CPA staff around Palo Alto. The Committee provided a brief status report as part of the Commission’s status report to the Palo Alto City Council on March 14, 2011. The Committee provided an extensive interim report to the Commission on May 12, 2011, which is available at http://www.cityofpaloalto.org/civica/filebank/blobdload.asp?BlobID=27246. Each of the Committee’s recommendations has a priority level on a scale from 1 to 3 as shown in the prioritization table. The scale from 1 to 3 corresponds to the following definitions: 1. Required by legal obligation, safety improvement, contract with another
agency or to maintain existing asset 2. Reduction of service level or functionality 3. Desirable community benefit The committee priority shown is an average of the four committee members’ rankings. The lowest score (1) indicates the highest priority. Service on the Surface Committee has been a considerable learning experience for every committee member, not necessarily only of things we wanted to know but also necessarily of things we needed to know.

APPENDIX D: SURFACE REPORT
IBRC FINAL REPORT 127
Element: STREETS STREET MAINTENANCE Committee priority: 1
Costs: Current Annual Funding Level
Incremental Funding Level Average Annual Funding (need) 25 years
$3.7M None $3.7M
Recommendation: To bring seriously damaged pavement up to standard requires continuing the annual capital expenditure of $3.7M over the next five years. This would result in an average Pavement Condition Index (PCI) value of 80, which is considered “very good” and would be one of the highest PCI scores in the Bay Area. After that, $3.7M should be earmarked for the annual street maintenance capital program. This also represents a number which minimizes costs, provides timely maintenance performed before serious deterioration sets in at PCI scores of 60 or below. Project Narrative: The City maintains 197 miles of streets in Palo Alto. The State of California maintains El Camino Real and US Highway 101 while Santa Clara County maintains Oregon Expressway and Page Mill Road. City crews perform urgently needed repairs such as pothole filling and crack sealing. Larger capital maintenance programs are bid out to contractors, which accounts for 2/3 of the expenditures. Communities generally use a metric known as the PCI to describe the condition of their streets. Using a PCI numerical value between 0 and 100 defines the condition with 100 representing an excellent pavement. The PCI for the City of Palo Alto was 73 in 2010. The PCI range in 2010 for other Bay Area cities was from a high 86 to low 42 PCI score. These funding estimates do not account for possible outside revenue sources including gas tax funds and miscellaneous grants.

APPENDIX D: SURFACE REPORT
IBRC FINAL REPORT 128
PCI score of 60: McKellar Lane The reason this block scored a 60 is because of the raveling (exposed rock at the pavement surface) and numerous trenches and patches.

APPENDIX D: SURFACE REPORT
IBRC FINAL REPORT 129
PCI score of 40: Kings Lane at Newell Road The reason this block is scored a 40 is due to the extensive trenching, patching and alligator cracking (closely spaced cracks forming an irregular pattern at the pavement surface).

APPENDIX D: SURFACE REPORT
IBRC FINAL REPORT 130
PCI Score of 20: Manzanita from Madrono to Escobita The reason this block scored a 20 is due to a severe 800 square feet (SF) base failure, 1,500 linear feet (LF) of moderate block cracking (cracks forming a block pattern at the pavement surface), 900 SF of utility patching and moderate raveling over the entire block.

APPENDIX D: SURFACE REPORT
IBRC FINAL REPORT 131

APPENDIX D: SURFACE REPORT
IBRC FINAL REPORT 132
Element: STREETS MEDIANS Committee priority 2.5
Costs: Current Annual Funding Level
Incremental Funding Level Average Annual Funding (need) 25 years
$145,000 $155,000 $300,000
Recommendation: Medians are raised concrete curbs located at the center of wide roadways to divide traffic and improve the streets’ appearance. The medians typically include concrete curbs, irrigation and landscaping. Although medians are not generally considered of high importance, some of these sites are located in business/downtown areas as well as gateway areas where attractive landscaping might attract more people to the area and possibly bring in revenue for the City. The incremental funding level of $155,000 is the estimated amount required to improve the major medians in the City including gateway and business/downtown areas. Additionally it would be prudent to transition to more efficient and sustainable, yet attractive, landscaped medians. Examples include native grasses that require little to no pruning and irrigation or decorative hardscape that would require no irrigation, pruning, and very minimal ongoing maintenance. Project Narrative: The City maintains medians comprising 39 acres. By agreement with Santa Clara County and Caltrans, the City maintains medians along Oregon Expressway, Page Mill Road and El Camino Real. There are median improvement plans for the next 25 years totaling $7.5M which include landscaping and irrigation improvements at University and California Avenue business districts, El Camino Real, Oregon Expressway and Alma Street to maintain gateways and create points of interest. The $10M to complete the Charleston/Arastradero Corridor Project is considered a New & Replacement Facility and thus is not accounted for here.
Element: SIDEWALKS Committee priority 1
Cost: Current Annual Funding Level
Incremental Funding Level Average Annual Funding (need) 25 years
$725,000 $287,000 $1,012,000
Recommendation: The Committee recommends an increase in capital sidewalk repairs to remain at a 30 year cycle to reduce tripping hazards and achieve Americans with Disabilities Act (ADA) standards. Funding levels have varied over the past 25 years. The incremental funding level of $287,000 is the estimated amount required in addition to the current annual funding to remain at a 30 year cycle level.
Project Narrative: The City maintains 283 miles of sidewalks (measured on both sides of a street) which are divided into 23 sidewalk districts. The current cycle of contract

APPENDIX D: SURFACE REPORT
IBRC FINAL REPORT 133
repairs began in 1986. On average, 30% of the sidewalk is replaced in each district over the course of a 30-year cycle. The time it takes to repair an entire district ranges from 1 year to as long as 3 years. The City uses a metric that requires sidewalk repair when the differential offset reaches ¾ inch in height. In addition to the contract work, in-house City crews repair or replace damaged sidewalks on a case by case basis after a complaint is logged. Curbs and gutters are repaired during contract work when the damage is integral with damaged sidewalk.
Element: PARKS, OPEN SPACE, GOLF Committee priority 1.5
Costs: Current Annual Funding Level
Incremental Funding Level Average Annual Funding (need) 25 years
$1,760,000 $725,000 $2,485,000
Recommendation: The Committee recommends incremental funding of $725,000 for open space, parks and golf to improve functionality, safety and accessibility for the City’s park system. Examples include creating multi-use athletic fields, replacement of aging playground equipment, enhancing pathways to meet ADA standards. Additionally, it may be prudent to implement Bay friendly landscaping to reduce water and maintenance costs over time.
Open Space: The Committee recommends maintaining the existing open space amenities and infrastructure in a manner that meets habitat protection goals, public safety concerns, and recreational needs. The committee recommends investing in the maintenance of natural assets such as trees, vegetation, and levees in order to minimize public exposure to hazards such as fires and floods. Parks: The Committee recommends maintaining and enhancing existing park amenities and structures to sustain aesthetically pleasing neighborhood parks that create a strong sense of community and recreational opportunities for youth and adult well-being. Improvements result in improved accessibility, enhanced public gathering spaces, and clean, well-lit, and attractive landscaping.
Golf Course: The Committee recommends investing in the maintenance of natural assets such as trees on the course in order to minimize public exposure to hazards. Maintain and enhance the following features: cart paths, driving range, irrigation system, drainage system, putting/practicing facility, greens, bunkers and tees. These improvements create an aesthetically pleasing course with the goal of enhancing the customer’s experience which may result in increased revenue.
Project Narrative: The City maintains 32 neighborhood and regional parks comprising 190 acres. There are also 4,100 acres of open space. The golf course is 184 acres with 18,000 linear feet of cart paths. There are park improvement plans for the next 25 years totaling $62M.

APPENDIX D: SURFACE REPORT
IBRC FINAL REPORT 134
The Byxbee Park Phase II improvements (cost of $3.6M) and the additional work at El Camino Park (cost of $1.4M) are considered New & Replacement projects and thus are not accounted for here.
Element: TREES Committee priority 1.75
Costs: Current Annual Funding Level in Operating Budget
Incremental Funding Level Average Annual Funding (need) 25 years
$600,000 $325,000 $925,000
Recommendation: The City is currently able to trim trees on a 10 year cycle. Given the completion of the TreeKeeper database and the information gathered from visits with adjacent cities, the Committee recommends that funding be increased to change from a 10 year cycle to the industry recommended 6 year cycle. Project Narrative: The City contracts with tree crews to maintain approximately 37,000 trees. Tree maintenance is more than trimming as it includes monitoring tree condition, removal of City-owned trees and replanting trees with the proper species. The incremental funding level of $325,000 is the estimated amount required in addition to the existing annual contract funding level to reach a 6 year cycle trimming goal. Therefore, the average annual funding need over 25 years is $925,000. Please note, tree trimming around power lines is paid for by the Utilities Department.
Element: TRANSPORTATION INFRASTRUCTURE and BIKE PATHS The purpose of the transportation infrastructure and bike paths is to improve safety, reduce traffic, save money by updating our technology and materials used to extend the life of the infrastructure and, in some instances, to comply with new state and federal regulations.
TRAILS Committee Priority 2
Costs: Current Annual Funding Level effective 2013
Incremental Funding Level Average Annual Funding (need) 25 years
$100,000 None $100,000
Recommendation: The Committee recommends that planned maintenance for the off-road trail network be increased as noted in the capital project “Off-Road Pathway Resurfacing and Repair” funded at $100,000 per year, This funding will become effective FY 2013 as identified in the City’s Adopted Capital Budget 2012, page 115. Starting in 2013, the City will be establishing a preventive maintenance program for off-road pathways to seal the pavement every 10 years and resurface the asphalt every 25 years.

APPENDIX D: SURFACE REPORT
IBRC FINAL REPORT 135
Project Narrative: Palo Alto’s 35 year old off-road trail network has not had a preventive maintenance program identified and has been repaired and patched on an as-needed basis. TRAFFIC SIGNALS Committee Priority 1
Costs: Current Annual Funding Level
Incremental Funding Level Average Annual Funding (need) 25 years
$210,000 $140,000 $350,000
Recommendation: The Committee recommends that the current program be continued. In addition, controller and system software should be replaced at all 99 intersections across the city over a 10 year cycle. In order to achieve this objective, funding for traffic signals will need to increase $140,000 a year above current funding levels.
TRANSPORTATION IMPROVEMENTS Committee Priority 2.75
Costs: Current Annual Funding Level
Incremental Funding Level Average Annual Funding (need) 25 years
$380,000 $20,000 $400,000
Recommendation: The Committee recommends an increase in capital transportation improvements which includes Safe Routes to School and various traffic calming measures (neighborhood entry barriers, traffic circles, enhanced crosswalks and advisory signs). Funding levels have varied over the years. The incremental funding level of $20,000 is the estimated amount required in addition to the annual funding level to maintain the new and existing facilities. The low priority assigned by the Committee reflects a lack of support for traffic calming. These estimates do not account for possible revenue sources including gas tax funds and miscellaneous grants. Element: STREET LIGHTS Committee Priority 1.25
Costs: Current Annual Funding Level
Incremental Funding Level Average Annual Funding (need) 25 years
$140,000 TBD TBD
Recommendation: The Committee recommends a study to evaluate the condition of the lighting system to determine the incremental funding needed to maintain this system. The current funding supports the replacement of accidentally damaged poles and minor routine maintenance. This funding level cannot support full area-wide replacement of

APPENDIX D: SURFACE REPORT
IBRC FINAL REPORT 136
poles, lamps, conduits and conductors. With respect to the TBD (to be determined), the incremental funding level and the average annual funding level for 25 years will be a mixture of funding sources (e.g. gas tax, enterprise funds, etc.) to be determined. Project Narrative: The street lights located in parking lots, along medians and on city streets are maintained by the City. The Utilities Department supplies power to the street light system, which is comprised of the street lights, poles and conduit infrastructure. This system is aging and is reaching the end of its useful life in the California Avenue Business District and other areas throughout the City.
Element: DAMS/BRIDGES Committee Priority 1
Costs: Current Annual Funding Level
Incremental Funding Level Average Annual Funding (need) 25 years
$10,000 TBD TBD
Recommendation: The Committee recommends the bridges that do not get structurally evaluated by Caltrans and/or the Joint Powers Board (JPB) be structurally assessed at regular intervals at least once every 10 years at an estimated cost of $100,000 per city-wide assessment. Plans should be developed and included in the 5 year capital cycle to implement the recommendations from these structural assessments.
The Committee recommends an inspection at regular intervals be performed at the Pearson Arastradero Preserve Dam similar to the annual inspection that is currently undertaken at the Foothills Park Dam. Project Narrative: There are over 90 bridges in Palo Alto. 13 are maintained by Caltrans, 4 are maintained by JPB, 3 are maintained by Santa Clara County and 11 bridges are collaboratively maintained with adjacent cities, the remaining 63 bridges are solely maintained by the City of Palo Alto. Of the 74 bridges maintained by the City of Palo Alto and adjacent cities, Caltrans evaluates the structural conditions of 28 of those bridges routinely and provides reports to the City of Palo Alto. The remaining 46 bridges are evaluated as needed.
There are two earthen dams; one at Pearson Arastradero Preserve and the second at Foothills Park. The State Division of Safety of Dams inspects Foothills Park Dam annually because of its size and height. Arastradero Dam is not inspected by the State because it is smaller than the limits for State jurisdiction. The City provides periodic maintenance on both earthen dams.
Element: PARKING LOTS Committee Priority 2
Costs: Deferred Maintenance
Current Annual Funding Level
Incremental Funding Level
Average Annual Funding (need) 25 years
$3.2M $140,000 $375,000 $515,000

APPENDIX D: SURFACE REPORT
IBRC FINAL REPORT 137
Recommendation: The Committee recommends addressing the deferred maintenance immediately. This includes preventive maintenance and asphalt resurfacing of parking lots in need of repair within the Assessments Districts and City facilities. The Committee also recommends a preventive maintenance program to seal parking lots every 7 to 10 years and asphalt resurfacing every 25 years be established to improve drainage and pavement conditions. These require an incremental annual cost of $375,000 over 25 years. Emphasis is placed upon preventing water seepage through the pavement surface, which preserves the integrity of the underlayment and avoids more serious pavement deterioration. Project Narrative: There are 70 city-owned parking lots totaling 2.9 million square feet. The University and California Avenue business district parking lots and City facility parking lots are repaired by City paving crews when potholes develop. The larger improvement projects, including drainage, large pavement repairs, and ADA improvements, are bid out to contractors.
Element: FLOOD CONTROL Committee Priority 1.5
Costs: Current Annual Funding Level
Incremental Funding Level Average Annual Funding (need) 25 years
N/A TBD TBD
Recommendation: The City of Palo Alto does not have primary responsibility for flood control. The City should look to the Santa Clara Valley Water District and the US Army Corps of Engineers to provide the majority of the resources needed to fund infrastructure improvements to address current and future flood risks. In addition, it is likely that local voters and/or property owners will be asked to approve a new assessment district coordinated by the San Francisquito Creek Joint Powers Authority (JPA) and/or a special tax proposed by the Santa Clara Valley Water District to provide supplemental local matching funds for flood control infrastructure improvements.
Project Narrative: There are two main flood risks to Palo Alto - flooding from San Francisquito Creek and tidal flooding from San Francisco Bay - which affect approximately 4,800 properties in the City. The JPA, which has authority over San Francisquito Creek, is a government agency formed in 1999 by the cities of Palo Alto, Menlo Park and East Palo Alto, the Santa Clara Valley Water District and the San Mateo County Flood Control District. The JPA, in partnership with the US Army Corps of Engineers, is developing a comprehensive flood control plan for San Francisquito Creek with a total cost of approximately $100 million, with 65% possibly coming from federal funding. This would leave approximately $35 million to be funded by the five JPA member agencies or a new voter-approved assessment district or special tax. Much of eastern Palo Alto is below the daily high tide elevation, but is protected from flooding by a network of Baylands levees. Due to numerous deficiencies, these levees have not been certified by FEMA as providing protection against flooding during a 1%

APPENDIX D: SURFACE REPORT
IBRC FINAL REPORT 138
(100-year) high tide. Tidal flood risk for Palo Alto is currently being studied by the US Army Corps of Engineers (Corps) and the JPA. While the exact price is still unknown, preliminary estimates for the cost to implement the Palo Alto portion of a regional tidal flood control project are in the range of $50 million. Depending on the findings of the ongoing Corps’ studies, the Corps might cover up to 65% of the cost for raising and strengthening the levees. Additional funding sources for a tidal flood control project have not yet been identified.
RESOURCES LIST “Update on General Fund Infrastructure Backlog,” City of Palo Alto ppt n.d. “Palo Alto Bicycle Transportation Plan,” Wilbur Smith Associates, 2003 “City of Palo Alto Comprehensive Plan and Amendment,” ppt, March 24, 2011 “Infrastructure Priorities for a City Beautiful,” City and County of Denver, 2007 “Infrastructure Report Card for Palo Alto,” PA City Auditor, March 4, 2008 “Long Range Financial Forecast 2011-2021,” PA City Manager, ID#1446, March 14, 2011 “Five-year Capital Improvement Plan FY 2012-2016,” City of Menlo Park “Open Space, Parks, and Golf Projects,” ppt, March 10, 2011 “A Report to Our Citizens: annual report of City Auditor re Services and Accomplishments,”
FY 2010 “Review of Other Cities’ Sidewalk Replacement Programs,” May 20, 2010 “Flooding issues in the City of Palo Alto,” ppt, March 24, 2011 “Audit of Street Maintenance,” PA City Auditor, March 2006 “Transportation Elements,” ppt, April 14, 2011 “Utilities Strategic Plan 2011,” PA Finance Committee, ID 1351, March 1, 2011 “Proposed Capital Budget Fiscal Year 2012,” City of Palo Alto “Proposed Operating Budget Fiscal Year 2012,” City of Palo Alto “Adopted Capital Budget Fiscal Year 2011,” City of Palo Alto “Infrastructure Blue Ribbon Commission (see Committee) Briefing Materials,” October 2010 “Standard Drawings and Specifications,” City of Palo Alto Department of Public Works, 2007 Meeting with Redwood City Public Works staff, May 2, 2011 Meeting with Mountain View Public Works staff, May 4, 2011 Meeting with Menlo Park Public Works staff, May 11, 2011 Citywide field trip on May 17, 2011 Operational Analysis of City of Palo Alto Municipal Golf Course, prepared by EPA,
November 2008 “The Pothole Report: Can the Bay Area Have Better Roads?” Metropolitan Transportation
Commission, June 2011

IBRC FINAL REPORT 139
Appendix E -‐ MSC Area Usage by Department
MSC Site Total Area 699,100 ft2
Area Usage
Public Works Department facilities and fleet: 91,400 ft2 Community Services Department – Parks: 22,600 ft2 Public Works Department Operations: 46,200 ft2 Administrative Services Department Stores: 53,200 ft2 Utilities: 209,800 ft2 Police Department/Animal Shelter: 43,500 ft2
Total: 466,700 ft2
All Departments
Employee parking: 63,500 ft2
Bunkers and fuel: 49,800 ft2
Aisles/Site Related: 119,100 ft2
Total: 232,400 ft2

IBRC FINAL REPORT 140
Appendix F -‐ Sea Level Rise Projection
This modified photo shows the projected 55-inch sea level rise by the end of century, specifically for the west shore of San Francisco Bay, that would impact Palo Alto as far west as Ross Road.
Source: Knowles, N. 2008; Siegel, S.W. and P. A. M. Bachand, 2002; in San Francisco Bay Conservation and Development Commission, San Francisco Bay Scenarios for Sea Level Rise, 2007. Sea level rise data provided by USGS.

IBRC FINAL REPORT 141
APPENDIX G -‐ Freeway-‐Visible Auto Dealerships Elevation drawings for potential freeway-visible auto dealership on East Embarcadero Road.
Source: Anderson Honda.
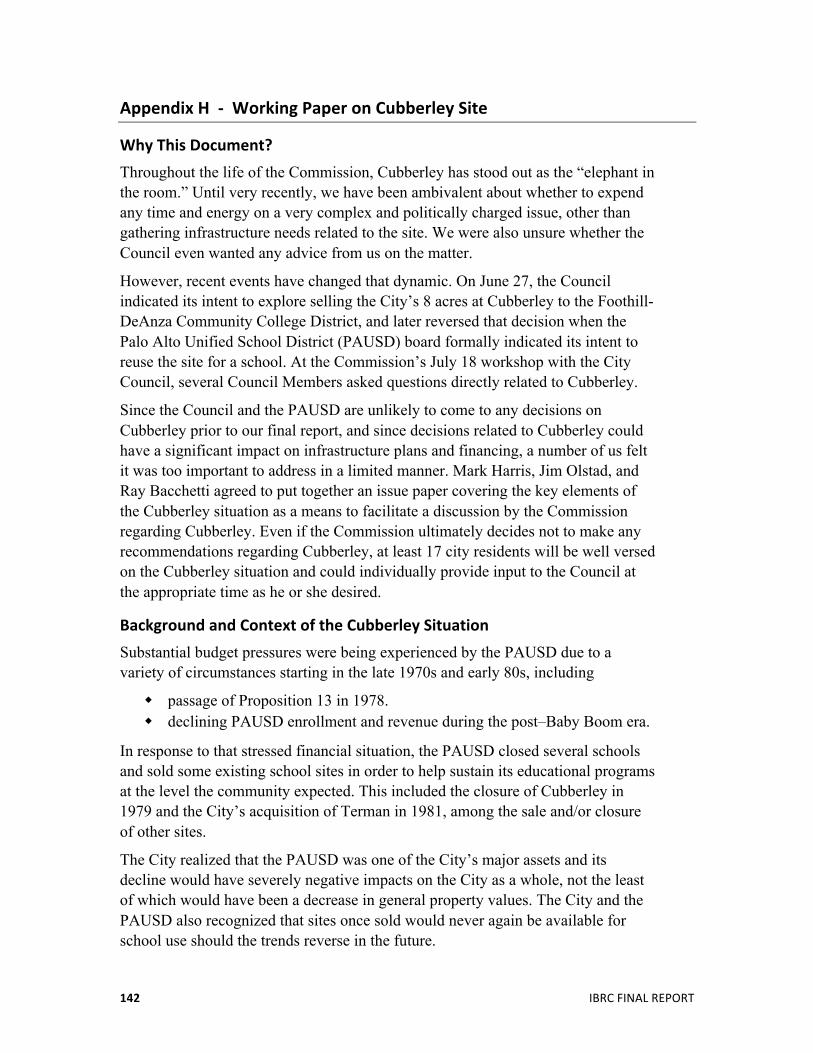
IBRC FINAL REPORT 142
Appendix H -‐ Working Paper on Cubberley Site
Why This Document? Throughout the life of the Commission, Cubberley has stood out as the “elephant in the room.” Until very recently, we have been ambivalent about whether to expend any time and energy on a very complex and politically charged issue, other than gathering infrastructure needs related to the site. We were also unsure whether the Council even wanted any advice from us on the matter.
However, recent events have changed that dynamic. On June 27, the Council indicated its intent to explore selling the City’s 8 acres at Cubberley to the Foothill-DeAnza Community College District, and later reversed that decision when the Palo Alto Unified School District (PAUSD) board formally indicated its intent to reuse the site for a school. At the Commission’s July 18 workshop with the City Council, several Council Members asked questions directly related to Cubberley.
Since the Council and the PAUSD are unlikely to come to any decisions on Cubberley prior to our final report, and since decisions related to Cubberley could have a significant impact on infrastructure plans and financing, a number of us felt it was too important to address in a limited manner. Mark Harris, Jim Olstad, and Ray Bacchetti agreed to put together an issue paper covering the key elements of the Cubberley situation as a means to facilitate a discussion by the Commission regarding Cubberley. Even if the Commission ultimately decides not to make any recommendations regarding Cubberley, at least 17 city residents will be well versed on the Cubberley situation and could individually provide input to the Council at the appropriate time as he or she desired.
Background and Context of the Cubberley Situation Substantial budget pressures were being experienced by the PAUSD due to a variety of circumstances starting in the late 1970s and early 80s, including
passage of Proposition 13 in 1978. declining PAUSD enrollment and revenue during the post–Baby Boom era.
In response to that stressed financial situation, the PAUSD closed several schools and sold some existing school sites in order to help sustain its educational programs at the level the community expected. This included the closure of Cubberley in 1979 and the City’s acquisition of Terman in 1981, among the sale and/or closure of other sites.
The City realized that the PAUSD was one of the City’s major assets and its decline would have severely negative impacts on the City as a whole, not the least of which would have been a decrease in general property values. The City and the PAUSD also recognized that sites once sold would never again be available for school use should the trends reverse in the future.

APPENDIX H: CUBBERLEY
IBRC FINAL REPORT 143
In 1987, the City put Measure B on the ballot with the intent to create a 5 percent utility users tax (UUT) that would be used primarily to fund lease payments by the City to the PAUSD for unused school sites (Cubberley being the premier site) of about $4.0 million annually, with $2.7 million applicable to Cubberley. In 1989, the City and PAUSD entered into what is known as the Lease and Covenant Not to Develop Agreement (Cubberley Lease), which covers a variety of complex clauses including lease arrangements at Cubberley and other sites.
At the time the original lease negotiations were taking place, the City was in a relatively good position in terms of financial capacity as compared to the PAUSD’s circumstances. The Lease and Covenant Not to Develop arrangement had the benefit of providing a major injection of operating budget money to the school district, while providing corollary benefits to the City such as preserving open space and playing fields, providing childcare sites and protection from liability for new infrastructure requirements (how ironic!) had these sites then been sold and developed.
Flash forward nearly 25 years and the respective financial situations and site needs have changed dramatically.
Here are a few of the key developments that make the situation very different today:
The PAUSD is now a Basic Aid District, which essentially means that local property tax revenue far exceeds the amount of revenue the State is required to provide the district in excess of “basic aid” – a very small amount per student. Although property tax revenue has been somewhat affected by the recent financial crisis, PAUSD has not seen the reductions that many other California school districts have encountered and is likely poised to see property tax increases in excess of inflation for the foreseeable future. Property taxes are budgeted to provide about 73 percent of the PAUSD’s general fund revenue in 2011–12, or about $114 million out of a $159 million budget. The remainder is accounted for as follows: Federal funds: 3 percent Local income: 5 percent Lease revenue: 6 percent Parcel tax: 7 percent State income: 6 percent
The district has received approval from the voters for more than $500 million (Measure B in 1995 and Measure A in 2008) and a $600 parcel tax (Measure A in 2010) generating about $11–12 million annually, or about 7 percent of its annual operating budget. In addition, parents provide gifts in excess of $2 million annually through the foundation Palo Alto Partners in Education (PiE).

APPENDIX H: CUBBERLEY
IBRC FINAL REPORT 144
Enrollment has recovered dramatically since its low in about 1990, to the point that the district is now reopening sites: most recently, Garland is slated to reopen in several years, and the Board recently expressed an intent to reuse the Cubberley site in the near future for a secondary school (which halted the Council’s efforts to negotiate an offer to sell the City-owned 8 acres at Cubberley to Foothill-DeAnza College).
Thus, the current respective financial and enrollment conditions related to the Cubberley Lease are substantially different than they were 22 years ago when the City and the PAUSD entered into it. Financially, the City has been grappling annually with the issue of balancing the General Fund operating budget as well as meeting the ongoing capital assets/infrastructure needs of the community (pressures which were the impetus for the formation of our Commission).
The City’s current option on the Cubberley Lease expires by its stated terms at the end of 2014, and the City must notify the PAUSD by December 31, 2013, if it intends to renew the lease for another five years.
Now is the time for the Commission to provide input regarding the lease agreement as it relates to infrastructure.
Key Elements of the Cubberley Lease as They Relate to Infrastructure and Infrastructure Financing Cubberley Lease Payment. In the current 2011–12 operating budget, the City is obligated to pay $4.60 million in lease payments for Cubberley (section 2.1 of the lease). Those payments are escalated each year at an agreed upon inflation factor currently estimated at 3 percent. This payment covers the 27 acres leased from the district, not the 8 acres the City now owns as a renegotiated consequence of the swap for the Terman site approved in 2002.
Childcare Sites. The Lease Agreement also includes City payments to the PAUSD for onsite childcare at 12 elementary school sites. In 2011–12, the City will pay $0.675 million for the combined 12 sites including utilities costs. The City contracts with Palo Alto Community Childcare (PACC), a nonprofit provider independent from the City, to operate the 12 sites. PACC pays the City approximately $100,000 in rental payments and utilities reimbursement. The childcare lease also runs concurrent with the lease term and will end if the lease is not extended by mutual consent of the City and the PAUSD in 2014. Without any information to the contrary, we assume that this arrangement will be renewed even if the current Lease Agreement is not. If this were not the case, the City would have an additional net slightly in excess of $0.5 million dollars annually to use for other purposes.
Covenant Not to Develop. An additional $1.78 million expense is budgeted for 2011–12 with a similar 3 percent inflation factor for succeeding years. In reading

APPENDIX H: CUBBERLEY
IBRC FINAL REPORT 145
the Cubberley Lease agreement, it is a section (2.2) that is separate from the Cubberley payments but clearly under the grand lease arrangement. The sites included in the original covenant are Ohlone, Jordan, Jane Lathrop Stanford, Garland, and Greendell. The Lease agreement allows for sites to reopen without reducing the covenant payment as long as new elementary schools are substituted, which has happened over the lease term as PAUSD reopened schools due to increased enrollment. Section 4.1 indicates that the purpose of the covenant is “to prevent further burden on the City’s infrastructure and in order to preserve a substantial amount of the City’s remaining open space.” If the lease is not renewed, the covenant payments expire as well.
This clause now appears to be obsolete given the district’s recently expressed intent to reopen existing sites. Further, there is no current plan for any sites to be sold for development, and the district has just recently purchased additional property at 525 San Antonio Road. Ironically, the $1.78 million annual covenant payment (from the City to the PAUSD) directly or indirectly puts a burden on the City’s infrastructure budgeting because these funds are not available to support infrastructure needs including Cubberley maintenance.
These “reversed financial circumstances” clearly need to be addressed during the Cubberley Lease option considerations/negotiations process.
Key Elements Regarding Cubberley Not Embedded in the Lease
City Ownership of 8 Acres. Through a separate but related agreement, in 2002 the City obtained title ownership of 8 acres of the Cubberley site in a swap exchange for the Terman site, which the City had previously acquired through a lease/purchase arrangement it created in 1981. These 8 acres were the focus of recent Council actions related to Foothill-DeAnza’s offer to purchase the site.
Although the City has the right to develop the 8 acres, as it deems appropriate, until September 1, 2022, the school district has the right-of-first-refusal on the sale by the City of these 8 acres to another party. After that the City has an unencumbered right to sell the 8 acres, if it decides to do so. Of course, the City and the district can renegotiate a sale back to the district at any time.
Given recent actions by both governing bodies, it is unclear as to what the next-or-ultimate disposition of the property will be. The City could retain it and develop it for its own purposes, or sell it at market value estimated at between $15 and $28 million. The recent purchase of the 2.6 acres at 525 San Antonio by the school district for $8.5 million would indicate a current market value of approximately $26 million.

APPENDIX H: CUBBERLEY
IBRC FINAL REPORT 146
Revenues and Expenses at Cubberley Outside the Lease Obligations. Current revenue at Cubberley is $2.54 million annually composed of the following elements:
Foothill-DeAnza lease $0.93 million Property rental (artists, nonprofits, etc) 0.52 Hourly rental (events, use of theater, etc.) 1.02 City office rental 0.07
Annual expenses total $2.21 million including routine annual maintenance costs of about $330,000. Thus, the Cubberley complex is showing a net positive cash flow of about $300,000 (excluding the lease-and-covenant payments expense).
Tenants at Cubberley are being heavily subsidized in their rental payments. When considering the annual lease payments, the City is paying the school district approximately $4 per square foot for the building space it leases. However, it is generating less than $1 per square foot in rental income.
Planned CIP and Deferred Maintenance. As discovered through our Commission’s infrastructure investigations, this maintenance liability – not included in the above figures – cumulatively totals about $18.8 million through 2036, with $10.2 million scheduled between now and 2016. Public works indicates that optimal maintenance expenditures should be about $800,000 versus the $330,000 currently expended. This projected aggregate maintenance liability has several implications.
First, the revenue and expense statement as typically presented to the Council – most recently in the slide presentation at the June 27, 2011, meeting – is incomplete in that it does not include these ongoing maintenance expenses. These real maintenance costs should be acknowledged and represented in future reports. Secondly, the City should neither continue nor consider expending this level of maintenance money into the facility until the long-term use or disposition of Cubberley is resolved. The City should spend only what is needed to keep the facilities operational and safe.
Conclusions
The conditions that created the original need for the Cubberley Lease agreement have changed dramatically and are no longer in play today. With our City struggling to meet the financial requirements of the General Fund, let alone catching-up and keeping-up with the maintenance of the City’s overall infrastructure demands, now is the appropriate time for the school district to re-establish its management and financial responsibilities of and for the Cubberley site.
The Cubberley Lease agreement, with its associated amendments, has accomplished what it set out to achieve more than 20 years ago. It has preserved valuable public space and kept it maintained and available for public use and

APPENDIX H: CUBBERLEY
IBRC FINAL REPORT 147
enjoyment. In addition, it has provided the PAUSD with more than $125 million in operating cash to date, and will provide approximately $150 million in total cash infusion by the end of the current lease arrangement in 2014, if it is not terminated or amended prior to this date. Finally, it has preserved these sites for the district for its future use as and when necessary (which is apparently the case now).
As we indicated earlier, the PAUSD’s financial situation has improved dramatically over the past 20 years: with the passage of major bond issues for reconstruction and improvements to school facilities, generous community support through contributions to Palo Alto PiE, passage of a sizable parcel tax, and the attainment/surpassing of Basic Aid status. The district is in a strong financial position to finance its operations without all of the subsidies provided by the City through the Cubberley Lease Agreement.
The residents and businesses, through the City government, have contributed significantly to the restoration and financial strength of the district. With strong reserve balances and more than three years of payments left on the current lease option, the district should have sufficient time and financial resources to plan for a smooth transition to clear ownership.
Recommendations
The City should, at a minimum, decline to renew the Cubberley and non-development portions of the Lease and Covenant Not to Develop agreement in order to free $6.1 million (net of rental revenue) annually (in current dollars) and avoid a substantial portion of the upkeep expenditures of $18.8 million (in current dollars) through 2036. Indeed, it would be mutually beneficial for the City and the school district to begin discussions now on any potential new lease agreements related to childcare facilities or other noneducational uses, the transition of the 27 acres back to school district management, and clarification on the final disposition of the City’s 8 acres.
The $6.1 million operating expense savings represents potential annual cash availability to the City that could be reassigned to several infrastructure problem-solving applications. Example 1: If these funds were committed to a new issue of certificates of participation, it could finance a 30-year, $100 million debt obligation, sufficient to finance a new Public Safety Building and replace two fire houses. Example 2: If the funds were used to rebuild an Infrastructure Reserve, it could enable forward funding of new or renovated City assets, accommodating unexpected infrastructure costs without disturbing the ability of the City to keep up routine infrastructure maintenance needs, enable the raising of existing infrastructure quality (e.g., condition of streets, parks, and sidewalks), or any number of other real property redevelopment initiatives (including repurposing other existing infrastructure assets).
Regarding the 8 acres of Cubberley that the City owns, it is important to evaluate the best use of the parcel in relation to the future needs of the community. Historically,

APPENDIX H: CUBBERLEY
IBRC FINAL REPORT 148
there has been a secondary school campus on these 8 acres and the adjoining 27 acres owned by the school district. This may not be the same use going forward. Indeed, the school district should have considerable flexibility in the design of a middle school and/or high school campus on its 27 acres, together with the school district’s adjacent property at the former Greendell school site and the property recently purchased at 525 San Antonio.
Therefore, we encourage the City to evaluate potential alternatives for the highest and best use of its 8 acres on Middlefield Road, including the possibility of developing a variety of “community center” resources that could provide services to residents. In the event this process does not result in an approved plan for new City infrastructure on its 8 acres, then it may be preferable for the City to pursue sale of the land, either to the school district or to another purchaser. The City is presently bound by the school district’s right-of-first-refusal until September 1, 2022. In any event, the City should request a clear indication from the school district concerning its interest in the 8 acres.
Until the final disposition of the Cubberley site is determined, the City should spend only the minimum amount of funds necessary to keep the site safe and operational for the tenants occupying it. Major expenditures in facilities upgrades will be wasted if a major portion of the site is later razed to construct a new educational facility at Cubberley.
Respectfully submitted, Mark Harris Ray Bacchetti Jim Olstad November 30, 2011
References 1. Lease and Covenant Not to Develop Between the City of Palo Alto and Palo Alto Unified
School District dated September 1, 1989 2. Amendment #1 to the Lease and Covenant Not to Develop dated July 21, 1999 3. Amendment #2 to the Lease and Covenant Not to Develop dated August 13, 2002 4. Background on the Utility Users Tax prepared by Lanie Wheeler dated May 2010 5. City Manager’s Report #1866 (Direction on the Submission of Letter of Interest to Foothill
College Regarding new Educational Center at Cubberley Community Center) and associated Power Point Presentation prepared by Deputy City Manager Steve Emslie for the Council Meeting of June 27, 2011
6. Various conversations and e-mail correspondence with City senior staff members Steve Emslie, Lalo Perez, Phil Bobel, and Joe Saccio regarding the Lease and Covenant Not to Develop from July through October 2011
7. Accuracy of the working paper information verified by City senior staff members Steve Emslie, Lalo Perez, and Phil Bobel

IBRC FINAL REPORT 149
Appendix I -‐ Other Long-‐Term Funding Alternatives
In addition to the alternatives for long-term funding explored in section 5, the Commission reviewed a number of other alternatives. We found the following other options to be interesting but either not appropriate for Palo Alto’s main funding needs or beyond the scope of the Commission to develop.
Public-‐Private Partnerships
Fee-income financing. In the public-private partnerships commonly used for infrastructure, private-sector financing is provided and repaid with fee income. Examples are toll roads and, in some regions, private airport ownership. These are legitimate options where they are relevant, but IBRC does not consider fee-based financing to be appropriate for public safety and municipal services facilities.
“Friends” financing. Many communities, including Palo Alto, fund some infrastructure improvements with a combination of City (public) funding and funding raised by “friends” – people in the community who want to make a gift to support these facilities. In Palo Alto, donations from Community members have financed construction or improvements at Lucie Stern Community Center, the Junior Museum, the Arts Center, Lytton Plaza, the libraries, and various athletic and recreation facilities. Although some projects in the catch-up or future new & replacement categories could attract friends co-funding, the Commission did not find reasonable evidence to include friends funding as part of our recommendations.
Corporate donations. Another kind of public-private partnership is at work when an individual or business donates funds for a public facility. This kind of funding, however, is not traditionally offered for such things as the public safety improvements or municipal services complex that will be the main focus of City infrastructure activity over the next several years.
Redevelopment Agencies
Some cities are able to fund infrastructure improvements through their redevelopment agencies. Palo Alto does not have a redevelopment agency, though, and recent state legislation greatly restricts future redevelopment agency activities.
Asset Sales and Leases
The Commission anticipates that there will be options for revenue generating activities in both the Public Safety Building improvement and the Municipal Services Center projects. For example, if a new Public Safety Building is developed at an alternative site as the Commission recommends, the existing facility and land is freed for other uses. Additionally, the Commission’s analysis

APPENDIX H: CUBBERLEY
IBRC FINAL REPORT 150
of a new MSC/ASC complex provides examples of combining infrastructure improvements with the sale or lease of publicly owned space
Although in neither case are the plans far enough along for the Commission to make specific recommendations, IBRC does recommend that the City include sale or lease considerations as final plans are developed for these facilities and those they replace.

IBRC FINAL REPORT 151
Appendix J -‐ Comparison of Tax Rates and Recent Election Results
This appendix provides (1) a comparison of selected tax rates in Palo Alto, statewide, and in neighboring communities, and (2) a review of selected bond and tax votes in recent elections, statewide and in neighboring communities, with an emphasis on non-school bond votes.
Comparison of Tax Rates The Finance Working Group reviewed data on the California City Finance website www.californiacityfinance.com and presented findings at a Commission meeting April 28, 2011. Excerpts from the PowerPoint (some updated) are included below.
Transient Occupancy Taxes A review of transient occupancy taxes (hotel taxes) found the data shown below. Note that that 14 cities had tax rates of 13 percent or higher. Palo Alto, at 12 percent, is one of 50 cities in the 12 to 13 percent range.
In San Mateo and Santa Clara counties, the top rate is 12 percent, which occurs in Brisbane, Burlingame, Campbell, Cupertino (raised in November 2011), East Palo Alto, Half Moon Bay, Millbrae, Pacifica, Palo Alto, Redwood City (raised in November 2011), San Bruno, and San Mateo.
The rate is 10 percent in Belmont, Daly City, Los Altos, Menlo Park, Morgan Hill, Mountain View, San Carlos, San Jose, Saratoga, and South San Francisco. Other cities have lower rates.
Each 2 percent increase in the Transient Occupancy Tax rate raises approximately $1 million. The tax is paid predominantly by nonresidents.
Transient Occupancy Taxes Anaheim 15% 6 cities 14% 7 cities 13-‐14% 50 cities 12-‐13% 9 cities 11-‐12% 221 cities 10-‐11% 135 cities < 10% 51 cities no tax
Transient Occupancy Tax Rates in Nearby Cities
Palo Alto 12% Menlo Park 10% Mountain View 10% Redwood City 12% Sunnyvale 9.5%
Property Transfer Taxes Palo Alto has a documentary (property) transfer tax of $3.30 per $1,000 of assessed value and a $1.10 county rate for a total rate of $4.40. Eleven cities have a higher rate and four, including Mountain View and San Jose, have the same rate. Most cities do not have their own property transfer tax and therefore charge only the county rate of $1.10.

APENDIX J: FINANCE
IBRC FINAL REPORT 152
Each $0.83 increase per $1,000 value in the Transfer Tax rate raises approximately $1 million. The tax is paid approximately 70 percent from residential property sales and 30 percent from business property sales.
Property Transfer Taxes as Percent of Assessed Value (includes city and county rates)
11 cities 0.5-‐1.5% 5 cities 0.3-‐0.5% 7 cities 0.2-‐0.3% 36 cities 0.1-‐0.2% 394 cities 0.0-‐0.1% 28 cities no tax
Property Transfer Taxes in Nearby Cities
Mountain View 0.44% (0.33% to city) Palo Alto 0.44% (0.33% to city) Sunnyvale 0.11% (0.055% to city) Menlo Park 0.11% (0.055% to city) Redwood City 0.11% (0.055% to city)
Utility Users Tax on Electricity and Gas Palo Alto has a rate of 5 percent. Sixty cities have rates of 6 percent or higher, including Pacifica (6.5 percent). All other San Mateo or Santa Clara County cities have no rate or a lower rate than Palo Alto except Daly City, East Palo Alto, Redwood City, and San Jose, all of which also have a 5 percent utility users rate.
Each 0.5 percent increase in the Utility Users Tax rate raises approximately $1 million. The tax is paid approximately 60 percent by business customers and 40 percent by residential customers.
Utility Tax on Electricity and Gas
10 cities 10-‐11% 6 cities 8-‐10% 20 cities 7-‐8% 24 cities 6-‐7% 41 cities 5-‐6% 33 cities 3-‐5% 14 cities 1-‐3% 335 cities no tax
Utility Tax on Electricity and Gas in Nearby Cities
Palo Alto 5% Redwood City 5% Mountain View 3% Sunnyvale 2% Menlo Park 1%
Business License Tax Palo Alto currently has no business license tax. According to the California City Finance website, as of 2008–09, 30 cities did not have a business license tax while 441 cities did, including most cities in San Mateo and Santa Clara counties. The rates and revenues raised vary substantially from city to city.
In the November 2011 election voters in Redwood City adopted an increase in the city’s business license tax.

APPENDIX J: FINANCE
IBRC FINAL REPORT 153
Business License Tax in 2007–2008
36 cities no tax 440 cities with tax
Money Raised from Business License Tax in 2007-‐2008
Menlo Park $1.5 million Redwood City $1.4 million
Sunnyvale $1.1 million Mountain View $0.2 million
Recent Tax and Bond Votes
Recent Palo Alto Votes
5/10 PAUSD parcel tax raised from $96 to $589, passed 79% 11/09 Business License Tax, failed 43% 11/08 Library bond $76 million, passed 70% 6/08 PAUSD bond $378 million, passed 78% 11/07 Transient Occupancy Tax raised from 10 to 12%, passed 80%
A summary of tax and bond votes in neighboring communities since 2007 is shown below.
Non-‐School Votes in Nearby Cities
11/10 Half Moon Bay 1% sales tax increase, failed 47% Campbell, Pacifica Transient Occupancy Tax increase to 12%, passed Campbell Business License Tax passed San Mateo, Santa Clara $10 vehicle license fee passed 6/10 SCC library parcel tax $76, passed 77% San Jose card room tax, passed 76% 11/09 San Mateo 1/4 % sales tax increase, passed 61% San Carlos 1/2 % tax increase, failed 44% 6 Transient Occupancy Tax increases, passed Redwood City Business License Tax, failed 55% 6/09 Pacifica 1% sales tax increase, failed 38% 11/08 Campbell 1/4 % sales tax increase, passed 70% Santa Clara County 1/8 % sales tax increase, passed 67% Brisbane Business License Tax, passed 70% Santa Clara County hospital bond, passed 78% Gilroy library bond, passed 68% San Mateo County vehicle taxes (2) failed 11/07 South San Francisco Business License Tax, passed 73% South San Francisco library bond, passed 74%

APENDIX J: FINANCE
IBRC FINAL REPORT 154
In the November 2011 election, voters in Foster City, Cupertino, and Redwood City increased their transient occupancy taxes. Voters in Brisbane and Redwood City increased business license taxes.
Voters in San Francisco passed a $248 million General Obligation bond to fund street and road repair with a 68 percent majority. Voters there also defeated a 1/2 cent sales tax increase for police and fire services.
Voters in Pacifica and Burlingame adopted or increased school parcel taxes requiring more than a two-thirds majority. Millbrae and San Francisco passed school bonds, while San Bruno and the San Mateo Community College District had school bonds get more than a 50 percent vote but short of the 55 percent required for passage.
In November 2011 statewide elections, 18 of 22 city majority vote elections passed; 4 of 8 city (two-thirds needed) elections succeeded; 6 of 8 school bonds (55 percent needed) passed; 6 of 7 special district votes (two-thirds needed) passed; and 5 of 7 school parcel taxes (two-thirds needed) passed, for an overall passage rate of 75 percent.
In recent elections, a large majority of local tax issues requiring a majority vote have passed, and the same is true for school bonds. In most elections, more than half of the tax and bond votes requiring a two-thirds majority have been passed, except in the November 2010 elections, when more than half were defeated.
A complete listing of all recent elections is in the Local Tax Vote section of the California City Finance website.

IBRC FINAL REPORT 155
Appendix K -‐ List of City Structures and Their Age DATE FACILITIES CONSTRUCTED
DATE FACILITIES CONSTRUCTED
Cubberley Community Center A-Wing (Leased) 1955 B-Wing (Leased) 1955 C-Wing (Leased) 1955 D-Wing 1955 E-Wing 1955 F-Wing 1955 FH-Wing 1968 Boys and Girls Gym (Leased) 1968 H-Wing 1955 I-Wing 1968 J-Wing 1955 K-Wing 1955 L-Wing 1955 Multipurpose Wing (Leased) 1955 Music/Theater Wing (Leased) 1968 P-Wing 1968 Pavilion (Leased) 1968 S-Wing 1955 T-Wing 1955 U-Wing 1955 V-Wing 1968 Lucie Stern Lucie Stern Community Theater 1933 Children’s Theater 1934 Community Theater Scene Shop 1972 Lucie Stern Community Center 1933 Junior Museum 1941 Fire Stations Fire Station #1 (University Park) 1965 Fire Station #2 (Mayfield) 1965 Fire Station #3 (Rinconada) 1948 Fire Station #4 (Mitchell Park) 1953 Fire Station #5 (Arastradero) 1962 Fire Station #8 (Foothills) 1986 Libraries Children's Library 1940 College Terrace Library/Childcare 1935 Downtown Library 1971 Main Library 1958 Mitchell Park Library 1958 Municipal Services Center Building A 1966 Building B 1966 Building C 1966 MSC UCC/SCADA Building 1987 Animal Services Euthanasia Building 1986 Kitchen/Kennels/Storage 1972 Office/Clinic 1972 Civic Center 1970 Parking Garages Civic Ctr Office Building Public Parking 1970 Cambridge Parking Facility 1968 Parking Lot J (Cowper/Webster) 1984 Parking Lot Q 1984 Parking Lot R (High Street) 2004 Parking Lot S/L (Bryant Street) 2004 Ted Thompson Parking Garage 1994
Ventura Childcare Unit #1 Office 1957 Unit #2 1957 Unit #3 1957 Multipurpose Unit 1957 Palo Alto Art Center 1956 Mitchell Park Community Center 1967 Leased Buildings Gamble Garden Center 1900; 91 Senior Center 1927 Williams House 1907 Winter Lodge 1970s Boy Scouts Facility Roth Building 1932 Sea Scouts Building 1940s Buildings on Parks Arastradero Gateway Facility 2005 Baylands Athletic Center Grandstand 1969 Baylands Athletic Center Restroom 1969 Baylands Ranger Station unknown Baylands Interpretive Center 1969 Foothills Park Interpretive Center 1968 Foothills Park Shop/Maintenance 1968 Foothills Park Equipment & Storage 1975 Foothills Park Lake Restroom 1965 Foothills Park Oak Grove Restroom Foothills Park Orchard Glen Restroom 1965 Golf Course Maintenance Shop 1950 Golf Course Office/Emp. Facility/ Equip Facility 1950 Golf Course Pro Shop/Hofbrau 1986 Golf Course Storage 1950 El Camino Park Restroom 1940 Greer Park Restrooms 1983 Hoover Park Restroom Lawn Bowl Clubhouse 1983 Mitchell Park Clubhouse Restroom 1956 Mitchell Park Storage - Pool & Pool Filter Facility 1957 Mitchell Park Tennis Center Restroom 1956 Peers Park Clubhouse & Restroom 1940 Rinconada Park Restroom 1940 Rinconada Park Snack Bar/ Swim Club Facility 1958 Rinconada Pool Shower/Office/ Equip. Facility 1958 Stanford Playing Fields Snacks/ Restroom Building 2006 Seale Park Restroom

IBRC FINAL REPORT 156
Appendix L -‐ Learning from Other Progressive Cities
City 1: Portland, Oregon Portland has been referred to as one of the most environmentally friendly or “green” cities in the world.35 “In 2009, the Portland Sustainability Institute, in partnership with the City of Portland, launched EcoDistricts as part of the Portland region’s broadening commitment to sustainability. …An EcoDistrict is a neighborhood or district with a broad commitment to accelerate neighborhood-scale sustainability. EcoDistricts commit to achieving ambitious sustainability performance goals, guiding district investments and community action, and tracking the results over time.”36
An EcoDistrict roadmap taken from the website of the Portland Sustainability Institute is show below. The roadmap calls for building and infrastructure strategies that hold sustainability as a goal. It contains similarities with the City in terms of utilities management, focus on clean energy and focus on transportation. The engagement process also calls for community involvement, which is part of IBRC’s recommendation for helping the City analyze needs and manage the ongoing development of our infrastructure.
35 Kate Sheppard (July 19, 2007). “15 Green Cities” Environmental News and Commentary, http://www.grist.org/article/cities3 36 Portland Sustainability Institute (2011), EcoDistricts, http://www.pdxinstitute.org/index.php/ecodistricts

APPENDIX L: FUTURE/MODEL CITIES
IBRC FINAL REPORT 157
City 2: Shreveport, Louisiana
The City of Shreveport boasts a 1,629 page master plan that looks ahead to 2030. Shreveport’s plan is characterized by a forward-looking vision statement that sets the stage for future decisions well beyond the purview of the current administration. Excerpts from this plan follow:
GREATER SHREVEPORT’S VISION FOR THE 21ST CENTURY37
In 2030, greater Shreveport is the dynamic, creative and flourishing powerhouse of the ArkLaTex region. It combines the economic opportunity, diversity and cultural excitement of a growing city with the friendliness of a small town. Our neighborhoods – safe, clean and welcoming – are connected by shared civic spirit and by a network of inviting public spaces and transportation choices. Downtown and nearby neighborhoods in the city core are vibrantly alive with residents and businesses in historic and new buildings. A revitalized waterfront district links Cross Bayou and the city center to Shreveport’s origins on the banks of the Red River. Underutilized properties throughout the city have been restored to community use with housing, shops, offices, or parks and other public spaces. Downtown and our diverse neighborhoods offer attractive and affordable choices for young singles and couples, families with children, empty-nesters, and retirees.
Because of its culture of excellent education and access to lifelong learning from the cradle to the senior years, the Shreveport-Caddo area has the qualified workforce to support an expanding 21st century economy. Established and emerging industries – natural gas, manufacturing, education, biomedicine, cyber security, green building and energy, health care, tourism, film production, and digital media – rely on local talent, and entrepreneurial start-ups nurture new industries. As a transportation crossroads of rail lines and highways, including an extended I-49, and with a successful river port, we reach out to the nation and the world. Shreveport is the “greenest” and healthiest city in the South, committed to resource and energy sustainability and enhancing access to healthy lifestyles. Our landscape is enriched by a natural network of greenways and bayous offering recreation in nature. Shreveport’s youth and college graduates, as well as newcomers, are proud of their beautiful city, cohesive community, and culture of opportunity. All citizens choose to be part of an innovative city on the move.
WHY WE DEVELOPED THIS PLAN Our last comprehensive master plan was in 1957 – and it shaped our road system and development for many years. The Great Expectations Plan is designed to put Shreveport-Caddo on a new strategic path for the 21st century toward more jobs, more households, smarter growth patterns, and a better quality of life for all. Shreveport is the biggest center of employment, retail, media, and health care for a region of a million people. We are the center of a growing natural gas energy economy. The Plan gives us a framework for seizing the opportunities before us to make our community better, while preserving all the things we love about Shreveport and Caddo Parish.
37 Great Expectations: Shreveport-Caddo 2030 Master Plan (2010), http://www.shreveportcaddomasterplan.com/

APPENDIX L: FUTURE/MODEL CITIES
IBRC FINAL REPORT 158
HOW WE DEVELOPED THIS PLAN The Great Expectations Plan was developed by the Shreveport-Caddo community in a process with broad public participation of citizens from all over the city and nearby parts of Caddo Parish. The planning process touched thousands of people, whether through the public opinion survey, the visioning events, neighborhood workshops and open houses, topical workshops, or the scenario open houses. Residents from all walks of life gave many hours of their time to serve on the Community Advisory Group and the six Working Groups that helped shape the plan.
HOW WE’LL PUT THE PLAN TO WORK The purpose of a plan is to prepare for action. The Great Expectations plan includes a detailed implementation plan setting out the What, How, Who, and When for specific actions to achieve the goals of the plan. A Master Plan Advisory Committee made up of citizens will serve as the stewards of the plan, advising government and other partners and monitoring progress. Annual public hearings will give citizens a report on implementation and the plan will be used in capital improvement planning, work plans, and to guide land use decision making. Partnerships with residents, businesses, medical and educational institutions, and nonprofits will be critical to success.
City 3: Dublin, Ohio
Dublin is recognized as a progressive city. It has a number of initiatives, including a strong interest and programs towards sustainability. Many of these programs are directly related to infrastructure as evidenced by the set of design ideas that the city espouses:
Regional open space connections Alternative transportation methods Pedestrian connectivity Walkable environments Increased housing options Economic viability Focus on design
City 4: Eindhoven, Netherlands
Eindhoven declares itself the “smartest city in the world.” It is part of a technology region called Brainport (much like our Silicon Valley), considered a “breeding ground for knowledge and innovation.”38 Eindhoven is the 2011 recipient of the Intelligent Community Forum award. The city has a vision and set of objectives to achieve certain benchmarks and goals by 2020, far exceeding our future view of our own city. Eindhoven hosted a city planning conference, “Intelligent cities innovate Europe,” in October 2011.
38 Brainport Eindhoven Region: The World’s Smartest Region! http://www.brainport.nl/

IBRC FINAL REPORT 159
Appendix M -‐ Technology Considerations
Wireless Infrastructure Through the use of wireless technologies, it would be possible to implement a wireless “canopy” for Palo Alto and its immediate surrounding area. The canopy is simply a wireless network, to be operated by the City, which offers access to the Internet wirelessly. There has been a problem with municipal networks in the past because the business model wasn’t appropriate. For example, there would be insufficient use of the network by the City to justify the infrastructure costs. Typically, cities lack the capability to offer network access for a fee to private users.
In Silicon Valley, there was an early attempt to put together this type of arrangement (e.g., Smart Valley II). This was before more recent 4G wireless was available and 4G appears to overcome some of the key limitations. It offers higher speed and greater coverage. It provides for voice, video and data. The proliferation of additional categories of connected devices that will make use of a 4G wireless network (e.g., iPad3, iPhone6) might give rise to a robust ecosystem of users. Also, there are now or shortly will be many reliable, low-cost semiconductor components available as needed for lowering the cost to users for their equipment. As wireless technologies continue to evolve, there will be even higher speeds and greater coverage available, which will enable even more uses of the network. The City can profit from the “app” model in which the City, by providing the network, allows and encourages other service providers to offer value to customers within the city.
One example of this might take the form of an app that supports a mobile payment zone within the 4G wireless canopy. All of the merchants in the city could be enrolled. The app would enable customers (residents or visitors) to search for what they might want in the form of goods or services, stores or restaurants. A map feature could generate instructions for finding the location of something they were looking for. Purchases could be made online. Discount coupons or marketing programs might allow merchants to provide incentives in the form of discounts or advertisements for sales. Also, a useful, high-demand 4G canopy with a mobile payment zone might invite a public-private partnership. For example, Palo Alto might negotiate a partnership with a service provider such as Verizon and an equipment vendor for smartphones.
The existence and availability of high-speed infrastructure is likely to allow knowledge workers greater flexibility in collaborating without traveling and in remote access to services needed for work environments. Increasing numbers of technology solutions, such as video collaboration, require high bandwidth to operate. Making such bandwidth available can reduce the need for driving to physical offices and allow the City to profit from the resulting fewer cars on the road and parking needs.

APPENDIX M: FUTURE/TECHNOLOGY
IBRC FINAL REPORT 160
As part of “technology catch-up,” the City might consider investigating how wireless technologies can be used for residential, business and public safety services. The City can take advantage of its expertise in fiber networks and can also leverage local business in this technology sector.
Smart Grid Given that Palo Alto has a municipal Utilities Department, the introduction of the so-called Smart Grid may become an important element of civic infrastructure. This will involve smart meters and a control network that allows for load balancing. There are issues associated with right-of-way for the necessary equipment, and the City controls the issuance of permits for things like base stations, antennas or trenches. Excessive cost or delays associated with fees and permits may discourage deployments. However, the evolution towards a Smart Grid system is coming, and this will enable many other potential benefits, including alternative energies.
Alternative Energies (‘CleanTech’) Is it possible for Palo Alto to implement a solar photovoltaic (PV) infrastructure? When clean energy is sufficiently cost-effective, it may be feasible to cross over to sustainable energy sources of different types. High-efficiency solar PV is rapidly becoming available. Whereas it has been proven successful to install solar arrays in hot desert areas with lower efficiency, thin film solar arrays, such technology may convert only ~18 percent of the solar energy into electricity. Now, however, higher efficiency systems are being developed and are coming into production. These will be optimal for the Palo Alto climate zone and weather conditions, operating with efficiency in the mid-20 percent range. This improvement is significant and makes it viable to introduce solar PV more broadly here on the Peninsula.
The question for the City might be how to accelerate the deployment of such alternative energy resources. Smart meters will be needed in order to allow the flow of energy in both directions from the grid, and from the solar PV installations back into the grid. There are issues with how the energy supplies may be distributed.
Another question for the City might relate to rooftops and building walls. If higher buildings are allowed which have rooftops and walls above the tree shadow, this would enable the use of solar collecting technologies on rooftops and windows. Taller buildings will often have flat roofs, which are easier to solarize. Technologies for solar windows are now going into production with embedded photovoltaic cells in network-managed PV blinds. As a general proposition, higher buildings can be more energy efficient.
Technologies for Aging Demographics The increase to Palo Alto’s aging population will bring planning challenges. In observing the anecdotal patterns of older people moving about Palo Alto, it does not appear that we have made the City particularly supportive or friendly for the unique

APPENDIX M: FUTURE/TECHNOLOGY
IBRC FINAL REPORT 161
needs of senior citizens. A number of studies have found that urban high-density areas can support a higher quality of life, particularly as people age. There is more to do in a more compact area, with lots of mental, intellectual and emotional stimulation. In the Silicon Valley current projects are under way for “intelligent urbanization.” There are conferences for city mayors and other experts on ways to bring an entire city into the urban renewal planning process. This ensures that the City may evolve in a direction aligned with the desires and needs of its inhabitants. The City should get involved in such activities.
Other municipalities have also invested in “digital inclusion” by making Internet access widely available for those who may not otherwise have it. The Internet access points in our libraries are examples.
Advanced Healthcare In a city that already boasts leading healthcare facilities, clinics and hospitals, it would be easy to assume that Palo Alto offers sufficient services for the well-being of its residents. However, with the escalation of healthcare costs and the ever-present need of accurate, up-to-date medical information for treatment, and given the high percentage of senior citizens in our City, improvements and advances in any of these areas would be welcomed. With the shortage of healthcare professionals, the ability to treat patients remotely, monitor the ill on a full-time basis, and provide online access to medical records and medical research would all contribute to increased productivity, reduced costs and better overall services. The City has already engaged the local hospitals in support of their expansion within city limits, to improve our access to world-class medical facilities. Notwithstanding these impressive programs and decision, improving access in other ways will continue to be a priority. Many other municipalities have initiatives, programs and networks towards this goal.
In parallel, the City may consider consulting studies on technologies of interest (examples provided above) and creating citizen groups or advisory boards consisting of technology executives and Stanford personnel to work with the consultants to derive strategies and plans for the city. The involvement of executives in the process might facilitate and public/private activities relating to these technologies.

IBRC FINAL REPORT 162
Appendix N -‐ Future Ideas for Consideration
Community Services Center Should the City invest in a services building or campus that could house many of the organizations that currently occupy older structures? For example, Avenidas in 450 Bryant Street might be situated in a shared services building that also houses a teen center, preschool daycare, and office space for other tenants.
The present City-owned portion of the Cubberley site could be the location for such a collection of services – a new community services center (CSC). IBRC elsewhere recommends that the City not renew its current lease with the PAUSD.
We imagine a services center that replaces the multiple classroom-style buildings at the present site, providing approximately 180,000 square feet of space. The building would be a mixed-use structure, in which office space, class workshops, and recreation facilities such as a yoga center, teen center, and senior center could be housed. Senior services, such as space for health clinics for the aged, could be included. Many of the small nonprofits that the City chooses to support could be offered space in such a community services center. The model we are using for the CSC is the Mitchell Park Community Center and Library. We see a two-story structure. The cost estimate is between $40 and $60 million in current dollars.
Leveraging the Embarcadero Corridor The MSC working group has developed a rational plan for reconsidering the location of municipal services in light of their functions and their needs. There is an opportunity to relocate some of the current services that are housed in the MSC to the Embarcadero East corridor. By thinking ahead to the future use of Embarcadero land, by considering how the golf course could be used differently, by planning a multi-year redevelopment of that area in conjunction with commercial interests for hotels, restaurants, and a convention center, this locale, ideally positioned near Baylands recreational resources, could become another attractive region of the City.
Such a plan opens the door to exciting opportunities for the City. The Embarcadero East corridor could become another center of City activity and services. For example, we see the possibility of repurposing the auto dealership properties to accommodate services such as vehicle maintenance, while the current MSC acreage affords adequate space for a multi-story office building that could be the future home of City staff functions now residing at 250 Hamilton. With the gradual migration of City staff to the new location, the current City Hall could be converted into a municipal/commercial center, given its close proximity to the city center and transportation services. In the event police services are moved out of the 250 Hamilton block, as recommended elsewhere in this report, then the redevelopment of the entire Civic Center plaza becomes an intriguing possibility. (See the discussion of the MSC/Embarcadero East possibilities in section 4 for the germ of this idea.)

APPENDIX N: FUTURE/IDEAS
IBRC FINAL REPORT 163
Should action be taken to examine those alternatives, the City might also consider repurposing the golf course and relocating other City services in the area adjacent to the Baylands and East of the Bayshore Freeway. Mountain View has successfully developed their shoreline into a mixed-use recreational, entertainment, and business district. The possibilities are somewhat limited by the problematic topology (flood zone). However, sufficient zoning and construction regulations might open the door to a new and revitalized area of the City.
Portland, Oregon, has created EcoDistricts, combining green buildings, access to transportation, “walkable sidewalks,” and enhanced services in specific sections of the city. The Futures Working Group recommends that these concepts be considered for all of the development projects that are contemplated in this report.
Conference Center To attract business entities and executives to our city, enhanced business services are a critical element of the City offerings. One example would be a conference center, adjacent to the golf course and aligned with high-speed communications facilities.
Start-‐up Incubator Given the physical limitations of our geography, we ask ourselves the question: what types of companies do we wish to see in Palo Alto? The city suffers from the “Facebook effect,” whereby Facebook employees enjoy living in the city, yet the company itself moves beyond our borders. Given our geographical constraints against hosting large campuses such as those preferred by companies such as Google and Facebook, what are our other options for business development and growth? With our proximity to Stanford University, the access to technologists, capital, and management resources creates a unique eco-system for creating and building companies. Should the City build the context for attracting such incubators?
City Wireless Network The Futures Working Group envisages a wireless network that initially covers the commercial retail areas of the city and eventually migrates to provide general coverage and services to the high-density regions of the city. In Appendix M, we review a number of services that can be supported by ubiquitous, always-on wireless networks. For example, a retail payment system for downtown merchants could be supported wirelessly, with the City collecting a percentage of all payments made by customers. This payment system would offer the City a new revenue stream.
Another consideration is that if the wireless network were set up to encourage economic development, then, as a City utility, the regulations surrounding the system might be less rigorous.
The recent deployment by AT&T of a University Avenue Hot Spot (Wi-Fi access) is a step in the right direction, but limited to AT&T customers. How might the City get involved in such a project?

IBRC FINAL REPORT 164
Appendix O -‐ Summary: Futures Working Group
Ideas for Consideration Contained in Section 6
The IBRC report already recommends the formation of a new commission, as per the adopted resolution: 1-4 Establish a permanent public commission, appointed by the City
Council, to give ongoing oversight to infrastructure maintenance, to consider and make recommendations regarding future infrastructure needs, and to assure proper attention to the City’s physical assets. This commission should have as its staff liaison the Director of Planning.
Further ideas for consideration contained in the Future section of the IBRC report are summarized below:
Task the new infrastructure commission with further analysis of demographic data and implications for Palo Alto infrastructure.
Hold a “smart cities” conference in Palo Alto, assembling City Managers, Council Members, and City staff, as well as interested members of the public, for the exchange of ideas on planning infrastructure for the future.
Institute an end-of-life process for City assets. Consider asset sale as a potential source of funding for other infrastructure projects.
Encourage the new infrastructure commission to form advisory boards that include Palo Alto residents with interests and background in the following areas: technology, environment, infrastructure, sustainability, the arts and recreation.
As part of technology catch-up, the City should immediately investigate how wireless technologies can be used for residential, business, and public safety services. The City can take advantage of its expertise in fiber networks and can also leverage local business in this technology sector.
Institute consulting studies on technologies of interest (examples provided in Appendix M). Create a citizen group or advisory board of technology executives to work with the consultants to derive strategies and plans for the city. Involve Stanford personnel in this advisory board.
Incorporate a longer-term planning perspective for infrastructure in the City’s Planning Department. That perspective should extend 25 years in the future and reflect any programs in the City’s Comprehensive Plan.