Embed Size (px)
Citation preview

Promoting energy efficiency
Ibon Galarraga
Economics for Energy Workshop Economic Challenges for Energy
Madrid, 28-29 January 2016

2
Overview
1. Introduction
2. Problem: Energy Efficiency Gap
3. Existing evidence
4. Concluding remarks

3
1. Introduction 2. Problem: Energy Efficiency Gap
3. Existing evidence
4. Concluding remarks

§ Efforts to reduce fossil-fuel use in the different sectors (e.g. transport, industry, building).
§ European Commission identifies increased energy-efficiency (EE) as the most cost-effective and rapid way to reduce CO2 emissions.
§ The IEA estimates that EE measures can reduce global CO2 emissions by up to 10–15% per year at no direct additional cost.
§ IPCC (2014) suggests an investment in energy efficiency (EE) in transport, industry and building of 336 billion US$.
§ EU Climate and Energy package that sets the target of reducing energy consumption by 20% by 2020.
4
The importance of energy efficiency

§ Building accounts for almost 20% of global GHG emissions, industry with 31%, transport with 14.3%. Buildings large potential for cost-effective energy savings.
§ The EU goal of a 27% energy saving in the residential sector (European Council 2006).
§ Final energy consumption by sector in 2013:
5
The importance of energy efficiency
13,82%
26,81%
31,58%
25,06%
2,74%
Source: European Environment Agency
11,79%
18,50%
39,39%
25,85%
4,34% Services
Residen,al
Transport
Industry
Others
Spain EU 27
Household appliances more t h a n o n e t h i r d o f domest ic e lec t r ic i ty consumption.

6
1. Introduction
2. Problem: Energy Efficiency Gap 3. Existing evidence
4. Concluding remarks

§ BUT, Energy Efficiency Paradox exists (Howarth and Andersson, 1993; Jaffe et al., 2009):
• Private investments in energy efficiency that seem to be economically worthwhile are not always made. And,
• Some individuals make investments in EE when economically they would not appear to be worthwhile.
§ Can be explained:
• insufficient information,
• principal-agent problems,
• lack of access to capital,
• divergences between social and private discount rates,
• consumer behaviour that is motivated by non economic factors, such as a desire to contribute to a public good.
7
Some problems:
Cannot know efficiency, hidden costs…
Owner/tenant

8
Energy efficiency paradox: (Ramos et al., 2015)

9
1. Introduction
2. Problem: Energy Efficiency Gap
3. Existing evidence 4. Concluding remarks

10
Household appliances
Cars
Houses
INSTRUMENTS

11
Evidence
Household appliances

Energy label – Basque Country (Spain)
§ Study: Galarraga et al. (2011 a; b) → dishwashers, refrigerators § Methodology: Hedonic price approach (2009 prices)
12
Dishwashers Refrigerators
Price-premium from A to the highest EE label (A+)?
€80 16% average market price (€514)
€60 9% average market price (€660)
Energy saving premium? Premium that consumers would be willing to pay if the discounted annual savings over the lifetime of the dishwasher were considered
From A, B, C or D to A+ → 8% - 49% From B or A to A+ → 25 - 36%
Price elastic? Appliances with EE label more sensitive to price variations than regular ones

Energy label – Shanghai (China) § Study: Shen and Saijo (2009) → air conditioner, refrigerator § Methodology: Choice Experiment + Latent-Class Model § WTP for a one step EE upgrade (converted to € 2013):
13
Survey mode\ Appliance Air conditioner Refrigerator
Face-to-face €63 - 131 €172 - 217
Web-based €58 - 88 €124 - 144
Attributes' significant influence
Price - Price -
EE rank + EE rank + Label with electricity bill savings + Label with electricity
bill savings +
Hourly electricity consumption - Daily electricity
consumption -
Air purification function + Noise reduction +
§ EE has significant positive influence
§ WTP for more EE refrigerators > WTP for more EE air conditioners → greater incentive for more frequently used appliances
§ Stated WTPs under face-to-face > WTPs under web-based → influence of survey mode on estimated preferences!

Energy label –Spain
§ Study: Lucas and Galarraga (2014) → dishwashers, refrigerators and washing machines
§ Methodology: Hedonic price approach
14
Dishwashers Refrigerators Washing machines
Price-premium from A to the highest EE label (A+)?
€19.42 4% average market price (€482)
€86.39 12.63% average market price (€684)
€19.79 4.15% average market price (€477)
Price elastic? Appliances with EE label more sensitive to price variations than regular ones

Market-based instruments - EU § Study: Markandya et al. (2009) → Appliances § Methodology: Economic model of consumer behaviour § Cost-effective? (in terms of welfare benefits):
15
Appliance Subsidies or tax credits Energy tax
Refrigerator €50 subsidy for class A+ Additional 10% tax on energy tax
France: NO (€60.27/tCO2 ) Denmark: YES (-€0.41/tCO2)
France: YES (-€185/tCO2) Denmark: YES (-€10/tCO2)
Washing machines
€100 tax credit to manufacturers Removal of classes B and lower
Italy: NO (€650/tCO2) Poland: NO (€283/tCO2)
Italy: NO (€408/tCO2) Poland: NO (€190/tCO2)
Boilers
25% of boilers price tax credit to consumers 10% gas price ↑
Denmark: YES (-€24/tCO2) Italy: YES (-€14/tCO2)
Denmark: YES (-€16/tCO2) Italy: YES (-€12/tCO2)
Light bulbs €1 subsidy 10% electricity prices ↑
Poland: YES (-€17/tCO2 ) France: YES (-€11/tCO2)
Poland: YES (-€141/tCO2 ) France: YES (-€761/tCO2)
Study conclusion: taxes are in most cases more cost-effective than subsidies

Market-based instruments – Basque Country (Spain) § Study: Galarraga et al. (2013) → Dishwashers § Methodology: Partial equilibrium approach with simulation
16
Policy Rebound effect? (cumulative)
Public budget? (cumulative)
Welfare? (cumulative)
Rebate (€80) YES → increased energy bill (€192,400-261,000)
DEFICIT (€1M)
LOSSES (€24,000-38,000)
Tax (€40) NO → energy saving (€250,000-355,000)
BENEFIT (€0.83 M)
MUCH ↓ LOSSESS (€11,000-16,300)
However… taxes are less socially acceptable Combination?
Tax (€20) + subsidy (€25)
NO → energy saving (€66,700 - 100,300)
BENEFIT (€99,900 - 107,400)
MUCH ↓ LOSSESS (€6,600 - 10,800)
Tax (€20) + subsidy (€40)
NO → energy saving (€30,700 - 51,000)
DEFICIT (€85,600 - €98,600)
MUCH ↓ LOSSESS (€6,000 - 6,700)
Win-Win

17
Market-based instruments – Basque Country (Spain)
§ Galarraga et al (2013).
S(+)
ES(+)
DWL>25,800€
Surplus
Energy savings
Deadweight loss

Market-based instruments –Spain § Study: Galarraga et al. (2015) → Dishwashers, washing machines and fridges. § For: Galicia, the Basque Country, Valencia, Seville, Madrid and Barcelona
§ Methodology: Partial equilibrium approach with simulation. Optimisation. § We minimise DWL s.t
§ Restricting emissions of CO2. § Generating no deficit for the public budget. § Increasing (decreasing) the number of labelled (non-labelled)
appliances.
18

Market-based instruments –Spain § If the aim is to reduce emissions only:
19
• Two taxes. • Reduction in total number of appliances. • Significant tax Revenue. • DWL positive. (Perhaps compensate it?)
• Only one tax. No subsidy. • Reduction in total number of appliances. • Higher tax Revenue than previous. (Tax higher) • Higher DWL than previous.

Market-based instruments –Spain § If the aim is budget neutrality:
§ If the aim is keeping the number of appliances constant:
20
• Tax and Subsidy. • Increase in total number of appliances (Backfire
in some cases). • Budget neutral. • DWL positive but much lower.
• Tax and Subsidy. • Some energy savings are possible. • Small deficit. • DWL positive, slightly higher than under
neutrality. Much lower than energy saving case.

Market-based instruments –Spain § Comparing all the three appliances:
§ Need to be careful when designing the policy. The existing RENOVE policy in Spain can substantially be improved.
§ Bonus-Malus can be efficient, generated no deficit, can be designed to reduce energy consumption (But LIMITED) and consumer can choose whether to receive a subsidy or pay a tax.
21
• Results driven by elasticity estimates for each appliance.
• NOT possible to achieve 10% energy reductions with budget neutrality or keeping total nº appliances constant, if wishing to min DWL.
22
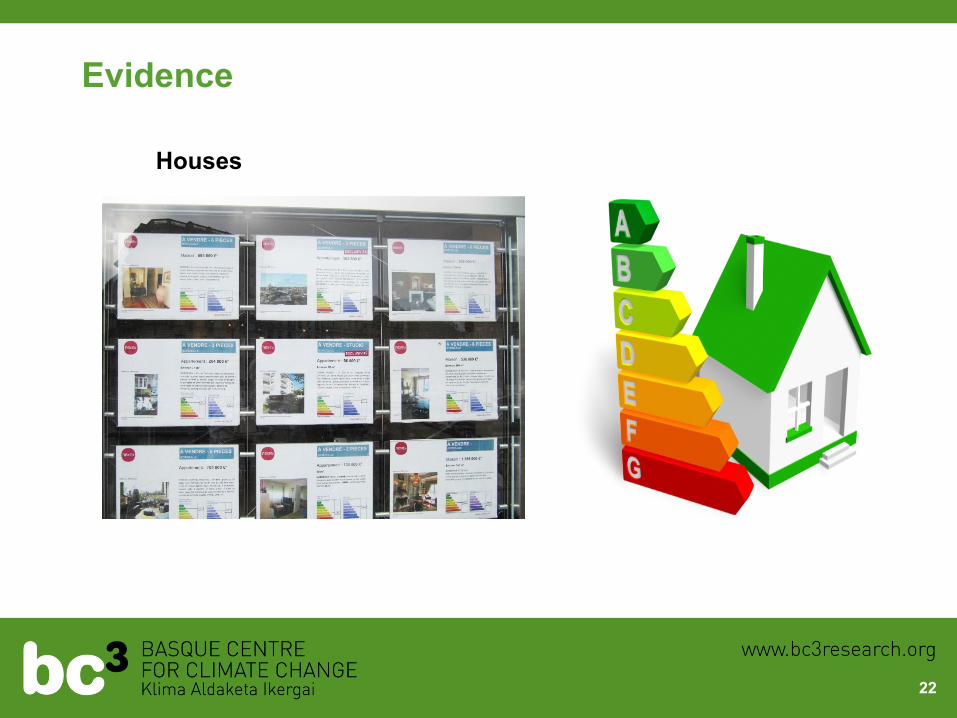
Evidence
Houses

§ Study: De Ayala et al. (in progress) → Housing stock § Methodology: Hedonic price approach § In Spain? From June 2013, all properties offered for sale or to let in Spain are
required to have an EPC. § The improvement of the energy performance of a house leads to higher
transaction prices (and rents) on the market???. § Given that EPC is a recently introduced regulation, unlike other European
housing markets, the Spanish one lacks market data on EE labels and their effectiveness.
1. To overcome the lack of Spanish EPC data by determining the EE ratings for a number of Spanish homes based on a revealed preferences survey on energy characteristics.
2. To provide for the first time a picture of the status of EPC in Spanish housing market and the impact it has on residential property valuations.
Energy Efficiency Housing–Spain
23

Energy Efficiency Housing–Spain
24
Reference Country Major finding
Bio Intelligence Service et al. (2013)
Austria (A), Belgium (B), France (F), Ireland and UK
• Price premium on average of a one-‐leMer improvements in EPC in the sales market (and in the leOngs market):
-‐ Vienna (A): 8% (4.4%) -‐ Flanders (B): 4.3% (3.2%) -‐ Wallonia (B): 5.4% (1.5%) -‐ Brussels (B): 2.9% (2.2%) -‐ Marseille (F): 4.3% -‐ Lille (F): 3.2% -‐ Ireland: 2.8% (1.4%)
• Oxford (UK): A one-‐leMer improvement in poten,al energy ra,ng was associated with a 4% lower price, everything else being equal
Brounen and Kok (2011) Netherlands Homes labelled A, B or C ("green" labels”) transact at an average price premium of 3.7%, ceteris paribus
Deng et al. (2012) Singapore On average, the Singapore Green Mark CerOficaOon yields a 15% price premium on residen,al property vale ceteris paribus
Gilmer (1989) US (Minnesota) Home energy ra,ng system helps iden,fying more quickly the properly priced house
Hyland et al. (2013) Ireland RelaOve to D-‐rated, A-‐rated properOes receive a sales price premium of 9% (and a rental price premium of just under 2%)
Kahn and Kok (2012) US (California) Homes labelled as "energy efficient" transact at a premium of 9%
Yoshida and Sugiura (2011) Japan Green dwellings trade at a price discount of approx. 5.5%

§ 1,507 households in Bilbao, Vitoria, Madrid, Seville and Malaga cities + surroundings municipalities in 2013.
Energy Efficiency Housing–Spain
25
§ Collected info.:
§ Characteristics of the dwelling (building age, facade orientation...).
§ Energy consumption (from electricity and natural gas bills).
§ Perceived value of home. The stated price ranges from €25,000 to €1,025,000 (mean = 212,100, std. deviation = 112,800).
§ We complemented with: socio-demographic variables of the township where the dwelling is located (population density, ageing index and life quality index).
§ The EE label of each dwelling was calculated through the software called C3EX (www.idae.es) using different input variables: postcode, age of the building, surface area, shading, orientation…

Energy Efficiency Housing–Spain
26
Dwellings labelled A, B or C are valued at prices 9.8% higher on average than those with the same characteristics but lower EE labels.
Dwellings labelled A, B, C or D are valued at prices 5.4% higher on average than those with the same characteristics but lower EE labels.

Energy Efficiency Housing–Spain
27

Comparative energy bills (Ramos et al., 2015)
28

Comparative energy bills (Ramos et al., 2015)
29

30
Evidence
Cars
Energy Efficiency
Commercial brand Hummer
Vehicle model H2 6.2 V8 AUT.
Fuel type Gasoline
Transmission A
Fuel consumption
(liters per 100 kilometers)
17,4 liters/100Km
Equivalence
(Kilometers per liter)
5,75 km/liter
CO2 emissions
(grams per kilometer)
412g/km
Consumption comparative (with respect to the average of vehicles with the same size, for sale in Spain) Low consumption
High consumption

Energy Efficiency private vehicles - Spain
§ Study: Galarraga et al. (2014) → cars § Cross-sectional data with more than 3.000 observations containing official prices
and a set of detailed vehicles‘ characteristics, including the energy efficiency label.
§ Subsample of almost 400 observations with retail prices (gathered by the Mystery Shopping method) performed by an specialized survey company during September-November 2012.
§ Each observation was matched with its correspondent EE label from the IDAE database.
§ Methodology: Hedonic price approach with mystery shopping. § Results:
A statistically significant coefficient of the variable that measures the effect of (A, B) energy-efficiency labels: 3%-5.9% price premium (official listing and ‘mystery shopping’).
31

Energy Efficiency private vehicles - Spain
§ Compare WTP for a labelled A vehicle during the 10 years expected lifetime with the present value of the corresponding energy savings.
32
Discounted fuel savings "
"
WTP for a vehicle labelled A, using the average price for the
official-price subsample "
WTP for a vehicle labelled A, using the average price for the
retail-price sample"
r= 5% 2606.2 Euros"
1997.92" 4860,6"r= 10% 2073.9 Euros"
r=15% 1693.9 Euros"
WTP for and savings from energy-efficient vehicles
Consumers undervaluing EE? Energy efficiency
paradox?
Overestimation of WTP?

Table 1: Number of cars sold in Spain in 2012 per market segment, and their energy efficiency
n. cars % % A class % B class % Others Unknown
Small 194,616 27,82% 37,68% 50,70 % 11,62% 1,05%
Mini 35,164 5,03% 25,16% 38,39 % 36,45% 0,58%
Small Sedan 191,604 27,39% 53,40% 26,11 %
20,49% 0,13%
Big Sedan 85,310 12,19% 69,95% 18,75 % 11,30% 0,05%
Small Minivan 75,565 10,80% 42,51%
44,16 % 13,33% 0,58%
Big Minivan 10,573 1,51% 8,67% 32,16 %
59,17% 3,51%
Sport 2,176 0,31% 1,30% 21,61 % 77,09% 19,90%
Luxury 1,581 0,23% 52,16% 40,68 % 7,16% 33,08%
Executive 10,806 1,54% 33,98% 46,33 % 19,69% 26,37%
Small SUV 30,177 4,31% 2,97% 21,90 % 75,13% 2,64%
Medium SUV 52,198 7,46% 5,30% 18,72 %
75,98% 1,25%
Big SUV 2,757 0,39% 0,00% 0,00 % 100,00% 0,40%
Luxury SUV 7,062 1,01% 0,00% 31,00 %
69,00% 29,51%
TOTAL 699,589 41,07% 34,20 % 24,73% 1,53%
Energy Efficiency private vehicles – Spain (on-going work)
33
Data from ANFAC and
IDAE

§ 1) Absolute decision: Consumers who are concerned about energy efficiency will select the most energy efficient car in the market independent of segment , that is, the car that consumes the least fuel and pollutes the least.
§ 2) Relative decision: Consumers first decide what type of car (i.e. the segment) they want to purchase, and then choose the most efficient one within the segment.
§ A third way might exist for consumers who have a very clear idea of the brand and even the model that they want, and then within those options select the most efficient one. This case is harder to discuss and has therefore been left out of the analysis.
Energy Efficiency private vehicles – Spain (on-going work)
34

Energy Efficiency private vehicles - Switzerland
§ Study: Alberini et al. (2014) → cars § Database of all cars approved for sale in Switzerland in each year from 2000 to
2012, and reports manufacturer-suggested retail prices (MSRPs) and extensive information about the attribute of the vehicles.
§ Hedonic method. § Briefly, we find that, all else the same, fuel economy is (modestly) capitalized
into car prices. Even more important, the label has an effect on price above and beyond that of the continuous fuel economy measure, even when we control for the latter.
§ The matching approach estimates this effect to be about 5%. § Based on our regression discontinuity design, we find an even sharper effect of
qualifying for the A label, with effects on car price ranging from 6 to 11%, at least within a narrow interval around the threshold.
35

36

§ Labels might help overcoming information failures: • incomplete and/or asymmetric.
• Transaction costs.
• Uncertainties.
§ Also behavioural failures: • Limited attention
• Aversion to uncertainty
§ And finally, principal agent problems.
§ Great potential (Ramos et al., 2015). More effective to show energy savings or economic losses than potential benefits.
37
Instruments: Labels and certification (Ramos et al., 2015)

§ Providing information on the energy use aiming at achieving energy savings.
§ Contributes to reduce • incomplete information.
§ Also behavioural failures:
§ The risk: creating The so-called “Boomerang effect”: If a consumer discovers that consumes less than expected might decide to increase consumption.
§ Can increase elasticity of energy demand.
38
Instruments: Feedback systems (Ramos et al., 2015)

§ Providing information can produce some savings and effectiveness increases with frequency (Abrahamse, et al. 2005).
§ Darby (2006) show that immediate information can reduce energy consumption by 5-10%. Doubts: small samples so perhaps no so robust findings (Fischer, 2008).
§ But, who long does the effect of last? Google study says that 4 weeks (Houde et al. 2013).
§ Smart meters: 7-17% (Faruqui et al., 2010, Gans et al., 2013).
§ Energy bills: As a mean to nudge consumers. May rebound and boomerang effect exist?
39
Instruments: Feedback systems (Ramos et al., 2015)

§ Tailored and personalised information to reduce information failures (incomplete and asymmetric), transaction costs, uncertainty and behavioural failures. Savings up to %5 but difficult to assess this instrument.
§ Citizens and ESCO-s love this type of instrument. It is like a subsidy!
40
Instruments: Energy audits (Ramos et al., 2015)

Main highlights of PURGE project (I)
§ Measures to promote residential EE: Ø Information and education programmes
§ Information and provision of feedback are KEY to start changing individual’s behaviour for a rationale use of energy
• Study: Abrahamse et al. (2007) → Internet-based tool in a city of the Netherlands
§ Households exposed to combination of tailored information, goal setting (5%) and tailored feedback...
• ↓ energy use (direct + indirect) by 5% (control group 0.7% ↑ energy use) • ↑ save direct energy by 8.3% (control group only 0.4%) • ↑ knowledge of energy conservation
41
Direct: gas, electricity and fuel Indirect: embedded in the production, transportation and disposal of consumer goods

Main highlights of PURGE project (II)
Ø Market-based instruments
§ Can induce consumers to switch from a standard to an efficient appliance...
§ However, rebates or subsidies can result in increased energy consumption (rebound effect)
§ Energy taxes more effective → energy savings, benefits in public budget and less welfare losses
§ But, taxes are less socially acceptable! Alternatives: • Mixture of taxes and subsidies (bonus-malus):
ü Successful from an economic and social point of view ? Political acceptability not tested (except to a limited extent in France)
• Guaranteed financial incentive for energy savings: ü Can avoid the rebound effect X Complex to assure that only action-induced (as opposed to autonomous) savings are awarded
42

Main highlights of PURGE project (III)
Ø EE labels
§ Entail positive price premiums for energy efficient appliances • Price premiums? depend on the appliance type, country, social perspective. E.g.:
§ ↑ for frequently used appliances (washing machines, refrigerators...)
§ ↑ in Switzerland: 15% - 30% > Spain: 9% - 16%
§ EE labels providing additional info. also positive influence on WTP • Private benefits → energy cost savings
• Public (environmental) benefits § E.g. Energy and Carbon Footprint label, Energy and Environmental label, Energy Star label in the US
43
To be more effective… Complement with: • Training of sales staff → ought to be refreshed! • Explanatory info. about symbols in labels + Education campaigns

44
Intruments: (Ramos et al., 2015)

45
1. Introduction
2. Problem: Energy Efficiency Gap
3. Existing evidence
4. Concluding remarks

§ Energy efficiency is part of the long term climate solution, and it is smart way if saving resources.
§ Labels, audits, feedback, taxes, subsidies, standards and many other instruments exist. We need to combine them well!
§ Energy labelling is one of my favourites. And is acquiring a major importance in the light of the EU Climate and Energy.
§ It can be used to reduce information asymmetries but also to support other policy instruments such as taxes and subsidies. Many examples exist in EU.
§ Policies should be well designed and it is not always the case.
§ A Bonus-Malus scheme can outperform many of other proposal but is also limited by the goals that are being pursued (effectiveness, efficiency and implementation feasibility).
46
Concluding remarks

48
1. Introduction
BACK

49
Inversión anual durante las próximas dos décadas (2010-2029) para estabilizar la temperatura en 2ºC. Fuente: IPCC (2014).
Annual investment for 2010-2029 to stabilise the temperature at 2ºC. Source: IPCC (2014).
The importance of EE: 2ºC Investment path

McKinsey (2009)
The importance of EE: 2ºC Investment path
BACK

51
Bonus Malus schemes § The idea in Bonus Malus scheme is taxing the “bads” (inefficient goods)
to subsidise the goods (Labelled goods). This should allow to partially finance the subsidy scheme with the taxes significantly reducing the cost of the policy.
§ Also known as “Feebates” (a combinations of words resulting from `fee ̀and `rebate´) (Eilert et al, 2010 ).
§ Some examples: • car market in the US (Langer, 2005; Davis et al, 1995 ; Banerjee, 2007), • fuel efficiency (Greene et al. 2005), • French vehicles based in CO2 emissions (ASE, 2009), • food groups (Gustavsen and Rickertsen, 2013; Markandya et al, 2016 ), • fair trade and regular coffee (Galarraga and Markandya, 2006), • nitrogen oxide (NOx) in Sweden (Johnson, 2006). • energy efficiency in buildings at state level in US (Eilert et al, 2010).

52
Bonus Malus schemes in the literature § Eilert et al (2010) conclude that feebates can “complement existing
efficiency programs by providing greater support to newer, more expensive but highly efficient technologies, as well as by providing a new mechanism to tap into saving potential in hard-to-reach market segments”.
BACK