Embed Size (px)
DESCRIPTION
IBM X-Force 2012 Trend and Risk Report.
Citation preview
IBM X-Force 2012 Trend and Risk Report March 2013

2
IBM Security Systems IBM X-Force 2012 Trend and Risk Report
Contributors
Contributor Title
Andrew Franklin Senior Incident Response Analyst, IBM Professional Services
Brad Sherrill Manager, IBM X-Force Database Team
Bryan Ivey Team Lead, MSS Cyber Threat and Intelligence Analyst
Carsten Hagemann IBM X-Force Software Engineer, Content Security
Cynthia Schneider Technical Editor, IBM Security Systems
David McMillen Security Intelligence Analyst—IBM Security Services
David Merrill STSM, IBM Security Solutions, CISA
Dr. Jens Thamm Database Management Content Security
Gina Stefanelli IBM X-Force Marketing Manager
Jason Kravitz Techline Specialist for IBM Security Systems
Jay Bretzmann WW Market Segment Manager
John Kuhn Senior Threat Analyst—IBM Security Services
Larry Oliver Senior Cyber Threat/Security Intelligence Analyst
Leslie Horacek IBM X-Force Threat Response Manager
Marc Noske Database Administration, Content Security
Mark E. Wallis Senior Information Developer, IBM Security Systems
Mark Yason IBM X-Force Advanced Research
Michael Montecillo Managed Security Services Threat Research and Intelligence Principal
Ralf Iffert Manager IBM X-Force Content Security
Randy Stone Engagement Lead, IBM Emergency Response Services (ERS)
Robert Freeman Manager, IBM X-Force Advanced Research
Robert Lelewski Engagement Lead for IBM Emergency Response Services (ERS)
Scott Craig Team Lead—IBM Security Services—Data Intelligence
Scott Moore IBM X-Force Software Developer and IBM X-Force Database Team Lead
Veronica Shelley Identity and Access Management Segment Marketing Manager
Producing the IBM X-Force Trend and Risk Report is a dedication in collaboration across all of IBM. We would like to thank the following individuals for their attention and contribution to the publication of this report. About IBM X-Force
IBM X-Force® research and development teams study and monitor the latest threat trends including vulnerabilities, exploits and active attacks, viruses and other malware, spam, phishing, and malicious web content. In addition to advising customers and the general public about emerging and critical threats, IBM X-Force also delivers security content to help protect IBM customers from these threats.
Contributors

3
IBM Security Systems IBM X-Force 2012 Trend and Risk Report
IBM Security collaborationIBM Security represents several brands that provide a broad spectrum of security competency.
• IBM X-Force research and development team discovers, analyzes, monitors, and records a broad range of computer security threats, vulnerabilities, and the latest trends and methods used by attackers. Other groups within IBM use this rich data to develop protection techniques for our customers.
• IBM X-Force content security team independently scours and categorizes the web by means of crawling, independent discoveries, and through the feeds provided by IBM Managed Security Services (MSS).
• IBM MSS is responsible for monitoring exploits related to endpoints, servers (including web servers), and general network infrastructure for its clients. MSS tracks exploits delivered over multiple vectors including web, email and instant messaging.
• IBM Professional Security Services (PSS) delivers enterprise-wide security assessment, design, and deployment consulting services to help build effective information security solutions.
IBM Security collaboration

4
IBM Security Systems IBM X-Force 2012 Trend and Risk Report
Contents
Contributors 2About IBM X-Force 2
IBM Security collaboration 3
Executive Overview 62012 highlights 7
Threats 7
Operational security practices 8
Emerging trends in security 9
Section I—Threats 10Rising tide of security incidents 10
Varying level of sophistication 11
ABC’s and DDoS’s 13
What have we learned? 17
IBM Managed Security Services—A global threat landscape 19
MSS—2012 security incident trends 20
Malicious code 23
Probes and scans 24
Unauthorized access attempts 25
Inappropriate use 26
Denial of service (DoS) 27
Injection attacks 29
Exploit kits: the Java connection 31
CVE-2012-0507 timeline 32
CVE-2012-1723 timeline 33
CVE-2012-4681 timeline 34
Interest in Java exploits 35
But why Java? 35
Conclusion and action steps 36
Web content trends 38
Analysis methodology 38
IPv6 deployment for websites 38
Internet usage by content category 40
Internet penetration of social networks 42
Spam and phishing 43
Slightly increased spam volume in the second term of 2012 43
Major spam trends 44
Email scams and phishing 45
Spam—country of origin trends 47
Attacker reaction to botnet take downs 49
Contents

5
IBM Security Systems IBM X-Force 2012 Trend and Risk Report
Contents
Section II—Operational security practices 50Vulnerability disclosures in 2012 50
Web applications 51
Exploits 54
CVSS scoring 56
Vulnerabilities in enterprise software 57
Chaos or coordination: how to facilitate an incident response team 61
Risk modeling, assessment and management: brought to you by the letter “T” 66
Treat the Threat 67
Transfer the Threat 69
Terminate the Threat 70
Tolerate the Threat 71
Example server root access threat mitigation 72
Social media and intelligence gathering 74
Introduction 74
Intelligence collection background 75
Data availability/vulnerabilities 76
Enterprises as a collection of Individuals 77
Individual privacy 77
Tools for assistance 78
Protecting your enterprise 79
Conclusion 80
Identity and access intelligence for the enterprise 81
The importance of protecting data and reputations 81
Reduce risk with identity and access governance 83
Security intelligence for managing insider threats 83
Summary 84
Section III—Emerging trends in security 85Mobile computing devices should be more secure than traditional user computing devices by 2014 85
Application sandboxing 86
Signed code controls 87
Remote device or data wipe 87
Biocontextual authentication 87
Separation of personas or roles 88
Secure mobile application development 90
Mobile Enterprise Application Platform (MEAP) 90
Mobile Enterprise Management (MEM) 91
Prediction conclusion 91
Mobile security controls—where are we now? 91
Contents

6
IBM Security Systems IBM X-Force 2012 Trend and Risk Report
Executive overview
Over the past year, the IT security space has had numerous mainstream headlines. From the discovery of sophisticated toolkits with ominous names like Flame to cross-platform zero-day vulnerabilities, both consumers and corporations were inundated with advisories and alerts regarding emerging threats. The frequency of data breaches and incidents—which had already hit a new high in 2011—continued their upward trajectory.
At the mid-year of 2012, we predicted that the explosive nature of attacks and security breaches seen in the first half would continue. Indeed this was the case.
While talk of sophisticated attacks and widespread distributed denial-of-service (DDoS) attempts made the year’s headlines, a large percentage of breaches relied on tried and true techniques such as SQL injection. What continues to be clear is that attackers, regardless of operational sophistication, will pursue a path-of-least-resistance approach to reach their objectives.
Integration of mobile devices into the enterprise continues to be a challenge. In the previous report,
we looked at some of the pitfalls and perils of implementing BYOD programs without strict formulations of policy and governance to support the use of these devices. That said, recent developments have indicated that while these dangers still exist, we believe mobile devices should be more secure than traditional user computing devices by 2014.
While this prediction may seem far fetched on the surface, it is based on security control trends and requirements that are being driven into the market by knowledgeable security executives. In this report, we explore how security executives are advocating the separation of personas or roles on employee-owned devices. We also discuss some secure software mobile application development initiatives that are taking place today.
The distribution and installation of malware on end-user systems has been greatly enabled by the use of Web browser exploit kits built specifically for this purpose. Exploit kits first began to appear in 2006 and are provided or sold by their authors to attackers that want to install malware on a large number of systems. They continue to be popular because they provide attackers a turnkey solution
for installing malware on end-user systems. Java vulnerabilities have become a key target for exploit kits as attackers take advantage of three key elements: reliable exploitation, unsandboxed code execution, and cross-platform availability across multiple operating systems. Java exploits have become key targets in 2012 and IBM X-Force predicts this attack activity to continue into 2013.
As we reported in the mid-year, spam volume remained nearly flat in 2012, with India claiming the top country of origin for spam distribution, but the nature of spam is changing. Broadly targeted phishing scams, as well as more personalized spear-phishing efforts continue to fool end users with crafty social-engineering email messages that look like legitimate businesses. Also, fake banking alerts and package delivery service emails have been effective as attackers refine their messages to look like the authentic messages that customers might normally receive. Whether the target is individuals or the enterprise, once again, we remind readers that many breaches were a result of poorly applied security fundamentals and policies and could have been mitigated by putting some basic security hygiene into practice.
Executive overview

7
IBM Security Systems IBM X-Force 2012 Trend and Risk Report
Web applications are still topping the chart of most disclosed vulnerabilities, rising 14% in 2012 over the 2011 end of year numbers. As reported earlier in the mid-year report, cross-site scripting (XSS) dominated the web vulnerability disclosures at 53% of all publicly released vulnerabilities. Although SQL injection attack methods remain as a top attack technique, the actual disclosures of new SQL injection vulnerabilities remain lower than the 2010 peak we recorded.
Social media has changed our lives with new ways to connect, personally and professionally. From this constant availability of information about individuals, attackers can readily access data to use in their activities. Now, more than ever, individual employees who share personal details in their social profiles can be targeted for attacks.
Let’s take a closer look at how things shifted from the mid-year through the end of 2012.
2012 highlightsThreatsMalware and the malicious web• In 2012, near daily leaks of private information
about victims were announced like game scoreboards through tweets and other social media. Personal details, such as email addresses, passwords (both encrypted and clear text), and even national ID numbers were put on public display. (page 10)
• Based on data for 2012, it is not surprising that the bulk of the security incidents disclosed were carried out with the majority of attackers going after a broad target base while using off-the-shelf tools and techniques. We attribute this to the wide public availability of toolkits and to the large number of vulnerable web applications that exist on the Internet. (page 12)
• The year began and ended with a series of politically motivated, high-profile DDoS attacks against the banking industry. An interesting twist to the banking DDoS attacks was the implementation
of botnets on compromised web servers residing in high bandwidth data centers.1 This technique assisted in much higher connected uptime as well as having more bandwidth than home PC’s to carry out the attacks. (page 14)
• In the sampling of security incidents from 2012, the United States had the most breaches, at 46%. The United Kingdom was second at 8% of total incidents, with Australia and India tied for third at 3%. (page 16)
• IBM Managed Security Services (MSS) security incident trends are markers that represent the state of security across the globe. The relative volume of the various alerts can help to describe how attacks are established and launched. They also frequently provide hints about how methods have evolved. Based on this, the main focus in 2012 may have been the subversion of systems, with larger coordinated attacks being executed across fairly broad swaths of the Internet. (page 20)
Executive overview > 2012 highlights > Threats
1 http://threatpost.com/en_us/blogs/bank-ddos-attacks-using-compromised-web-servers-bots-011113

8
IBM Security Systems IBM X-Force 2012 Trend and Risk Report
• IBM MSS has noted a dramatic and sustained rise in SQL injection-based traffic due, in large part, to a consistent effort from the Asia Pacific region. The alerts came from all industry sectors, with a bias toward banking and finance targets. (page 23)
• Web browser exploit kits (also known as exploit packs) are built for one particular purpose: to install malware on end-user systems. In 2012 we observed an upsurge in web browser exploit kit development and activity—the primary target of which are Java vulnerabilities—and we supply some strategies and tips to help protect against future attacks. (page 31)
• Java continues to be a key target for attackers. It has the advantage of being both cross-browser and cross-platform—a rare combination that affords attackers a lot of value for their investment. (page 35)
Web content trends, spam, and phishingWeb content trends• Top used websites are readily deployed as IPv6-
ready, although attackers do not yet seem to be targeting IPv6 on a large scale. (page 38)
• One third of all web access is done on websites which allow users to submit content such as web applications and social media. (page 40)
• Nearly 50% of the relevant websites now link to a social network platform, and this intense proliferation poses new challenges to companies that need to control the sharing of confidential information. (page 42)
Spam and phishing• Spam volume remained nearly flat in 2012. (page 43)• India remains the top country for distributing spam,
sending out more than 20% of all spam in the autumn of 2012. Following India was the United States where more than 8% of all spam was generated in the second half of the year. Rounding out the top five spam sending countries of origin were Vietnam, Peru, and Spain. (page 47)
• At the end of 2012, IBM reports that traditional spam is on the retreat, while scam and spam containing malicious attachments is on the rise. In addition, attackers are demonstrating more resiliency to botnet take downs which results in an uninterrupted flow of spam volume. (page 49)
Operational security practices Vulnerabilities and exploitation• In 2012, we saw 8,168 publicly disclosed
vulnerabilities. While not the record amount we expected to see after reviewing our mid-year data, it still represents an increase of over 14% over 2011. (page 50)
• Web application vulnerabilities surged 14% from 2,921 vulnerabilities in 2011 to 3,551 vulnerabilities in 2012. Cross-site scripting vulnerabilities accounted for over half of the total web application vulnerabilities disclosed in 2012. (page 51)
• Cross-site scripting dominated the web vulnerability disclosures. Fifty-three percent of all publicly released web application vulnerabilities were cross-site scripting related. This is the highest rate we have ever seen. This dramatic increase occurred while SQL injection vulnerabilities enjoyed a higher rate than 2011 but were still down significantly since 2010. (page 52)
• There were 3,436 public exploits in 2012. This is 42% of the total number of vulnerabilities, up 4% from 2011 levels. (page 54)
Executive overview > 2012 highlights > Operational security practices

9
IBM Security Systems IBM X-Force 2012 Trend and Risk Report
• Web browser vulnerabilities declined slightly for 2012, but not at as high a rate as document format issues. While the overall number of web browser vulnerabilities dropped by a nominal 6% from 2011, the number of high- and critical-severity web browser vulnerabilities saw an increase of 59% for the year. (page 59)
• Few innovations have impacted the way the world communicates quite as much as social media. However, with the mass interconnection and constant availability of individuals, new vulnerabilities and a fundamental shift in intelligence-gathering capabilities has provided attackers and security professionals alike with information useful for enhancing their activities. (page 74)
• Rather than seeing a particular enterprise as an individual entity, attackers can view enterprises as a collection of personalities. This gives attackers the opportunity to target specific people rather than enterprise infrastructures or applications. Furthermore, targeted people may also be targeted as individuals and not just as employees. In other words, the personal activities and lives of employees can be leveraged to target an enterprise. (page 77)
Emerging trends in securityMobile• Prediction: Mobile computing devices should be
more secure than traditional user computing devices by 2014. This is a bold prediction that IBM recently made as part of its look ahead in technology trends. While this prediction may seem far-fetched on the surface, it is based on security control trends and requirements that are being driven into the market by knowledgeable security executives. (page 85)
• Separation of personas or roles: While a small percentage of enterprises have dealt with BYOD by using virtualized desktop solutions to separate and control enterprise applications and data from the rest of the personally owned device, a greater number of enterprises have wanted or required some form of separation or dual persona on mobile devices. This difference in use or adoption could be the result of greater numbers of devices driving greater risk in the percentage of personally owned mobile devices versus personally owned PCs in a BYOD program. (page 88)
• In many cases, enterprises have made significant investments into implementing Secure Software Development Life Cycle (SSDLC) processes. Today’s mobile application development benefits from this. Tools exist to support secure development as part of the process instead of being conducted in qualification or production. As a result, it should be more common for enterprises to have more securely developed mobile applications than their existing legacy applications. Closure of vulnerabilities in some traditional computing applications may only conclude as existing versions are sunset and replaced with newer, more securely developed replacements. (page 90)
• Over 2012, it is safe to conclude that more enterprises are supporting BYOD or the use of personally owned devices than previously. In the last two years, IBM Security has spoken to hundreds of global 2000 customers and out of those interviewed, only three said they had no plans to implement any kind of BYOD program. (page 91)
Executive overview > 2012 highlights > Emerging trends in security

10
IBM Security Systems IBM X-Force 2012 Trend and Risk Report
In this section we explore threat-related topics and describe the enterprise attacks that security specialists face. We discuss malicious activity observed across the spectrum by IBM and how we help to protect networks from those threats. We also update you on the latest attack trends that IBM has identified.
Rising tide of security incidentsSecurity breaches have been the topic of some of the hottest discussions for the IBM X-Force team over the last few years. From e-commerce and social network giants to healthcare, universities, banks, governments, and gamers, the breadth of breach targets over 2012 was vast. We declared 2011 the “Year of the Security Breach” because it had the highest number of recorded data loss incidents to date. The Open Security Foundation reported 1,088 events2 for 2011
that cover loss, theft, and exposure of personally identifiable information. In 2012, there were 1,502 documented incidents—a rise of nearly 40%.
In 2012, near daily leaks of private information about victims were announced like game scoreboards through tweets and other social media. Personal details, such as email addresses, passwords (both encrypted and clear text), and even national ID numbers were put on public display. Let’s take a closer look at how we got here.
Section I—Threats > Rising tide of security incidents
Section I Threats
2004 2005 2006 2007 2008 2009 2010 2011 2012
1500
1400
1300
1200
1100
1000
900
800
700
600
500
400
300
200
100
0
DataLossDB.org Incidents Over Time
43
157
644
774
1047
727
828
1088
1502
Source: http://datalossdb.org/statistics
Figure 1: DataLossDB.org Incidents Over Time – Credit: Open Security Foundation/DataLossDB.org http://datalossdb.org/statistics
2 http://datalossdb.org/statistics

11
IBM Security Systems IBM X-Force 2012 Trend and Risk Report
In early 2010, Google disclosed an attack on its corporate network that had been going on for several months. Dubbed “Operation Aurora,” the forensic evidence hinted at a level of sophistication that suggested the possibility of a state-sponsored attack. Soon other companies were coming forward, claiming that they, too, had observed similar patterns of attacks on their own networks. The term Advanced Persistent Threat (APT), which had already been in use to a limited extent, became commonplace and sometimes overused. The term APT generally describes a complex series of attacks, often over a prolonged timeframe, which seeks to obtain sensitive information about an individual, an organization, a government agency or a company. These attacks were originally thought of as extremely advanced in a technical sense however, over time our view has evolved and we currently believe that APT is about operational sophistication and, when necessary, using zero-day attacks and exotic custom malware.
These types of attacks have continued. In early 2013, several major media institutions, such as the New York Times and the Wall Street Journal, have come forward to report that they have been breached by a complex series of attacks. Once again, there is talk of state sponsored activity. However, while these cyber espionage scenarios make for good headlines, in terms of the overall volume of security breaches, they comprise only a small percentage of total incidents.
Varying level of sophisticationIn our mid-year 2011 report, IBM X-Force categorized attackers both in terms of the focus of their attacks and their level of sophistication. Some attackers choose to go after the broadest range of targets possible. Others, such as the ones referred to in the APT circles, carefully select specifically targeted networks and victims.
Section I—Threats > Rising tide of security incidents > Varying level of sophistication
Motivations:MMoMoM tCyber CrimeCCyCyber CCybebber C
lismisismmVandalismndalisann allisism• Existing exploit and malware kitse• Existing e••• x sistingng e• Botnet builders• Botn• Botnet bui• BB• Botn bbuiu
pam and DoSaandd DD• Spam and Spam ddd D
s::ionsMotivatioMotivatiiion :pionageiioor EspioCyber Ebe spio
Cyberwarbeberwrwberw• Cyberw
Attacker Types and Techniques 2012
Broad Targeted
Off-the-Shelftools and
techniques
Sophisticated
Motivations:Cyber CrimeHactivism• Financially motivated targeted targeggeteteded hhacks• DDoS attacks
Motivations:Cyber CrimeCyber Espionage• Advanced Persistent Threat• Organized, state sponsored teams• Discovering new zero-day vulnerabilities
Figure 2: Attacker Types and Techniques 2012

12
IBM Security Systems IBM X-Force 2012 Trend and Risk Report
Based on disclosed incident details such as the vulnerability used and attack type, we can determine that the majority of the security incidents disclosed in 2012 were carried out by the top left quadrant on figure 2, with attackers going after a broad target base while using off-the-shelf tools and techniques. This can be attributed to the wide public availability
Section I—Threats > Rising tide of security incidents > Varying level of sophistication
of toolkits, and to the large number of vulnerable web applications that exist on the Internet.
As illustrated in Figure 3, SQL injection (SQLi) continues to be one of the most popular points of entry for extracting data from a website. Given the large number of SQLi vulnerabilities in open frameworks, CMS systems and their plugins,
attackers can effectively use automated scripts to scan the web for targets.
Web application vulnerabilities are also exploited by attackers to inject malicious scripts and executables onto legitimate websites, which target client side vulnerabilities in the browser core and in plugins such as those in Internet Explorer and Java.
Figure 3: 2012 Sampling of Security Incidents by Attack Type, Time and Impact
13
IBM Security Systems IBM X-Force 2012 Trend and Risk Report
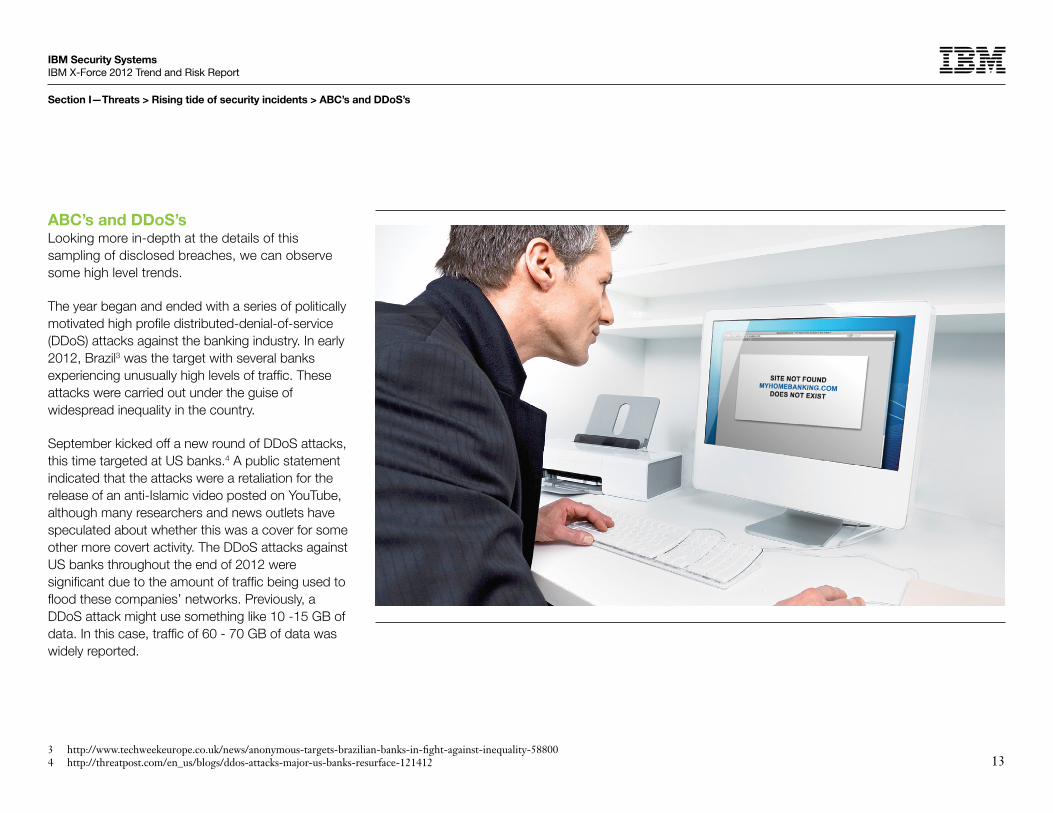
ABC’s and DDoS’sLooking more in-depth at the details of this sampling of disclosed breaches, we can observe some high level trends.
The year began and ended with a series of politically motivated high profile distributed-denial-of-service (DDoS) attacks against the banking industry. In early 2012, Brazil3 was the target with several banks experiencing unusually high levels of traffic. These attacks were carried out under the guise of widespread inequality in the country.
September kicked off a new round of DDoS attacks, this time targeted at US banks.4 A public statement indicated that the attacks were a retaliation for the release of an anti-Islamic video posted on YouTube, although many researchers and news outlets have speculated about whether this was a cover for some other more covert activity. The DDoS attacks against US banks throughout the end of 2012 were significant due to the amount of traffic being used to flood these companies’ networks. Previously, a DDoS attack might use something like 10 -15 GB of data. In this case, traffic of 60 - 70 GB of data was widely reported.
Section I—Threats > Rising tide of security incidents > ABC’s and DDoS’s
3 http://www.techweekeurope.co.uk/news/anonymous-targets-brazilian-banks-in-fight-against-inequality-588004 http://threatpost.com/en_us/blogs/ddos-attacks-major-us-banks-resurface-121412

14
IBM Security Systems IBM X-Force 2012 Trend and Risk Report
It is believed that the attackers were able to achieve these unprecedented rates by both the type of attacks they were using, and the type of servers they used in the attacks. As IBM X-Force has reported in the past, many DDoS operations are carried out through the use of compromised PCs running remotely controlled malware configured to attack a target. These bots can be purchased on the black market by the thousands and can be very effective. However, PCs are limited in capability because they are not always connected to the Internet and the bandwidth of the ISP can be unpredictable.
The 2012 bank DDoS attacks appear to be coming in part not from infected PCs, but from compromised web servers5 that reside in high bandwidth data centers. By using security vulnerabilities in CMS systems and other popular web frameworks, the attackers were able to create a botnet of web servers that have a much longer connected uptime, as well as having more bandwidth in general, than home PCs. Because of
Section I—Threats > Rising tide of security incidents > ABC’s and DDoS’s
this, they were able to use fewer bots to more effectively generate larger amounts of traffic.
In the last year multiple toolkits that target vulnerable web servers are available to attackers such as “Itsoknoproblembro”. Prolexic calls Itsoknoproblembro software a “critical DDoS threat that leverages a unique, two-tier command mode to launch multiple high-bandwidth attack types simultaneously”. They state they have observed attacks that have “… peaked at 70 Gbps and more than 30 million packets per second (pps), a magnitude of traffic that typically overwhelms most network infrastructures.”6
In addition to new toolkits and botnets of infected web servers, old reliable methods such as amplification attacks are being effectively used to generate high traffic. While amplification attacks such as an Internet Control Message Protocal-based (ICMP) “Smurf Attack” have been used for a decade or more, attackers continue to use the
same underlying principles to generate much more traffic today. In particular, DNS Amplification7 has been successful due to the many open or misconfigured DNS resolver servers on the Internet. The premise is that an attacker can send a small User Datagram Protocol (UDP) request—say a 64 byte DNS dig command—using a spoofed IP (the target server) to a third-party open DNS server. This command returns much more data—3-4Kb—over 50 times more than the 64 byte request. This order of magnitude scales up such that the more traffic the attacker is able to send, the more crippling it is against the target.
There were many other noteworthy breaches in 2012, including several high profile online services that made headlines. Early in the year, an ecommerce giant8 announced that it had been breached and took positive steps to correct the situation through public disclosure and providing its customers with a simplified way to update their passwords. A trio of breaches was reported in
5 http://threatpost.com/en_us/blogs/bank-ddos-attacks-using-compromised-web-servers-bots-0111136 http://www.prolexic.com/knowledge-center-ddos-threat-advisory-itsok.html7 http://blog.cloudflare.com/deep-inside-a-dns-amplification-ddos-attack8 http://usatoday30.usatoday.com/tech/news/story/2012-01-16/mark-smith-zappos-breach-tips/52593484/1

15
IBM Security Systems IBM X-Force 2012 Trend and Risk Report
June, from a music social site,9 an online dating community,10 and one of the largest professional social networks.11 Each one of these breaches resulted in a large amount of personal user data to be leaked publicly including email addresses and weakly encrypted passwords. A few weeks later, a file was obtained from an outdated site located on a major web portal12 which contained 450,000 email addresses and unencrypted passwords.
Many customers who made the mistake of reusing the same password on their social network logins, and on their webmail accounts, experienced the dangers of this practice first-hand as attackers were able to compromise their email and gain access to other personal data. One positive result to emerge from these breaches was a renewed interest in password security, both for web developers and individuals.
Section I—Threats > Rising tide of security incidents > ABC’s and DDoS’s
As in previous years, poorly secured universities and government organizations suffered breaches throughout 2012. It is surprising to see that these organizations are still not applying security fundamentals, such as encrypting passwords and other data.
The healthcare industry in the United States had a similar amount of data leaks, not resulting from SQL injection or web based attacks, but from poorly handled employee laptops and backup tapes. It has been reported13 that in the last three years, 21 million patients in the United States have had their medical records exposed in data breaches. These types of data breaches illustrate the need for tighter security controls and policies in this industry.
Another interesting set of targets throughout the year were the public websites of international locations of US-based franchise operations. For example, well known fast food restaurants in
Australia,14 Hungary,15 India,16 and Thailand17 were all targeted and customer data was breached. Even though these websites carry a parent company’s brand identity, they are not always organized or operated through the same IT infrastructure or compliant with the same set of policies as the parent company. The unfortunate result is that the brand name can suffer or be tarnished, as the breach becomes public knowledge.
Many breaches were part of larger “operations,” identified by hash tagged code names. These operations were tracked throughout the year and resulted in hundreds of thousands of records being leaked from a variety of targets based around loose themes. For example, #opleak18 was initially announced as an operation to demonstrate the need for stronger website security. In total, 45,000+ emails, passwords, and other sensitive data were leaked from over 200 different websites. Most of these leaks were a result of SQLi vulnerabilities.
9 http://www.last.fm/passwordsecurity10 http://www.cbsnews.com/8301-501465_162-57448965-501465/eharmony-suffers-password-breach-on-heels-of-linkedin/11 Ibid12 http://www.pcworld.com/article/259136/450_000_yahoo_voice_passwords_breached_hacking_group_claims.html13 http://www.computerworld.com/s/article/9230028/_Wall_of_Shame_exposes_21M_medical_record_breaches14 http://arstechnica.com/security/2012/11/australian-pizza-hut-customers-served-a-deep-dish-of-info-leaks/15 http://www.cyberwarnews.info/2012/10/12/pepsi-hungary-hacked-50000-user-credentials-leaked/16 http://www.computerworld.com/s/article/9231198/Domino_s_Pizza_says_website_hacked17 http://www.hotforsecurity.com/blog/mcdonalds-thailand-serves-2000-customers-with-a-side-of-data-leak-4040.html18 http://www.cyberwarnews.info/tag/opleak/

16
IBM Security Systems IBM X-Force 2012 Trend and Risk Report
Some operations were carried out as a form of protest for a specific incident, while others, like #opleak, were meant to illustrate the need for better security practices.
In the sampling of security incidents displayed in Figure 4, the country with the most breaches, at 46%, was the United States. The United Kingdom was second at 8% of total incidents, with Australia and India tied for third at 3%.
Section I—Threats > Rising tide of security incidents > ABC’s and DDoS’s
Breakout of Security Incidents by Country2012
United States 46%
United Kingdom8%
India3%
Australia3%
Netherlands3%
Canada2%
China2%
Brazil2%
France1%
Israel1%
Other29%
Figure 4: Breakout of Security Incidents by Country – 2012

17
IBM Security Systems IBM X-Force 2012 Trend and Risk Report
What have we learned?Going from the huge number of breaches in 2011 to an even higher peak in 2012 has brought a much needed awareness that better security of personally identifiable information and corporate data is needed.
We reported in the 2012 mid-year Trend Report about how websites can better encrypt and secure stored passwords by using more computationally complex hashing algorithms. Password basics for web users were also brought to the forefront. It became painfully clear how detrimental password reuse could be for both individual privacy and corporate networks.
As in past years, many breaches were a result of poorly applied security fundamentals and policies and could have been mitigated by putting some basic security hygiene into practice. We have
Section I—Threats > Rising tide of security incidents > What have we learned?
outlined some of these best practices in our segment “If IBM X-Force were running the IT department”
1. Perform regular third party external and internal security audits
2. Control your endpoints
3. Segment sensitive systems and information
4. Protect your network via basics (firewalls, anti-virus, intrusion prevention devices, etc.)
5. Audit your web applications
6. Train end users about phishing and spear-phishing
7. Search for bad passwords
8. Integrate security into every project plan
9. Examine the policies of business partners
10. Have a solid incident response plan
While we have not seen a large increase in companies reporting incident particulars, attackers seem to be more forthcoming in alerting the public about the vulnerability or technique used. In addition to dumping private data onto public sites like Pastebin and others, attackers are documenting additional information such as the motivation behind the attack and even the method used to gain entry.
While companies may not naturally want to report an incident, by doing so, it alerts customers that their data may be in jeopardy, and allows others to learn from past mistakes and hopefully prevent them from happening in the future. As we are seeing with some of the sophisticated attack disclosures, when one company goes public with an incident, we tend to learn of several other companies who are experiencing something similar.

18
IBM Security Systems IBM X-Force 2012 Trend and Risk Report
A more open discussion about the frequency, motivations, and techniques used in security breaches has brought this critical issue to our attention. The question now is: How do we apply this awareness to reversing the trend of increasing incidents?
We have discussed how refocusing on security fundamentals is an excellent start. As companies continue to assess their risk across all areas, it is clear that a coordinated effort that spans many parts of the enterprise is required.
Section I—Threats > Rising tide of security incidents > What have we learned?
There are technological challenges, such as auditing and securing web applications against SQL injection. There are policy challenges, such as access control and data integrity. And there are people challenges as we continue to educate employees about safe computing practices. Failure to adequately address any one of these challenges
would be a step backwards. While investing time and resources in each of these important areas can be perplexing, it has raised awareness to boardroom level discussions. Over time, taking continual small steps toward improvements can make positive inroads toward resolution.
A History of HacktivismThe term “Hacktivism” has become a popular buzzword in the media. Tracing the origins, it is believed to have been first been used in 1996 by a member of the hacking collective Cult of Dead Cow (cDc). Later, in 2004, cDc offered a more formal definition as “using technology to improve human rights across electronic media.”19 This charter outlines some ground rules, namely no denial-of-service attacks (depriving people of access to information) or website defacement (depriving someone of their freedom of speech). Ironically, at present, the majority of security incidents carried under the guise Hacktivism use denial of service and defacement as a standard methodology.
In many cases, the term has become a thin excuse for attackers to legitimize their otherwise illegal activities. It has evolved to encompass any combination of cyber attacks commonly with the intention of raising awareness, retaliation for perceived wrong doing, or forcing change.
Well known groups like the Anonymous collective use a wide variety of attacks, often favoring distributed denial of service (DDoS). Anonymous believes the use of DDoS attacks to promote an agenda, is a right. They have even gone to the extent of petitioning the US Government to recognize a DDoS attack as a legitimate form of protest. At the time of writing, the petition has a little over 6,000 signatures, 25,000 signatures are required before the petition would receive any official response.20
19 http://www.cultdeadcow.com/cDc_files/cDc-0384.php20 http://www.huffingtonpost.com/2013/01/12/anonymous-ddos-petition-white-house_n_2463009.html
19
IBM Security Systems IBM X-Force 2012 Trend and Risk Report
IBM Managed Security Services— A global threat landscape
IBM Managed Security Services (MSS) monitors tens of billions of events per day in more than 130 countries, 24 hours a day, and 365 days a year. This global presence of IBM MSS provides our analysts with a wealth of data used to understand current threats and the cyber threat landscape as a whole. This section provides an overview of security incidents and threat types seen in our Security Operations Centers globally. Threat trending information is vital to establishing security strategy and understanding the significance of individual threats.
Section I—Threats > IBM Managed Security Services—A global threat landscape
This edition of MSS threat trend reporting marks the beginning of a new reporting style. Rather than speaking to the hundreds of millions of potential threats Managed Security Services endpoints are exposed to on a daily basis, we will report about security incidents that have been validated by the heuristic processes and MSS staff.
To describe the scale of what is done by the MSS monitoring team, let us first examine some system statistics.
The MSS monitoring services are exposed to more than a quarter of a trillion (250,000,000,000) security events each year. This volume can be reduced by nearly 40%, leaving roughly 140 billion (140,000,000,000) events by focusing on intrusion
detection and prevention technologies. The heuristic systems comb through these billions of events and produce a set of alerts that combines various attack information into bundles, which can further reduce events by about 99.999%, or more than two million alerts. Further reductions can be achieved by combining these alerts with additional information and automated systems, eventually resulting in 100,000 events that are reviewed in an iterative fashion between human operation and heuristics. This effort results in warnings to customers and advisories to the public.
So this report is based upon technology that distills one quarter trillion events down to hundreds of thousands of alerts that are provided to our various customers.
20
IBM Security Systems IBM X-Force 2012 Trend and Risk Report
MSS—2012 security incident trendsSecurity incident trends are markers of the state of security across the globe. The relative volume of the various alerts can help to describe how attacks are established and launched, and frequently provide hints about how methods have evolved in the recent past. The volume of each type of alert tells us something about the process in use by attackers.
Term Description
Security Incidents
A category or grouping of similar alerts, based upon an intended outcome. Sometimes referred to as “Issues”
AlertsA notice to monitoring staff that a patten of events has been detected and that action may be required
EventsAn activity report from one of the monitored security endpoints
Alan Boulanger did an excellent job of quantifying the methods we still see today for the majority of intrusion efforts in his 1998 paper Catapults and grappling hooks: The tools and techniques of
Section I—Threats > IBM Managed Security Services—A global threat landscape > MSS—2012 security incident trends
information warfare.21 By linking the imagery of medieval siege warfare to attacking systems and networks, he provided a vivid description of the cracking process. Like the principles of warfare, most of his observations still apply.
In each scenario, the intruder performs steps in a sequence. These steps, or stages, form a “system penetration protocol.” The seven stages of system penetration are:
1. Reconnaissance: gather information about the target system or network
2. Probe and attack: probe the system for weaknesses and deploy the tools
3. Toehold: exploit security weakness and gain entry into the system
4. Advancement: advance from an unprivileged account to a privileged account
5. Stealth: hide tracks; install a backdoor
6. Listening post: establish a listening post
7. Takeover: expand control from a single host to other hosts on the network...”
The first two steps in the protocol, 1. Reconnaissance, followed by 2. Probes and attack line up well with the Security Incident category “Probes and Scans”. MSS heuristics reduce a large volume of individual actions into a single event, so each alert that we show in the “Probes and Scans” category will often represent hundreds of thousands of individual signature fires that are grouped together by the monitoring software.
If a vulnerability is located, the next thing to do is to establish a 3. Toehold. Depending on the findings of the Reconnaissance, as well as the attacker’s intentions, different techniques are employed. Often this will be a blend of “Probes and Scans”, along with “Unauthorized Access” attempts and “Malicious Code” attacks. When the objective is not spreading or hijacking small systems, a more direct approach is used to attempt a breach of security controls on higher valued targets.
21 http://www.lieb.com/Readings/IBMInfoWar.pdf

21
IBM Security Systems IBM X-Force 2012 Trend and Risk Report
When step 4. Advancement is necessary, nearly all of the previously mentioned Security Incident categories come into play, with “Probes and Scans” brought to bear to find good candidates for the next attack. Once a target is identified, tools that fit into “Unauthorized Access”, “Malicious Code”, and “Inappropriate Use” categories will be seen. Often, abuse of system resources, represented by the “Inappropriate Use” category can lead to a security breach. Detecting policy violations involving peer-to-peer file sharing can aid administrators when looking for small breaches that might lead to larger future problems .
The last three steps, 5. Stealth, 6. Listening post, and 7. Takeover use the tools of the previous four steps to accomplish their goals. This sets an expectation that we should see a great deal of activity in the “Probes and Scans” category, followed by activity in the “Malicious Code” category and a slight lull in “Probes and Scans”. Examples in 2012 can be coarsely seen in March and April, or September and October.
Section I—Threats > IBM Managed Security Services—A global threat landscape > MSS—2012 security incident trends
Finally, there are outright attempts to defame or to destroy a site. These efforts are fairly rare and normally temporary, since they can be defused once a source is determined (denial of service).
The relative volume of the various security incident categories gives us a hint that the main focus in 2012 may have been the subversion of systems,
with larger coordinated attacks being executed across fairly broad swaths of the Internet. The clusters of activity that follow the general outline of catapults and grappling hooks is growing. The efforts to identify potential victims, deploy a range of attacks, and then try to exploit a vulnerability is becoming more organized. Future analysis will tell us a good deal more about these trends.
MSS - Ranking the Volume and Type of Security Incidents2012
0%
5%
10%
15%
20%
25%
30%
35%
40%
45%
SI Malicious Code
SI Probes and Scans
SI Unauthorized Access
SI Inappropriate Use
SI Denial of Service
% o
f E
scal
ated
Ale
rts
Figure 5: MSS – Ranking the Volume and Type of Security Incidents in 2012
22
IBM Security Systems IBM X-Force 2012 Trend and Risk Report
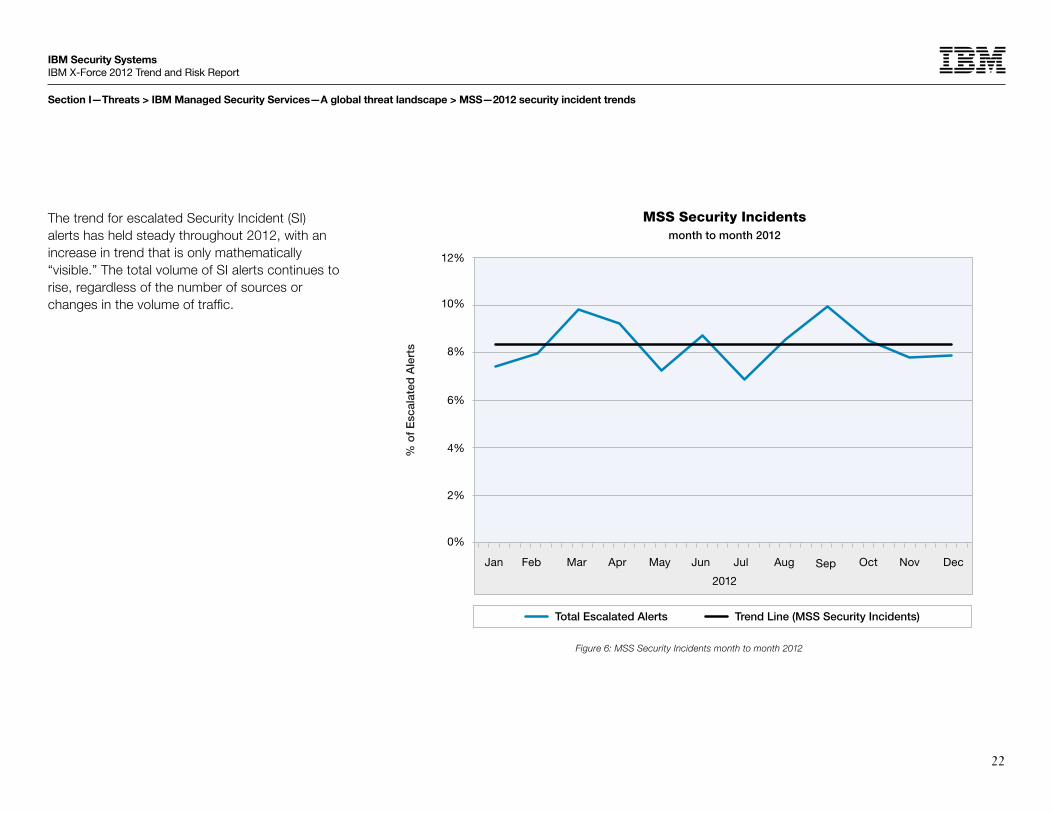
The trend for escalated Security Incident (SI) alerts has held steady throughout 2012, with an increase in trend that is only mathematically “visible.” The total volume of SI alerts continues to rise, regardless of the number of sources or changes in the volume of traffic.
Section I—Threats > IBM Managed Security Services—A global threat landscape > MSS—2012 security incident trends
MSS Security Incidentsmonth to month 2012
Jan Feb Mar Apr
2012
May Jun Jul Aug Sep Oct Nov Dec
Total Escalated Alerts Trend Line (MSS Security Incidents)
0%
2%
4%
6%
8%
10%
12%
% o
f E
scal
ated
Ale
rts
Figure 6: MSS Security Incidents month to month 2012
23
IBM Security Systems IBM X-Force 2012 Trend and Risk Report
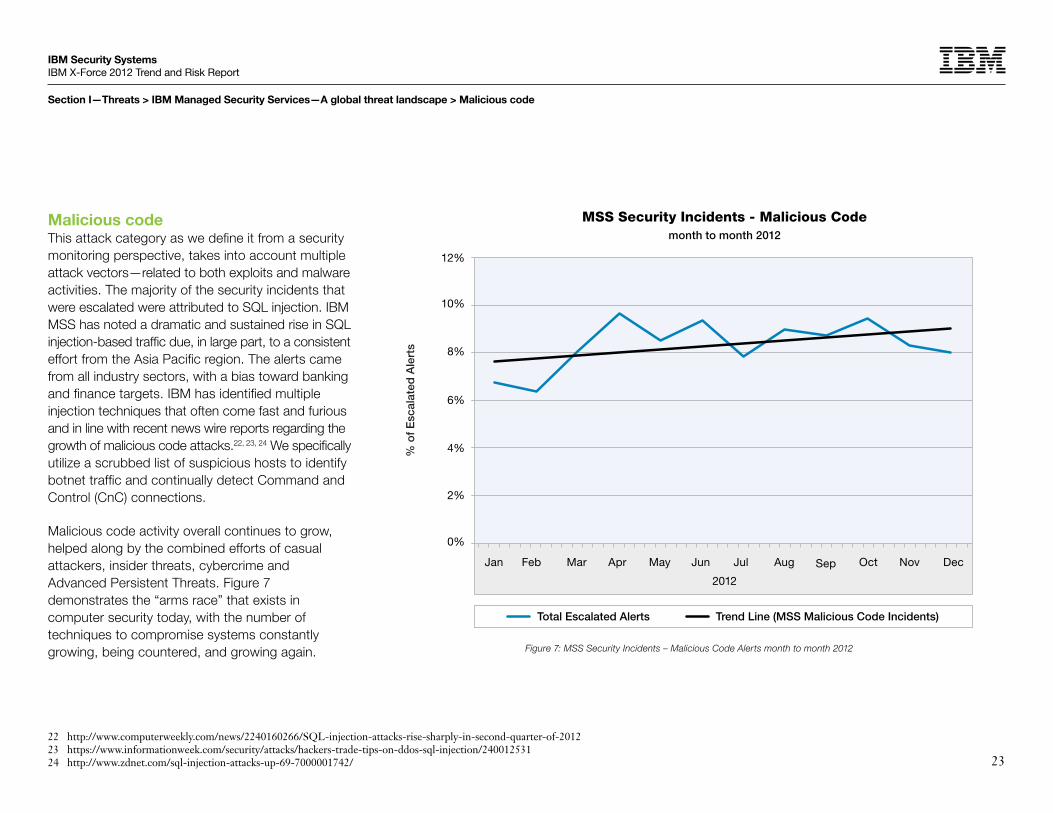
Malicious codeThis attack category as we define it from a security monitoring perspective, takes into account multiple attack vectors—related to both exploits and malware activities. The majority of the security incidents that were escalated were attributed to SQL injection. IBM MSS has noted a dramatic and sustained rise in SQL injection-based traffic due, in large part, to a consistent effort from the Asia Pacific region. The alerts came from all industry sectors, with a bias toward banking and finance targets. IBM has identified multiple injection techniques that often come fast and furious and in line with recent news wire reports regarding the growth of malicious code attacks.22, 23, 24 We specifically utilize a scrubbed list of suspicious hosts to identify botnet traffic and continually detect Command and Control (CnC) connections.
Malicious code activity overall continues to grow, helped along by the combined efforts of casual attackers, insider threats, cybercrime and Advanced Persistent Threats. Figure 7 demonstrates the “arms race” that exists in computer security today, with the number of techniques to compromise systems constantly growing, being countered, and growing again.
Section I—Threats > IBM Managed Security Services—A global threat landscape > Malicious code
MSS Security Incidents - Malicious Codemonth to month 2012
Jan Feb Mar Apr
2012
May Jun Jul Aug Sep Oct Nov Dec
Total Escalated Alerts Trend Line (MSS Malicious Code Incidents)
0%
2%
4%
6%
8%
10%
12%
% o
f E
scal
ated
Ale
rts
Figure 7: MSS Security Incidents – Malicious Code Alerts month to month 2012
22 http://www.computerweekly.com/news/2240160266/SQL-injection-attacks-rise-sharply-in-second-quarter-of-201223 https://www.informationweek.com/security/attacks/hackers-trade-tips-on-ddos-sql-injection/24001253124 http://www.zdnet.com/sql-injection-attacks-up-69-7000001742/

24
IBM Security Systems IBM X-Force 2012 Trend and Risk Report
Probes and scansVulnerability scanning is one of the foundation methods for evaluating a system’s security posture. The tools and technologies employed are so essential to a system’s operation that both attackers and defenders use the same tool to decide whether or not a system is a good candidate for a cracking effort. This technology is so mature and so effective, that it has been incorporated into some attack tool kits and worms to identify potential victims.
The Probes and Scans alert analyzes the same technologies that a vulnerability scanner would use, such as keeping track of where a scan comes from and checking it against a known scanning tool or service. The monitoring system uses data gathered from system users and responsible parties to decide whether or not a scan comes from an authorized source. Scans or sweeps that have been identified to the system as authorized are noted, but do not generate alerts. Activity that is not authorized is escalated for review by a human operator and alerts are added to be used in other types of analysis by the monitoring system to decide whether further escalations are necessary.
Figure 8 shows a general upward trend, at the moment, consistent with growth in attack reconnaissance.
Section I—Threats > IBM Managed Security Services—A global threat landscape > Probes and scans
MSS Security Incidents - Probes and Scansmonth to month 2012
Jan Feb Mar Apr
2012
May Jun Jul Aug Sep Oct Nov Dec
Total Escalated Alerts Trend Line (MSS Probes and Scans Incidents)
0%
2%
4%
6%
8%
10%
12%
14%
16%
% o
f E
scal
ated
Ale
rts
Figure 8: MSS Security Incidens – Probe and Scan Alerts month to month 2012

25
IBM Security Systems IBM X-Force 2012 Trend and Risk Report
Unauthorized access attempts2012 proved to be a banner year for unauthorized access attempts. This attack vector has always been vigorous, but was especially vibrant this past year. The top individual attacks in this classification were FTP Brute Force, HTTP Cisco IOS Admin Access, Unix Password File Access Attempt and PSExec Service Access. HTTP based password file access attempts were also of interest as a distinct spike observable early in the year, around March, and as a lesser spike in September. None of these access attempts can be tied to any single group or motive. These efforts were widespread, and no specific region stood out as being responsible.
Unauthorized Access attempts include backdoor attacks, brute force attacks, specialized one-shot attacks, and other means to try to break into customer systems. The MSS monitoring system routinely tracks several hundred unauthorized access attacks at any given time, with fewer than 200 escalating to the point of becoming a tangible threat to our customers.
Figure 9 demonstrates a general downward trend. However, if the cyclical nature of past trends are any indicator, the downward trend is likely a temporary condition.
Section I—Threats > IBM Managed Security Services—A global threat landscape > Unauthorized access attempts
MSS Security Incidents - Unauthorized Access Attemptsmonth to month 2012
Jan Feb Mar Apr
2012
May Jun Jul Aug Sep Oct Nov Dec
Total Escalated Alerts Trend Line (MSS Unauthorized Access Incidents)
0%
2%
4%
6%
8%
10%
12%
14%
16%
% o
f E
scal
ated
Ale
rts
Figure 9: MSS Security Incidents – Unauthorized Access Attempts month to month 2012

26
IBM Security Systems IBM X-Force 2012 Trend and Risk Report
Inappropriate useInappropriate use events are typically warnings of resource misuse or abuse, such as file sharing or peer-to-peer servers and clients operating where they are not authorized. This group of alerts can also indicate early signs of attacks, such as brute force efforts to obtain a user ID access to a system.
SSH Brute Force attacks were the main contributor for this attack category throughout the year. Based largely in the Asia Pacific region, this type of attack has been seen many times in the form of distributed attempts from multiple external sources and is currently experiencing a rising trend. Peer-to-peer (P2P) traffic was also responsible for the upward event count trend for Inappropriate Use-based traffic. P2P traffic represents a definitive risk to any business network, as it can open doors to individual host systems that may contain both sensitive and personal information. P2P based detection is strictly policy based and is not enabled by default. We recommend that all P2P based signatures be enabled in blocking mode when possible.
Because of the diversity within this group, there is significant variability, as policy violations are cleaned up and authentication systems are strengthened. This process causes a short duration “lull” in activity which is referenced by Figure 10.
Section I—Threats > IBM Managed Security Services—A global threat landscape > Inappropriate use
MSS Security Incidents - Inappropriate Use Attemptsmonth to month 2012
Jan Feb Mar Apr
2012
May Jun Jul Aug Sep Oct Nov Dec
Total Escalated Alerts Trend Line (MSS Inappropriate Use Incidents)
0%
2%
4%
6%
8%
10%
12%
14%
16%
% o
f E
scal
ated
Ale
rts
Figure 10: MSS Security Incidents – Inappropriate Use Attempts month to month 2012

27
IBM Security Systems IBM X-Force 2012 Trend and Risk Report
Denial of service (DoS)DoS attacks primarily attempt to make some part of a system unavailable to the intended users, often by tying up or breaking some vital communications method. A frequent counter to this is to regulate connection types and speeds at the network layer of an architecture. As a counter, the attackers have deployed solutions like SlowLoris, which uses minimal network bandwidth while taking down web services. This “arms race” continues to unfold in our computing infrastructures around the world.
The news media has reported extensively in 2012 of Denial of Service (DoS) attacks that have been conducted by various groups.25,26,27 Speaking in terms of risk, DoS can degrade or deny availability for about 12 hours each year. 24 hour outages from DoS can occur, but are toward the extreme end of the duration spectrum. DoS attacks can easily cost between $600,000 to $1 million each year, mostly in Data Center costs incurred while losing operations.28 While there may be a short term
Section I—Threats > IBM Managed Security Services—A global threat landscape > Denial of service (DoS)
25 http://itcblogs.currentanalysis.com/2012/08/31/hacktivists-have-the-upper-hand-in-an-environment-where-most-attacks-go-unreported/26 https://cyber.law.harvard.edu/events/luncheon/2013/01/sauter27 http://blog.q1labs.com/2012/05/16/back-to-the-future-in-the-uk/28 http://emersonnetworkpower.com/en-US/Brands/Liebert/Documents/White%20Papers/data-center-uptime_24661-R05-11.pdf
MSS Security Incidents - Denial of Servicemonth to month 2012
Jan Feb Mar Apr
2012
May Jun Jul Aug Sep Oct Nov Dec
Total Escalated Alerts Trend Line (MSS DoS Incidents)
0%
5%
10%
15%
20%
25%
30%
35%
% o
f E
scal
ated
Ale
rts
Figure 11: MSS Security Incidents – Denial of Service Alerts month to month 2012

28
IBM Security Systems IBM X-Force 2012 Trend and Risk Report
Section I—Threats > IBM Managed Security Services—A global threat landscape > Denial of service (DoS)
29 http://www.bankinfosecurity.com/bank-attacks-what-have-we-learned-a-519730 Ibid.31 http://www.dw.de/cyber-attack-victims-fear-exposure/a-1624553532 https://www14.software.ibm.com/webapp/iwm/web/signup.do?source=gts-LITS-bus-conn-NA&S_PKG=2012RepRisk&S_TACT=601B666W33 http://www.bankinfosecurity.com/interviews/luba-i-169634 http://www.ponemon.org/local/upload/file/2012_US_Cost_of_Cyber_Crime_Study_FINAL6%20.pdf35 http://www.businessinsurance.com/article/20120411/NEWS07/120419975#sthash.caTs1Po7.dpuf36 http://www.forbes.com/sites/ciocentral/2012/05/08/figuring-ddos-attack-risks-into-it-security-budgets/
financial impact, DoS attacks do not seem to create lasting damage for a business or brand over time. Characteristically, the widely publicized attacks have been more of a public relations war than a serious level of damage to anyone’s assets,29,30 with downtime costs being the primary damage. Many victims have concluded that the potential cost of disclosing the attack to the public might lead to damage to their reputation, compounding their losses.31 Recent surveys about reputation and brand management indicate the opposite seems to be true,32,33 but awareness of this difference is slow to spread.
And while serious DoS attacks are rare when compared with other types of attacks,34 they are usually surprising, effective, and often unheralded in the mass media.35,36
Figure 11 demonstrates the sudden and somewhat ephemeral nature of DoS attacks, which appear and then disappear. Various events persist at some low level across the Internet, surging occasionally, like the previously mentioned Slowloris attacks, and others, are discontinuous, appearing and disappearing, rarely from the same source.

29
IBM Security Systems IBM X-Force 2012 Trend and Risk Report
Injection attacksInjection attacks are identified when data items that contain embedded commands are presented to authorized applications on the target systems, which are tricked into executing the commands. These attempts continue to be a dominant element in the security landscape. Security alert trends identify a fairly steep rise in confirmed injection attacks. It is an easy way for an attacker to gain a foothold on a server. Once that foothold is established, the attacker gains a strategic advantage that provides a launching point for attacking more of the target system, and potentially creating a springboard to reach other systems inside the perimeter defenses.
Section I—Threats > IBM Managed Security Services—A global threat landscape > Injection attacks
MSS Injection Attacks as a Percentage of Malicious Code Alertsmonth to month 2012
Jan Feb Mar Apr
2012
May Jun Jul Aug Sep Oct Nov Dec
Total Escalated Alerts Trend Line (Injection Attacks)
% o
f M
alic
ious
Co
de
Ale
rts
0%
5%
10%
15%
20%
25%
30%
35%
40%
0%
5%
10%
15%
20%
25%
30%
35%
40%
Figure 12: MSS – Injection Attacks as a Percentage of Malicious Code Alerts – month to month 2012

30
IBM Security Systems IBM X-Force 2012 Trend and Risk Report
Two of the most common types of injection attacks are SQL injection and Shell Command injection. Interpreter and LDAP injection use similar tactics, but are more restricted in results. In previous reports, the SQL_Injection signature ranked second in 2010, and climbed to first place in 2011. 2011 became a banner year for exploiting SQL weaknesses. SQL injection retained the number one position for the first half of 2012, and continues the trend at year’s end.
Shell Command injection is a form of Remote Command Execution (RCE) that has maintained a steady presence in attack kits since it was discovered.37 Because shell commands are specific to operating systems, the attack method is not as popular as SQL injection. SQL is more ubiquitous because it interfaces to all types of databases, which entice attacks—from login credentials to confidential enterprise data.
Section I—Threats > IBM Managed Security Services—A global threat landscape > Injection attacks
Injection Attacks overall are showing distinct growth, effectively doubling over the course of 2012. The tactics which attack a system through the data channels are a clear continuation of targeting the “soft targets” that we discussed two years ago.
Another trend that bears watching is the steady growth of injection attacks buried within or mixed with malicious code attacks. As can be observed in the Malicious Code section discussed in figure 12, the growth of malicious code attacks continues, but the addition of injection attacks associated with the malware is expanding at a much higher rate. Malicious code growth trends show a 2% growth over the course of 2012, while the growth of associated injection attacks has nearly tripled.
We will be watching this emerging model closely, looking for changes in the success rates for this tactic.
37 http://xforce.iss.net/xforce/xfdb/6944

31
IBM Security Systems IBM X-Force 2012 Trend and Risk Report
Exploit kits: the Java connection In 2012 we observed an upsurge in web browser exploit kit development and activity; the primary driver of which are the new Java vulnerabilities.
Login Page of the Crimepack Exploit Kit
Web browser exploit kits (also known as exploit packs) are built for one particular purpose, and that is to install malware on end-user systems. Exploit kits first began to appear in 2006 and are provided by their authors to attackers wanting to install their malware on a large number of systems. They continue to be popular because they provide attackers with a turnkey solution for installing malware on end-
Section I—Threats > Exploit kits: the Java connection
user systems. Exploit kits are usually advertised via hacker forums and the current rental prices vary from around $500 USD to over $1,000 USD per month or $500 USD to over $3,000 USD to buy.
Users are usually infected by visiting a compromised website or by clicking a link that leads them to a booby-trapped website which hosts the exploit kit. To increase the rate of successful infections, exploit kits often attempt to exploit multiple browser or
browser plug-in vulnerabilities to compromise a system in order to install malware (see screenshot below). In 2012, it was clear that exploit kit authors were favoring the use of exploits targeting newly discovered Java vulnerabilities, so the question is, why Java? Other zero-day vulnerabilities (unpatched vulnerabilities in which an exploit code is circulating) were discovered last year, but it seems that Java vulnerabilities are the ones the piqued the interest of exploit kit authors the most.
Dashboard of the Blackhole Exploit Kit (screenshot was part of an advertisement by the exploit kit author in a hacker forum)

32
IBM Security Systems IBM X-Force 2012 Trend and Risk Report
First, let’s take look at how exploits for Java vulnerabilities are integrated into exploit kits over time, as this will show us the level of interest exploit kit authors have in incorporating Java exploits into their kits.
Section I—Threats > Exploit kits: the Java connection > CVE-2012-0507 timeline
CVE-2012-0507 timelineThis vulnerability was responsibly disclosed to Oracle and details of this vulnerability were later published by the discoverer in late February.38 A month later, after the details of the vulnerability were released, a working exploit was integrated into the Blackhole39 exploit kit, and within a few days, into the Phoenix40
exploit kit. Then, in early May, an exploit for this same vulnerability was seen in the RedKit41 exploit kit. Considering that a patch was available from Oracle on February 14th, it indicates that attackers believe that organizational and individual patch uptake is infrequent enough to be successful with exploits for recently patched vulnerabilities.
Jan 2012
Feb 2012
Feb 2012Vulnerability Patched
Mar 2012Blackhole
May 2012RedKit
Feb 2012Vulnerability Details
PublishedApr 2012Phoenix
Mar 2012 Apr 2012 May 2012 Jun 2012 Jul 2012 Aug 2012 Sep 2012 Oct 2012 Nov 2012 Dec 2012
Dec 2012
Figure 13: CVE-2012-0507 Timeline
38 http://weblog.ikvm.net/PermaLink.aspx?guid=cd48169a-9405-4f63-9087-798c4a1866d339 http://malware.dontneedcoffee.com/2012/04/cve-2012-0507-on-windows-xp.html40 http://malware.dontneedcoffee.com/2012/04/phoenix-exploit-kit-v31.html41 http://blog.spiderlabs.com/2012/05/a-wild-exploit-kit-appears.html
33
IBM Security Systems IBM X-Force 2012 Trend and Risk Report
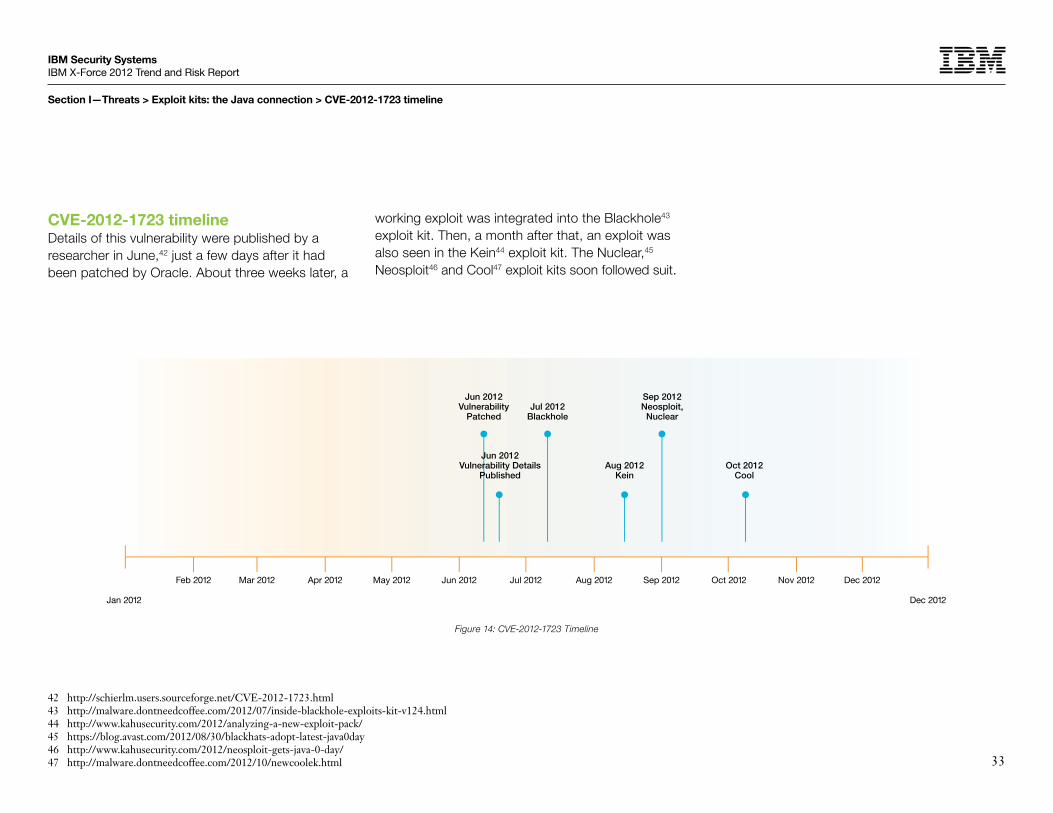
CVE-2012-1723 timelineDetails of this vulnerability were published by a researcher in June,42 just a few days after it had been patched by Oracle. About three weeks later, a
Section I—Threats > Exploit kits: the Java connection > CVE-2012-1723 timeline
working exploit was integrated into the Blackhole43 exploit kit. Then, a month after that, an exploit was also seen in the Kein44 exploit kit. The Nuclear,45 Neosploit46 and Cool47 exploit kits soon followed suit.
Jan 2012
Feb 2012
Jun 2012Vulnerability
PatchedJul 2012
Blackhole
Sep 2012Neosploit,
Nuclear
Jun 2012Vulnerability Details
PublishedAug 2012
KeinOct 2012
Cool
Mar 2012 Apr 2012 May 2012 Jun 2012 Jul 2012 Aug 2012 Sep 2012 Oct 2012 Nov 2012 Dec 2012
Dec 2012
Figure 14: CVE-2012-1723 Timeline
42 http://schierlm.users.sourceforge.net/CVE-2012-1723.html43 http://malware.dontneedcoffee.com/2012/07/inside-blackhole-exploits-kit-v124.html44 http://www.kahusecurity.com/2012/analyzing-a-new-exploit-pack/45 https://blog.avast.com/2012/08/30/blackhats-adopt-latest-java0day46 http://www.kahusecurity.com/2012/neosploit-gets-java-0-day/47 http://malware.dontneedcoffee.com/2012/10/newcoolek.html
34
IBM Security Systems IBM X-Force 2012 Trend and Risk Report
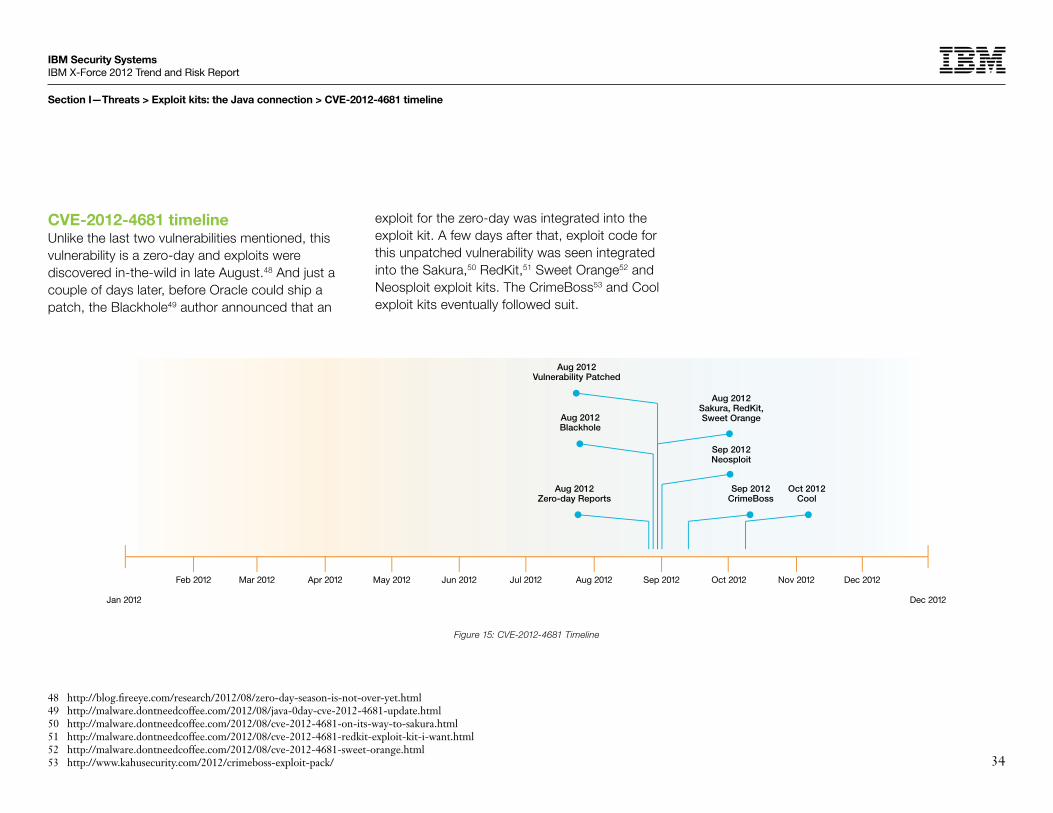
CVE-2012-4681 timelineUnlike the last two vulnerabilities mentioned, this vulnerability is a zero-day and exploits were discovered in-the-wild in late August.48 And just a couple of days later, before Oracle could ship a patch, the Blackhole49 author announced that an
Section I—Threats > Exploit kits: the Java connection > CVE-2012-4681 timeline
exploit for the zero-day was integrated into the exploit kit. A few days after that, exploit code for this unpatched vulnerability was seen integrated into the Sakura,50 RedKit,51 Sweet Orange52 and Neosploit exploit kits. The CrimeBoss53 and Cool exploit kits eventually followed suit.
Jan 2012
Feb 2012 Mar 2012 Apr 2012 May 2012 Jun 2012 Jul 2012 Aug 2012 Sep 2012 Oct 2012 Nov 2012 Dec 2012
Dec 2012
Aug 2012Blackhole
Aug 2012Vulnerability Patched
Oct 2012Cool
Aug 2012Zero-day Reports
Sep 2012CrimeBoss
Sep 2012Neosploit
Aug 2012Sakura, RedKit,Sweet Orange
Figure 15: CVE-2012-4681 Timeline
48 http://blog.fireeye.com/research/2012/08/zero-day-season-is-not-over-yet.html49 http://malware.dontneedcoffee.com/2012/08/java-0day-cve-2012-4681-update.html50 http://malware.dontneedcoffee.com/2012/08/cve-2012-4681-on-its-way-to-sakura.html51 http://malware.dontneedcoffee.com/2012/08/cve-2012-4681-redkit-exploit-kit-i-want.html52 http://malware.dontneedcoffee.com/2012/08/cve-2012-4681-sweet-orange.html53 http://www.kahusecurity.com/2012/crimeboss-exploit-pack/

35
IBM Security Systems IBM X-Force 2012 Trend and Risk Report
Interest in Java exploitsWhat is evident from the timelines is the degree of adoption of Java exploits into exploit kits. Within a span of two to three months, after an exploit code is made available or detailed information is published, three to four exploit kits will have the Java exploit integrated, and more so if the vulnerability being exploited is a zero-day.
There were other zero-day vulnerabilities discovered in 2012, such as CVE-2012-1875 and CVE-2012-4969; both of which are vulnerabilities in Internet Explorer, and both have exploit code publicly available. However, these vulnerabilities haven’t received the same level of interest from exploit kit authors as the Java vulnerabilities have.
Section I—Threats > Exploit kits: the Java connection > Interest in Java exploits > But why Java?
But why Java?The reason exploit kit authors seem to prioritize Java exploits in their kits can be explained by looking at the main goal of these mass exploit kits—which is to successfully infect the highest number of systems possible. Exploiting Java certainly fits the bill since Java has the following important characteristics:
1. Reliable exploitation. Exploits written for Java vulnerabilities, particularly logic vulnerabilities leading to a Java Virtual Machine (JVM) sandbox bypass, are very reliable and do not need to circumvent exploit mitigations in modern operating systems, such as Address Space Layout Randomization (ASLR), Data Execution Prevention (DEP) and various memory protection mechanisms. Therefore, JVM sandbox escape exploits ensure a high rate of success when they are attacking a large number of systems.
2. Unsandboxed plugin. The Java plugin is a preferable target because it runs without a process sandbox. This means that once the
Java plugin is compromised by an exploit, an attacker will be able install persistent malware on the system without the need to exploit a separate privilege elevation vulnerability. This is in contrast to the newer versions of other popular plugins, such as Adobe Reader and Adobe Flash Player, which are now running in a sandbox. From the perspective of an exploit kit author, this provides an easy route to install persistent malware on exploited systems.
3. Multi-browser and cross-platform. Any browser that has a vulnerable Java plugin installed can be a potential target. This equates to a higher number of systems that can be attacked. Moreover, because Java is available on multiple operating systems, it is also a cross-platform attack opportunity. The cross-platform opportunity is interesting because it is one of the primary ways that drive-by downloads are affecting the Mac OS X platform. An example of such an attack is the Flashback malware outbreak that we reported in the IBM X-Force 2012 Mid-year Trend and Risk report.

36
IBM Security Systems IBM X-Force 2012 Trend and Risk Report
A recent update to Java that, by default, warns the user before running unsigned Java applications in the browser is certainly a welcome first step in making Java exploits less favorable to attackers. Additionally, steps performed by browser and operating system vendors such as Mozilla (for Firefox), Google (for Chrome), and Apple (for OS X) to disable or prevent the automatic loading of outdated plugins is another welcomed approach in preventing the exploitation of already-patched vulnerabilities.
Conclusion and action stepsThe surge of Java sandbox escape discoveries will likely entice security researchers and malicious attackers alike to look more closely at the Java sandbox implementation to find similar flaws. Exploit kit authors, on the other hand, will probably continually be on the watch for these Java vulnerabilities as they are currently one of the key components that affect the success of their kits.
On the receiving end, we should prepare for whatever the next actions of mass exploit kit authors will be. So, in addition to making sure that your browser and browser plugins are up-to-date, these are additional steps that you can take to mitigate attacks from exploit kits:
Section I—Threats > Exploit kits: the Java connection > Conclusion and action steps
• Reduce attack surface. Evaluate whether a browser plugin is absolutely necessary. If it is not, reduce the attack surface by uninstalling it.
Security Tab of the Java Control Panel Specifically for Java, if Java is required to run desktop (standalone) applications, but is not required to run Java applications in the browser, starting with Java 7u10, you can prevent any Java application (signed or unsigned) from running in the browser by unchecking the “Enable Java content
in the browser” option on the Security tab of the Java Control Panel (see screenshot). For older Java versions, US-CERT released a list54 of instructions to disable Java in various browsers.
• Enable Click-to-Play. If your browser supports Click-to-Play, enable it. Click-to-Play prevents the drive-by or “silent” exploitation of browser plugins by requiring an additional user interaction before a plugin can be activated.
• Set the security level of unsigned applications. Specifically for Java, if it is absolutely necessary for you to run Java applications in the browser, starting with Java 7u10, a security level slider is included in the Java Control Panel (see screenshot) to control how unsigned Java applications are executed in the browser. Make sure that the security level is set to “High” or “Very High” depending on your situation. In a “High” setting, which became the default in Java 7u11, the user is prompted before running any unsigned Java applications. A “Very High” setting will automatically prevent unsigned Java applications from running in the browser. More information about the new security levels can be found in the “Setting the Security Level of the Java Client”55 page on the Oracle website.
54 http://www.kb.cert.org/vuls/id/636312#solution55 http://docs.oracle.com/javase/7/docs/technotes/guides/jweb/client-security.html

37
IBM Security Systems IBM X-Force 2012 Trend and Risk Report
It will be interesting to see how exploit developers and exploit kit authors react to the combined efforts of software vendors to add more hurdles for exploiting Java and browser plugins in general. Reducing your attack surface, keeping your software up-to-date, and taking advantage of the security features offered by your browser and browser plugins will help you to better prepare against future attacks.
Section I—Threats > Exploit kits: the Java connection > Conclusion and action steps
38
IBM Security Systems IBM X-Force 2012 Trend and Risk Report
56 According to the site ranking by Alexa: http://www.alexa.com/
IPv6-ready Sites Amongst Top Most Used SitesDecember 2012
0%
5%
10%
15%
20%
25%
Top 100 websites
Top 1,000 websites
Top 10,000 websites
Top 100,000 websites
Top 1,000,000 websites
Section I—Threats > Web content trends > Analysis methodology > IPv6 deployment for websites
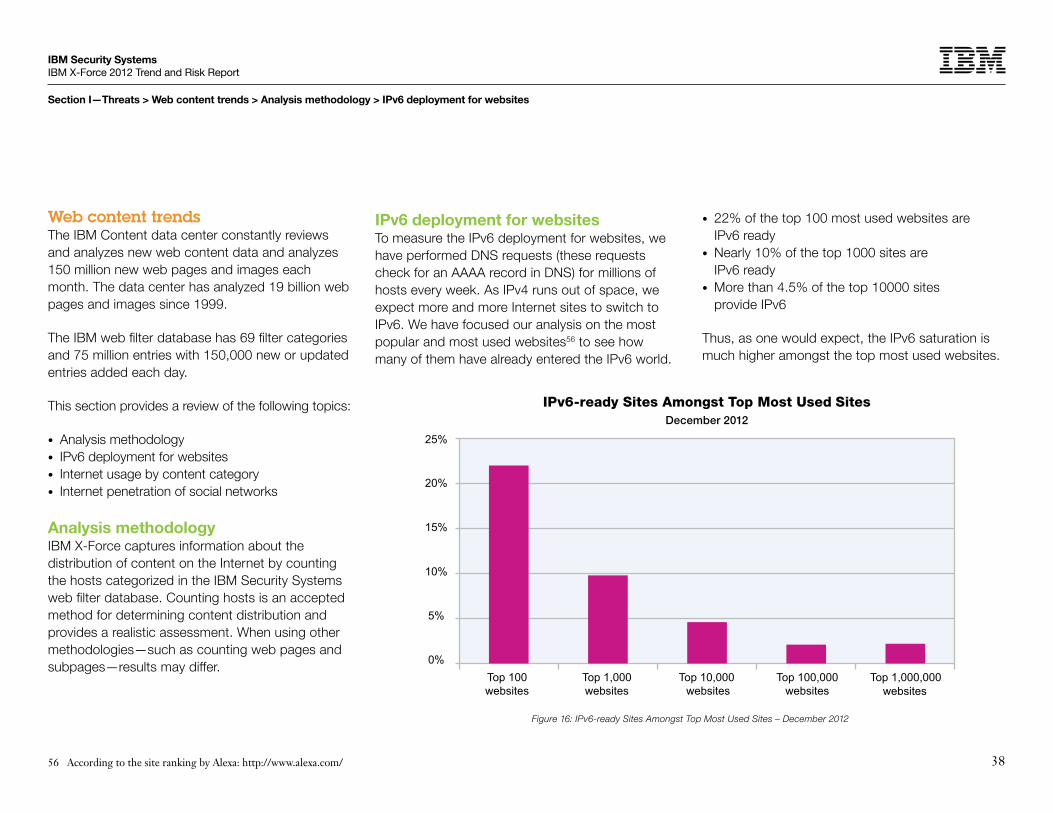
Web content trendsThe IBM Content data center constantly reviews and analyzes new web content data and analyzes 150 million new web pages and images each month. The data center has analyzed 19 billion web pages and images since 1999.
The IBM web filter database has 69 filter categories and 75 million entries with 150,000 new or updated entries added each day.
This section provides a review of the following topics:
• Analysis methodology • IPv6 deployment for websites • Internet usage by content category• Internet penetration of social networks
Analysis methodologyIBM X-Force captures information about the distribution of content on the Internet by counting the hosts categorized in the IBM Security Systems web filter database. Counting hosts is an accepted method for determining content distribution and provides a realistic assessment. When using other methodologies—such as counting web pages and subpages—results may differ.
Figure 16: IPv6-ready Sites Amongst Top Most Used Sites – December 2012
IPv6 deployment for websitesTo measure the IPv6 deployment for websites, we have performed DNS requests (these requests check for an AAAA record in DNS) for millions of hosts every week. As IPv4 runs out of space, we expect more and more Internet sites to switch to IPv6. We have focused our analysis on the most popular and most used websites56 to see how many of them have already entered the IPv6 world.
• 22% of the top 100 most used websites are IPv6 ready
• Nearly 10% of the top 1000 sites are IPv6 ready
• More than 4.5% of the top 10000 sites provide IPv6
Thus, as one would expect, the IPv6 saturation is much higher amongst the top most used websites.
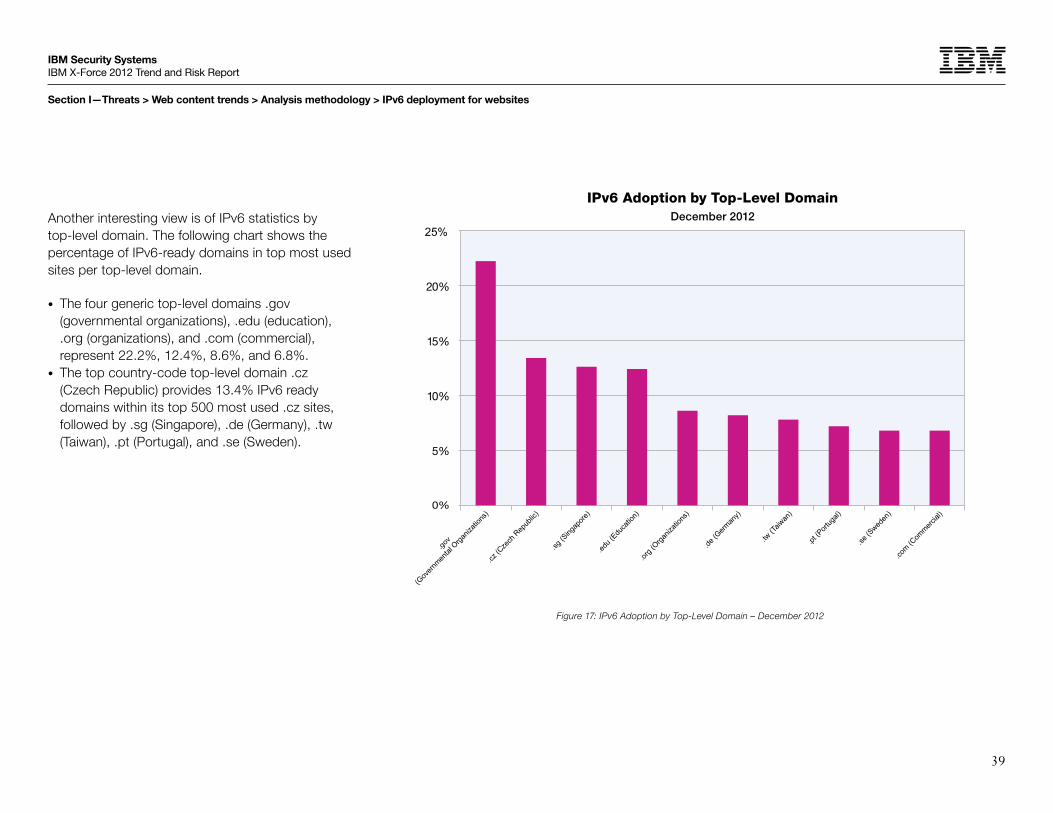
39
IBM Security Systems IBM X-Force 2012 Trend and Risk Report
Section I—Threats > Web content trends > Analysis methodology > IPv6 deployment for websites
Another interesting view is of IPv6 statistics by top-level domain. The following chart shows the percentage of IPv6-ready domains in top most used sites per top-level domain.
• The four generic top-level domains .gov (governmental organizations), .edu (education), .org (organizations), and .com (commercial), represent 22.2%, 12.4%, 8.6%, and 6.8%.
• The top country-code top-level domain .cz (Czech Republic) provides 13.4% IPv6 ready domains within its top 500 most used .cz sites, followed by .sg (Singapore), .de (Germany), .tw (Taiwan), .pt (Portugal), and .se (Sweden).
Figure 17: IPv6 Adoption by Top-Level Domain – December 2012
0%
20%
15%
10%
5%
IPv6 Adoption by Top-Level Domain December 2012
25%
.gov

40
IBM Security Systems IBM X-Force 2012 Trend and Risk Report
57 A web application is an application that is accessed by users over a network such as the Internet or an intranet. Normally web applications are accessed via an Internet Browser and provide interactive features, such as uploading files or posting text. Typical web applications are social networks, web mailers, and social media sites. As a website can belong to more than one content category (e.g. the most social networks are also Web applications) the sum of the percentages is larger than 100 percent. For more details see http://en.wikipedia.org/wiki/Web_application.
Section I—Threats > Web content trends > Internet usage by content category
Internet usage by content categoryWithin the last few years, interactive websites and web applications57 have become more and more popular, not only in private environments but also in a business context. This poses new security challenges, as all kinds of documents can easily be shared by employees via web applications, such as social networks or web mailers. As an example, it might happen that confidential documents are unintentionally uploaded to web applications. In this section we look at the pervasiveness of accessing web applications. Another interesting view is the percentage of access to bad websites, such as sites containing malware.
These numbers are collected from our Filter Database Servers. The Filter Servers host our web filter database, and many of our content filter products use them. Each day we see hundreds of millions of URL requests on these servers. The following numbers are based on these URL requests.
• More than one third of all web access is done on web application sites.
• Approximately 11% of all web traffic is classified as banner advertisements.
• Shopping sites account for 10% of web access; however, in the period before Christmas we see an increase to 11.3%.
Figure 18: Web Usage by Popular Content Categories – 2012 Q4
Web Usage by Popular Content Categories 2012 Q4
0%
5%
10%
15%
20%
25%
30%
35%
40%
S S

41
IBM Security Systems IBM X-Force 2012 Trend and Risk Report
Web Usage by Risky Content Categories2012 Q4
0.00%
0.10%
0.20%
0.30%
0.40%
0.50%
0.60%
0.70%
0.80%
0.90%
Section I—Threats > Web content trends > Internet usage by content category
From previous IBM X-Force Trend and Risk Reports we know that the most popular malicious sites are pornography and gambling/lottery sites. Let’s look at the percentage of web access of these categories in relation to total web access.
• Pornography sites represent 0.79% of all web access.
• Requests to gambling sites represent 0.22%.• Malware sites account for 0.17% of all
web access.• Anonymous proxies still represent 0.07%.
Figure 19: Web Usage By Risky Content Categories – 2012 Q4
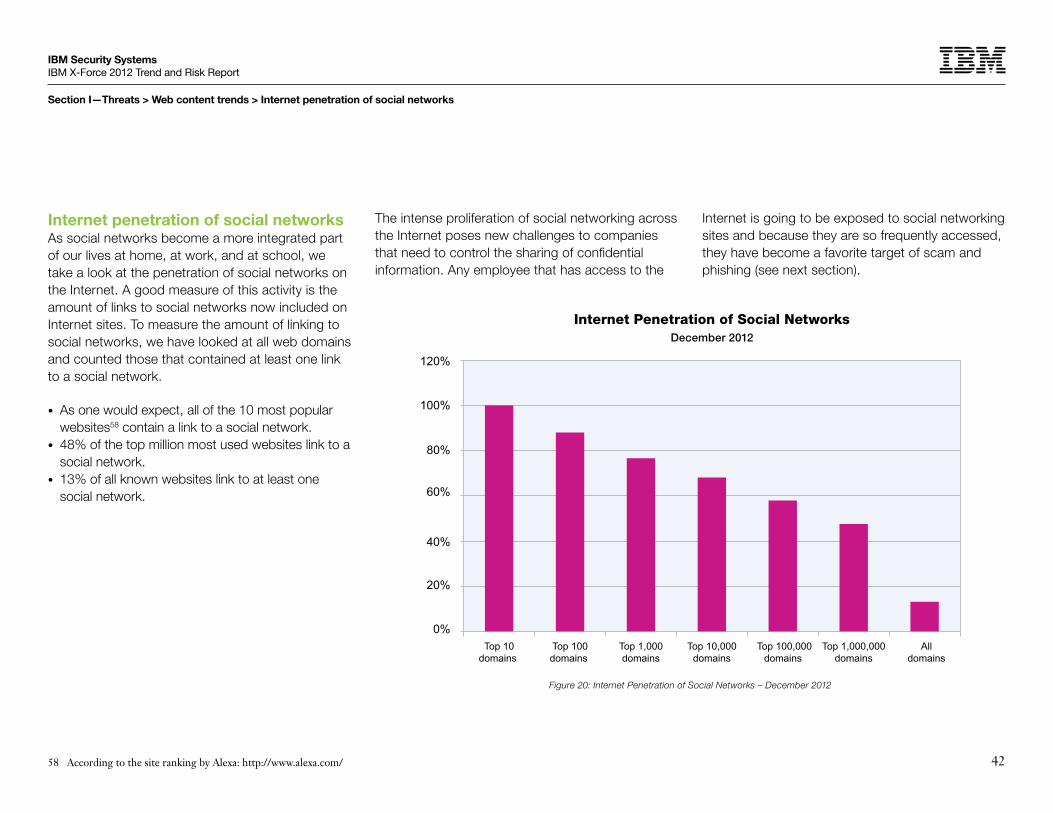
42
IBM Security Systems IBM X-Force 2012 Trend and Risk Report
Section I—Threats > Web content trends > Internet penetration of social networks
Internet penetration of social networksAs social networks become a more integrated part of our lives at home, at work, and at school, we take a look at the penetration of social networks on the Internet. A good measure of this activity is the amount of links to social networks now included on Internet sites. To measure the amount of linking to social networks, we have looked at all web domains and counted those that contained at least one link to a social network.
• As one would expect, all of the 10 most popular websites58 contain a link to a social network.
• 48% of the top million most used websites link to a social network.
• 13% of all known websites link to at least one social network.
Internet Penetration of Social Networks December 2012
0%
20%
40%
60%
80%
100%
120%
Top 10domains
Top 100domains
Top 1,000domains
Top 10,000domains
Top 100,000domains
Top 1,000,000domains
Alldomains
Figure 20: Internet Penetration of Social Networks – December 2012
The intense proliferation of social networking across the Internet poses new challenges to companies that need to control the sharing of confidential information. Any employee that has access to the
Internet is going to be exposed to social networking sites and because they are so frequently accessed, they have become a favorite target of scam and phishing (see next section).
58 According to the site ranking by Alexa: http://www.alexa.com/

43
IBM Security Systems IBM X-Force 2012 Trend and Risk Report
59 The statistics in this report for spam, phishing, and URLs use the IP-to-Country information that comes directly from the five Internet Registries (ARIN, AfriNIC, APNIC, RipeNCC, LacNIC). The geographical distribution was determined by requesting the IP addresses of the hosts (in the case of the content distribution) or of the sending mail server (in the case of spam and phishing) into this IP-to-Country information.
Section I—Threats > Spam and phishing > Slightly increased spam volume in the second term of 2012
Spam and phishingThe IBM spam and URL filter database provides a broad view of spam and phishing attacks. With millions of email addresses being actively monitored, the content team has identified numerous advances in the spam and phishing technologies that attackers use.
Currently, the spam filter database contains more than 40 million relevant spam signatures. Each piece of spam is broken into several logical parts (sentences, paragraphs, and so on). A unique 128-bit signature is computed for each part and for millions of spam URLs. Each day there are approximately one million new, updated, or deleted signatures for the spam filter database. The updates are provided every five minutes.
This section addresses the following topics:
• Slightly increased spam volume in the second term of 2012
• Major spam trends• Email scam and phishing• Spam—country59 of origin trends• Attacker reaction to botnet take downs
0%
20%
40%
60%
80%
100%
120%
140%
160%
Changes in Spam Volume2012 (by month)
Jun JulMayApr Aug Oct NovSep Dec
2012
Jan Feb Mar
Figure 21: Changes in Spam Volume – 2012 (by month)
Slightly increased spam volume in the second term of 2012In early summer, 2012, we saw the lowest spam levels in more than three years. From then until September, spammers increased their volume by more than one third. In October, there was another
drop, but much slighter, as we still saw 20% more spam than in the first half of 2012.
These numbers suggest that there is little activity in this space. The following sections demonstrate the opposite.
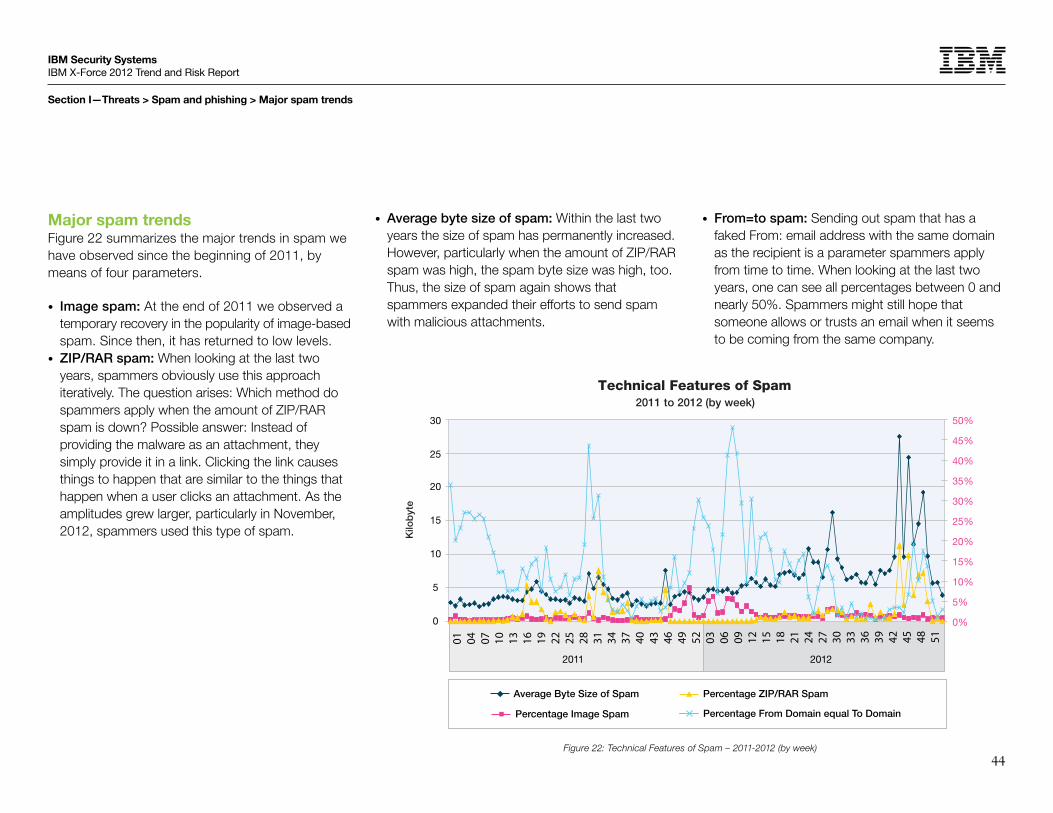
44
IBM Security Systems IBM X-Force 2012 Trend and Risk Report
2011 2012
Technical Features of Spam 2011 to 2012 (by week)
Kilo
byt
e
0%
5%
10%
15%
20%
25%
30%
35%
40%
45%
50%
0
5
10
15
20
25
30
Percentage ZIP/RAR Spam
Percentage Image Spam
Average Byte Size of Spam
Percentage From Domain equal To Domain
01 04 07 10 13 16 19 22 25 28 31 34 37 40 43 46 49 52 03 06 09 12 15 18 21 24 27 30 33 36 39 42 45 48 51
Section I—Threats > Spam and phishing > Major spam trends
Major spam trendsFigure 22 summarizes the major trends in spam we have observed since the beginning of 2011, by means of four parameters.
• Image spam: At the end of 2011 we observed a temporary recovery in the popularity of image-based spam. Since then, it has returned to low levels.
• ZIP/RAR spam: When looking at the last two years, spammers obviously use this approach iteratively. The question arises: Which method do spammers apply when the amount of ZIP/RAR spam is down? Possible answer: Instead of providing the malware as an attachment, they simply provide it in a link. Clicking the link causes things to happen that are similar to the things that happen when a user clicks an attachment. As the amplitudes grew larger, particularly in November, 2012, spammers used this type of spam.
Figure 22: Technical Features of Spam – 2011-2012 (by week)
• Average byte size of spam: Within the last two years the size of spam has permanently increased. However, particularly when the amount of ZIP/RAR spam was high, the spam byte size was high, too. Thus, the size of spam again shows that spammers expanded their efforts to send spam with malicious attachments.
• From=to spam: Sending out spam that has a faked From: email address with the same domain as the recipient is a parameter spammers apply from time to time. When looking at the last two years, one can see all percentages between 0 and nearly 50%. Spammers might still hope that someone allows or trusts an email when it seems to be coming from the same company.
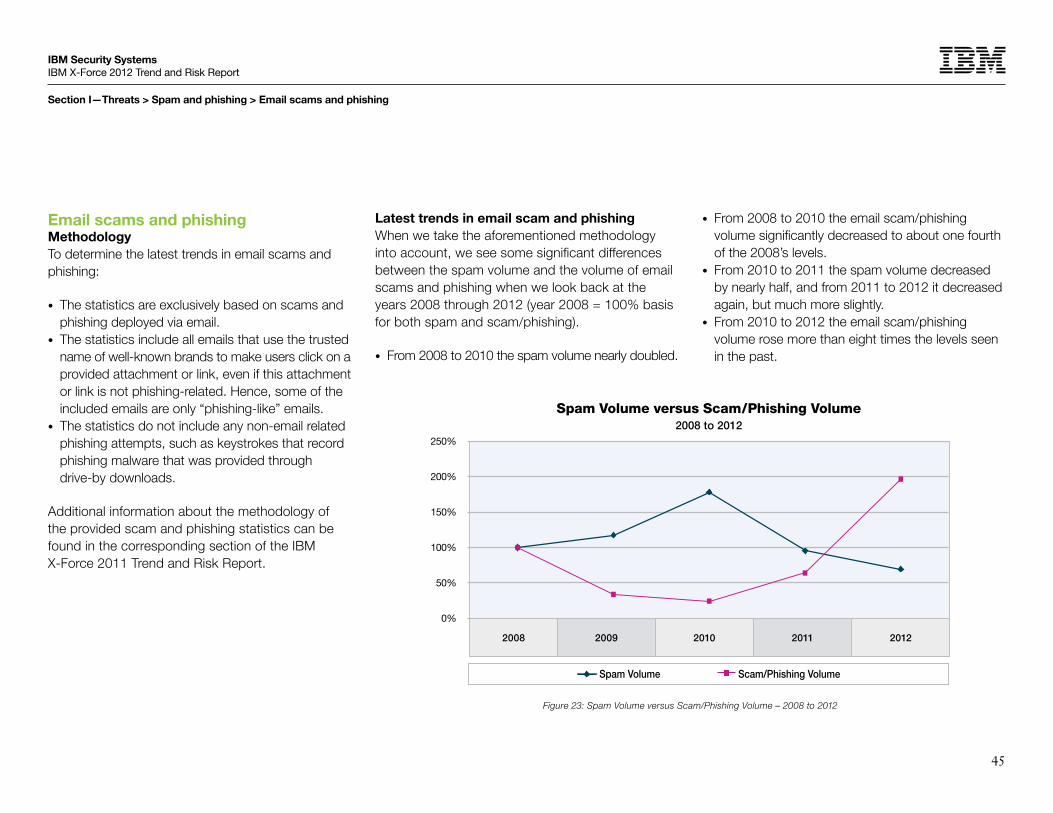
45
IBM Security Systems IBM X-Force 2012 Trend and Risk Report
Section I—Threats > Spam and phishing > Email scams and phishing
Email scams and phishingMethodologyTo determine the latest trends in email scams and phishing:
• The statistics are exclusively based on scams and phishing deployed via email.
• The statistics include all emails that use the trusted name of well-known brands to make users click on a provided attachment or link, even if this attachment or link is not phishing-related. Hence, some of the included emails are only “phishing-like” emails.
• The statistics do not include any non-email related phishing attempts, such as keystrokes that record phishing malware that was provided through drive-by downloads.
Additional information about the methodology of the provided scam and phishing statistics can be found in the corresponding section of the IBM X-Force 2011 Trend and Risk Report.
Figure 23: Spam Volume versus Scam/Phishing Volume – 2008 to 2012
Spam Volume versus Scam/Phishing Volume2008 to 2012
20092008 2010 20122011
Spam Volume Scam/Phishing Volume
0%
50%
100%
150%
200%
250%
Latest trends in email scam and phishingWhen we take the aforementioned methodology into account, we see some significant differences between the spam volume and the volume of email scams and phishing when we look back at the years 2008 through 2012 (year 2008 = 100% basis for both spam and scam/phishing).
• From 2008 to 2010 the spam volume nearly doubled.
• From 2008 to 2010 the email scam/phishing volume significantly decreased to about one fourth of the 2008’s levels.
• From 2010 to 2011 the spam volume decreased by nearly half, and from 2011 to 2012 it decreased again, but much more slightly.
• From 2010 to 2012 the email scam/phishing volume rose more than eight times the levels seen in the past.

46
IBM Security Systems IBM X-Force 2012 Trend and Risk Report
Section I—Threats > Spam and phishing > Email scams and phishing
To conclude, spam volume and the volume of scams and phishing behave contrarily. Even if there were only minor changes in the spam volume, the trend from traditional spam towards scams was significant.
When looking into the types of email scams and phishing some more interesting trends become visible.
From the many ups and downs one can derive that scammers rotate the “carousel” of their targets. In 2012, they focused on non-profit organizations, social networks, parcel services, imitated confirmations and invoices from online shops, as well as scanner and fax scams (such as the “Corporate eFax message”). In many cases these scams have the above mentioned ZIP attachments.
Figure 24: Scam/Phishing Targets by Industry – 2009 to 201260
2009 2010 20122011
Scam/Phishing Targets by Industry2009 to 2012
0%
10%
20%
30%
40%
50%
60%
70%
80%
90%
100%
Auctions Credit Cards Financial Institutions Governmental Organizations Payment / Shops / Confirmations / Invoices Scanners / Fax Social Networks Parcel Services Nonprofit Organizations
Q1 Q2 Q3 Q4 Q1 Q2 Q3 Q4 Q1 Q2 Q3 Q4 Q1 Q2 Q3 Q4
60 The numbers concerning social networks, parcel services, and nonprofit organizations were not recorded before the beginning of 2010, the numbers of scanners / fax were not stored before the beginning of 2012.

47
IBM Security Systems IBM X-Force 2012 Trend and Risk Report
Q3 Q4Q1 Q2 Q3 Q4Q1 Q2
2011 2012
IndiaRomania
USASouth Korea Brazil
Vietnam SpainRussia
PeruAustralia
0%
5%
10%
15%
20%
25%
Indonesia Saudi Arabia
Spam Origins by Quarter2011 to 2012
Section I—Threats > Spam and phishing > Spam—country of origin trends
Spam—country of origin trendsWhen looking at the countries that sent out the most spam over the last two years, some interesting long-term trends become visible.
• India dominates the scene by a large margin, sending out more than 20% of all spam in autumn, 2012. This might be the result of a 25% growth in Indian Internet users over the past 12 months.61 It is the first time that a country sends out more than 20% of all spams. However, at the end of the year they fell back to less than 11%, but are still on the top of the spam-sending countries.
• The USA sent more than 8% of all spam during the last nine months.
• Vietnam was runner-up in the second term of 2011 but sent out less than 6% of all spam in the second term of 2012.
Figure 25: Spam Origins per Quarter – 2011 to 2012
• Peru and Spain have entered the top five for the first time, sending out more than 5% of all spam each at the end of 2012.
• Saudi Arabia was runner-up in the third quarter of 2012, sending out nearly 13% of all spam.
• India and Saudi Arabia—the top two in Q3 of 2012—significantly declined by about 10% each in Q4. They were replaced not only by Peru and Spain (as mentioned above) but also by Colombia (sending out 3.4%), China (3.3%), United Kingdom (2.7%), and Turkey (2.5%) in Q4.
61 http://www.bbc.co.uk/news/business-16354076

48
IBM Security Systems IBM X-Force 2012 Trend and Risk Report
Section I—Threats > Spam and phishing > Spam—country of origin trends
It is interesting that a peak in spam sent from Saudi Arabia occurred in autumn, 2012. Let’s dig into some details.
When looking at shorter time frames we see that Saudi Arabia sent out large amounts of spam between the middle of July (week 28) and the beginning of September (week 36). At the beginning of August (week 32) they even beat India and sent out more spam than any other country. But what happened then? The spam from Saudi Arabia ran dry in mid-September. At the same time, the spam sent from Peru and Spain significantly increased from less than 2% to 3-10%. These levels held until the end of the year.
Figure 26: Spam Volume versus Spam Sent from Saudi Arabia, India, Peru, and Spain – June to December, 2012 (by week)
2012
Spam Volume versus Spam sent from Saudi Arabia, India, Peru, and SpainJune to December 2012 (by week)
India Saudi ArabiaSpam Volume
0%
5%
10%
15%
20%
25%
30%
0%
50%
100%
150%
200%
250%
Per
cent
age
of
Sp
am s
ent
fro
m
Sp
am V
olu
me
Peru Spain
23 24 25 26 27 28 29 30 31 32 33 34 35 36 37 38 39 40 41 42 43 44 45 46 47 48 49 50 51 52

49
IBM Security Systems IBM X-Force 2012 Trend and Risk Report
Section I—Threats > Spam and phishing > Attacker reaction to botnet take downs
Attacker reaction to botnet take downsIn conjunction with the drop of spam sent from Saudi Arabia, we also recognized a drop in the overall spam volume. In October, we saw 12% less spam than in September. Some reported that the Festi botnet ran dry in September,62 and that might be the reason for the ebbing of Saudi Arabian spam. If this is the case, then spammers could have found ways to compensate for botnet take downs. This becomes clear when looking at some of the take downs in the last few years.
62 http://www.eleven.de/eleven-security-reports-reader.612/items/eleven-e-mail-security-report-october-2012.html63 http://blogs.iss.net/archive/mccolo.html64 http://blogs.iss.net/archive/RustockSpam.html65 http://www-03.ibm.com/security/xforce/downloads.html
While we had seen a dramatic drop of 75% after the McColo take down63 in November, 2008, two and a half years later we only see a reduction of 35% after the Rustock take down64 in March, 2011. The Grum65 and Festi take downs in 2012 resulted in drops of 27% and only 12%, as seen in figure 27 below.
In the context of the Festi take down in September 2012, it looks like spammers have simply switched from the Saudi Arabian botnet drones to those in Peru and Spain, to compensate for this drop.
What is a botnet take down and how are attackers adapting?To better explain, botnets are a collection of controlled computers used by attackers to remotely carry out malicious tasks. They are often used to conduct campaigns such as denial of service attacks on websites, click fraud, distribution of new forms of malicious software, and spam related activities.
Botnets historically have operated through a centralized command and control (C&C) server. In the past, an effective way to stop botnets, as illustrated by a measurable reduction in spam volume, was to “take down” the botnet C&C servers.
However, recent data may indicate that attackers have become more resilient to this tactic, indicating the possibility of a more distributed C&C network or even the operation of multiple botnet groups. This way, when one C&C server or botnet group is taken down, the attackers have others that are already in place to make up for that loss of traffic.
Figure 27: Drop of Spam Volume after Botnet Take Downs – 2008 to 2012
Drop of Spam Volume after Botnet Take Downs2008 to 2012
0%
10%
20%
30%
40%
50%
60%
70%
80%
November 2008: McColo Take Down
March 2011: Rustock Take Down
July 2012: Grum Take Down
September 2012: Festi Take Down
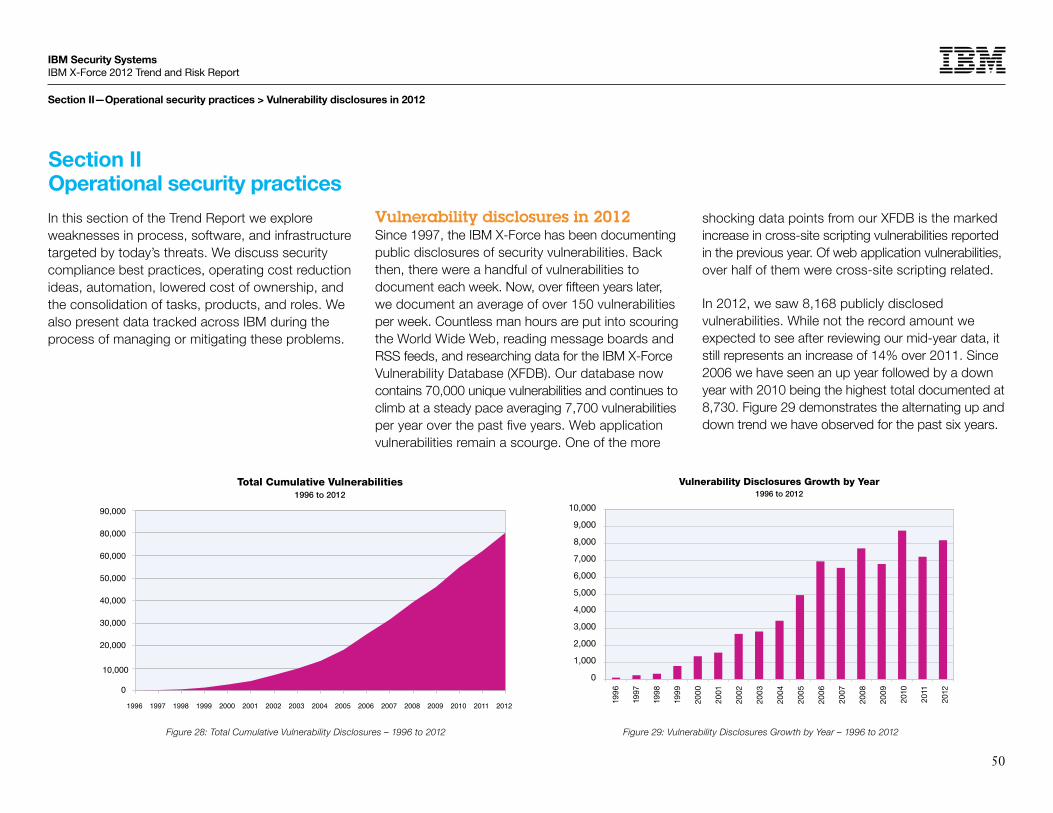
50
IBM Security Systems IBM X-Force 2012 Trend and Risk Report
Section II—Operational security practices > Vulnerability disclosures in 2012
Section II Operational security practices
In this section of the Trend Report we explore weaknesses in process, software, and infrastructure targeted by today’s threats. We discuss security compliance best practices, operating cost reduction ideas, automation, lowered cost of ownership, and the consolidation of tasks, products, and roles. We also present data tracked across IBM during the process of managing or mitigating these problems.
Vulnerability disclosures in 2012Since 1997, the IBM X-Force has been documenting public disclosures of security vulnerabilities. Back then, there were a handful of vulnerabilities to document each week. Now, over fifteen years later, we document an average of over 150 vulnerabilities per week. Countless man hours are put into scouring the World Wide Web, reading message boards and RSS feeds, and researching data for the IBM X-Force Vulnerability Database (XFDB). Our database now contains 70,000 unique vulnerabilities and continues to climb at a steady pace averaging 7,700 vulnerabilities per year over the past five years. Web application vulnerabilities remain a scourge. One of the more
shocking data points from our XFDB is the marked increase in cross-site scripting vulnerabilities reported in the previous year. Of web application vulnerabilities, over half of them were cross-site scripting related.
In 2012, we saw 8,168 publicly disclosed vulnerabilities. While not the record amount we expected to see after reviewing our mid-year data, it still represents an increase of 14% over 2011. Since 2006 we have seen an up year followed by a down year with 2010 being the highest total documented at 8,730. Figure 29 demonstrates the alternating up and down trend we have observed for the past six years.
Figure 29: Vulnerability Disclosures Growth by Year – 1996 to 2012
10,000
9,000
8,000
7,000
6,000
5,000
4,000
3,000
2,000
1,000
0
Vulnerability Disclosures Growth by Year1996 to 2012
1996
1997
1998
1999
2000
2001
2002
2003
2004
2005
2006
2007
2008
2009
2010
2012
2011
Figure 28: Total Cumulative Vulnerability Disclosures – 1996 to 2012
Total Cumulative Vulnerabilities1996 to 2012
0
10,000
20,000
30,000
40,000
50,000
60,000
80,000
90,000
1996 1997 1998 1999 2000 2001 2002 2003 2004 2005 2006 2007 2008 2009 2010 2011 2012
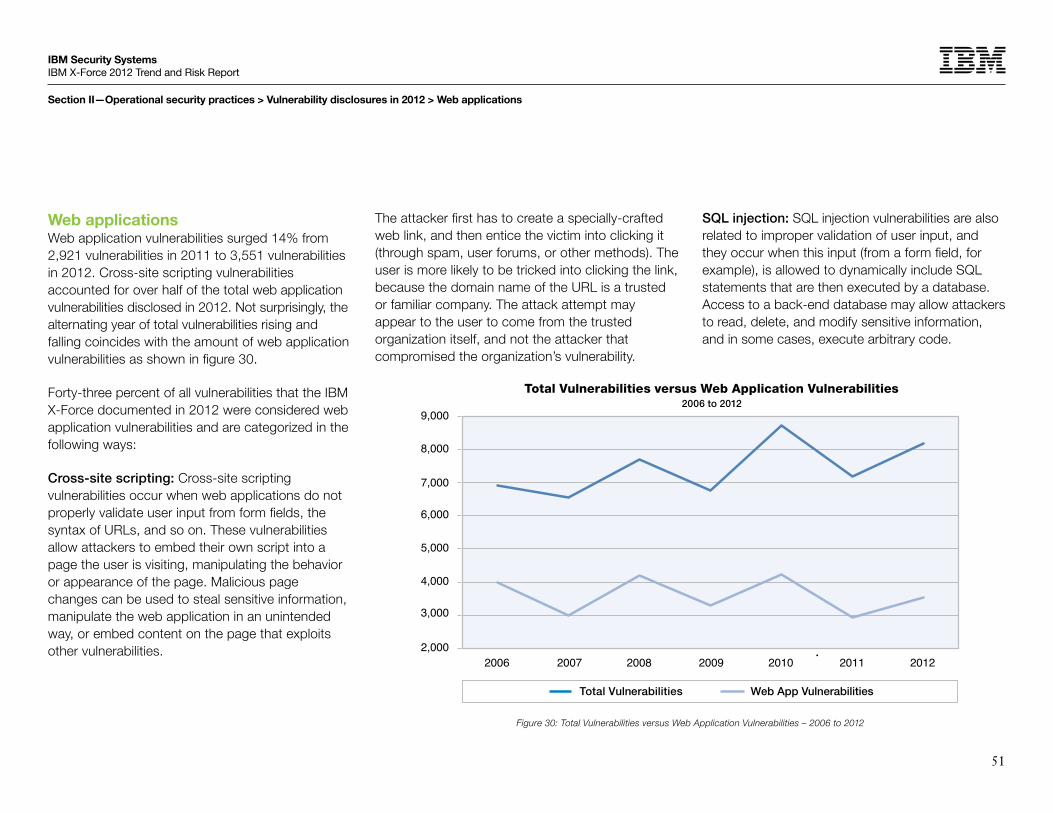
51
IBM Security Systems IBM X-Force 2012 Trend and Risk Report
Section II—Operational security practices > Vulnerability disclosures in 2012 > Web applications
Web applicationsWeb application vulnerabilities surged 14% from 2,921 vulnerabilities in 2011 to 3,551 vulnerabilities in 2012. Cross-site scripting vulnerabilities accounted for over half of the total web application vulnerabilities disclosed in 2012. Not surprisingly, the alternating year of total vulnerabilities rising and falling coincides with the amount of web application vulnerabilities as shown in figure 30.
Forty-three percent of all vulnerabilities that the IBM X-Force documented in 2012 were considered web application vulnerabilities and are categorized in the following ways:
Cross-site scripting: Cross-site scripting vulnerabilities occur when web applications do not properly validate user input from form fields, the syntax of URLs, and so on. These vulnerabilities allow attackers to embed their own script into a page the user is visiting, manipulating the behavior or appearance of the page. Malicious page changes can be used to steal sensitive information, manipulate the web application in an unintended way, or embed content on the page that exploits other vulnerabilities.
Figure 30: Total Vulnerabilities versus Web Application Vulnerabilities – 2006 to 2012
Total Vulnerabilities versus Web Application Vulnerabilities 2006 to 2012
Total Vulnerabilities Web App Vulnerabilities
2,000
3,000
4,000
5,000
6,000
7,000
8,000
9,000
2006 2007 2008 2009 2010 2011 2012
The attacker first has to create a specially-crafted web link, and then entice the victim into clicking it (through spam, user forums, or other methods). The user is more likely to be tricked into clicking the link, because the domain name of the URL is a trusted or familiar company. The attack attempt may appear to the user to come from the trusted organization itself, and not the attacker that compromised the organization’s vulnerability.
SQL injection: SQL injection vulnerabilities are also related to improper validation of user input, and they occur when this input (from a form field, for example), is allowed to dynamically include SQL statements that are then executed by a database. Access to a back-end database may allow attackers to read, delete, and modify sensitive information, and in some cases, execute arbitrary code.

52
IBM Security Systems IBM X-Force 2012 Trend and Risk Report
Section II—Operational security practices > Vulnerability disclosures in 2012 > Web applications
In addition to exposing confidential customer information (like credit card data), SQL injection vulnerabilities can also allow attackers to embed other attacks inside the database that can then be used against visitors to the website. As we discussed earlier in this report, the IBM Managed Security Services group distinguishes SQL injection attacks as one of the continued top attacks experienced by client networks.
File include: Typically found in PHP applications, File include vulnerabilities occur when the application retrieves code from a remote source to be executed in the local application. In these cases, the remote source is not validated for authenticity, which allows an attacker to use the web application to remotely execute malicious code.
Other: This category includes some denial-of-service attacks and miscellaneous techniques that allow attackers to view or obtain unauthorized information, and to change files, directories, user information or other components of web applications.
Figure 31: Web Application Vulnerabilities by Attack Technique – 2006 to 2012
60%
50%
40%
30%
20%
10%
0%
Web Application Vulnerabilities by Attack Technique2006 to 2012
2006 2007 20092008 2010 20122011
Cross-Site Scripting SQL Injection Other File Include
Cross-site scripting dominated the web vulnerability disclosures. Fifty-three percent of all publicly released web application vulnerabilities were cross-site scripting related. This is the highest rate
we have ever seen. This dramatic increase occurred while SQL injection vulnerabilities enjoyed a higher rate than 2011 but still were down significantly since 2010.

53
IBM Security Systems IBM X-Force 2012 Trend and Risk Report
Section II—Operational security practices > Vulnerability disclosures in 2012 > Web applications
Most of the vulnerabilities that are considered web application related are disclosed on exploit database websites. Most of these fall into the category of third party add-ons or plug-ins for Content Management Systems. Content Management System (CMS) programs are some of the most widely deployed software on the World Wide Web because of their ease of use, utility, and simplicity to maintain and administer. Attackers like to target these systems to
find vulnerabilities and flaws that they can exploit. Because CMS applications and their plugins are web enabled, they can often be targeted with automated scanning tools to identify web application vulnerabilities. In addition to automation, attackers will also manually review CMS applications and plugins.
Core vulnerabilities against CMS programs are typically disclosed and fixed by the affected
vendor. However, most of the add-ons and plug-ins are developed and maintained by individuals or third-party companies. The major CMS vendors do a good job of keeping their products patched and maintained when a new vulnerability is disclosed to them. Seventy-one percent of all publicly disclosed vulnerabilities against core CMS programs are patched upon disclosure compared to 51% of plug-ins.
Unpatched:49 percent
Patched:51 percent
CMS Plug-in Vulnerabilities2012
Unpatched:29 percent
Patched:71 percent
CMS Core Vulnerabilities2012
Figure 32: Disclosed Vulnerabilities in Core Content Management Systems – Unpatched versus Patched 2012
Figure 33: Disclosed Vulnerabilities in Plug-in Content Management Systems – Unpatched versus Patched 2012

54
IBM Security Systems IBM X-Force 2012 Trend and Risk Report
Section II—Operational security practices > Vulnerability disclosures in 2012 > Exploits
ExploitsThere were 3,436 vulnerabilities that had public exploits available in 2012 which comprised the total number of public exploits for the year. This is 42% of the total number of vulnerabilities and up 4% from 2011 levels. IBM X-Force has noticed that the total amount of exploits (including those exploits that we label as “not true exploits”) coincide with
the up-and-down levels year to year that we see in our total number of vulnerabilities chart. In fact, they clearly mirror the total amount of vulnerabilities in web applications.
Exploit releases typically expose the underlying vulnerability. This is especially so for web applications, where the actual disclosure of a
vulnerability is presented at the time of the exploit release. For 77% of all vulnerabilities with exploits, the exploit is released the same day as disclosure. Another 15% are released within the first 30 days of public disclosure. The remaining 8% is spread out past the first 30 days.
Figure 35: Exploit Release After Vulnerability Disclosure – 2012
Exploit Release After Vulnerability Disclosure2012
0
50
100
150
200
250
300
350
400
Same Day 1 Month 2 Months 3 Months 4 Months
Num
ber
of
Exp
loits
Dis
clo
sed
Time Between Vulnerability Disclosure and Exploit Release
Figure 34: Disclosed Vulnerabilities versus Web Applications versus Exploits 2007 to 2012
Disclosed Vulnerabilities versus Web Applications versus Exploits2007 to 2012
Total Vulnerabilities Total ExploitsTotal Web App Vulnerabilities
2007 2008 2009 2010 2011 20120
2,000
4,000
6,000
8,000
10,000

55
IBM Security Systems IBM X-Force 2012 Trend and Risk Report
Section II—Operational security practices > Vulnerability disclosures in 2012 > Exploits
IBM X-Force catalogs two categories of exploits. Simple snippets with proof-of-concept code are counted as exploits, but fully functional programs that can attack a computer are categorized separately as “true exploits.”
In the mid-2012 report, IBM X-Force estimated that year-end totals would be 858. We were not far off from that figure, as there were a total of 864 true exploits released. We define these as functioning exploits that do not include many web application vulnerabilities that can be exploited through the use of the address bar in a standard web browser. We predicted a continuing decline in exploits being released publicly which, while up slightly from 2011 numbers, the 2012 numbers, are still down overall and represent 10.6% of all public disclosures of vulnerabilities.
2006 2007 2008 2009 2010 2011 2012
True Exploits
498 1067 1033 1061 1297 826 864
Percent of Total
7.2% 16.3% 13.4% 15.7% 14.9% 10.5% 10.6%
Table 1: True Exploit Disclosures – 2006 to 2012
True Exploit Disclosures2006 to 2012
400
500
600
700
800
900
1,000
1,100
1,200
1,300
2006 2007 2008 2009 2010 2011 2012
Figure 36: True Exploit Disclosures – 2006 to 2012

56
IBM Security Systems IBM X-Force 2012 Trend and Risk Report
Section II—Operational security practices > Vulnerability disclosures in 2012 > CVSS scoring
CVSS scoringIBM X-Force rates the severity of all vulnerabilities that we research using the Common Vulnerability Scoring System (CVSS). We score vulnerabilities from three different perspectives: as a vulnerability database that tracks third-party vulnerability disclosures, as a security research organization that discovers new vulnerabilities, and as a large software vendor that needs to help customers accurately assess the severity of vulnerabilities
within its products. IBM X-Force is currently working alongside other organizations on developing the new CVSS version 3 standard. In the scoring of vulnerabilities for 2012, we found that, for the second consecutive year, the majority of vulnerabilities (65%) fall into the medium severity range. The total number of critical vulnerabilities dropped slightly from 2011, but the overall percentage of high severity vulnerabilities also remained unchanged from the previous year at 29%.
CVSS Score Severity Level10 Critical
7.0-9.9 High4.0-6.9 Medium0.0-3.9 Low
Table 2: CVSS Score and Corresponding Severity Level
Although the overall severity breakdown has remained relatively unchanged over the past several years, looking closer at the data reveals some interesting trends when it comes to enterprise software vulnerabilities.
2012CVSS Base Score
Medium:65 percent
Low:5 percent
Critical:1 percent
High:29 percent
2011CVSS Base Score
Medium:64 percent
Low:5 percent
Critical:2 percent
High:29 percent
Figure 37: Percentage Comparison of CVSS Base Scores – 2011 versus 2012

57
IBM Security Systems IBM X-Force 2012 Trend and Risk Report
Section II—Operational security practices > Vulnerability disclosures in 2012 > Vulnerabilities in enterprise software
Vulnerabilities in enterprise softwareWhen looking at trends in enterprise software, IBM X-Force looks at major software vendors who create the widest variety of enterprise software. We have observed that, out of thousands of vendors, these companies consistently disclose a significant number of security vulnerabilities. We categorize these vendors in a top ten group, leaving out the Content Management System vulnerabilities since the majority of those are in third-party plug-ins and add-ons and not widely used as enterprise-level software.
Since 2008, we observed that the top ten have been increasing as a percentage of the overall disclosed vulnerabilities with as much as 33% of all disclosures in 2011 coming from large enterprise software vendors. However, in 2012, we saw the overall percentage of vulnerabilities disclosed by these companies decrease to 26%. This is the first decrease in this category over the past five years and is something we will watch closely in 2013 to see if this is a one-time occurrence or whether it represents a downward trend as enterprise software vendors continue to implement secure development practices within their software development lifecycle, allowing vendors to identify and remedy vulnerabilities before the code makes its way into a new software release.
Figure 38: Top Ten Software Vendors with Largest Number of Vulnerability Disclosures – 2008 to 2012
Top Ten Software Vendors with Largest Number of Vulnerability Disclosures
2008 to 2012
0%
5%
10%
15%
20%
25%
30%
35%
2008 2009 2010 2011 2012

58
IBM Security Systems IBM X-Force 2012 Trend and Risk Report
Section II—Operational security practices > Vulnerability disclosures in 2012 > Vulnerabilities in enterprise software
While we have seen the total percentage of public disclosures among the top ten vendors come down in 2012, we are seeing a new trend relating to vulnerability severity. Over the past five years, the average severity of vulnerabilities attributed to the top ten enterprise vendors, as measured by CVSS base score, has increased nearly a full point, from 5.8 in 2008 to 6.7 in 2012. This 2012 number is also nearly a full point above the average CVSS base score for the total number of vulnerabilities reported during the year. In fact, 67% of all critical vulnerabilities reported in 2012 and 33% of all high vulnerabilities can be attributed to the top ten vendors. We believe this trend will continue in 2013 as attackers seek out vulnerabilities that allow for widespread exploitation and potential larger reward, which, for the purposes of our analysis, is represented by a higher CVSS base score.
Although the number of reported Java vulnerabilities remained constant from 2011 to 2012, the average CVSS severity increased and is higher than the top ten averages. Earlier in this report, we discussed the use of java vulnerabilities in exploit kits. Figure 39: CVSS Base Score Averages – 2008 to 2012
CVSS Base Score Averages2008 to 2012
5
5.5
6
6.5
7
2008 2009 2010 2011 2012
Top 10 Total
CV
SS
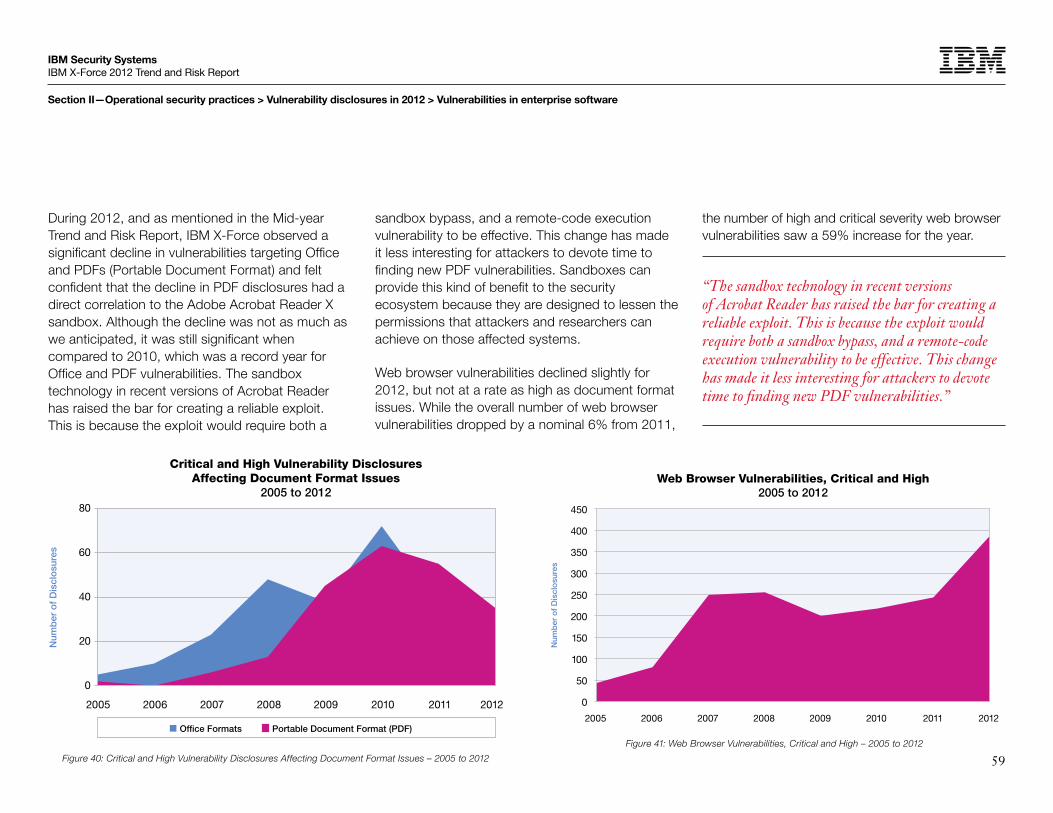
59
IBM Security Systems IBM X-Force 2012 Trend and Risk Report
Section II—Operational security practices > Vulnerability disclosures in 2012 > Vulnerabilities in enterprise software
During 2012, and as mentioned in the Mid-year Trend and Risk Report, IBM X-Force observed a significant decline in vulnerabilities targeting Office and PDFs (Portable Document Format) and felt confident that the decline in PDF disclosures had a direct correlation to the Adobe Acrobat Reader X sandbox. Although the decline was not as much as we anticipated, it was still significant when compared to 2010, which was a record year for Office and PDF vulnerabilities. The sandbox technology in recent versions of Acrobat Reader has raised the bar for creating a reliable exploit. This is because the exploit would require both a
sandbox bypass, and a remote-code execution vulnerability to be effective. This change has made it less interesting for attackers to devote time to finding new PDF vulnerabilities. Sandboxes can provide this kind of benefit to the security ecosystem because they are designed to lessen the permissions that attackers and researchers can achieve on those affected systems.
Web browser vulnerabilities declined slightly for 2012, but not at a rate as high as document format issues. While the overall number of web browser vulnerabilities dropped by a nominal 6% from 2011,
the number of high and critical severity web browser vulnerabilities saw a 59% increase for the year.
“The sandbox technology in recent versions of Acrobat Reader has raised the bar for creating a reliable exploit. This is because the exploit would require both a sandbox bypass, and a remote-code execution vulnerability to be effective. This change has made it less interesting for attackers to devote time to finding new PDF vulnerabilities.”
Critical and High Vulnerability Disclosures Affecting Document Format Issues
2005 to 2012
Office Formats Portable Document Format (PDF)
Num
ber
of
Dis
clo
sure
s
0
20
40
60
80
2005 2006 2007 2008 2009 2010 2011 2012
Figure 40: Critical and High Vulnerability Disclosures Affecting Document Format Issues – 2005 to 2012
Web Browser Vulnerabilities, Critical and High2005 to 2012
0
50
100
150
200
250
300
350
400
450
2005 2006 2007 2008 2009 2010 2011 2012
Num
ber
of
Dis
clo
sure
s
Figure 41: Web Browser Vulnerabilities, Critical and High – 2005 to 2012
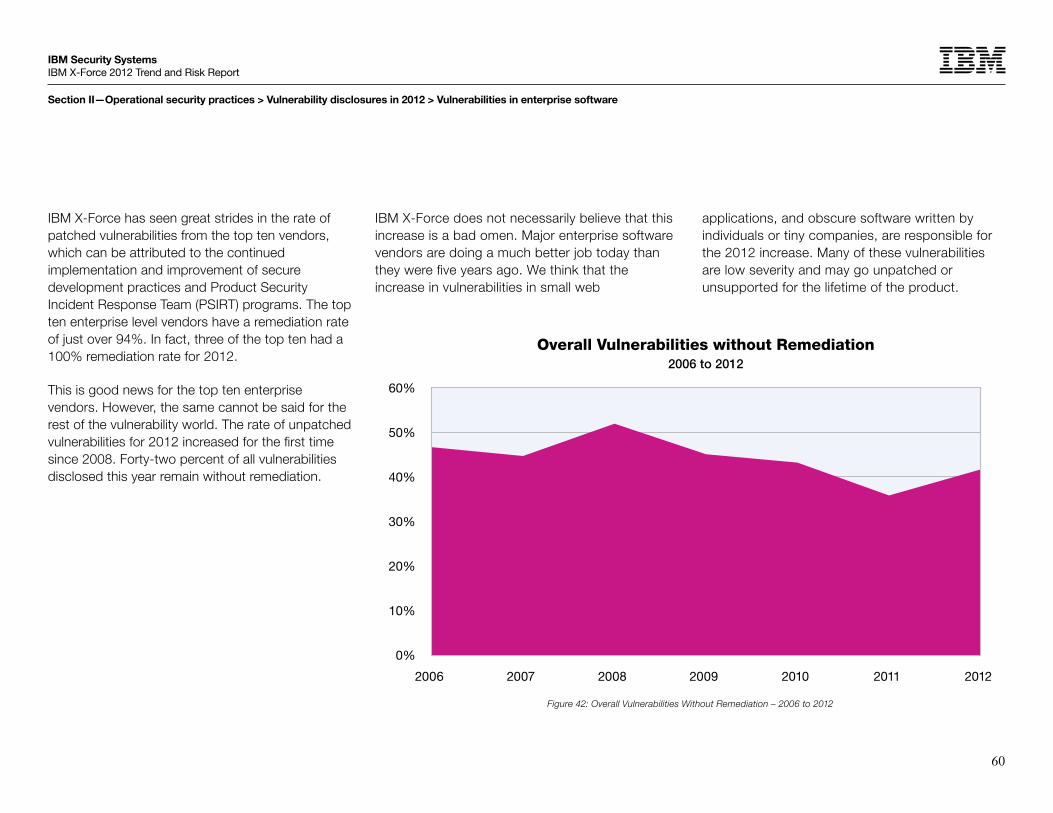
60
IBM Security Systems IBM X-Force 2012 Trend and Risk Report
Section II—Operational security practices > Vulnerability disclosures in 2012 > Vulnerabilities in enterprise software
IBM X-Force has seen great strides in the rate of patched vulnerabilities from the top ten vendors, which can be attributed to the continued implementation and improvement of secure development practices and Product Security Incident Response Team (PSIRT) programs. The top ten enterprise level vendors have a remediation rate of just over 94%. In fact, three of the top ten had a 100% remediation rate for 2012.
This is good news for the top ten enterprise vendors. However, the same cannot be said for the rest of the vulnerability world. The rate of unpatched vulnerabilities for 2012 increased for the first time since 2008. Forty-two percent of all vulnerabilities disclosed this year remain without remediation.
Figure 42: Overall Vulnerabilities Without Remediation – 2006 to 2012
Overall Vulnerabilities without Remediation2006 to 2012
0%
10%
20%
30%
40%
50%
60%
2012201120102009200820072006
IBM X-Force does not necessarily believe that this increase is a bad omen. Major enterprise software vendors are doing a much better job today than they were five years ago. We think that the increase in vulnerabilities in small web
applications, and obscure software written by individuals or tiny companies, are responsible for the 2012 increase. Many of these vulnerabilities are low severity and may go unpatched or unsupported for the lifetime of the product.

61
IBM Security Systems IBM X-Force 2012 Trend and Risk Report
Section II—Operational security practices > Chaos or coordination: How to facilitate an incident response team
Chaos or coordination: How to facilitate an incident response teamLast year, IBM’s Emergency Response Service identified common mistakes that many organizations make when developing and implementing their Computer Security Incident Response Plan (CSIRP). In this article, we jump to a common scenario that often impacts organizations that may have a decent CSIRP in place but may not have fully prepared for requesting support from a third party incident response team. Such a scenario often unfolds as follows:
The phone rings shortly after 2AM, and as you try to jump start your brain to figure out who could be disturbing your sleep, you recognize your network administrator’s voice, although more frazzled than usual, apologizing for calling you so late at night. Your heart starts racing when he tells you that network logs show a machine from your research network sending large amounts of data to an IP address in Asia. As he continues to detail what he has learned, you need no reminder that the research network contains some of the most valuable pieces of intellectual capital within the company. As the conversation turns toward
response actions, you recall the recent budget cuts that nixed a network intrusion class you were attempting to coordinate for a few select staff members. You have a talented network team, but the necessary incident response skills that are now
needed have not been developed. The decision to forgo last-minute searches on YouTube for “Incident Response” tactics leads you to realize the need to quickly bring in external resources that confront these challenges on a regular basis.

62
IBM Security Systems IBM X-Force 2012 Trend and Risk Report
Section II—Operational security practices > Chaos or coordination: How to facilitate an incident response team
Sadly, this fictional scenario is a common reality in many of IBM’s Emergency Response Service engagements. Although the most meticulously developed CSIRP cannot eliminate every complication in scenarios like this one, IBM believes that there are 10 things that organizations can know and implement that adequately prepare for efficiently engaging additional incident response (IR) support. A few simple preparations can save time and frustration, adding up to tremendous savings and an increased likelihood of finding answers quickly.
1
Establish a preexisting relationship with a qualified Incidence Response (IR) team.
The last thing you should be doing when an incident occurs is trying to find a qualified IR team that can show up at your facility. Reach out now and establish a relationship with a qualified IR team—one that is ‘flyaway’ ready and can be on the next plane to your troubled location. The team should have certified professionals in Digital Forensics and Incident Response (DFIR) and should be properly equipped to support your incident response efforts and analysis.
2
Designate someone that can coordinate contracts in a pinch.
If you have already implemented the first critical step in facilitating an IR team, you likely had initial contracts signed well in advance of the incident. Unfortunately, contractual issues are often one of the most significant delays after the alarm has sounded. Whether it means your inside counsel is planted in front of their email awaiting the arrival of the contract or you need someone from accounting to generate a purchase order, the contract process should be streamlined and move swiftly. Before an incident occurs, identify a few individuals within the organization who are authorized to sign contracts with external entities. When an incident occurs and contracts need signing, you should have designated personnel on call to provide authorization on any new contracts or change requests.

63
IBM Security Systems IBM X-Force 2012 Trend and Risk Report
Section II—Operational security practices > Chaos or coordination: How to facilitate an incident response team
3
Maintain current network and environment documentation.
Keep in mind that external IR teams will have minimal knowledge about your environment, often just the basics of what may have been conveyed in an initial triage call. This makes current, detailed network topology documentation essential to answering questions the IR team may have. Printed copies and knowledgeable administrators should be available immediately as soon as the IR team arrives.
4
Prepare a suitable work environment for the IR team.
As the IR team is headed your way, you need to dedicate a space for them to use for at least a week. Most IR analysts are highly adaptable, but making their job easier pays dividends in achieving your incident response objectives.
A lockable conference room in a fairly central location is critical for both the IR team and your personnel. Ensure that this room is located close to critical personnel, can comfortably accommodate the analysts, has a working speaker phone, has ample lighting, and has plenty of power outlets, network drops, and table space. A lockable room is critical to help ensure that equipment can be secured overnight, especially when processing sensitive data.
5
Gather relevant network logs in advance.
Without fail, network logs take time to locate and pull. The initial hours following incident identification are often the most critical as network logs typically contain some of the most important pieces of the puzzle. If gathered in advance, logs are usually manageable enough to upload to a secure file transfer server for remote review by IR team members who are not traveling to your site. Concurrent analysis usually yields critical, fresh intelligence for the team members arriving on site, saving time and focusing the effort.

64
IBM Security Systems IBM X-Force 2012 Trend and Risk Report
Section II—Operational security practices > Chaos or coordination: How to facilitate an incident response team
6
Identify an incident coordinator.
Several of the most critical tasks in facilitating the arrival of an IR team pertain to personnel management. The IR team may never have stepped foot in the door of your organization and are likely unfamiliar with your environment and culture. Making sure the IR team has a dedicated coordinator, assigned to assist with any of their needs is particularly beneficial, often resulting in improved communication and efficiency. The incident coordinator should be waiting for the incoming team at the door, ready to escort them through security and into the designated work area. The coordinator should also be the primary person for contacts, facility access, and communication with critical personnel. Of course, providing support for finding local restaurants, coffee shops, and water coolers is a huge bonus.
7
Provide a skeleton crew for nights and weekends.
The IR team typically intends to work long days and through the weekend for critical incidents. It is essential that you provide at least a small contingent of key personnel to assist the team through the weekend. Nothing deflates an IR team more than finding out that access to a system exhibiting potentially critical indicators of compromise cannot be provided until an administrator shows up on Monday morning. Be sure to coordinate a schedule in advance and if necessary, give the IR team a few on-call numbers for key personnel should the situation require support.
8
Avoid hosting long meetings involving the IR team.
Avoid the temptation to hold long meetings when the IR team arrives. If warranted, any meetings should be limited to a short status briefing. A long meeting with one manager, then another manager, and then the CEO just results in wasted time. Just as analysts need a bright room and the phone number of the local pizza place, they also need time to work. Results are more difficult to achieve when meetings are using up three hours per day.

65
IBM Security Systems IBM X-Force 2012 Trend and Risk Report
Section II—Operational security practices > Chaos or coordination: How to facilitate an incident response team
9
Develop and exercise first responder procedures.
Give proper attention to volatile data collection, affording incident responders a jump start in identifying malware and suspicious activity on compromised systems. Work with the IR team to document solid first responder procedures for volatile data collection, then practice them and seek feedback from the IR team on the results of the exercise. Incorporate these procedures into your system administrator training to build a workforce ready to collect volatile data in the heat of an incident. This enables the IR team to focus on the analysis.
10 Update your Computer Security Incident Response Plan (CSIRP).
The majority of the nine items mentioned in this article should be found somewhere in your organization’s CSIRP. As you work through these items within your organization, document the key aspects in your CSIRP, and review it frequently to ensure that the plan components are still applicable and current. Reach out to your IR team for feedback on your CSIRP to help ensure that it properly addresses the critical aspects of the incident response lifecycle. That trusted external feedback may notice something you missed.
As you look at ways to better prepare your organization for a security incident requiring support from an expert Incident Response team, remember that the goal is to stop the breach and determine what happened as quickly as possible. Much like emergency medical service teams rushing to assist someone in a life-or-death crisis, time is of the essence.
When considered independently, each tip identified in this article cannot magically eliminate squandered time and resources. However, when implemented together, they may make the difference between a timely, successful recovery and a drawn-out, exasperated struggle. Saving the organization significant financial expenditure may be reason enough to begin efforts towards a more organized incident response framework. Next time, when you receive that call at 2AM, you’ll be ready to get things done efficiently and effectively.

66
IBM Security Systems IBM X-Force 2012 Trend and Risk Report
Section II—Operational security practices > Risk modeling, assessment and management: brought to you by the letter “T”
Risk modeling, assessment and management: brought to you by the letter “T”The network security industry recommends that an organization periodically perform risk modeling, assessment, and risk management to anticipate and take pro-active measures against threats. While this is a noble venture, a recent Internet search for “risk assessment” resulted in the return of over 38 million responses, with many of these risk-modeling processes including methods to calculate the cost of risk mitigation compared to the cost of recovery, in the event the risk occurs and various ways to determine the return on investment (ROI) within the risk assessment and mitigation process. Some of these solutions are so convoluted and abstract as to be almost unworkable. What is needed is a simple-to-operate risk modeling and assessment process.

67
IBM Security Systems IBM X-Force 2012 Trend and Risk Report
Section II—Operational security practices > Risk modeling, assessment and management: brought to you by the letter “T” > Treat the Threat
T reat the Threat
A primary method of dealing with identified security threats is to develop a plan to Treat the threat and reduce it to an acceptable level. One process to achieve this is to:
1 Identify the threat. This requires a strong situational awareness of attacker tactics, techniques, and procedures (TTP) along with knowledge of the organization’s network to understand whether attacks based on the threats would be successful. Threats should be assessed from the perspective of attackers both inside and outside the network, and can range from physical security to network and personal digital security. Example threats can include:
• Physical security of buildings: burglary, fire, flood, protest rally
• Compromise of root or administrator credentials• Distributed denial of service (DDoS)
• Loss of protected data: lost/stolen laptop, intrusion into sensitive system, employee theft of data, etc.
• Data mining information from employee social networking presence
2 Identify, develop, and implement steps to mitigate the threat. Steps should be structured to specifically address a threat and results should be measurable. Frequently, due to increasing security fatigue and a decreasing security budget, organizations tend to provide fewer resources to treat the threat as time passes, if the threat hasn’t materialized.
3 Monitor and supervise the mitigation process. Specifically, identify a monitoring mechanism to watch for the appearance of the threat and assign somebody to monitor and respond to alerts. Examples of monitoring mechanisms would include network vulnerability scanning, network anti-virus consoles, a Security Information and Event Management (SIEM) system and an Intrusion Detection/Prevention System.

68
IBM Security Systems IBM X-Force 2012 Trend and Risk Report
Section II—Operational security practices > Risk modeling, assessment and management: brought to you by the letter “T” > Treat the Threat
4 Assess the residual threat to determine if the threat has been reduced to a level acceptable for the organization.
The values for the evaluated threat and residual threat can be determined by comparing the likelihood or frequency of a threat occurring (high, medium, low) against the damage impact that could happen if the threat occurred (catastrophic, high, medium, low). The goal is to implement mitigation processes that either reduce the frequency of the threat occurring or reduce the impact if the threat
does occur. One factor that would impact the damage assessment could include the nature of the data in various areas of the network, resulting in different evaluated threat levels for different areas of the network. A compromise of root account credentials on a server may be evaluated as a higher impact than on a workstation which requires different mitigation processes. Malware found within a PCI (payment card industry) or other sensitive data environment may be evaluated as a higher risk than the rest of the network, due to a change in the amount of impact the exposure could have.
A requirement for this to be successful is to have a specific, designated monitoring mechanism to monitor the implementation of the treatment processes and for the appearance of the threats. This monitoring mechanism should be monitored and alerts should be responded to. It does no good to have network-based anti-virus consoles gathering information about virus alerts across the network, if nobody is assigned to monitor the console and respond to those alerts. Monitoring and responding is part of the mitigation process. (An example threat assessment and risk mitigation process chart is provided below, though the IR team may identify a greater list.)
Identify Threat Evaluated Threat Level Mitigation Process
Mitigation Process Implementation and Monitoring Owners
Residual Threat Level Acceptable Risk?
Compromise of root account credentials
High (low frequency, catastrophic impact)
Two-Factor Authentication; network segmenting; Role-based access controls
Reduces the frequency and impact of a compromise
ID management team, System Admin team, Networking
Low (low frequency, medium impact) Yes
Loss of laptop, USB device or smart phone
High (medium frequency, high impact)
Whole disk encryption; robust password policy; remote wipe capability; laptop tracking capability
Reduces the frequency of exposure of data
Laptop and cell phone issuing teams, employees
Low (high frequency, low impact) Yes
Introduction of malware into network
High (medium frequency, high impact)
Security awareness training; group policy object (GPO) to turn off USB autoruns; anti-virus software; robust passwords; email, Internet and network filtering; network segmentation
Reduce malware events, improve response capabilities to reduce exposure
Training, System Admins, AV admins, Networking
Low (low frequency, low impact) Yes
Table 3: Example Threat Assessment and Mitigation Process
69
IBM Security Systems IBM X-Force 2012 Trend and Risk Report
Section II—Operational security practices > Risk modeling, assessment and management: brought to you by the letter “T” > Transfer the Threat
T ransfer the Threat
Companies will frequently decide to Transfer a threat to another entity and make that entity responsible for the threat mitigation. That process is frequently seen with outsourcing to managed security services processes such as management and monitoring of firewall, Intrusion Detection/Prevention System and anti-virus software. After proper threat assessment, the organization may choose to transfer to a vendor those threats posed by processes they cannot adequately mitigate. For example, organizations already do a form of this transfer by using an anti-virus software vendor. This transfers much of the threat posed by malware by transferring malware detection and mitigation to the vendor rather than writing and implementing their own internal corporate anti-virus solution. However, the organization still bears the burden of properly resourcing the transfer of the threat mitigation including funding and monitoring of the success of the mitigation efforts of the entity to whom the process was transferred.

70
IBM Security Systems IBM X-Force 2012 Trend and Risk Report
Section II—Operational security practices > Risk modeling, assessment and management: brought to you by the letter “T” > Terminate the Threat
T erminate the Threat
During the process of treating the threat, the final determination may result in finding that the remaining residual threat is too high for the organization to tolerate. If the risk cannot be transferred, the decision could be made to Terminate the exposure from the threat. For example, if the residual threat is that after all mitigation processes have been applied for allowing employees to “Bring Your Own Device” is considered too high, a decision could be made to terminate the threat posed by BYOD and not allow employees to furnish their own devices for which the company cannot adequately control, or which they may have difficulty implementing and monitoring security software, and on which company data could remain when the employee leaves the company.

71
IBM Security Systems IBM X-Force 2012 Trend and Risk Report
Section II—Operational security practices > Risk modeling, assessment and management: brought to you by the letter “T” > Tolerate the Threat
T olerate the Threat
At the conclusion of the threat modeling and implementation of mitigation procedures steps, the business decision will have to be made about whether to Tolerate or Terminate the residual threat. The goal throughout this entire process is to reduce the identified threats to a level where the residual threat can be tolerated by the business. Most threats cannot be entirely eliminated and threats may have different likelihoods of occurrence depending on the threat vector. For example, an insider with legitimate root or admin level access doing damage, whether accidentally or intentionally, may be determined to be a higher or lower frequency than an outsider obtaining and using root or admin credentials.

72
IBM Security Systems IBM X-Force 2012 Trend and Risk Report
Section II—Operational security practices > Risk modeling, assessment and management: brought to you by the letter “T” > Example of a server root access threat mitigation
Example of a server root access threat mitigationBased on the risk assessment model described in the previous pages, mitigation strategies to limit the amount of potential damage posed by server root account (or equivalent) compromise would focus on achieving the following two goals:
• Reduce the frequency or likelihood of the occurrence of root account compromise
• Reduce the damage impact potential from a root account compromise
A bastion host is a special purpose computer on a network specifically designed and configured to withstand attacks. The computer generally hosts a single application, for example a proxy server, and all other services are removed or limited to reduce the threat to the computer. It is hardened in this manner primarily due to its location and purpose, which is either on the outside of the firewall or in the DMZ and usually involves access from untrusted networks or computers.
http://en.wikipedia.org/wiki/Bastion_host
There are several example options to help achieve these two goals:
Reduce the frequency or likelihood of occur-rence of root credentials compromise and useSeveral policy and technical processes can be implemented to help reduce the likelihood of the compromise and the use of compromised root credentials. These processes include the following:
• Implementation of Two-Factor Authentication for root account logins to help reduce the likelihood of gaining access through the compromise of root account credentials.
• Implementation of a “jump box” to function as a bastion host for authenticating and logging access to the servers for all users.
• Implementation of firewalls to help ensure that the only systems that can connect to the servers over the network are those with authorized access through the firewall.

73
IBM Security Systems IBM X-Force 2012 Trend and Risk Report
Section II—Operational security practices > Risk modeling, assessment and management: brought to you by the letter “T” > Example of a server root access threat mitigation
Reduce the damage impact potential from a root account compromiseThe root account has full command capability and full access to do anything on the system. Some operating systems use role-based access controls (RBAC) to transfer some roles of a root user to other users. For example, a root account has the ability to add, delete, and modify user accounts. However, based on roles, organizations frequently move this function to other accounts and create an Identity Management Team (IMT) to administer user accounts. The IMT group accounts are given sufficient capability to perform these functions and it may not be the responsibility of the root user to administer user accounts. An attacker could benefit from this account creation ability if he gained access to the root account. To help in this scenario, RBAC mechanisms can be implemented to reduce or remove the ability of the root account to be able to create user accounts. Monitoring mechanisms can
be implemented that would function as a form of a tripwire when a logging event is created indicating the unauthorized creation or attempted creation of a user account which was implemented by the root account when it is outside the role of the root account to take this action.
The end result of implementing measures designed to reduce the likelihood of root account compromise and to reduce the amount of exposure that could occur, should be a reduction in the overall risk to a level which is acceptable to the organization. While the IBM Emergency Response Service (ERS) works with clients who have mitigation procedures in place, ERS frequently encounters situations where threats were adequately modeled and mitigation processes were implemented. However, adequate supervision and monitoring of the mitigation process did not occur, leading to an eventual failure of the mitigation
process. Any mitigation processes identified and implemented must have a vigorous supervision and monitoring process implemented to help ensure that the mitigation is successful, achieves the desired reduction of the threat, and continues to be properly implemented and maintained after the initial rush to implement safeguards has passed.
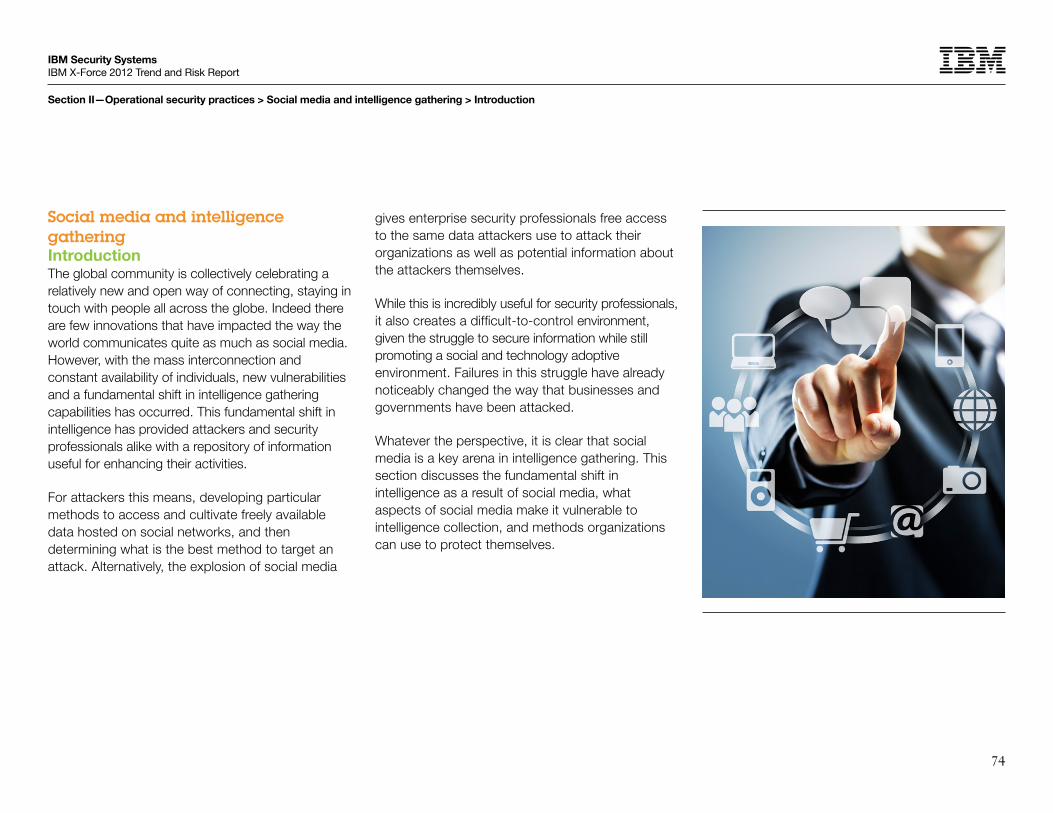
74
IBM Security Systems IBM X-Force 2012 Trend and Risk Report
Section II—Operational security practices > Social media and intelligence gathering > Introduction
Social media and intelligence gathering IntroductionThe global community is collectively celebrating a relatively new and open way of connecting, staying in touch with people all across the globe. Indeed there are few innovations that have impacted the way the world communicates quite as much as social media. However, with the mass interconnection and constant availability of individuals, new vulnerabilities and a fundamental shift in intelligence gathering capabilities has occurred. This fundamental shift in intelligence has provided attackers and security professionals alike with a repository of information useful for enhancing their activities.
For attackers this means, developing particular methods to access and cultivate freely available data hosted on social networks, and then determining what is the best method to target an attack. Alternatively, the explosion of social media
gives enterprise security professionals free access to the same data attackers use to attack their organizations as well as potential information about the attackers themselves.
While this is incredibly useful for security professionals, it also creates a difficult-to-control environment, given the struggle to secure information while still promoting a social and technology adoptive environment. Failures in this struggle have already noticeably changed the way that businesses and governments have been attacked.
Whatever the perspective, it is clear that social media is a key arena in intelligence gathering. This section discusses the fundamental shift in intelligence as a result of social media, what aspects of social media make it vulnerable to intelligence collection, and methods organizations can use to protect themselves.

75
IBM Security Systems IBM X-Force 2012 Trend and Risk Report
Section II—Operational security practices > Social media and intelligence gathering > Intelligence collection background
Intelligence collection backgroundBefore diving into how intelligence collection has shifted however, it is important to first understand what is meant by the term “intelligence.” Intelligence can be defined as the ability to learn or understand. Here, the context of this learning and understanding pertains directly to the discovery of information about a particular entity, either as an individual user or as a collective of users in an enterprise.
This is accomplished by collecting numerous data artifacts and analyzing them in a process often referred to as “gathering intelligence” or “intelligence gathering.” Intelligence gathering is defined based on the several different collection techniques currently in existence. Collection techniques can be used to describe both the different processes used to gather intelligence as well as the intelligence information itself. This description is simplified into “intelligence types.” Several intelligence types include:
1. Human intelligence (HUMINT): The collection of intelligence via interpersonal contact or provided directly from human sources.
2. Signal intelligence (SIGINT): The term used to describe communications intelligence and electronic intelligence
3. Open-source intelligence (OSINT): The collection of intelligence from publicly available information as well as other unclassified information that has limited public distribution or access.
4. Measurement and signature intelligence (MASINT): The scientific and technical intelligence derived from analysis of data obtained from sensing instruments66
Enterprise security organizations use all of these intelligence types while attackers are primarily focused around HUMINT and OSINT. Social media has played a key role shifting numerous attacker activities away from HUMINT and towards OSINT. This is due to the fact that much of the data that was previously HUMINT is being posted publicly and can be recovered through OSINT activities. Previously, intelligence that required the collection and analysis of multiple different data artifacts, particularly HUMINT, can now be collected on social media sites with only one type of intelligence collection (OSINT). In other words, dumpster diving and social engineering information from a target, is not nearly as much of a necessity as it was in the past.
66 Definitions from the NATO glossary of terms and Definitions AAP-6 (2008)
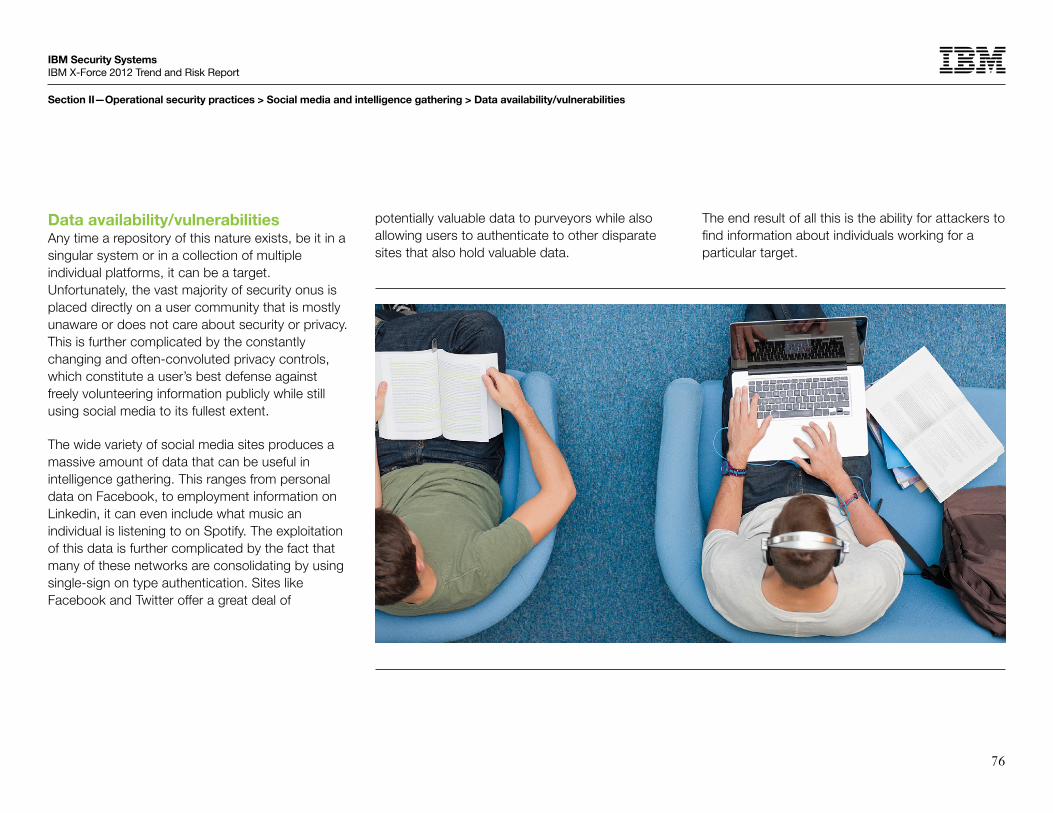
76
IBM Security Systems IBM X-Force 2012 Trend and Risk Report
Section II—Operational security practices > Social media and intelligence gathering > Data availability/vulnerabilities
Data availability/vulnerabilitiesAny time a repository of this nature exists, be it in a singular system or in a collection of multiple individual platforms, it can be a target. Unfortunately, the vast majority of security onus is placed directly on a user community that is mostly unaware or does not care about security or privacy. This is further complicated by the constantly changing and often-convoluted privacy controls, which constitute a user’s best defense against freely volunteering information publicly while still using social media to its fullest extent.
The wide variety of social media sites produces a massive amount of data that can be useful in intelligence gathering. This ranges from personal data on Facebook, to employment information on Linkedin, it can even include what music an individual is listening to on Spotify. The exploitation of this data is further complicated by the fact that many of these networks are consolidating by using single-sign on type authentication. Sites like Facebook and Twitter offer a great deal of
potentially valuable data to purveyors while also allowing users to authenticate to other disparate sites that also hold valuable data.
The end result of all this is the ability for attackers to find information about individuals working for a particular target.
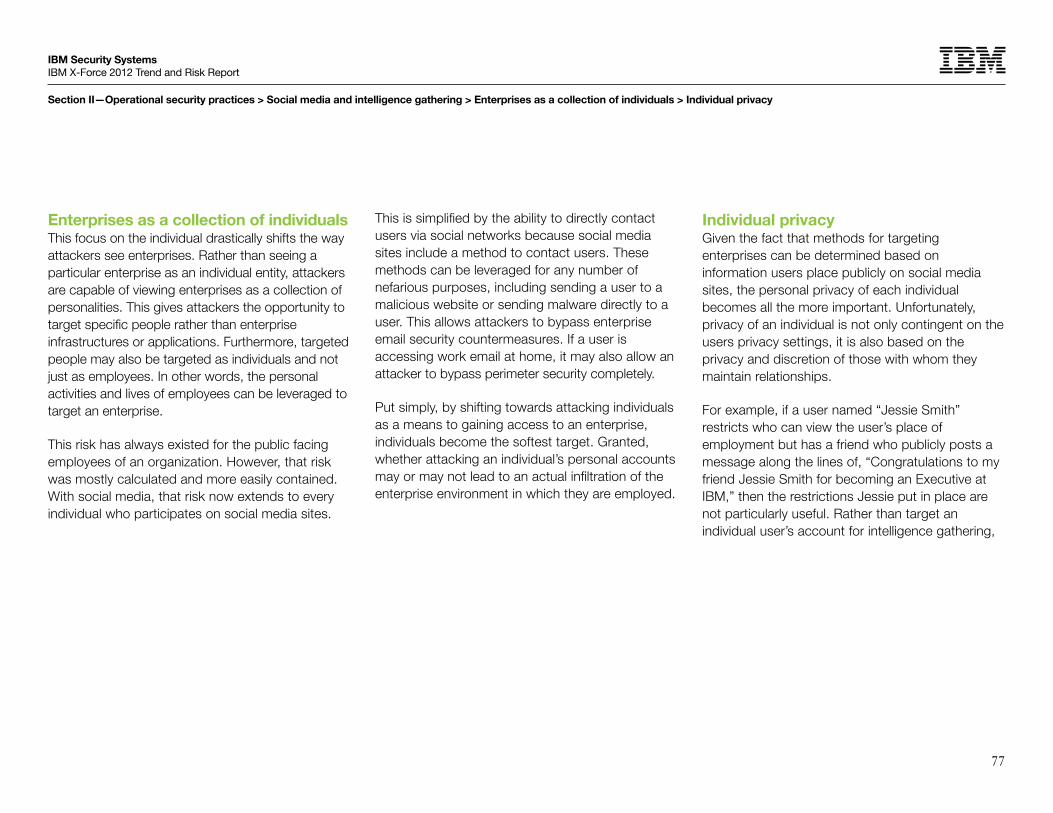
77
IBM Security Systems IBM X-Force 2012 Trend and Risk Report
Section II—Operational security practices > Social media and intelligence gathering > Enterprises as a collection of individuals > Individual privacy
Enterprises as a collection of individualsThis focus on the individual drastically shifts the way attackers see enterprises. Rather than seeing a particular enterprise as an individual entity, attackers are capable of viewing enterprises as a collection of personalities. This gives attackers the opportunity to target specific people rather than enterprise infrastructures or applications. Furthermore, targeted people may also be targeted as individuals and not just as employees. In other words, the personal activities and lives of employees can be leveraged to target an enterprise.
This risk has always existed for the public facing employees of an organization. However, that risk was mostly calculated and more easily contained. With social media, that risk now extends to every individual who participates on social media sites.
This is simplified by the ability to directly contact users via social networks because social media sites include a method to contact users. These methods can be leveraged for any number of nefarious purposes, including sending a user to a malicious website or sending malware directly to a user. This allows attackers to bypass enterprise email security countermeasures. If a user is accessing work email at home, it may also allow an attacker to bypass perimeter security completely.
Put simply, by shifting towards attacking individuals as a means to gaining access to an enterprise, individuals become the softest target. Granted, whether attacking an individual’s personal accounts may or may not lead to an actual infiltration of the enterprise environment in which they are employed.
Individual privacyGiven the fact that methods for targeting enterprises can be determined based on information users place publicly on social media sites, the personal privacy of each individual becomes all the more important. Unfortunately, privacy of an individual is not only contingent on the users privacy settings, it is also based on the privacy and discretion of those with whom they maintain relationships.
For example, if a user named “Jessie Smith” restricts who can view the user’s place of employment but has a friend who publicly posts a message along the lines of, “Congratulations to my friend Jessie Smith for becoming an Executive at IBM,” then the restrictions Jessie put in place are not particularly useful. Rather than target an individual user’s account for intelligence gathering,
78
IBM Security Systems IBM X-Force 2012 Trend and Risk Report
Section II—Operational security practices > Social media and intelligence gathering > Tools for assistance
the attacker can target all the accounts associated with that user to gather intelligence. This type of attack takes a great deal more time and there is a lot more useless information to pilfer through; however, it can be quite effective.
This method of information gathering can also be accomplished by leveraging logical issues in the social media platforms themselves. Methods for recommending connections can be particularly vulnerable to attackers attempting to enumerate information about other users. Most of these vulnerabilities leverage core functionality in a way that is difficult to discern as malicious. As a result, few of these vulnerabilities are likely to go anywhere anytime soon.
Tools for assistanceOf course one does not have perform any of these tasks manually. There are many tools that assist users in developing intelligence on particular targets. These tools range from subscription sites that provide intelligence searches as a service to simple Google queries, or rather particular searches that can be used in an automated fashion, to more sophisticated tools built particularly for the purpose of pilfering social media sites. These tools assist in both the collection and the organization of data. Since there is a massive amount of data to typically wade through, visualization can also be crucial. As a result, many of these sites and tools incorporate specially crafted visualization techniques for better data organization.
To summarize, data is out there, it can be easily collected, and multiple utilities as well as services exist for the specific purpose of assisting anyone in collecting that data.
79
IBM Security Systems IBM X-Force 2012 Trend and Risk Report
Section II—Operational security practices > Social media and intelligence gathering > Protecting your enterprise
Protecting your enterpriseUnfortunately, like so many other security issues, there is no simple solution for these issues caused by social media. There exists no holistic technical solution to combat targeted attacks leveraging social media information. Nor does there exist a specific framework to follow to prevent the dissemination of sensitive information on social networks. However, using basic awareness, assessment, and targeted security technologies, organizations can minimize the impact of attacks that leverage intelligence gathering via social media.
Employee awarenessCreating awareness among employees of how their social media personas could affect an organization’s security is the first step in addressing concerns. Employees should be aware that the amount of information they produce publicly as well as their status of employment within any particular
organization could make them a target. Additionally, information they post about other employees or company events could be leveraged in attacks.
It is critical that each individual user is equipped with an understanding of what is acceptable social media behavior so that they can make good decisions without being directly monitored. Of course, much of this responsibility will rest with the individual organization to develop what “acceptable behavior” entails as it will vary widely between different businesses. IBM serves as an excellent example of a company that has a set standard for what constitutes good behavior on social media sites.
Within IBM, these standards are referred to as the “IBM Social Computing Guidelines” and are a part of broader Business Conduct Guidelines (BCG) that all IBM employees must agree to adhere to as a condition of their employment. These guidelines set the standard of what the IBM Company considers,
“good behavior” on social media sites. More importantly, by defining what good behavior entails, a level is set so that IBM may exert some control over poor behavior.
AssessmentWhile user knowledge and business standards are important, they are rarely enough to secure an organization from attacks. It is also important to implement and perform OSINT assessments procedures. Much like penetration testing, OSINT gathering can help security professionals understand how attackers might view their organization, and by extension determine where specific vulnerabilities might lie. In turn, this knowledge will allow enterprises to prioritize security efforts to address second or third tiers of attacks leveraging intelligence that can be gathered from social media sites.

80
IBM Security Systems IBM X-Force 2012 Trend and Risk Report
Section II—Operational security practices > Social media and intelligence gathering > Conclusion
Many of the OSINT gathering processes are integrated into high quality penetration testing processes. In fact, the Penetration Testing Execution Standard (PTES), which is inclusive of OSINT specifically, serves as an example guideline for performing OSINT related activities. These guidelines however, are primarily focused around a singular engagement, whereas enterprises need to deploy these processes in an ongoing manner. It is therefore important to standardize the reporting of OSINT data as well as the processes used.
Once these processes are in place and data is being produced, much like in penetration tests where OSINT data is later used to determine potential attack points, the same data can be used to determine potential targets. After targets have been determined, security monitoring and protections can be used to reduce risks and the impact of those targets being attacked.
Conclusion Social media has altered the security landscape and intelligence gathering in a manner that is unlikely to return to what was previously considered normal. The result is a data rich environment for attackers to determine the best targets and how to exploit them. Conversely, this environment allows enterprise security teams to leverage the information in a way that can be used to better predict “what” within an organization is likely to be attacked.
It is clear that attackers are adopting these processes to evolve attack methodologies. It is imperative that enterprise security teams also adopt these capabilities. This begins by understanding how social media can be leveraged in attacks and extends into understanding the methodologies attackers use to gathered, data. Once data is gathered it should be organized and stored so that
is useful to enterprise security teams. Finally, as these security efforts mature, this data can be used to determine patterns and for integration into risk management equations for more intuitive security processes via analytics.

81
IBM Security Systems IBM X-Force 2012 Trend and Risk Report
Section II—Operational security practices > Identity and access intelligence for the enterprise > The importance of protecting data and reputations
Identity and access intelligence for the enterpriseThe need to provide people with secure and controllable access to online resources, while simultaneously helping to protect those resources from unauthorized users, has never been greater or more complex. Several factors are driving this, including the exponential growth and change in the population of internal and external users, the number and types of devices they use to access data and applications, and where and how they choose to access those resources. Web-based collaboration with business partners, the need to open up access to third-party suppliers and online consumers, and the growing use of cloud-based services all continue
to blur the organization’s borders and expose it to external threats, as well as threats from careless employees and nefarious insiders.
At the same time, cybercrime, spear phishing attacks, and industrial espionage are all on the rise. These risks, coupled with increasingly complex regulatory requirements and growing privacy concerns, make managing your access and authorization levels a significant business and IT challenge. With high-profile security breaches at stellar organizations such as the New York Times, Wall Street Journal, and Federal Reserve Bank making headlines recently, it is a clear reminder that controlling and monitoring user access privileges and activities across the virtual enterprise is crucial.
The importance of protecting data and reputationsManaging security risks and supporting security policies have become a major concern for many CIO’s and security and risk professionals. Why? Because businesses understand that if systems were breached or confidential data leaked, that company’s reputation and corporate viability could suffer, and they could possibly incur fines and penalties for noncompliance. In fact, in the 2012 IBM Global Reputational Risk and IT study,67 executives cited data theft/cybercrime as the single most serious threat to the reputation and viability of their firm, well ahead of systems failures or other concerns.
Today’s identity and access management solutions have to encompass more than “letting the good guys in and keeping the bad guys out”. When employees share passwords or lose corporate data and disgruntled insiders steal information, even the
67 2012 IBM Reputational Risk and IT study, published by IBM Global Technology Services, September 2012
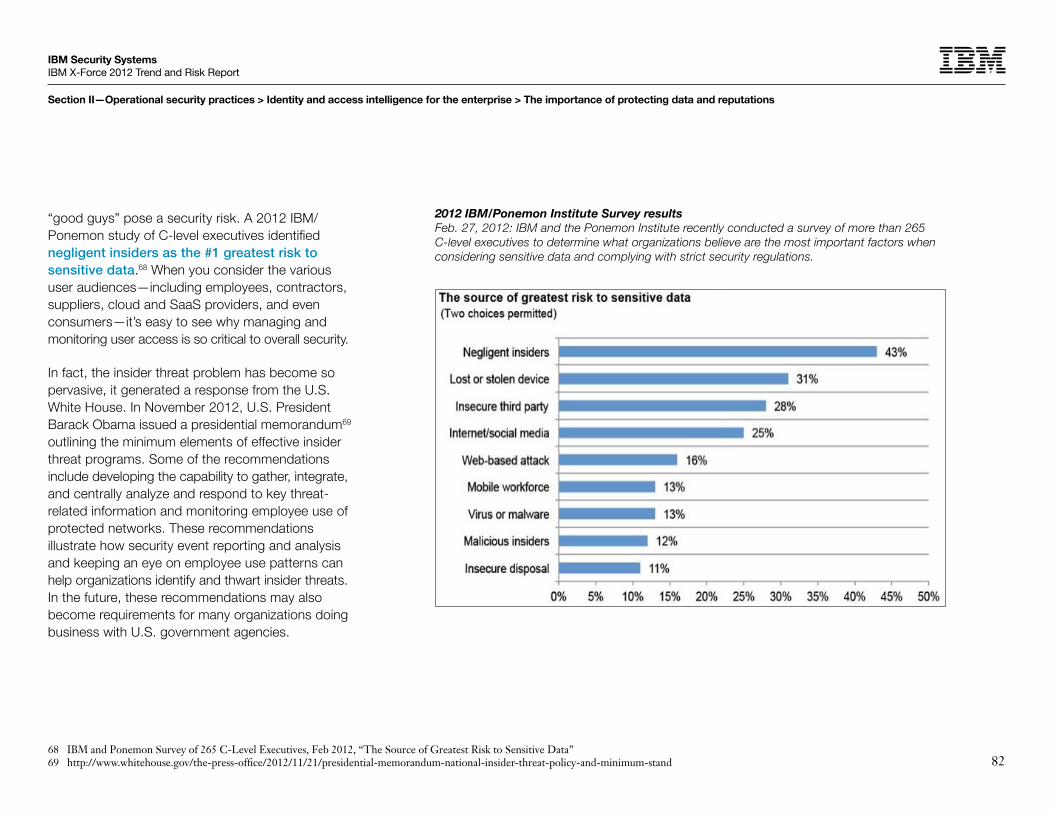
82
IBM Security Systems IBM X-Force 2012 Trend and Risk Report
Section II—Operational security practices > Identity and access intelligence for the enterprise > The importance of protecting data and reputations
“good guys” pose a security risk. A 2012 IBM/Ponemon study of C-level executives identified negligent insiders as the #1 greatest risk to sensitive data.68 When you consider the various user audiences—including employees, contractors, suppliers, cloud and SaaS providers, and even consumers—it’s easy to see why managing and monitoring user access is so critical to overall security.
In fact, the insider threat problem has become so pervasive, it generated a response from the U.S. White House. In November 2012, U.S. President Barack Obama issued a presidential memorandum69 outlining the minimum elements of effective insider threat programs. Some of the recommendations include developing the capability to gather, integrate, and centrally analyze and respond to key threat-related information and monitoring employee use of protected networks. These recommendations illustrate how security event reporting and analysis and keeping an eye on employee use patterns can help organizations identify and thwart insider threats. In the future, these recommendations may also become requirements for many organizations doing business with U.S. government agencies.
2012 IBM/Ponemon Institute Survey resultsFeb. 27, 2012: IBM and the Ponemon Institute recently conducted a survey of more than 265 C-level executives to determine what organizations believe are the most important factors when considering sensitive data and complying with strict security regulations.
68 IBM and Ponemon Survey of 265 C-Level Executives, Feb 2012, “The Source of Greatest Risk to Sensitive Data”69 http://www.whitehouse.gov/the-press-office/2012/11/21/presidential-memorandum-national-insider-threat-policy-and-minimum-stand

83
IBM Security Systems IBM X-Force 2012 Trend and Risk Report
Section II—Operational security practices > Identity and access intelligence for the enterprise > Reduce risk with identity and access governance > Security intelligence for managing insider threats
Reduce risk with identity and access governanceSecurity breaches and compliance issues can occur when users have outdated or inappropriate levels of access entitlement. The potential for insider threat activity is considerably higher when access entitlement does not reflect current needs and actual use patterns. Additionally, attackers may take advantage of poorly controlled administrative privileges to escalate an attack or alter systems to enable eavesdropping that captures sensitive information such as user access credentials. Poorly controlled and monitored user access privileges, coupled with a lack of visibility into the misuse or abuse of those privileges may even enhance the likelihood of bad activity as it can indicate that nobody cares enough to take these primary security steps seriously.
Identity and access governance provides guidelines on how user roles are defined and access is provisioned, managed, and enforced throughout the lifecycles of users. An organization may want to obtain resources to manage user access requirements with greater accountability and transparency; these solutions can help firms govern and enforce user access more effectively. Administrators can use these tools to help ensure user accounts and privileges are updated and appropriate to their roles. Identity and access governance can also help organizations implement more thorough and consistently enforced fine-grained control over who can do what with which resources. In business-to-business and business-to-consumer environments, it’s especially important to validate if users’ access privileges are assigned based on their role and actual need. Access privileges should be aligned with established security policies and backed up by auditing and reporting tools to monitor user behavior.
Security intelligence for managing insider threatsSecurity information and event manager (SIEM) and log management tools can provide usable log files and metrics that help identify anomalies, highlight risky or inappropriate behavior, and assist in compliance reporting. Collecting logs and information about Identity and Access Management (IAM) and correlating it with other important security events and information helps quickly uncover inappropriate or suspicious user behavior or insider threats.
This level of identity and access intelligence is increasingly required to implement identity governance processes and enable businesses to manage cloud and mobile environments in a more secure manner.

84
IBM Security Systems IBM X-Force 2012 Trend and Risk Report
Section II—Operational security practices > Identity and access intelligence for the enterprise > Summary
Identity and access intelligence can perform many roles:
• Provide a deeper and richer understanding of the context of access from mobile and traditional endpoints
• Provide insight into activity that better defines identity roles for normal and privileged users
• Help organizations recognize anomalous behavior that poses a threat
• Enable clients to quickly and accurately respond to threats so they can protect the business before the security breach occurs.
With security intelligence, administrators can quickly determine whether access patterns exhibited by a given user are consistent with the user’s role and permissions within the organization. For example, perhaps the user is legitimate but the activity is questionable (accessing unauthorized records). A security intelligence tool such as those
offered in the IBM Security portfolio, can aggregate and correlate diverse log data and network flows into actionable IT forensics for identifying patterns of attack, anomalies, access, and usage of confidential data and insider threats. With data normalization, predefined and customizable correlation rules, and policy and compliance-driven searches, an organization can easily analyze a diverse collection of security data and network telemetry information, and reduce risk by investigating and resolving security threats faster. A full-blown Security Information and Event Management (SIEM) solution may be able to augment these capabilities with advanced threat protection and policy-aware compliance management to provide contextual and actionable surveillance across an entire IT infrastructure. This allows an organization to detect and remediate advanced threats such as inappropriate use of applications, malicious activity and insider fraud occurring over extended time periods.
SummaryUser management and access control have come to the forefront of business, driving the need to have a broad IAM intelligence solution that spans the borders of the enterprise. As organizations seek to expand user access to cloud and mobile resources, they should consider identity and access intelligence solutions to help monitor and control user access activities, identify anomalies and misuse of assets, and demonstrate compliance. Cloud and mobile security encompasses many components; monitoring and reporting on user access is vital to protecting your corporate assets in the new perimeter-less workplace.
To learn more about how Identity and Access Intelligence can help you proactively protect IT assets and strengthen cloud/mobile user access, download the EMA Associates white paper Identity and Access Intelligence: Transforming Enterprise Security.
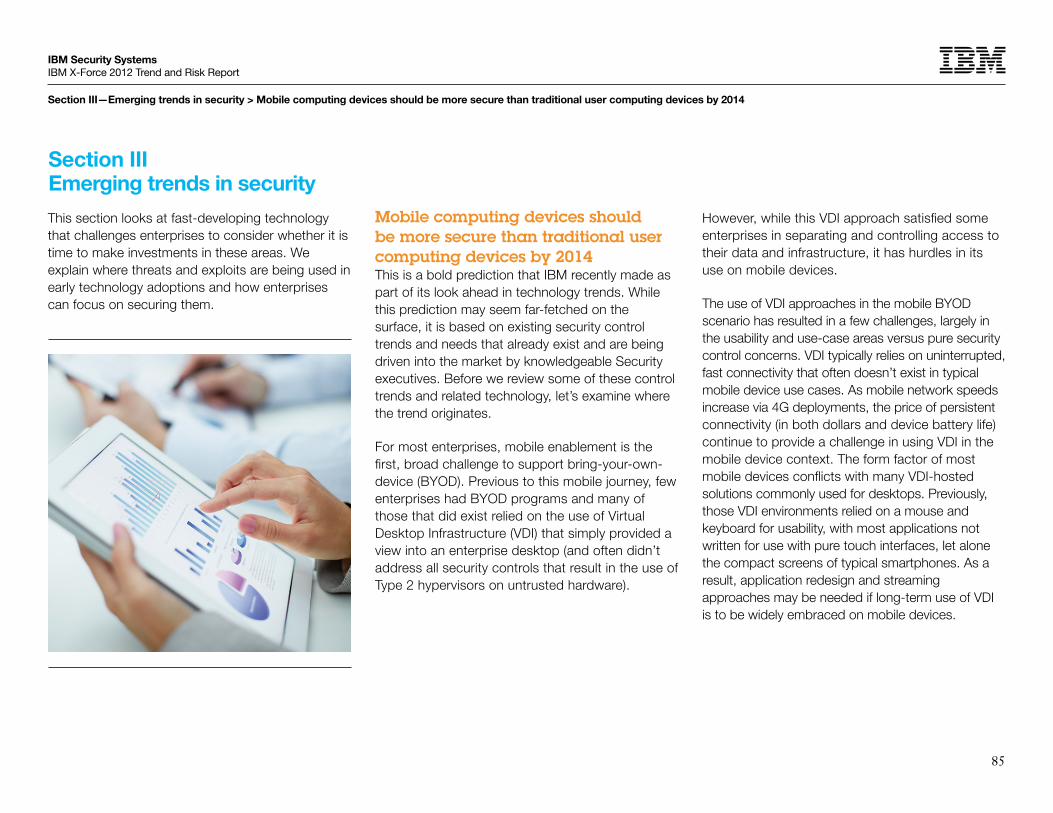
85
IBM Security Systems IBM X-Force 2012 Trend and Risk Report
Section III—Emerging trends in security > Mobile computing devices should be more secure than traditional user computing devices by 2014
This section looks at fast-developing technology that challenges enterprises to consider whether it is time to make investments in these areas. We explain where threats and exploits are being used in early technology adoptions and how enterprises can focus on securing them.
Mobile computing devices should be more secure than traditional user computing devices by 2014This is a bold prediction that IBM recently made as part of its look ahead in technology trends. While this prediction may seem far-fetched on the surface, it is based on existing security control trends and needs that already exist and are being driven into the market by knowledgeable Security executives. Before we review some of these control trends and related technology, let’s examine where the trend originates.
For most enterprises, mobile enablement is the first, broad challenge to support bring-your-own-device (BYOD). Previous to this mobile journey, few enterprises had BYOD programs and many of those that did exist relied on the use of Virtual Desktop Infrastructure (VDI) that simply provided a view into an enterprise desktop (and often didn’t address all security controls that result in the use of Type 2 hypervisors on untrusted hardware).
However, while this VDI approach satisfied some enterprises in separating and controlling access to their data and infrastructure, it has hurdles in its use on mobile devices.
The use of VDI approaches in the mobile BYOD scenario has resulted in a few challenges, largely in the usability and use-case areas versus pure security control concerns. VDI typically relies on uninterrupted, fast connectivity that often doesn’t exist in typical mobile device use cases. As mobile network speeds increase via 4G deployments, the price of persistent connectivity (in both dollars and device battery life) continue to provide a challenge in using VDI in the mobile device context. The form factor of most mobile devices conflicts with many VDI-hosted solutions commonly used for desktops. Previously, those VDI environments relied on a mouse and keyboard for usability, with most applications not written for use with pure touch interfaces, let alone the compact screens of typical smartphones. As a result, application redesign and streaming approaches may be needed if long-term use of VDI is to be widely embraced on mobile devices.
Section III Emerging trends in security

86
IBM Security Systems IBM X-Force 2012 Trend and Risk Report
Section III—Emerging trends in security > Mobile computing devices should be more secure than traditional user computing devices by 2014 > Application sandboxing
The result of these challenges with the use of VDI in a purely mobile context has led to many security executives driving new requirements to allow the use of personal mobile devices in sensitive, enterprise use scenarios. This desire to address enterprise security concerns in the context of personally owned devices, has been great motivation for the security technology industry to innovate and try to address these needs. This has helped drive IBM’s prediction that mobile computing devices are driving improved security controls and technology that have not previously existed for endpoint devices. There is also a clear trend that these mobile control and technology trends are trickling down to traditional devices.
Let’s explore some specific examples of this that we’ve already seen or expect to see soon:
Application sandboxingMost mobile operating systems have supported application sandboxing natively since their inception. In fact, it is a fundamental part of how they operate and is included for more than just security reasons (such as limiting the application ecosystem or “store” that can be used with the device). The only differences we’ve seen in the implementation of application sandboxing across the various popular mobile operating systems is the degree of “openness” as it related to what system services are exposed via the programming interface for application developers. This limitation to system level services as well as access to information associated with other applications is a fundamental difference that we’ve not previously seen in traditional computer operating systems. We’re already seen things like sandboxed browsers appear for traditional
computer operating systems. In the past year, we’ve seen these capabilities available in some traditional operating systems. Desktop operating system vendors understand the benefits of this approach to help decrease risk and have started to implement it in new versions but, with continued reliance on existing legacy applications, it will take some time to become the norm.

87
IBM Security Systems IBM X-Force 2012 Trend and Risk Report
Section III—Emerging trends in security > Mobile computing devices should be more secure than traditional user computing devices by 2014 > Signed code controls > Remote device or data wipe > Biocontextual authentication
Signed code controlsLike application sandboxing, the use or enforcement of only allowing the installation and/or execution of digitally signed applications is another common mobile operating system feature that has been there since the inception of current, popular mobile operating systems. Many suggest that it’s an essential part of the control that mobile operating system vendors require to help ensure their financial success. While its reliance or enforcement does vary from mobile OS to mobile OS, for the average user, being able to install only approved applications is a fundamental security improvement that does not exist widely in traditional operating systems. This is another area where we’re seeing its adoption in traditional desktop systems.
Remote device or data wipeDue to the increased risk of loss and theft that mobile devices represent, mobile operating system vendors have included the ability to remotely wipe the whole device—or selected applications and associated data—early in their feature development. This differs greatly from controls used on traditional desktop operating systems where it has not been embraced as a feature. Anecdotally, less than 1% of enterprises have included or required remote wipe capability via third-party technology. Admittedly, the lack of this requirement in traditional desktop computing is likely because of the increased risk of loss and theft in mobile devices. Some might suggest that the need to remotely wipe data, applications, and devices has existed since employees began taking laptops outside the premise boundaries of enterprises. Many enterprises require whole disk encryption to protect disclosure of information on most traditional computing devices. In any case, there has not been any indication that this capability will be included in traditional operating systems any time soon.
Biocontextual authenticationCertainly the use of biometrics has existed on traditional computing devices for some time but biocontextual authentication really hasn’t. Let’s first explore this term as a new one that is being driven by mobile computing. In the past year or so, we’ve seen the emergence of research and technology that provide a risk-based approach to authentication. This approach uses a larger, richer degree of information in assessing the authentication decision. Mobile devices can commonly provide these additional information elements that can be included in a risk-based authentication decision. Consider elements like physical location, network identification, voice recognition, eye, or facial recognition. All of these elements can be combined to improve entropy as a potential enhancement or substitute for the passwords that are commonly used in traditional desktop computing scenarios. Much of this
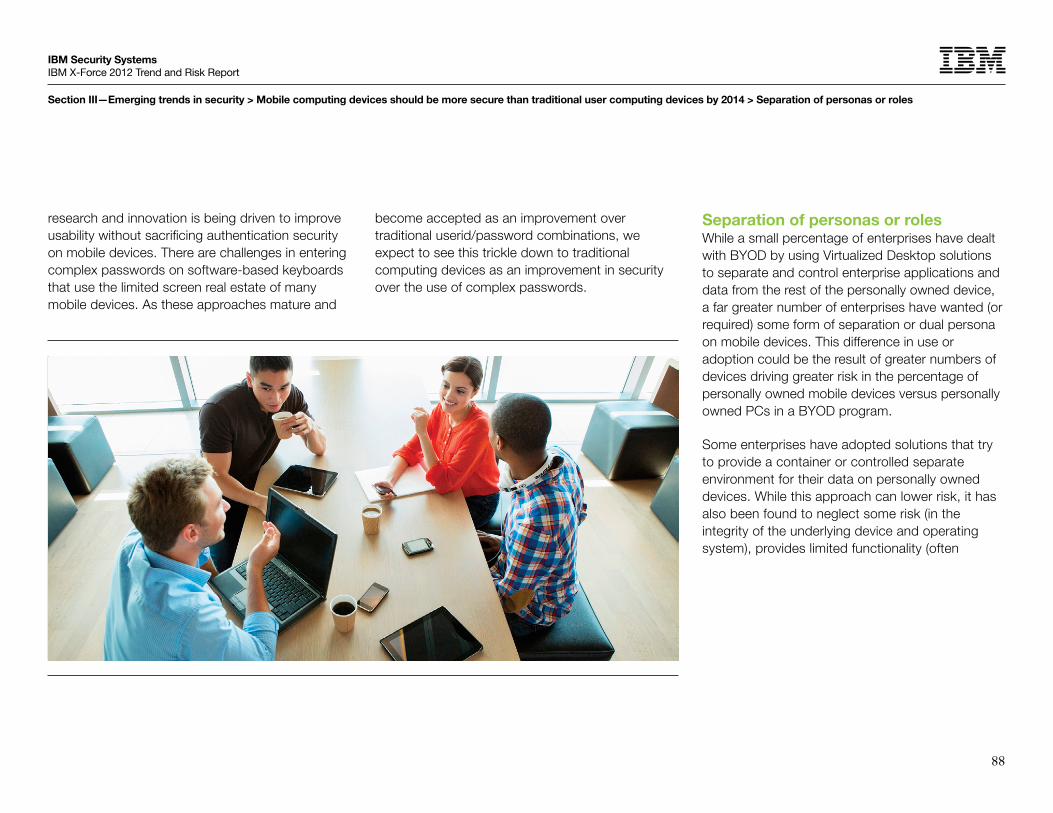
88
IBM Security Systems IBM X-Force 2012 Trend and Risk Report
Section III—Emerging trends in security > Mobile computing devices should be more secure than traditional user computing devices by 2014 > Separation of personas or roles
research and innovation is being driven to improve usability without sacrificing authentication security on mobile devices. There are challenges in entering complex passwords on software-based keyboards that use the limited screen real estate of many mobile devices. As these approaches mature and
become accepted as an improvement over traditional userid/password combinations, we expect to see this trickle down to traditional computing devices as an improvement in security over the use of complex passwords.
Separation of personas or rolesWhile a small percentage of enterprises have dealt with BYOD by using Virtualized Desktop solutions to separate and control enterprise applications and data from the rest of the personally owned device, a far greater number of enterprises have wanted (or required) some form of separation or dual persona on mobile devices. This difference in use or adoption could be the result of greater numbers of devices driving greater risk in the percentage of personally owned mobile devices versus personally owned PCs in a BYOD program.
Some enterprises have adopted solutions that try to provide a container or controlled separate environment for their data on personally owned devices. While this approach can lower risk, it has also been found to neglect some risk (in the integrity of the underlying device and operating system), provides limited functionality (often

89
IBM Security Systems IBM X-Force 2012 Trend and Risk Report
Section III—Emerging trends in security > Mobile computing devices should be more secure than traditional user computing devices by 2014 > Separation of personas or roles
requiring the porting of any enterprise application into the container while only providing a limited number of containerized applications), as well as trade-offs in usability (since by nature many replace existing native OS applications with their own similar applications that exist within the container). For many of these reasons, enterprises have used these technologies primarily as a stop-gap measure until more native solutions become available.
We have already seen this solution as a native mobile operating system function in the form of Balance, part of RIM’s existing Blackberry releases. Similar approaches do not exist in traditional desktop computing environments and, when combined with use of the MEAP (discussed later), potentially provide enterprises with a set of security controls that exceed traditional computing operating systems.
While Type 2 hypervisor technologies have been used on traditional computing devices and have sometimes been used as a way to separate roles, we have not seen the use of Type 1 hypervisors on user computing devices. While we do not intend to cover the advantages of Type 1 hypervisors in reducing risk surface area (compared to Type 2 approaches), it should be noted that there is work underway already to include Type 1 hypervisor capability in select mobile devices. As you’d expect, the intention in this is really to provide finite separation of roles within a single device in a way that introduces minimal resource overhead and user complexity. This can provide a mobile user with two devices in one physical device in a way that provides the enterprise with a high degree of separation of the user’s personal applications, data, and computing habits.
What is the difference between Type 1 and Type 2 hypervisor technology?To help better understand this, a Type 1 hypervisor bypasses the need for a “host” operating system, allowing the multiple guest operating systems to sit directly on top of the device’s hardware. In a Type 2 hypervisor, a device operating system is required between the device hardware and the guest operating systems. As you’d expect, the need for this host operating system in a Type 2 hypervisor scenario introduces additional attack surface along with the need for controlling that risk with additional security controls on the host operating system.
90
IBM Security Systems IBM X-Force 2012 Trend and Risk Report
Section III—Emerging trends in security > Mobile computing devices should be more secure than traditional user computing devices by 2014 > Secure mobile application development > Mobile Enterprise Application Platform (MEAP)
Secure mobile application developmentApplication vulnerabilities have become the primary attack vector for enterprises over the past few years. In many cases, these have been web applications or middleware but native client applications have also played their part in this increase. Unlike most legacy applications developed for traditional computing devices, today’s hybrid and native mobile applications are more likely to be developed with security as an integral part of the development process. In many cases, enterprises have made progress on significant Secure Software Development Life Cycle (SSDLC) initiatives and today’s mobile application development benefits from this. In addition, the tools currently exist to support secure development as part of the process as opposed to being conducted in qualification or production. As a result, it should be more common for enterprises to have more securely developed mobile applications than their existing legacy applications. Closure of vulnerabilities in some traditional computing applications may only conclude as existing versions are sunset and replaced with newer, more securely developed replacements.
Mobile Enterprise Application Platform (MEAP)Mobile enablement within the enterprise has led to a whole set of new technologies that did not exist previously. MEAPs were developed due to the diversity and complexity of developing for applications across multiple mobile operating systems. They were intended to assist a developer with dealing with multiple device form factors across multiple mobile operating systems in a way that made it consistent to develop and deploy across this diversity. Providing specific tools to develop and serve mobile applications has had a wonderful side benefit: the potential of security controls at an application level. This is important in a number of ways and beneficial across multiple use cases.
Many enterprises want to provide mobile applications to their customers. These are typically scenarios where there is no level of trust or control on the device itself. In using a MEAP and controlling some aspects of security at an application level, the enterprise can control what data remains in the device, whether it is encrypted, how long it is controlled, what levels of authentication are needed for a given set of data or function to be allowed, and many other scenarios that would be difficult to handle without application-level control.
For enterprises that develop applications for their employees, similar approaches can be used—either in concert with some level of device-level controls where they exist—or separately for access and use of enterprise data on mobile devices. Since this approach provides for levels of application data control that typically do not exist in traditional computing scenarios, it becomes easy to see why this is more finite control than has previously
91
IBM Security Systems IBM X-Force 2012 Trend and Risk Report
Section III—Emerging trends in security > Mobile computing devices should be more secure than traditional user computing devices by 2014 > Mobile Enterprise Management (MEM) > Prediction conclusion > Mobile security controls—where are we now?
existed. When combined with some of the other concepts covered here, such as biocontextual authentication, it becomes possible to incrementally provide access to application function and data based on a risk-based approach. Adoption of MEAP is still early in most enterprises, but it may become a fundamental approach moving forward as enterprises become more comfortable with a balance of security controls at both the device and application levels. This approach also enables the execution of higher risk computing such as mobile financial transactions on devices which have been traditionally deemed as less trusted and vulnerable to loss and theft.
Mobile Enterprise Management (MEM)The marriage of enterprise device management with enterprise application management should leave us in a state that some call Mobile Enterprise Management. This approach could provide a rich blend of controls across device platforms and applications while also leveraging biocontextual authentication that would allow an enterprise a risk-based computing approach. By driving toward a consistent technology solution for this, it should also reduce administrative complexity and provide security executives more fine-grained controls than those available today. Ideally, we could expect to see this trickle down to traditional devices allowing enterprises a broad, single platform to manage both infrastructure and application risk. This last trend is more prediction than reality but, just as it makes sense to drive the management of all computing devices to a single platform, it makes sense to drive similar-related application level controls into that same platform to help improve risk decisions and maximize usability.
Prediction conclusionThese items represent only some of the new security control approaches that mobile computing has introduced into the enterprise security arsenal but clearly, many of these may cascade to traditional device operating systems to increase overall security and lower risk.
Mobile security controls—where are we now?Previously in this report, we’ve reviewed progress toward best practices as well as trends that have been observed across industries regarding what controls enterprises are adopting or requiring in the mobile device space. Over 2012, it is safe to conclude that more enterprises are supporting BYOD or the use of personally owned devices than previously and is a trend that continues. In the last two years, IBM Security has spoken to hundreds of global 2000 customers and out of those interviewed

92
IBM Security Systems IBM X-Force 2012 Trend and Risk Report
Section III—Emerging trends in security > Mobile computing devices should be more secure than traditional user computing devices by 2014 > Mobile Enterprise Management (MEM) > Predic-tion conclusion > Mobile security controls—where are we now?
only three said they had no plans to implement any kind of BYOD program. Most BYOD programs have limited functionality, providing a level of basic connectivity and enterprise information such as email and calendar. A far fewer number of enterprises have progressed to include broader business functionality like collaboration and messaging. Even fewer have moved to a point that supports highly sensitive data contained in business applications, though some have via the use of things like MEAP discussed earlier. Given the additional cost and complexity that BYOD can introduce into the enterprise, this rate of progress should not surprise us.
We also continue to see clear trends of the desire to completely separate enterprise data on personally owned devices in industries. Specifically, enterprises in the financial, healthcare, and government domains
have shown a preference to select separation technologies while they limit mobile functionality and assess the role of MEAP in expanding mobile functionality.
We have also seen early drafts of mobile security best practices documentation from a number of global governments. While these documents are largely focused on providing direction within government bodies on what is expected in terms of appropriate security controls, they should influence what is accepted as best mobile practices broadly across industries. This documentation covers existing requirements to help protect similar data on other platforms which is a common-sense approach often prescribed within mobile security circles. We expect to see continued maturation to the degree that mobile operating systems become accepted, controlled, and supported as other computer operating systems.

93
Notes

94
Notes

95
Notes

96
IBM Security Systems IBM X-Force 2012 Trend and Risk Report
WGL03027-USEN-00
© Copyright IBM Corporation 2013 IBM CorporationSoftware GroupRoute 100Somers, NY 10589 U.S.A. Produced in the United States of AmericaMarch 2013 IBM, the IBM logo, ibm.com, AppScan and IBM X-Force are trademarks or registered trademarks of International Business Machines Corporation in the United States, other countries, or both. If these and other IBM trademarked terms are marked on their first occurrence in this information with a trademark symbol (® or ™), these symbols indicate U.S. registered or common law trademarks owned by IBM at the time this information was published. Such trademarks may also be registered or common law trademarks in other countries. A current list of IBM trademarks is available on the web at “Copyright and trademark information” at ibm.com/legal/copytrade.shtml Microsoft and Windows are trademarks of Microsoft Corporation in the United States, other countries, or both. Other company, product or service names may be trademarks or service marks of others. Information in this document concerning non-IBM products was obtained from the suppliers of these products, published announcement material or other publicly available sources. Questions on the capabilities of non-IBM products should be addressed to the suppliers of those products. This document is current as of the initial date of publication and may be changed by IBM at any time. Not all offerings are available in every country in which IBM operates The performance data and client examples cited are presented for illustrative purposes only. Actual performance results may vary depending on specific configurations and operating conditions. It is the user’s responsibility to evaluate and verify the operation of any other products or programs with IBM products and programs. THE INFORMATION IN THIS DOCUMENT IS PROVIDED “AS IS” WITHOUT ANY WARRANTY, EXPRESS OR IMPLIED, INCLUDING WITHOUT ANY WARRANTIES OF MERCHANTABILITY, FITNESS FOR A PARTICULAR PURPOSE AND ANY WARRANTY OR CONDITION OF NON-INFRINGEMENT. IBM products are warranted according to the terms and conditions of the agreements under which they are provided. The client is responsible for ensuring compliance with laws and regulations applicable to it. IBM does not provide legal advice or represent or warrant that its services or products will ensure that the client is in compliance with any law or regulation. Statements regarding IBM’s future direction and intent are subject to change or withdrawal without notice, and represent goals and objectives only. The use of third-party data, studies and/or quoted material does not represent an endorsement by IBM of the publishing organization, nor does it necessarily represent the viewpoint of IBM. IT system security involves protecting systems and information through prevention, detection and response to improper access from within and outside your enterprise. Improper access can result in information being altered, destroyed, misappropriated or misused or can result in damage to or misuse of your systems, including for use in attacks on others. No IT system or product should be considered completely secure and no single product, service or security measure can be completely effective in preventing improper use or access. IBM systems, products and services are designed to be part of a comprehensive security approach, which will necessarily involve additional operational procedures, and may require other systems, products or services to be most effective. IBM DOES NOT WARRANT THAT ANY SYSTEMS, PRODUCTS OR SERVICES ARE IMMUNE FROM, OR WILL MAKE YOUR ENTERPRISE IMMUNE FROM, THE MALICIOUS OR ILLEGAL CONDUCT OF ANY PARTY.
Please Recycle