Embed Size (px)
Citation preview

ibm.com/redbooks Redpaper
IBM® WebSphere®
IBM ILOG ODM Enterprise and Data Integration
Amtul AzizShelley L. CrayonIoannis Gamvros
Vasfi GucerJoseph J LeeMartin Shell
Learn about ODM Enterprise integration with IBM InfoSphere and Cognos BI
Follow the optimization scenario for the Supply Demand model
Understand ODM Enterprise integrations
Front cover


IBM ILOG ODM Enterprise and Data Integration
June 2011
International Technical Support Organization
REDP-4740-00

© Copyright International Business Machines Corporation 2011. All rights reserved.Note to U.S. Government Users Restricted Rights -- Use, duplication or disclosure restricted by GSA ADPSchedule Contract with IBM Corp.
First Edition (June 2011)
This edition applies to IBM ILOG ODM Enterprise Version V3.4.0.2, IBM Cognos Business Intelligence V10.0, IBM WebSphere Application Server V7.0, and IBM InfoSphere Warehouse V9.7.
This document created or updated on June 10, 2011.
Note: Before using this information and the product it supports, read the information in “Notices” on page vii.

Contents
Notices . . . . . . . . . . . . . . . . . . . . . . . . . . . . . . . . . . . . . . . . . . . . . . . . . . . . . . viiTrademarks . . . . . . . . . . . . . . . . . . . . . . . . . . . . . . . . . . . . . . . . . . . . . . . . . . . viii
Preface . . . . . . . . . . . . . . . . . . . . . . . . . . . . . . . . . . . . . . . . . . . . . . . . . . . . . . . ixThe team who wrote this paper . . . . . . . . . . . . . . . . . . . . . . . . . . . . . . . . . . . . . ixNow you can become a published author, too! . . . . . . . . . . . . . . . . . . . . . . . . . xiComments welcome. . . . . . . . . . . . . . . . . . . . . . . . . . . . . . . . . . . . . . . . . . . . . xiiStay connected to IBM Redbooks . . . . . . . . . . . . . . . . . . . . . . . . . . . . . . . . . . xii
Chapter 1. Introduction to the optimization scenario . . . . . . . . . . . . . . . . . 11.1 Scenario overview . . . . . . . . . . . . . . . . . . . . . . . . . . . . . . . . . . . . . . . . . . . . 21.2 Business value of the scenario . . . . . . . . . . . . . . . . . . . . . . . . . . . . . . . . . . 31.3 Introduction to the products used in the scenario . . . . . . . . . . . . . . . . . . . . 4
1.3.1 ILOG ODM Enterprise. . . . . . . . . . . . . . . . . . . . . . . . . . . . . . . . . . . . . 41.3.2 IBM Cognos Business Intelligence . . . . . . . . . . . . . . . . . . . . . . . . . . . 51.3.3 WebSphere Application Server . . . . . . . . . . . . . . . . . . . . . . . . . . . . . . 51.3.4 IBM InfoSphere Warehouse and InfoSphere Warehouse Cubing
Services . . . . . . . . . . . . . . . . . . . . . . . . . . . . . . . . . . . . . . . . . . . . . . . 51.4 Development process of the ILOG ODM Enterprise application . . . . . . . . . 6
1.4.1 Roles in the development process . . . . . . . . . . . . . . . . . . . . . . . . . . . 61.4.2 High-level description of the development process. . . . . . . . . . . . . . . 8
1.5 Description of the environment . . . . . . . . . . . . . . . . . . . . . . . . . . . . . . . . . . 8
Chapter 2. Implementing the staging database . . . . . . . . . . . . . . . . . . . . . 112.1 Introduction and data flow diagram . . . . . . . . . . . . . . . . . . . . . . . . . . . . . . 122.2 Corporate database. . . . . . . . . . . . . . . . . . . . . . . . . . . . . . . . . . . . . . . . . . 14
2.2.1 CORP data model . . . . . . . . . . . . . . . . . . . . . . . . . . . . . . . . . . . . . . . 142.3 Staging database . . . . . . . . . . . . . . . . . . . . . . . . . . . . . . . . . . . . . . . . . . . 16
2.3.1 Analyzing the data. . . . . . . . . . . . . . . . . . . . . . . . . . . . . . . . . . . . . . . 162.3.2 Defining the schema . . . . . . . . . . . . . . . . . . . . . . . . . . . . . . . . . . . . . 172.3.3 ETL for ODME_STG . . . . . . . . . . . . . . . . . . . . . . . . . . . . . . . . . . . . . 172.3.4 ODME_STG data model . . . . . . . . . . . . . . . . . . . . . . . . . . . . . . . . . . 182.3.5 ODME_SCENARIO data model . . . . . . . . . . . . . . . . . . . . . . . . . . . . 19
2.4 Reporting database . . . . . . . . . . . . . . . . . . . . . . . . . . . . . . . . . . . . . . . . . . 202.4.1 ODME_DIM dimensional model . . . . . . . . . . . . . . . . . . . . . . . . . . . . 202.4.2 ETL for ODME_DIM . . . . . . . . . . . . . . . . . . . . . . . . . . . . . . . . . . . . . 21
Chapter 3. Developing and deploying the ILOG ODM Enterprise solution233.1 Initial development and the application data model . . . . . . . . . . . . . . . . . 24
© Copyright IBM Corp. 2011. All rights reserved. iii

3.1.1 Initial development . . . . . . . . . . . . . . . . . . . . . . . . . . . . . . . . . . . . . . 243.1.2 Defining the input schema. . . . . . . . . . . . . . . . . . . . . . . . . . . . . . . . . 253.1.3 Defining the output schema . . . . . . . . . . . . . . . . . . . . . . . . . . . . . . . 27
3.2 Creating the user interface to the solution. . . . . . . . . . . . . . . . . . . . . . . . . 333.3 Adding optimization to the solution . . . . . . . . . . . . . . . . . . . . . . . . . . . . . . 363.4 Data exporting . . . . . . . . . . . . . . . . . . . . . . . . . . . . . . . . . . . . . . . . . . . . . . 38
3.4.1 Data exporting schema . . . . . . . . . . . . . . . . . . . . . . . . . . . . . . . . . . . 383.4.2 Creating and configuring the Java project. . . . . . . . . . . . . . . . . . . . . 393.4.3 Custom exporting code . . . . . . . . . . . . . . . . . . . . . . . . . . . . . . . . . . . 393.4.4 Editing the XML. . . . . . . . . . . . . . . . . . . . . . . . . . . . . . . . . . . . . . . . . 423.4.5 Debugging the custom Java code. . . . . . . . . . . . . . . . . . . . . . . . . . . 43
3.5 Deploying the ODM Enterprise solution . . . . . . . . . . . . . . . . . . . . . . . . . . 453.5.1 Configuring the connection to ODM Scenario Repository. . . . . . . . . 453.5.2 Configuring the connection to the staging database . . . . . . . . . . . . . 473.5.3 Configuring the connection to the optimization server . . . . . . . . . . . 483.5.4 Deploying the ILOG ODM Enterprise application . . . . . . . . . . . . . . . 49
Chapter 4. Scenario management using ILOG ODM Enterprise . . . . . . . . 514.1 Basic concepts of scenario management . . . . . . . . . . . . . . . . . . . . . . . . . 52
4.1.1 Creating an initial scenario . . . . . . . . . . . . . . . . . . . . . . . . . . . . . . . . 524.1.2 Reviewing scenario components . . . . . . . . . . . . . . . . . . . . . . . . . . . 53
4.2 Creating a new scenario . . . . . . . . . . . . . . . . . . . . . . . . . . . . . . . . . . . . . . 574.2.1 What-If analysis. . . . . . . . . . . . . . . . . . . . . . . . . . . . . . . . . . . . . . . . . 574.2.2 Goal programming . . . . . . . . . . . . . . . . . . . . . . . . . . . . . . . . . . . . . . 574.2.3 Parameterization . . . . . . . . . . . . . . . . . . . . . . . . . . . . . . . . . . . . . . . . 584.2.4 Incorporation of optional business rules . . . . . . . . . . . . . . . . . . . . . . 59
4.3 Solving and reviewing scenarios . . . . . . . . . . . . . . . . . . . . . . . . . . . . . . . . 614.3.1 Scenario creation . . . . . . . . . . . . . . . . . . . . . . . . . . . . . . . . . . . . . . . 614.3.2 Scenario review and comparison . . . . . . . . . . . . . . . . . . . . . . . . . . . 61
4.4 Scenario collaboration and sharing . . . . . . . . . . . . . . . . . . . . . . . . . . . . . . 674.5 Scenario export . . . . . . . . . . . . . . . . . . . . . . . . . . . . . . . . . . . . . . . . . . . . . 68
Chapter 5. ILOG ODM Enterprise scenarios with IBM InfoSphere Warehouse and IBM Cognos BI . . . . . . . . . . . . . . . . . . . . . . . . . . . . . . . . . . . 69
5.1 InfoSphere Warehouse cube model and cube . . . . . . . . . . . . . . . . . . . . . 705.2 IBM Cognos architecture. . . . . . . . . . . . . . . . . . . . . . . . . . . . . . . . . . . . . . 705.3 IBM Cognos 10 metadata . . . . . . . . . . . . . . . . . . . . . . . . . . . . . . . . . . . . . 725.4 Importing into Framework Manager . . . . . . . . . . . . . . . . . . . . . . . . . . . . . 725.5 Publishing a Framework Manager package . . . . . . . . . . . . . . . . . . . . . . . 805.6 Creating a Cognos report . . . . . . . . . . . . . . . . . . . . . . . . . . . . . . . . . . . . . 835.7 ILOG ODM Enterprise reporting examples using IBM Cognos BI. . . . . . . 86
5.7.1 Monthly Inventory report . . . . . . . . . . . . . . . . . . . . . . . . . . . . . . . . . . 875.7.2 Optimized Allocation versus Demand Input . . . . . . . . . . . . . . . . . . . 88
iv IBM ILOG ODM Enterprise and Data Integration
5.8 Optimized Solution for a Single Month of Production . . . . . . . . . . . . . . . . 895.8.1 Optimization Scenario Comparison. . . . . . . . . . . . . . . . . . . . . . . . . . 90
Appendix A. Additional material . . . . . . . . . . . . . . . . . . . . . . . . . . . . . . . . . 91Locating the web material . . . . . . . . . . . . . . . . . . . . . . . . . . . . . . . . . . . . . . . . 91Using the web material . . . . . . . . . . . . . . . . . . . . . . . . . . . . . . . . . . . . . . . . . . . 92
System requirements for downloading the web material . . . . . . . . . . . . . . 92Downloading and extracting the web material . . . . . . . . . . . . . . . . . . . . . . 92
Related publications . . . . . . . . . . . . . . . . . . . . . . . . . . . . . . . . . . . . . . . . . . . 93IBM Redbooks . . . . . . . . . . . . . . . . . . . . . . . . . . . . . . . . . . . . . . . . . . . . . . . . . 93Online resources . . . . . . . . . . . . . . . . . . . . . . . . . . . . . . . . . . . . . . . . . . . . . . . 93Help from IBM . . . . . . . . . . . . . . . . . . . . . . . . . . . . . . . . . . . . . . . . . . . . . . . . . 94
Contents v

vi IBM ILOG ODM Enterprise and Data Integration

Notices
This information was developed for products and services offered in the U.S.A.
IBM may not offer the products, services, or features discussed in this document in other countries. Consult your local IBM representative for information on the products and services currently available in your area. Any reference to an IBM product, program, or service is not intended to state or imply that only that IBM product, program, or service may be used. Any functionally equivalent product, program, or service that does not infringe any IBM intellectual property right may be used instead. However, it is the user's responsibility to evaluate and verify the operation of any non-IBM product, program, or service.
IBM may have patents or pending patent applications covering subject matter described in this document. The furnishing of this document does not give you any license to these patents. You can send license inquiries, in writing, to: IBM Director of Licensing, IBM Corporation, North Castle Drive, Armonk, NY 10504-1785 U.S.A.
The following paragraph does not apply to the United Kingdom or any other country where such provisions are inconsistent with local law: INTERNATIONAL BUSINESS MACHINES CORPORATION PROVIDES THIS PUBLICATION "AS IS" WITHOUT WARRANTY OF ANY KIND, EITHER EXPRESS OR IMPLIED, INCLUDING, BUT NOT LIMITED TO, THE IMPLIED WARRANTIES OF NON-INFRINGEMENT, MERCHANTABILITY OR FITNESS FOR A PARTICULAR PURPOSE. Some states do not allow disclaimer of express or implied warranties in certain transactions, therefore, this statement may not apply to you.
This information could include technical inaccuracies or typographical errors. Changes are periodically made to the information herein; these changes will be incorporated in new editions of the publication. IBM may make improvements and/or changes in the product(s) and/or the program(s) described in this publication at any time without notice.
Any references in this information to non-IBM Web sites are provided for convenience only and do not in any manner serve as an endorsement of those Web sites. The materials at those Web sites are not part of the materials for this IBM product and use of those Web sites is at your own risk.
IBM may use or distribute any of the information you supply in any way it believes appropriate without incurring any obligation to you.
Information concerning non-IBM products was obtained from the suppliers of those products, their published announcements or other publicly available sources. IBM has not tested those products and cannot confirm the accuracy of performance, compatibility or any other claims related to non-IBM products. Questions on the capabilities of non-IBM products should be addressed to the suppliers of those products.
This information contains examples of data and reports used in daily business operations. To illustrate them as completely as possible, the examples include the names of individuals, companies, brands, and products. All of these names are fictitious and any similarity to the names and addresses used by an actual business enterprise is entirely coincidental.
COPYRIGHT LICENSE:
This information contains sample application programs in source language, which illustrate programming techniques on various operating platforms. You may copy, modify, and distribute these sample programs in any form without payment to IBM, for the purposes of developing, using, marketing or distributing application programs conforming to the application programming interface for the operating platform for which the sample programs are written. These examples have not been thoroughly tested under all conditions. IBM, therefore, cannot guarantee or imply reliability, serviceability, or function of these programs.
© Copyright IBM Corp. 2011. All rights reserved. vii

Trademarks
IBM, the IBM logo, and ibm.com are trademarks or registered trademarks of International Business Machines Corporation in the United States, other countries, or both. These and other IBM trademarked terms are marked on their first occurrence in this information with the appropriate symbol (® or ™), indicating US registered or common law trademarks owned by IBM at the time this information was published. Such trademarks may also be registered or common law trademarks in other countries. A current list of IBM trademarks is available on the Web at http://www.ibm.com/legal/copytrade.shtml
The following terms are trademarks of the International Business Machines Corporation in the United States, other countries, or both:
Cognos®CPLEX®DB2®IBM®
ILOG®InfoSphere™Maximo®Redbooks®
Redpaper™Redbooks (logo) ®Tivoli®WebSphere®
The following terms are trademarks of other companies:
ITIL is a registered trademark, and a registered community trademark of the Office of Government Commerce, and is registered in the U.S. Patent and Trademark Office.
Java, and all Java-based trademarks are trademarks of Sun Microsystems, Inc. in the United States, other countries, or both.
Windows, and the Windows logo are trademarks of Microsoft Corporation in the United States, other countries, or both.
UNIX is a registered trademark of The Open Group in the United States and other countries.
Linux is a trademark of Linus Torvalds in the United States, other countries, or both.
Other company, product, or service names may be trademarks or service marks of others.
viii IBM ILOG ODM Enterprise and Data Integration

Preface
IBM® ILOG® ODM Enterprise is a platform to implement and deploy corporate custom solutions for optimization-based planning and scheduling. Developing a realistic plan or schedule that provides the best possible balance between customer service and revenue goals is hard work. With ILOG ODM Enterprise, business leaders can make better decisions through what-if analysis, scenario management, and collaboration.
This IBM Redpaper™ publication showcases the optimization scenario of the Supply Demand application for ILOG ODM Enterprise. This scenario highlights the product features. It includes suggested practices for using IBM Cognos® and InfoSphere™ offerings to extract data and build reports with ILOG ODM Enterprise driving the import and export of data.
The target audience for this paper is IT specialists and IT architects who implement ILOG ODM Enterprise solutions and decision makers such as IT managers.
The team who wrote this paper
This paper was produced by a team of specialists from around the world working at the International Technical Support Organization (ITSO), Rochester Center.
Amtul Aziz is a Business Intelligence (BI) Technical consultant for Systems and Technology Group (STG) independent software vendors (ISV) enablement team with IBM. She has in-depth knowledge in requirements gathering, analysis, data modeling, design, development, and implementation of data warehouse and BI applications. Her focus is on performance tuning of the extract, transform, and load (ETL) process and SQL optimization. She has 12 years of experience in IT involving leadership and consulting on data warehouse and BI solutions. She holds a master degree in computer application from Madurai Kamaraj University, India.
Shelley L. Crayon is an Information Architect with the IBM Business Analytics & Optimization Practice. His areas of expertise are in Analytics and Enterprise Information Management. He has more than 10 years of cross industry experience, where he has architected and developed data-warehousing and analytical applications. Shelley holds a Masters of Information Systems
© Copyright IBM Corp. 2011. All rights reserved. ix

Management degree from Carnegie Mellon University and a Bachelor of Science degree in computer science from Morehouse College.
Ioannis Gamvros is an Optimization Solutions Technical Sales Specialist and joined IBM in 2009 when IBM acquired ILOG. During his ILOG tenure, Yianni was an optimization consultant, and before that worked as an independent consultant on various optimization projects. Yianni's consulting work has exposed him to a wide variety of OR problems, in diverse industries such as shipping, manufacturing, consumer products, transportation and telecommunications, and functional areas such as supply chain, inventory and revenue management, and scheduling. His recent work as part of the optimization sales team frequently involves designing end-to-end optimization solutions and showcasing the value proposition of IBM optimization software. He received a BS degree in electrical engineering from the Aristotle University of Thessalonika in Greece, and a PhD in operations research (OR) from the University of Maryland in College Park.
Vasfi Gucer is a Project Leader for the IBM ITSO in Austin, TX. He has been with the ITSO since January 1999. He has more than 15 years of experience in the areas of Systems Management, networking hardware, and software on mainframe and distributed platforms. He has worked on various IBM Tivoli® client projects as a Systems Architect in the USA. He writes extensively and teaches IBM classes worldwide on Tivoli software. Vasfi is also an IBM Certified Senior IT Specialist, PMP, and ITIL Expert.
Joseph J. Lee is an IT Specialist for the IBM Integrated Technology Delivery organization. He serves as an architect integrating IBM systems such as Maximo® and eESM with customer IT management tools. Since joining IBM 11 years ago, he has also done Java coding, IBM DB2® DBA support, and eESM application support for IBM Global Services. Before joining IBM, Joseph graduated from the US Naval Academy with a BS degree in general engineering. After serving in the US Navy, he earned a BS degree in computer science from the University of North Carolina at Wilmington and joined IBM.
Martin Shell is a Technical Sales Specialist for ILOG Optimization, including IBM ILOG CPLEX® Optimization Studio and ODM Enterprise. Martin joined IBM as part of the ILOG acquisition two years ago. At ILOG, Martin worked as a consultant, technical marketing specialist, and technical account manager, He has also worked as an analyst, consultant, developer, and development manager for several companies, focusing on the application of optimization technology to a wide range of business application areas. Martin holds a Masters of Science degree in operations research from M.I.T.
x IBM ILOG ODM Enterprise and Data Integration

Thanks to the following people for their contributions to this project:
Tamika BarrowLinda RobinsonStephen SmithDebbie WillmschenInternational Technical Support Organization
Sandy EmersonJan HelleveJoseph PohlenGeorge Sax IBM USA
Philippe GregoireFrederic LavigneIBM France
Alain ChabrierIBM Spain
Now you can become a published author, too!
Here's an opportunity to spotlight your skills, grow your career, and become a published author—all at the same time! Join an ITSO residency project and help write a book in your area of expertise, while honing your experience using leading-edge technologies. Your efforts will help to increase product acceptance and customer satisfaction, as you expand your network of technical contacts and relationships. Residencies run from two to six weeks in length, and you can participate either in person or as a remote resident working from your home base.
Find out more about the residency program, browse the residency index, and apply online at:
ibm.com/redbooks/residencies.html
Preface xi

Comments welcome
Your comments are important to us!
We want our papers to be as helpful as possible. Send us your comments about this paper or other IBM Redbooks® publications in one of the following ways:
� Use the online Contact us review Redbooks form found at:
ibm.com/redbooks
� Send your comments in an email to:
� Mail your comments to:
IBM Corporation, International Technical Support OrganizationDept. HYTD Mail Station P0992455 South RoadPoughkeepsie, NY 12601-5400
Stay connected to IBM Redbooks
� Find us on Facebook:
http://www.facebook.com/IBMRedbooks
� Follow us on Twitter:
http://twitter.com/ibmredbooks
� Look for us on LinkedIn:
http://www.linkedin.com/groups?home=&gid=2130806
� Explore new Redbooks publications, residencies, and workshops with the IBM Redbooks weekly newsletter:
https://www.redbooks.ibm.com/Redbooks.nsf/subscribe?OpenForm
� Stay current on recent Redbooks publications with RSS Feeds:
http://www.redbooks.ibm.com/rss.html
xii IBM ILOG ODM Enterprise and Data Integration

Chapter 1. Introduction to the optimization scenario
This chapter provides an overview of the use cases and software products employed to demonstrate a typical business solution using the IBM ILOG ODM Enterprise. ILOG ODM Enterprise is a configurable platform for custom planning and scheduling. You can also find information about the ILOG ODM Enterprise development process in this chapter.
This chapter includes the following topics:
� Scenario overview� Business value of the scenario� Introduction to the products used in the scenario� Development process of the ILOG ODM Enterprise application� Description of the environment
1
© Copyright IBM Corp. 2011. All rights reserved. 1
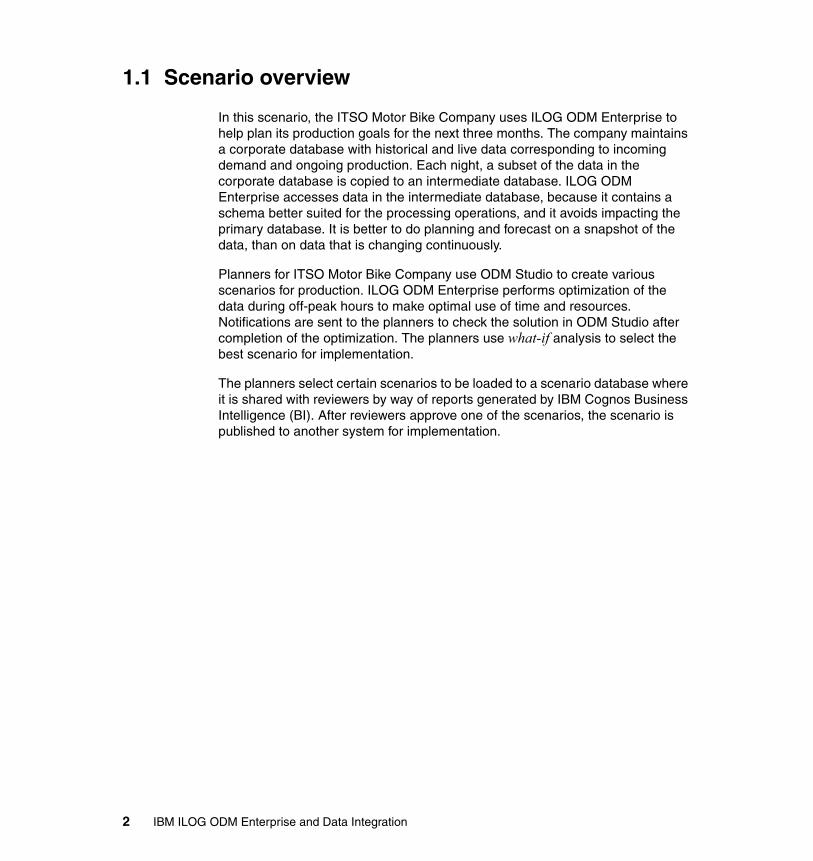
1.1 Scenario overview
In this scenario, the ITSO Motor Bike Company uses ILOG ODM Enterprise to help plan its production goals for the next three months. The company maintains a corporate database with historical and live data corresponding to incoming demand and ongoing production. Each night, a subset of the data in the corporate database is copied to an intermediate database. ILOG ODM Enterprise accesses data in the intermediate database, because it contains a schema better suited for the processing operations, and it avoids impacting the primary database. It is better to do planning and forecast on a snapshot of the data, than on data that is changing continuously.
Planners for ITSO Motor Bike Company use ODM Studio to create various scenarios for production. ILOG ODM Enterprise performs optimization of the data during off-peak hours to make optimal use of time and resources. Notifications are sent to the planners to check the solution in ODM Studio after completion of the optimization. The planners use what-if analysis to select the best scenario for implementation.
The planners select certain scenarios to be loaded to a scenario database where it is shared with reviewers by way of reports generated by IBM Cognos Business Intelligence (BI). After reviewers approve one of the scenarios, the scenario is published to another system for implementation.
2 IBM ILOG ODM Enterprise and Data Integration

Figure 1-1 illustrates the data integration and use-case scenario.
Figure 1-1 ILOG ODM Enterprise use-case scenario
1.2 Business value of the scenario
The use case presented for the ITSO Motor Bike Company demonstrates certain benefits to corporations when using the ILOG ODM Enterprise to plan business operations. For the company in the use case, the optimization exercise provides the following tools for planners to make decisions:
� What products to build� Where to build them� When to build them� How much to allocate to each market
ODM Enterprise Data Integration Scenario
ODM Enterprise optimizationserver on WebSphere
Cognos BIScheduler
Reporting database onInfoSphere Warehouse
reports
generated
data used by Cognos
Ad Hocor
Pre-defined Reporting
Scenariodatabase onInfoSphere Warehouse
Inputdatabase onInfoSphereWarehouse
Corporate databaseon
InfoSphere Warehouse
pull data into star reporting databaseextract of
subset of tables
ODM Scenario Repository database
InfoSphere Warehouse
outp
ut
data pulled for
optimization scenario
calculations
Chapter 1. Introduction to the optimization scenario 3

1.3 Introduction to the products used in the scenario
This topic provides an introduction to the products used in the optimization scenario.
1.3.1 ILOG ODM Enterprise
In this sample use case, ILOG ODM Enterprise 3.4.0.2 was used as an enterprise platform for developing and deploying solutions for business decision makers. ILOG ODM Enterprise uses advanced mathematical-based optimization tools and engines for efficiency planning and scheduling. The use case takes advantage of the following features of ILOG ODM Enterprise:
� Flexibility, by providing the ability to do what-if analysis, scenario management, and comparison. With this flexibility, planners can make informed decisions based on trade-offs between alternative solutions and conflicting business goals.
� Detailed visualization of data through drill-down menus and graphical displays.
� Optimization technology using the IBM ILOG CPLEX optimization engine.
� A powerful modeling language called Optimization Programming Language (OPL).
� Planners and schedulers can collaborate by sharing optimization scenarios through a central repository.
For more information about ILOG ODM Enterprise, see the ILOG ODM Enterprise V3.4 Information Center at:
http://publib.boulder.ibm.com/infocenter/odmeinfo/v3r4/index.jsp
Optimization Programming Language: An optimization problem is typically specified by an objective function and a set of constraints over certain decision variables. A solution to the problem is an assignment of values to the variables that satisfies the constraints and optimizes the value of the objective function. The purpose of an OPL statement is to express these two components for the application.
4 IBM ILOG ODM Enterprise and Data Integration

1.3.2 IBM Cognos Business Intelligence
IBM Cognos Business Intelligence V10 was used to deliver key information to the planners to facilitate their decision making process. All capabilities such as viewing, creating, and administering dashboards, reports, and analysis are accessed through web interfaces. IBM Cognos Business Intelligence is built upon a web-based, service-oriented architecture (SOA) that is designed for scalability and openness.
For information about IBM Cognos BI architecture, see 5.2, “IBM Cognos architecture” on page 70. For more information about IBM Cognos BI, go to the IBM Cognos Business Intelligence V10 Information Center at:
http://publib.boulder.ibm.com/infocenter/cbi/v10r1m0/index.jsp
1.3.3 WebSphere Application Server
For this project, IBM WebSphere® Application Server 7.0 is used as the IBM runtime environment for Java technology-based applications. The application server acts as a middleware between back end systems and clients. It provides a programming model, an infrastructure framework, and a set of standards for a consistently designed link between them.
For more information and documentation about IBM WebSphere Application Server 7.0, see the IBM WebSphere Application Server 7.0 Information Center at:
http://publib.boulder.ibm.com/infocenter/wasinfo/v7r0/index.jsp
1.3.4 IBM InfoSphere Warehouse and InfoSphere Warehouse Cubing Services
The IBM InfoSphere components explained in this topic are used for the optimization scenario.
InfoSphere WarehouseInfoSphere Warehouse is a suite of components that combine the DB2 database engine with business analytic features. InfoSphere Warehouse includes a scalable relational database engine, data access capabilities, business analytics, and user analysis tools. It incorporates core components for warehouse administration, data mining, online analytical processing (OLAP), inline analytics and reporting, and workload management.
Chapter 1. Introduction to the optimization scenario 5

InfoSphere Warehouse Cubing ServicesOLAP is a core component of data warehousing and analytics. It gives users the ability to interrogate data by intuitively navigating data from summary to detail. InfoSphere Warehouse Cubing Services, a multidimensional analysis server, enables OLAP applications access to terabyte volumes of data through industry standard OLAP connectivity. This warehouse-based OLAP capability is a core pillar of the InfoSphere Warehouse analytics platform.
For detailed information about InfoSphere Warehouse, see the IBM DB2 Database for Linux, UNIX, and Windows Information Center at:
http://publib.boulder.ibm.com/infocenter/db2luw/v9r7/index.jsp
1.4 Development process of the ILOG ODM Enterprise application
This topic provides information about the development process of the ILOG ODM Enterprise application. The roles involved in the optimization development process of ILOG ODM Enterprise are also provided.
1.4.1 Roles in the development process
The following roles are involved in the ILOG ODM Enterprise optimization development process (Figure 1-3 on page 9):
� Business Analyst� Optimization Expert (OR)� Software Developer (IT)� Application QA
6 IBM ILOG ODM Enterprise and Data Integration

Figure 1-2 shows the roles of the ILOG ODM Enterprise optimization development process.
Figure 1-2 ILOG ODM Enterprise optimization development process
What about a DBA?: ILOG ODM Enterprise has a data model that reflects the database. Therefore, in certain cases you might also involve a DBA or an integration expert, separate from the software developer. Their assistance is especially helpful when you integrate ILOG ODM Enterprise with other products, similar to the scenario presented in this book.
Chapter 1. Introduction to the optimization scenario 7

1.4.2 High-level description of the development process
To set up the development process, complete the following steps:
1. Define the application data model separately from optimization, by defining it from scratch or by reverse engineering an existing database.
2. Build a complete functional application without optimization, such as create views, connect to the data, and so on.
3. Add optimization capability, which includes linking to the optimization model and defining mapping, goals, and requirements.
1.5 Description of the environment
The scenario for the ITSO Motor Bike Company is implemented using an environment with the following servers:
� An optimization server running ILOG ODM Enterprise 3.4.0.2
� A data server running IBM InfoSphere Warehouse
This server is used to host the corporate database, ODME_INPUT database, ODME_SCENARIO database, and the ODME_DIM (reporting) database. Cubing Services is also used on this server.
� An IBM Cognos BI server running IBM Cognos Business Intelligence V10
8 IBM ILOG ODM Enterprise and Data Integration

Figure 1-3 shows the server environment.
Figure 1-3 Scenario environment
Chapter 1. Introduction to the optimization scenario 9

10 IBM ILOG ODM Enterprise and Data Integration

Chapter 2. Implementing the staging database
This chapter provides an understanding of the ITSO Motor Bike company database and information about designing the data model for the staging database, also called the intermediate database. The staging database schema suits the requirement of creating scenarios in the ODM Studio. Data is imported in the ILOG ODM Enterprise using this schema. Also solution scenario data from the ILOG ODM Enterprise is exported to the staging database. The design for dimensional modeling is also provided for the purpose of generating reports.
This chapter includes the following topics:
� Introduction and data flow diagram� Corporate database� Staging database� Reporting database
2
© Copyright IBM Corp. 2011. All rights reserved. 11

2.1 Introduction and data flow diagram
This topic provides a data flow diagram and information about ITSO Motor Bike company data flow.
Corporate database (CORP schema) has the ITSO Motor Bike company data. The staging database consists of the input database (ODME_STG schema) and the scenario database (ODME_SCENARIO schema). The input database is a subset of the CORP schema and has all the required data for the optimizing scenario calculation in ODM Studio. Data is imported to the ODM Enterprise Scenario repository (ODME_INT) from the input database. For more information about ODM Enterprise Scenario Repository, see 3.5.1, “Configuring the connection to ODM Scenario Repository” on page 45.
After the solution for the scenario is optimized, scenario data is exported to the ODME_SCENARIO database. For reporting purposes, the data in the ODME_SCENARIO is pulled to the reporting database (ODME_DIM) in the form of a star schema.
12 IBM ILOG ODM Enterprise and Data Integration

Figure 2-1 shows ITSO Motor Bike company data flow.
Figure 2-1 Data flow diagram
ODM Enterprise Data Integration Scenario
ODM Enterprise optimizationserver on WebSphere
Cognos BIScheduler
Reporting database onInfoSphere Warehouse
repor
ts gene
rated
data used by Cognos
Ad Hocor
Pre-defined Reporting
Scenariodatabase onInfoSphere Warehouse
Inputdatabase onInfoSphereWarehouse
Corporate databaseon
InfoSphere Warehouse
pull data into star reporting databaseextract of
subset of tables
ODM Scenario Repository database
InfoSphere Warehouse
outp
ut
data pulled for
optimization scenario
calculations
Chapter 2. Implementing the staging database 13

2.2 Corporate database
The ITSO Motor Bike company has a corporate database with historical and live data corresponding to incoming demand and ongoing production.
Corporate database is a relational database. MOTODB is corporate database, and CORP is corporate schema. Tables are categorized with respect to following subject areas:
Time period Has tables defining the time period as year, quarter, month, and calendar.
Customer and supplier Has customer, supplier, and retailers data.
Product Has product-related data such as product type, product price level, product maturity level, product category, and product details.
Region Has geographical data like region, market or country, and city details.
Plant Has plant details, plant capacity month wise, and plant capacity product wise.
Inventory/demand/sales Has transactional tables having stock, marginal profits, demand, and sales data.
Employee Has employee-related tables.
2.2.1 CORP data model
Figure 2-2 on page 15 shows the CORP data model.
14 IBM ILOG ODM Enterprise and Data Integration

Figure 2-2 Subset of corporate entity-relationship (ER) model
Chapter 2. Implementing the staging database 15

2.3 Staging database
The purpose of having the staging database is to load the data in ODM Studio, so that planners can create scenarios.
Data is extracted from the CORP database and is loaded into the staging database.
2.3.1 Analyzing the data
The ITSO Motor Bike company needs to plan the production for the next months according to demand, stock, and resources.
For analyzing incoming demand and ongoing production, planners need the following data in ODM Studio:
� Markets where the product is in demand or sold� Monthly demand for the product in the market� Initial stock available for the product� Monthly sales figures for a product in the market� Monthly marginal profits for a product in the market� Monthly plant capacity� Plant capacity product wise� Plant product cost
16 IBM ILOG ODM Enterprise and Data Integration

2.3.2 Defining the schema
Schema is designed in such a way that the data required by the planners is available and is imported directly in ODM Studio. ODME_STG is the intermediate database. The staging database (ODME_STG) requires the following entities:
� YEARS� QUARTERS� MONTHS� REGION� MARKETS� PLANTS� PRODUCT_TYPES� PRODUCT_MATURITIES� PRODUCT_PRICE_LEVELS� PRODUCTS� PLANT_MONTH_CAPACITIES� PLANT_PRODUCT_CAPACITIES� PLANT_PRODUCT_COSTS� INITIAL_INVENTORIES� MARGINAL_PROFITS� DEMANDS� SALES
After the planner creates the solution scenario in ODM Studio, the scenario is pushed back to the database so that reports can run against it to review the scenarios. ODME_SCENARIO schema is created to store the scenario data.
2.3.3 ETL for ODME_STG
The following characteristics are present in the extract, transform, and load (ETL) process for ODME_STG:
� Data is extracted from CORP schema and is loaded to respective tables in ODM_STG.
� ETL for ODME_STG is direct bulk load. No transformation is required.
� Load frequency is daily.
Chapter 2. Implementing the staging database 17

2.3.4 ODME_STG data model
Figure 2-3 shows the ODME_STG data model.
Figure 2-3 Intermediate (ODME_STG) ER model
18 IBM ILOG ODM Enterprise and Data Integration

2.3.5 ODME_SCENARIO data model
Figure 2-4 shows the ODME_SCENARIO data model.
Figure 2-4 Intermediate (ODME_SCENARIO) ER model
Chapter 2. Implementing the staging database 19

2.4 Reporting database
For generating reports we created and implemented a dimensional model (ODME_DIM). The following dimensions and facts were identified for this database:
� Dimensions, including the following data:
– TIME– LOCATION– PRODUCT– PLANT
� Facts, such as SCENARIO_FACT
2.4.1 ODME_DIM dimensional model
Figure 2-5 shows the ODME_DIM dimensional model.
Figure 2-5 ODME_DIM dimensional model
20 IBM ILOG ODM Enterprise and Data Integration

2.4.2 ETL for ODME_DIM
To load the data in the dimensions and fact tables, complete the following steps:
1. Load the dimension tables using the CORP schema.
The scripts are in the scripts.zip file, which is available in the additional materials for this paper.
2. Load the fact table using the ODME_SCENARIO tables.
Downloading the DDL scripts for the databases: To download the DDL scripts for the ODME_STG, ODME_SCENARIO, and ODME_DIM schemas, see Appendix A, “Additional material” on page 91.
Prerequisite: Prior to completing these steps, you must download the scripts that are provided as additional material for this paper. For more information, see Appendix A, “Additional material” on page 91.
Chapter 2. Implementing the staging database 21

22 IBM ILOG ODM Enterprise and Data Integration

Chapter 3. Developing and deploying the ILOG ODM Enterprise solution
This chapter provides key tasks required to develop and deploy the ILOG ODM Enterprise solution.
This chapter includes the following topics:
� Initial development and the application data model� Creating the user interface to the solution� Adding optimization to the solution� Data exporting� Deploying the ODM Enterprise solution
3
© Copyright IBM Corp. 2011. All rights reserved. 23
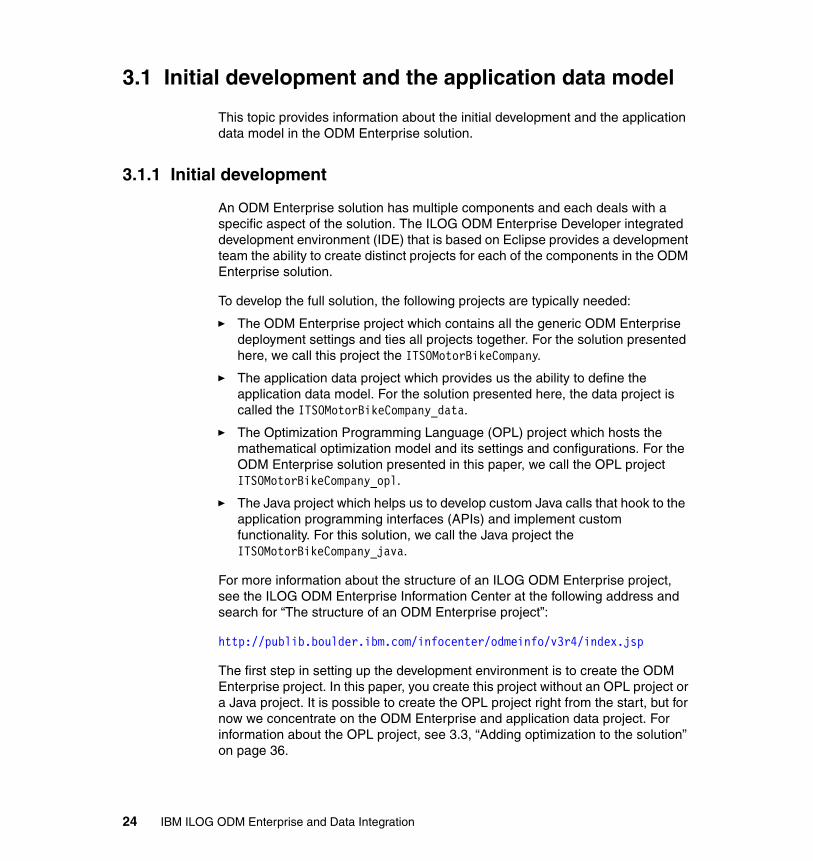
3.1 Initial development and the application data model
This topic provides information about the initial development and the application data model in the ODM Enterprise solution.
3.1.1 Initial development
An ODM Enterprise solution has multiple components and each deals with a specific aspect of the solution. The ILOG ODM Enterprise Developer integrated development environment (IDE) that is based on Eclipse provides a development team the ability to create distinct projects for each of the components in the ODM Enterprise solution.
To develop the full solution, the following projects are typically needed:
� The ODM Enterprise project which contains all the generic ODM Enterprise deployment settings and ties all projects together. For the solution presented here, we call this project the ITSOMotorBikeCompany.
� The application data project which provides us the ability to define the application data model. For the solution presented here, the data project is called the ITSOMotorBikeCompany_data.
� The Optimization Programming Language (OPL) project which hosts the mathematical optimization model and its settings and configurations. For the ODM Enterprise solution presented in this paper, we call the OPL project ITSOMotorBikeCompany_opl.
� The Java project which helps us to develop custom Java calls that hook to the application programming interfaces (APIs) and implement custom functionality. For this solution, we call the Java project the ITSOMotorBikeCompany_java.
For more information about the structure of an ILOG ODM Enterprise project, see the ILOG ODM Enterprise Information Center at the following address and search for “The structure of an ODM Enterprise project”:
http://publib.boulder.ibm.com/infocenter/odmeinfo/v3r4/index.jsp
The first step in setting up the development environment is to create the ODM Enterprise project. In this paper, you create this project without an OPL project or a Java project. It is possible to create the OPL project right from the start, but for now we concentrate on the ODM Enterprise and application data project. For information about the OPL project, see 3.3, “Adding optimization to the solution” on page 36.
24 IBM ILOG ODM Enterprise and Data Integration

For more information about creating an ODM Enterprise project, see the ILOG ODM Enterprise Information Center at the following address and search for “Creating an ODM Enterprise project without an OPL project”:
http://publib.boulder.ibm.com/infocenter/odmeinfo/v3r4/index.jsp
This step is also the first step in the data-centric development process that is presented in 1.4, “Development process of the ILOG ODM Enterprise application” on page 6.
3.1.2 Defining the input schema
After you create the appropriate Eclipse project, you need to create the Application Data Model (ADM) that defines the input and output data schema that the solution uses.
Chapter 1, “Introduction to the optimization scenario” on page 1, explains that a key element of an ODM Enterprise solution is the optimization model. The optimization model is tied to the application and generates the results that are consumed by the business users. Typically an optimization expert works on the optimization model in parallel with the IT experts that work on the rest of the ODM Enterprise solution.
The optimization expert needs to coordinate with the rest of the IT team on two key areas. The first one is the input schema definition. All data that is necessary for the optimization model must be contained in the input data structures. The second key area is the output data schema, which holds all relevant optimization output so that the ODM Enterprise solution and all systems downstream can take advantage of the results generated by optimization.
Chapter 2, “Implementing the staging database” on page 11, describes how the appropriate data for the solution is exported from the corporate database to a staging database. We use the IBM ILOG Enterprise Developer to import the schema already defined in that database instead of defining a new one.
The process of importing the ADM from an existing database is documented in detail in the ILOG ODM Enterprise documentation.
Suggested settings:
� Name the ODM Enterprise project ITSOMotorBikeCompany.� Select the option to Create a model in a new Data Project.� Select the default option for naming the data project.
Chapter 3. Developing and deploying the ILOG ODM Enterprise solution 25

For more information about importing the ADM and step-by-step instructions, see the ILOG ODM Enterprise Information Center at the following address and search for “Creating the ADM by importing from an existing database”:
http://publib.boulder.ibm.com/infocenter/odmeinfo/v3r4/index.jsp
Figure 3-1 shows the solution that is used to connect to the staging database.
Figure 3-1 Defining the ODM Enterprise staging database
The remaining steps in the reverse engineering procedure are practically identical, except for the name of the database schema which uses ODME_STG.
Suggested settings:
� The schema that is used by the ADM of the solution is the one under Database Schema. Therefore, you must move all the tables from the imported schema (in this case ODME_STG) to Database Schema.
� Delete all other schemas from the data project.
26 IBM ILOG ODM Enterprise and Data Integration

For this solution, the imported schema was not altered in any way. With careful design of the ODM Enterprise staging database, the imported schemas are not altered in most cases. However, appropriate data structures are still missing to hold the output of the optimization so that the optimization solution can be exported to other systems.
3.1.3 Defining the output schema
The output schema must capture all necessary information from the optimization solution. Based on the business problem described in 1.1, “Scenario overview” on page 2, the following key areas of the optimization solution are helping the decision process, and therefore, we want to save them as part of the solution:
� The production quantities at the various plants (for each product over the planning horizon)
� The allocation quantities at the various markets (for each product over the planning horizon)
� The executed sales at the various markets (for future planning of each product over the planning horizon)
In addition to the key areas, it will be helpful to obtain the inventory quantity kept at each market, for each product, even though that quantity can be easily computed from the other three key areas.
For more information about the output schema of the ADM using the Data Diagram Editor, see the ILOG ODM Enterprise Information Center at the following address and search for “Creating the ADM using the Data Diagram Editor”:
http://publib.boulder.ibm.com/infocenter/odmeinfo/v3r4/index.jsp
We now explain how to create the table that is to hold the production quantities and provide high-level descriptions of the other three tables. With the step-by-step instructions and the documentation section mentioned output schema instructions, it can be easy to edit the ADM and add the remaining tables.
Chapter 3. Developing and deploying the ILOG ODM Enterprise solution 27
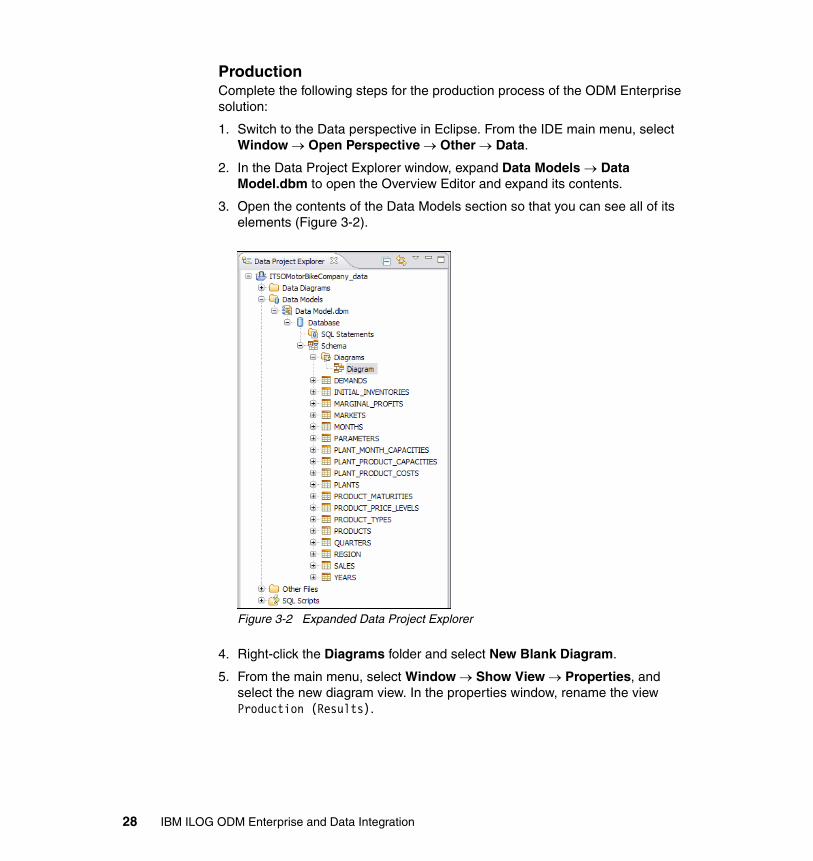
ProductionComplete the following steps for the production process of the ODM Enterprise solution:
1. Switch to the Data perspective in Eclipse. From the IDE main menu, select Window Open Perspective Other Data.
2. In the Data Project Explorer window, expand Data Models Data Model.dbm to open the Overview Editor and expand its contents.
3. Open the contents of the Data Models section so that you can see all of its elements (Figure 3-2).
Figure 3-2 Expanded Data Project Explorer
4. Right-click the Diagrams folder and select New Blank Diagram.
5. From the main menu, select Window Show View Properties, and select the new diagram view. In the properties window, rename the view Production (Results).
28 IBM ILOG ODM Enterprise and Data Integration

6. Double-click the new Productions (Results) view. The main panel in Eclipse now shows the Data Diagram Editor (Figure 3-3).
Figure 3-3 Data Diagram Editor
7. Add a new table in the diagram by hovering the mouse over any blank area of the diagram and click the Add Table button (Figure 3-4).
Figure 3-4 Adding a new table in the Data Diagram Editor
8. Name the table PRODUCTIONS.
9. With the PRODUCTIONS table selected, click the Columns tab in the Properties window.
Chapter 3. Developing and deploying the ILOG ODM Enterprise solution 29

10.Click the New button. Add a new column named VALUE and change its data type to INTEGER (Figure 3-5).
Figure 3-5 Adding the value column
11.In the Data Project Explorer window, expand Schema and select the MONTHS, PLANTS, and PRODUCTS tables at the same time. Drag all three tables to the Productions (Results) view (Figure 3-6).
Figure 3-6 Productions and other tables without any relationships
30 IBM ILOG ODM Enterprise and Data Integration

12.Add an identifying FK relationship from the PRODUCTS table to the PRODUCTIONS table. For step-by-step instructions, see the ILOG ODM Enterprise Information Center and search for Defining primary key–foreign key relationships at:
http://publib.boulder.ibm.com/infocenter/odmeinfo/v3r4/index.jsp
13.When the Key Migration column is displayed, select Create a new child attribute/column and name that new column PRODUCT.
14.Similar to step 12, add an identifying FK relationship from the PLANTS table to the PRODUCTIONS table. Name the new column PLANT.
15.Add an identifying FK relationship from the MONTHS table to the PRODUCTIONS table. Name the new column MONTH.
Figure 3-7 shows how the production and associated connections must look.
Figure 3-7 Productions table definition and related tables
Chapter 3. Developing and deploying the ILOG ODM Enterprise solution 31

AllocationFigure 3-8 shows how the allocation table was defined for this scenario.
Figure 3-8 Allocation table definition and related tables
InventoriesFigure 3-9 shows how the inventories table was defined for this scenario.
Figure 3-9 Inventories table definition and related tables
32 IBM ILOG ODM Enterprise and Data Integration

Executed salesFigure 3-10 shows how the executed sales table was defined for this scenario.
Figure 3-10 Executed sales table definition and related tables
3.2 Creating the user interface to the solution
Creating various views of the input and output tables can help users of the solution easily update input data and get an overview of output data.
To learn about how to create input and output views, see the ILOG ODM Enterprise Information Center at the following address and search for “Generating default views for ADM tables”:
http://publib.boulder.ibm.com/infocenter/odmeinfo/v3r4/index.jsp
The objective here is to create views that provide the users of ILOG ODM Enterprise Planner the ability to review and edit all relevant input and output data in the most convenient way.
Chapter 3. Developing and deploying the ILOG ODM Enterprise solution 33

For this solution, we created and organized the following input, as shown in Figure 3-11:
� Products� Market� Plants and Capacities� Inventory� Misc
Figure 3-11 Input view names, types, and organization
Additionally, we defined the following output views under Solution, as shown in Figure 3-12:
� Allocation� Production� Inventory� Executed Sales
Figure 3-12 Output view names, and types
34 IBM ILOG ODM Enterprise and Data Integration

Multiple other user interface customizations can be implemented as part of an ODM Enterprise solution. The user interface for this ODM Enterprise solution is identical to the interface for the Supply Demand demo that is shipped with the distribution. To learn how to open the examples that come with the distribution, see the ILOG ODM Enterprise Information Center at the following address and search for “The ODM Enterprise examples” at:
http://publib.boulder.ibm.com/infocenter/odmeinfo/v3r4/index.jsp
In the New Example window (Figure 3-13), on the Sorted by Complexity tab, expand Demo and select Supply Demand.
Figure 3-13 New Example window
Chapter 3. Developing and deploying the ILOG ODM Enterprise solution 35

3.3 Adding optimization to the solution
This topic explains how the optimization team generates the OPL project, as presented in 3.1.1, “Initial development” on page 24.
The optimization model that is integrated with an ODM Enterprise solution is developed in parallel with all the other parts of the solution. Even though the team that develops the optimization model can work separately from the team that develops the rest of the application, the two teams must be in constant communication. We already explained how these two teams need to coordinate to agree on the input and output schemas.
The optimization team must complete the following steps:
1. Add an OPL project to the ODM Enterprise solution. For detailed instructions, see the ILOG ODM Enterprise Information Center at the following address and search for “Adding a new OPL project to an ODM Enterprise project”:
http://publib.boulder.ibm.com/infocenter/odmeinfo/v3r4/index.jsp
2. Map the data in the application data model to the OPL project by using the ODM to OPL Mapping Editor. For information about how the Mapping Editor works, see the ILOG ODM Enterprise Information Center at the following address and search for “The ODM To OPL Mapping Editor”:
http://publib.boulder.ibm.com/infocenter/odmeinfo/v3r4/index.jsp
ODM to OPL mapping key points: The following key points are for ODM-to-OPL mapping:
� The key objective during mapping is to map only the data structures that are necessary for the optimization model. The input schema might contain additional structures that enrich the ILOG ODM Enterprise GUI but are not necessary for the optimization model.
� Typically most input schema structures are added as OPL input and most output schema structures are added as OPL output.
� Mapping automatically generates a .mod file that can be imported by the OPL project.
� It is possible to edit the OPL output within the mapping editor to accommodate cases where the default choices made by the editor are not ideal.
36 IBM ILOG ODM Enterprise and Data Integration

The optimization model in this solution uses the name of the month to distinguish between separate time periods. The name of the month in this example also includes the name of the year, for example Jan-2007. It can be used as a unique index for the planning horizon even over multiple years. As a result, the optimization model does not need the data structures related to years and quarters, and therefore, we do not have to map them in the Mapping Editor. More specifically, notice that, when mapping the Months data structure, we only map the name without the foreign key to the Quarters or the ID field.
Additionally, the optimization model does not use product-specific information such as maturities, price levels, and types. As a result, these data structures are not mapped, when it comes to the mapping of the Products structure itself, we leave out the foreign keys to all these structures. Very similar considerations lead to the mapping of Markets without Regions.
Figure 3-14 shows how the Mapping Editor looks after the mapping is complete.
Figure 3-14 ODM-to-OPL Mapping Editor window
3. To save the changes in the editor, click Save. As soon as the changes are saved, the ITSOMotorBikeCompany_odm.mod file in the OPL project is updated.
You can now either develop the optimization model or copy and paste existing models in the ITSOMotorBikeCompany.mod file.
Chapter 3. Developing and deploying the ILOG ODM Enterprise solution 37

For the ODM Enterprise solution that we are building here, we already have a fully functional optimization model that we can use right away. This model is in the SupplyDemand.mod file of the Supply Demand ILOG ODM Enterprise Demo that is included in the distribution.
To generate a data set that can be used with OPL from the user interface, see the ILOG ODM Enterprise Information Center at the following address and search for “Exporting OPL data files from ODM Studio”:
http://publib.boulder.ibm.com/infocenter/odmeinfo/v3r4/index.jsp
3.4 Data exporting
The output from the ODM Enterprise solution typically is required by multiple business stakeholders inside a company. In most cases, it makes sense to have the solution information and all relevant input information exported to a separate data store for safekeeping and general reporting purposes. This section explains how to develop a custom data exporter that achieves this export.
3.4.1 Data exporting schema
The following sets of tables are needed for the data exporting schema:
� The input tables
This set of tables is identical to the schema used for the staging database. Include these tables as part of the scenario data export schema because the scenario input can be edited inside the ILOG ODM Enterprise application by the user.
� The output tables
This set of tables is identical to output schema explained in 3.1.3, “Defining the output schema” on page 27.
Benefits of integrating the OPL project: By integrating the OPL project to the ILOG ODM Enterprise projects earlier rather than later, the optimization development team can realize the following benefits:
� Working with real data imported from the staging database through the input schema
� Sharing intermediate results with the business users through the user interface
� Generating debugging data sets from the user interface
38 IBM ILOG ODM Enterprise and Data Integration

� An auxiliary set of tables
In the implementation of this ODM Enterprise solution, we only included one auxiliary table to capture scenario-specific information to uniquely identify a scenario. The following information was captured:
– The user that generated the scenario– The time that the export occurred– The name of the scenario
This new schema must be constructed in a separate database instance and given an appropriate name. We named this schema ODME_SCENARIO.
3.4.2 Creating and configuring the Java project
To create the Java project that will contain the code necessary to export the data, complete the following steps:
1. Switch to the Java perspective in Eclipse. From the menu, navigate to Window Open Perspective Other and select Java (Default).
2. From the menu, select File New Java Project.
3. In the New Java Project window, add ITSOMotorBikeCompany_java as the name of the project and click Next.
4. Select the Libraries tab and click the Add Library... button. Select ODM Library from the list and click Next. Click Finish.
5. After the project has been created, create a package that holds the code which implements the custom exporting. Right-click the src folder under the Java project, and select New Package. Name the package itsomotorbikecompany.export.
3.4.3 Custom exporting code
We implemented two Java classes. The first one is called DatabaseUtilities.java, and the second one is called DatabaseExporter.java. To download the code for both of these classes, see Appendix A, “Additional material” on page 91.
Chapter 3. Developing and deploying the ILOG ODM Enterprise solution 39

Database utilitiesThe following generic utility functions were implemented in the DatabaseUtilities.java class:
setProperties Reads a properties file that defines the following properties:
–The database type, which is DB2–The class name for the JDBC drivers, which is: com.ibm.db2.jcc.DB2Driver
–The database name–The schema name for storing all exporting data–The user name to connect to the database–The password–The server name where the database is hosted–The port number for the server
getConnection Opens a JDBC connection to the database.
deleteTable Deletes all rows in a given database table through an appropriately formed SQL statement.
populateTable Populates a given database table with a given list of strings through a series of SQL update statements.
closeConnection Closes the JDBC connection to the database.
Database exporterThe DatabaseExporter.java class implements the IloScenarioExporter interface. This is a requirement for any custom code class that exports data from an ODM Enterprise solution. The following functions are implemented in this class:
deleteOutputTables Deletes all output database tables for a given scenario by calling the deleteTable function in DatabaseUtilities.java.
deleteInputTables Deletes all input database tables for a given scenario.
deleteAuxiliaryTables Deletes all auxiliary database tables for a given scenario.
exportTable Returns a list of strings that contain all the data in a scenario table and can be used with the populateTable function in DatabaseUtilities.java.
exportOutputTables Updates all output database tables for a given scenario.
exportInputTables Updates all input database tables for a given scenario.
exportAuxiliaryTables Updates all auxiliary database tables for a given scenario.
40 IBM ILOG ODM Enterprise and Data Integration

exportScenario The function that is inherited from IloScenarioExporter and must be implemented. It first deletes the contents of the tables in the data exporting schema and then populates them with the data in the active scenario.
Sample codeExample 3-1 shows the implementation of the exportTable function. This method shows how you can use the ILOG ODM Enterprise API to obtain data from an ILOG ODM Enterprise table for a given scenario.
Example 3-1 also shows how the function exportTable first obtains a definition of the schema of the table and then the columns in that schema. It then demonstrates how to iterate over the rows in that table capturing every column in an appropriate way, depending on its datatype.
Example 3-1 The exportTable method with functions from the ILOG ODM Enterprise API
private List<String> exportTable(IloTable anODMETable){
List<String> vReturnList = new ArrayList<String>();
IloSchema vTableSchema = anODMETable.getTableSchema();
List<IloColumn> vColumns = vTableSchema.getColumnsList();
for (Iterator<IloRow> vRows = anODMETable.getRows().iterator(); vRows.hasNext();)
{IloRow vRow = vRows.next();String vStringRow = "";
int vColumnCount = 0;for(IloColumn c : vColumns){
IloDataType vDataType = c.getDataType();String vColumnName = c.getId();
if( (vDataType.getJavaClass() == Integer.class) ||(vDataType.getJavaClass() == Double.class) || (vDataType.getJavaClass() == Float.class) )
{vStringRow += "" + vRow.getValue(vColumnName);
}
if( vDataType.getJavaClass() == String.class )
Chapter 3. Developing and deploying the ILOG ODM Enterprise solution 41

{vStringRow += "'" + vRow.getValue(vColumnName) + "'";
}
if( vColumnCount < (vColumns.size()-1) )vStringRow += ", ";
vColumnCount++;}
vReturnList.add(vStringRow);}
return vReturnList;}
After the code is ready, all classes are packaged into a .jar file. A good location for the .jar file is to have it in the deploy directory under the ODM Enterprise project ITSOMotorBikeCompany.
To configure the application so that it can locate the .jar file, complete the following steps:
1. Switch to the ILOG ODM Enterprise perspective by navigating to Window Open Perspective Other and selecting ODM Enterprise.
2. In the ODM Enterprise Projects panel, expand the ITSOMotorBikeCompany Deployments. Expand the deployment_dev.odmds file and click the Additional JARs ...and Resources tab.
3. Click the Add Resource button. Then navigate to the deploy directory where the newly create .jar file is stored, and click Open.
3.4.4 Editing the XML
If you edit the deployment_prod.odmds file, you can enable the appropriate menu options that are linked to the custom Java code to be displayed in the IBM ILOG ODM Enterprise application GUI. At the same time, you also provide the user with the ability to export a scenario. To edit the deployment_prod.odmds file, complete the following steps:
1. In the ODM Enterprise Projects panel, expand the ITSOMotorBikeCompany Deployments.
2. Right-click the deployment_dev.odmds file and select Open with Text Editor.
42 IBM ILOG ODM Enterprise and Data Integration
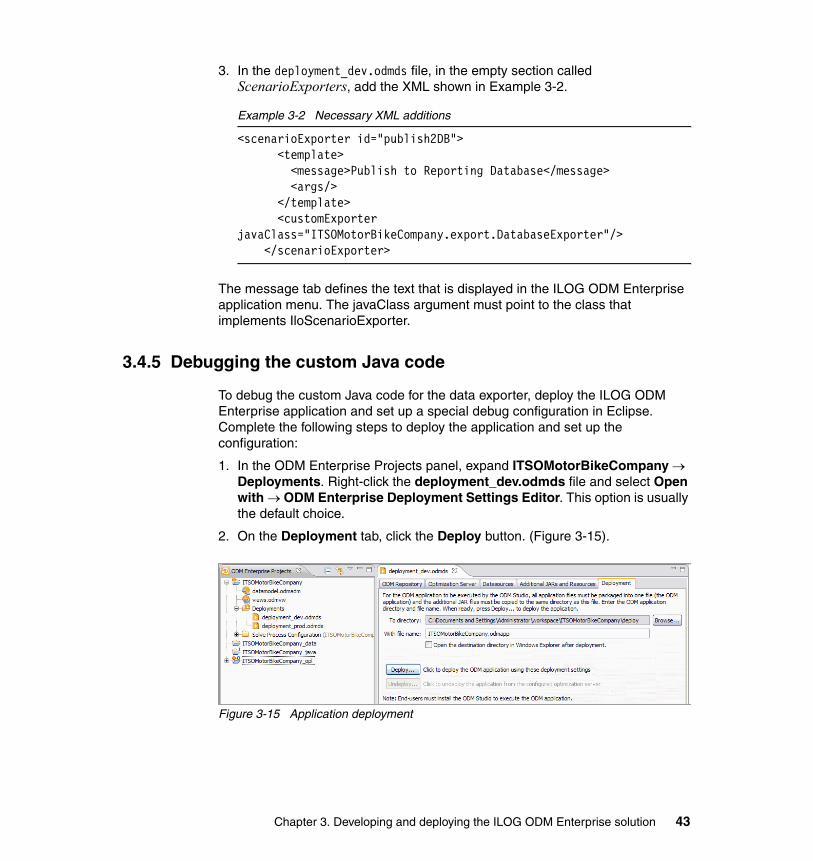
3. In the deployment_dev.odmds file, in the empty section called ScenarioExporters, add the XML shown in Example 3-2.
Example 3-2 Necessary XML additions
<scenarioExporter id="publish2DB"> <template> <message>Publish to Reporting Database</message> <args/> </template> <customExporter javaClass="ITSOMotorBikeCompany.export.DatabaseExporter"/> </scenarioExporter>
The message tab defines the text that is displayed in the ILOG ODM Enterprise application menu. The javaClass argument must point to the class that implements IloScenarioExporter.
3.4.5 Debugging the custom Java code
To debug the custom Java code for the data exporter, deploy the ILOG ODM Enterprise application and set up a special debug configuration in Eclipse. Complete the following steps to deploy the application and set up the configuration:
1. In the ODM Enterprise Projects panel, expand ITSOMotorBikeCompany Deployments. Right-click the deployment_dev.odmds file and select Open with ODM Enterprise Deployment Settings Editor. This option is usually the default choice.
2. On the Deployment tab, click the Deploy button. (Figure 3-15).
Figure 3-15 Application deployment
Chapter 3. Developing and deploying the ILOG ODM Enterprise solution 43

3. Now that the development application has been deployed, create the debug configuration. Switch to the Java perspective by navigating to Window Open Perspective Other and select Java (Default).
4. Right-click the Java project and select Debug As Java Application.
5. In the Select Java Application window (Figure 3-16), select IloOplOdmLauncher from the ilog.oplodm.service package and click OK.
Figure 3-16 Select the IloOplOdmLauncher class for the debug configuration
6. In the ILOG ODM Enterprise application launcher window, select the .odmapp file. Then navigate to the path defined when the application was deployed in step 8 on page 29. The application launches normally and waits for user input.
7. To start debugging the Java code, select a scenario from the Scenario Explorer panel. Then from the application menu, navigate to Scenario Export Publish to Reporting Database. The Java code executes and the debugger stops at any breakpoints that are set in the code.
44 IBM ILOG ODM Enterprise and Data Integration

3.5 Deploying the ODM Enterprise solution
This topic explains how to set up the connections to the various databases and servers that are used by the ODM Enterprise solution.
3.5.1 Configuring the connection to ODM Scenario Repository
The ODM Scenario repository is an internal database that the ODM Enterprise solution uses to save all generated scenarios and work in progress. To set up the connection to the ODM Repository, complete the following steps:
1. Switch to the ODM Enterprise perspective in Eclipse.
2. In the ODM Enterprise Projects panel, expand ITSOMotorBikeCompany Deployments, and double-click the deployment_prod.odmds file.
3. On the ODM Repository tab, click the Multi-user mode button, and then from the drop-down menu, select the database type IBM DB2 v9.
4. Enter the host name or IP address of the machine that hosts the DB2 instance where the ODM Repository is located and the port number for that machine (Figure 3-17 on page 46).
5. Enter the instance name of the database instance that is to be used for the ODM Repository. In this case, we enter the name ODME_INT.
6. Provide a specific name for the ODM Repository schema and a separate account, such as the user name and password, that the ODM Enterprise application uses to access the repository (Figure 3-17 on page 46).
7. Click Test Connection to make sure the connection to ODM Repository has been set up properly.
Chapter 3. Developing and deploying the ILOG ODM Enterprise solution 45

Figure 3-17 shows the ODM Repository setup.
Figure 3-17 ODM Repository setup
8. After the connection is working, click Create Schema so that the appropriate schema is generated on the database. ILOG ODM Enterprise creates a schema automatically for the ODME_INT database that we created.
9. Click Administer Database and then click Add User. To add the user accounts, provide a user name and password.
The ODM Repository has been configured. Every time the ILOG ODM Enterprise application executes, it prompts for the credentials of one of the users given access to the repository.
46 IBM ILOG ODM Enterprise and Data Integration

3.5.2 Configuring the connection to the staging database
To set up the connection to the staging database which holds the input data relevant to the ODM Enterprise solution that is imported from the corporate database, complete the following steps:
1. Switch to the ODM Enterprise perspective in Eclipse.
2. In the ODM Enterprise Projects panel, expand ITSOMotorBikeCompany Deployments, and double-click the deployment_prod.odmds file.
3. Open the Datasources tab, right-click Datasources, and then select New Database Scenario Datasource.
A new datasource called new_source (Default) is displayed under Datasources and its properties appear on the right.
4. Name the data source that is displayed in the ILOG ODM Enterprise Studio so that a business user can understand it. For example, you might name it ODME Staging DB.
5. From the Choose Database Connection drop-down, select ODME Staging from Eclipse Database Connections. We configured this connection when we imported the database schema from the ODM Enterprise Staging database.
6. Configure the SQL statements that are to be executed when a user selects Create New Default Scenario in IBM ILOG ODM Enterprise Studio. Also configure the SQL statement for all relevant optimization data that needs to be imported to the ODM Enterprise Repository or ODM Enterprise internal database.
7. For each statement, click the Add button and select an input table from the drop-down list.
8. Update the schema used in the SQL statement from app to ODME_STG. The SQL statement is filled in automatically based on the column definitions in the ADM.
Chapter 3. Developing and deploying the ILOG ODM Enterprise solution 47

Figure 3-18 shows the Datasources tab after the setup is completed.
Figure 3-18 Datasources tab for the ODME Staging data source
3.5.3 Configuring the connection to the optimization server
Set up the connection to the optimization server so that when users solve a scenario in ILOG ODM Enterprise Studio, the solution occurs on the remote server rather than locally. To set up the connection, complete the following steps:
1. Switch to the ODM Enterprise perspective in Eclipse.
2. In the ODM Enterprise Projects panel, expand ITSOMotorBikeCompany Deployments, and double-click the deployment_prod.odmds file.
3. On the Optimization Server tab, select the Additionally I want to use an optimization server when solving scenarios check box.
4. Enter the URL for the server location in the following form:
http://<server>:<port>/optimserver/
The <server> tag is the IP address of the machine hosting the ILOG ODM Enterprise Server and <port> tag is 9081 under default settings.
5. Click the Test Connection button to ensure that the connection has been set up properly.
48 IBM ILOG ODM Enterprise and Data Integration

3.5.4 Deploying the ILOG ODM Enterprise application
After the database and server connections have been set up, deploy the application on the optimization server so that users can access it. To deploy the application, complete the following steps:
1. Switch to the ODM Enterprise perspective in Eclipse.
2. In the ODM Enterprise Projects panel, expand the ITSOMotorBikeCompany Deployments, and double-click deployment_dev.odmds.
3. On the Deployment tab, click the Deploy button (Figure 3-15 on page 43).
For a user to run the ILOG ODM Enterprise application, they must install ILOG ODM Enterprise Planner and obtain a copy of the contents of the deploy directory. The deploy directory contains the .odmapp file and all .jar files.
Chapter 3. Developing and deploying the ILOG ODM Enterprise solution 49

50 IBM ILOG ODM Enterprise and Data Integration

Chapter 4. Scenario management using ILOG ODM Enterprise
This chapter describes ILOG ODM Enterprise scenario management functionality. Key concepts are introduced in this chapter that relate to the business value and technical background of scenario management.
This chapter includes the following topics:
� Basic concepts of scenario management� Creating a new scenario� Solving and reviewing scenarios� Scenario collaboration and sharing� Scenario export
4
© Copyright IBM Corp. 2011. All rights reserved. 51

4.1 Basic concepts of scenario management
This topic describes the concept of scenario in the sense it is used within ILOG ODM Enterprise. The Supply Demand model is used as an example throughout this chapter, supplemented by descriptions of additional related functionality that is absent from this example.
An ODME scenario is a collection of input data, goals, requirements, rules, and output values. Essentially a scenario represents the full input and output of an ODME optimization model.
Scenarios can be used for several business purposes that are illustrated in this topic, each using one or more features of ODM.Enterprise. Upon opening ODM Studio to begin an initial planning or scheduling session, a business user encounters an empty Scenario Workspace, as shown in Figure 4-1.
Figure 4-1 ODM Studio
4.1.1 Creating an initial scenario
Create an initial scenario named New Default Scenario by using one of the following methods:
� Right-click the Workspace icon and select New Default Scenario.
� Select File New New Default Scenario.
This action executes a set of queries drawing a full set of input data from the source database. In addition to basic data elements, model elements including goals, rules, and requirements are imported into the ILOG ODM Enterprise working database.
52 IBM ILOG ODM Enterprise and Data Integration

4.1.2 Reviewing scenario components
At this point, you can examine the data that has been imported from the corporate database. You can also modify any of the input data elements in the scenario. Because this scenario is intended as a baseline, you can solve it without modification.
You can examine input data elements that are presented in table or chart form by selecting the required element from the Scenario Explorer area in ODM Studio, as shown in Figure 4-2.
Figure 4-2 Scenario Explorer area
Chapter 4. Scenario management using ILOG ODM Enterprise 53
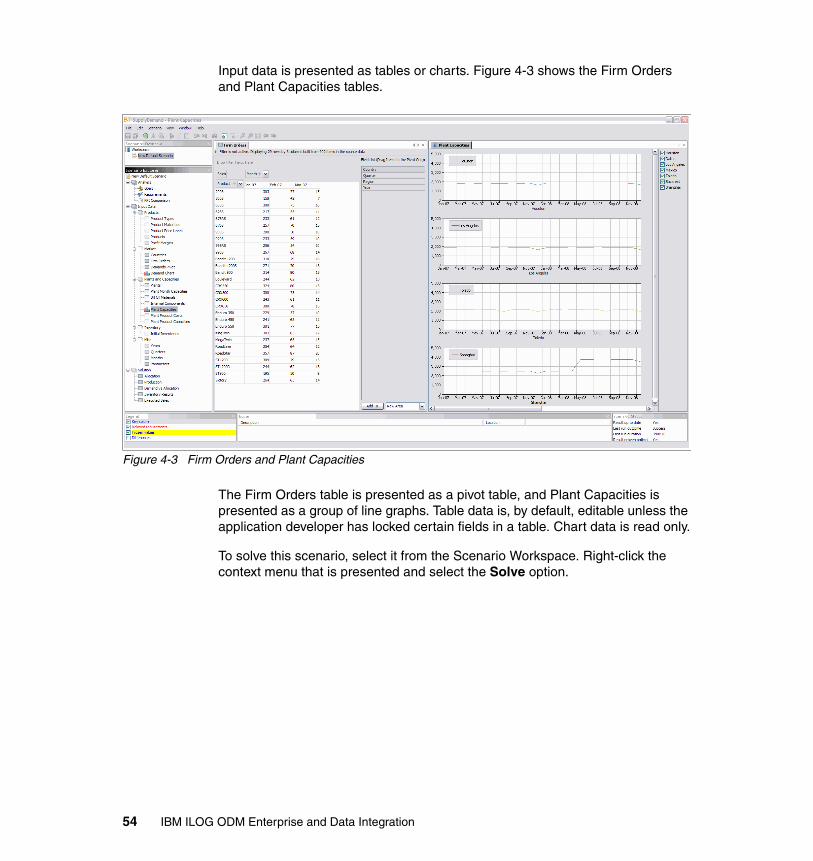
Input data is presented as tables or charts. Figure 4-3 shows the Firm Orders and Plant Capacities tables.
Figure 4-3 Firm Orders and Plant Capacities
The Firm Orders table is presented as a pivot table, and Plant Capacities is presented as a group of line graphs. Table data is, by default, editable unless the application developer has locked certain fields in a table. Chart data is read only.
To solve this scenario, select it from the Scenario Workspace. Right-click the context menu that is presented and select the Solve option.
54 IBM ILOG ODM Enterprise and Data Integration

Figure 4-4 shows a Solve Progress box that is displayed after ILOG ODM Enterprise completes data checking.
Figure 4-4 Solve Progress box
As the optimization progresses, this box displays the value of each of the goals that make up the model’s objective function and the combined objective, which is a weighted sum of the goals currently being used as the optimization criterion.
To see more details about the values of these goals, select Goals in the Analysis folder. This opens the window shown in Figure 4-5 on page 56.
Chapter 4. Scenario management using ILOG ODM Enterprise 55
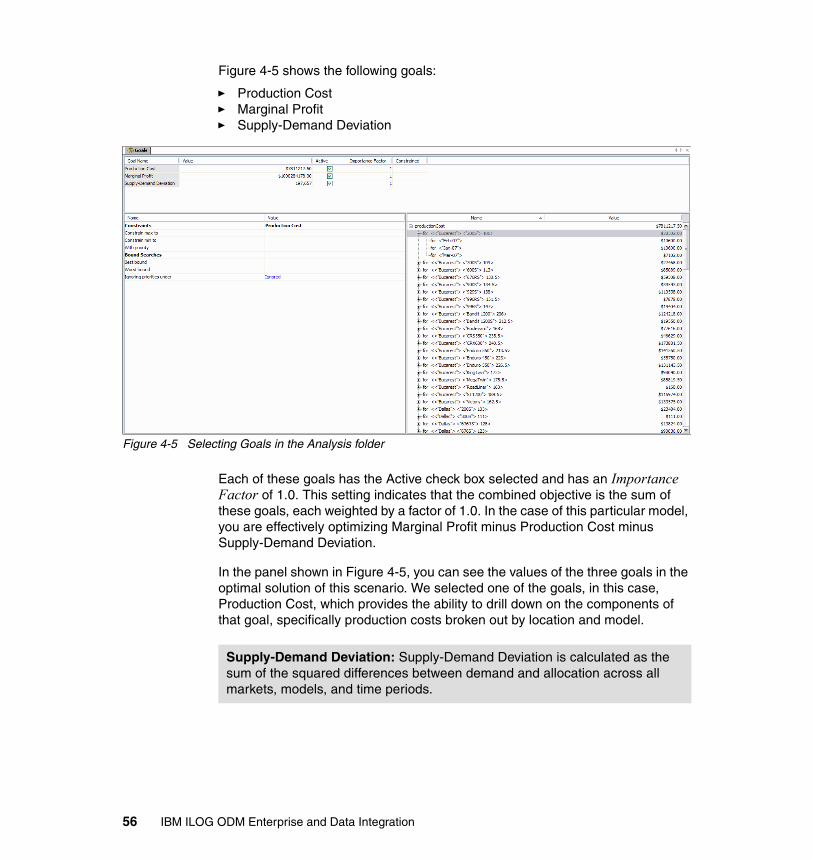
Figure 4-5 shows the following goals:
� Production Cost� Marginal Profit� Supply-Demand Deviation
Figure 4-5 Selecting Goals in the Analysis folder
Each of these goals has the Active check box selected and has an Importance Factor of 1.0. This setting indicates that the combined objective is the sum of these goals, each weighted by a factor of 1.0. In the case of this particular model, you are effectively optimizing Marginal Profit minus Production Cost minus Supply-Demand Deviation.
In the panel shown in Figure 4-5, you can see the values of the three goals in the optimal solution of this scenario. We selected one of the goals, in this case, Production Cost, which provides the ability to drill down on the components of that goal, specifically production costs broken out by location and model.
Supply-Demand Deviation: Supply-Demand Deviation is calculated as the sum of the squared differences between demand and allocation across all markets, models, and time periods.
56 IBM ILOG ODM Enterprise and Data Integration

4.2 Creating a new scenario
This topic provides the motivation and process for creating and solving new scenarios. The SupplyDemand example, which is the basis for this paper, serves as the basis for several examples. Certain alternatives that are not directly supported by this particular example are also outlined.
In this topic, you can find information about the following subjects:
� What-If analysis� Goal programming� Parameterization� Incorporation of optional rules
4.2.1 What-If analysis
The baseline, or default scenario, consists of data drawn from the corporate database. Certain data elements, such as demand levels, price of raw materials, and so on, might be based on estimates or forecasts. What-if analysis is the process by which an analyst or planner can make local changes to one or more of these parameters to observe the impact of possible future variation from expectations on the optimal course of action.
Planners often take advantage of this capability by creating and running multiple scenarios across a range of alternative data values. This strategy supports selection of decisions that are robust with respect to future uncertainties.
4.2.2 Goal programming
In typical business situations, a decision-making process can have more than one objective. Such objectives as maximal revenue, minimal cost, and earliest project completion are typical business goals. However, often the true goal of a business consists of more than one objective. Often these objectives work against each other. For example, in a retail organization, objectives might include minimizing personnel costs and minimizing customer queuing time.
Chapter 4. Scenario management using ILOG ODM Enterprise 57

This business need explains another important aspect of goal programming. Often the multiple business objectives are in incompatible units. Personnel costs can be measured by monetary values. Queuing time, or customer service level, typically cannot. To determine the optimal set of decisions, it might be necessary to compare sets of decisions based on key performance indicators (KPIs) with multiple dimensions. Goal programming gives the user the ability to experimentally vary the relative weights of each goal, creating a set of scenarios that can be compared applying non-quantitative business judgment to select the best alternative.
It is also possible to make individual goals inactive. In that case, they are not included in the objective function used for optimization. They are, however, calculated so that the impact of other decisions is reflected. For example, you might create scenarios and place limits on total personnel costs and comparing the impact on the customer service metric.
4.2.3 Parameterization
Frequently an ILOG ODM Enterprise application includes user-modifiable parameters. Modifying the default values of one or more of these parameters provides the user the ability to take advantage of flexibility built into the application by the model developer. For example, the input data set might include data for multiple organization regions. A parameter setting can be made available to limit the scope of the optimization run to a single region. In the SupplyDemand application, the only parameter is NbMonths Planned, which lets the planner modify the application planning horizon.
58 IBM ILOG ODM Enterprise and Data Integration

Figure 4-6 shows the NbMonths Planned parameter.
Figure 4-6 NbMonths Planned parameter
4.2.4 Incorporation of optional business rules
ILOG ODM Enterprise also supports the ability to include in the application business rule templates that can be activated by planners. The feature is not incorporated into the SupplyDemand example that is the basis for this paper. Business rules are essentially constraints that can be expressed in natural language and added and parameterized by the user to modify a scenario.
Chapter 4. Scenario management using ILOG ODM Enterprise 59

To explain this feature, consider the example of a Unit Commit problem with ILOG ODM Enterprise. This example explains the schedules of the times for when electrical generation units are turned on and off and the rates at which they operate to meet power demands and various operational constraints. A business rule that can be added by the planner, is the requirement that a specific generation unit be offline for several time periods within a set time range, so that maintenance can be performed.
Figure 4-7 shows how a template for this rule is created.
Figure 4-7 Template for a business rule is created
After accepting this rule template, you can populate its fields to parameterize the rule. Figure 4-8 shows a specific generating unit to apply this rule with a pull-down menu.
Figure 4-8 Accepting the rule template
The remaining three fields can be populated with numerical values, creating a natural language business rule, such as GAS_2 must be off for at least 5 periods between periods 12 and 25.
60 IBM ILOG ODM Enterprise and Data Integration

4.3 Solving and reviewing scenarios
Indicated in 4.2, “Creating a new scenario” on page 57, several business purposes are served through the creation and solution of multiple scenarios. In this topic, a brief overview is provided of the technical aspects of scenario creation and modification, and the methods in which scenario results can be viewed and shared is presented.
4.3.1 Scenario creation
An initial, baseline, or default scenario is created by extracting data from the corporate database and populating tables in the internal ILOG ODM Enterprise database. Solving a scenario consists of the following stages:
� Populating the model with the scenario data set� Performing data checking� Solving the model instance� Persisting the solution results
You can create new scenarios by making a copy of an existing scenario, and making the required changes. The model instance that is sent to the solution engine and optimized is created dynamically after the user saves the scenario modifications and initiates the solution process. You can cascade scenario modifications by duplicating scenarios other than the default, taking advantage of previous modifications and modifying further before solving.
4.3.2 Scenario review and comparison
You can review scenarios in the following methods with ODM Enterprise:
� Individual scenario review� Two-scenario comparison of differences� Multiple scenario KPI review
Individual scenario reviewAll scenarios populate the Goals window (Figure 4-5 on page 56) upon a successful solution. In this window, you see the values of each of the goals in the optimized solution. By selecting any of the goals that are aggregates, you see the breakdown of the value of that goal into its components. In this case, you can see the Production Cost goal broken out by model and plant.
Details of the solution are also made available in tables, pivot tables, and charts in the Output folder in the Scenario Explorer (Figure 4-3 on page 54).
Chapter 4. Scenario management using ILOG ODM Enterprise 61

Two-scenario comparison of differencesOne of the most powerful features of ODM Enterprise is the ability to directly visually compare two scenarios. The Differences features facilitates this functionality. As an example of this capability, consider a situation such as a major overhaul in the Shanghai production facility. The total production capacity of that plant is reduced by 50% for the months of January through March in 2007. You might want to analyze the impact of this action.
Figure 4-9, shows a view of the Plant Month Capacities table taken from the baseline scenario. The Capacity field in this table is editable. To retain the values of the baseline scenario, duplicate that scenario and name the copy Shanghai Reduced Plant Capacity. Then edit the first three entries of the Plant Month Capacities table. You can now take advantage of the Differences feature. Select the New Default Scenario and, using either the right-click context menu, or the Scenario menu, select Use as Reference. Activate the Differences check box in the lower left corner of the ODM Studio window, between our modified scenario and the baseline.
Figure 4-9 Plant Month Capacities table
62 IBM ILOG ODM Enterprise and Data Integration

Figure 4-10 shows the differences highlighted in the top three lines, with the baseline values in parentheses and the current scenario values outside the parentheses.
Figure 4-10 Plant Month Capacities table shows the differences
In addition to highlighting differences in input data, this feature is valuable in comparing the solutions of pairs of scenarios.
You can examine the differences in the goals by leaving the differences feature active and selecting the Goals panel.
Chapter 4. Scenario management using ILOG ODM Enterprise 63

Figure 4-11 shows the impact of this reduced capacity. The values of each of the goals have changed. Production cost is up, marginal profit is down, and supply-demand deviation has increased substantially.
Figure 4-11 Impact of reduced capacity
You can also view any of the output tables and charts.
64 IBM ILOG ODM Enterprise and Data Integration

Figure 4-12 shows the impact that this reduction in the capacity of the Shanghai plant has on the sales that are executed by model and market. Again, the baseline figures are in parentheses. The cells that are not highlighted are those that are not affected by this modification.
Figure 4-12 Impact of reduced capacity - Shanghai plant
You can create alternative scenarios using several methods. In addition to the modification of input data elements, you might want to constrain the values of one or more goals. In our baseline scenario, the total production cost was US$7,811,217.50. To create a scenario to model the business decision that limits production costs to US$7,500,000. In the Goals panel, select the Production Cost goal and in the Constrain Max To field, enter the upper bound.
Chapter 4. Scenario management using ILOG ODM Enterprise 65

Figure 4-13 shows the Production Cost goal.
Figure 4-13 Selecting the Production Cost goal
You can see that the production cost in this scenario has been reduced to conform with this new constraint. The other two goals have also changed. Marginal profit has been reduced, and supply-demand deviation has increased. You can also observe changes to the levels of production in several plants. The most significant changes are occurring in Bucharest and Dallas.
Multiple KPI scenario comparisonThe visualization of differences is useful for directly comparing two scenarios. However, this technique is not useful for comparing larger numbers of scenarios. For this function, ILOG ODM Enterprise has a KPI comparison feature. You can select any number of scenarios and any number of KPIs to compare in a table and chart.
66 IBM ILOG ODM Enterprise and Data Integration

Figure 4-14 compares multiple KPI scenarios with the values of two KPIs for each of six scenarios.
Figure 4-14 Multiple KPI Scenario comparison
4.4 Scenario collaboration and sharing
The ability to collaboratively develop and analyze scenarios is a valuable feature of ILOG ODM Enterprise. In Figure 4-15 on page 68, you can see an example in which three users are collaboratively using the application. By mousing over the name of a scenario, a tool tip is shown, displaying the status of the scenario. In this case, you can see that a scenario is being used by Mark and edited by Sam.
Depending upon the authorization scheme in place, rights to view and modify scenarios can be restricted to specific users.
Chapter 4. Scenario management using ILOG ODM Enterprise 67

Figure 4-15 illustrates collaborative planning.
Figure 4-15 Collaborative planning
4.5 Scenario export
The final stage of the planning process is to export one or more scenarios. ILOG ODM Enterprise provides an application programming interface (API) for the creation of custom exporters. This functionality helps the application developer customize the handling of scenario output.
In our case, an exporter has been created that exports scenario data to a set of output tables in the corporate database. These tables can be used as input for reports.
The export function is custom built for each ILOG ODM Enterprise application using the Java API. Our application has a single export function that writes the scenario contents to a special set of tables in the intermediate database. Application developers can develop multiple export functions that provide the ability to save scenarios in alternative formats.
68 IBM ILOG ODM Enterprise and Data Integration

Chapter 5. ILOG ODM Enterprise scenarios with IBM InfoSphere Warehouse and IBM Cognos BI
InfoSphere Warehouse provides a robust Online Analytical Processing (OLAP) capability with Cubing Services for business analysis. Cube models and cube objects are created by using InfoSphere Warehouse Cubing Services Design Studio. IBM Cognos Business Intelligence (BI) uses these cube objects as a Cognos data source.
This chapter introduces Cognos and presents information about how to connect to a Cubing Services data source. The Cubing Services data source is the process of importing metadata and preparing a package for use to create IBM Cognos BI reports. This chapter also provides use cases of ILOG ODM Enterprise reports.
This chapter includes the following topics:
� InfoSphere Warehouse cube model and cube� IBM Cognos architecture� IBM Cognos 10 metadata
5
© Copyright IBM Corp. 2011. All rights reserved. 69

� Importing into Framework Manager� Publishing a Framework Manager package� Creating a Cognos report� ILOG ODM Enterprise reporting examples using IBM Cognos BI
5.1 InfoSphere Warehouse cube model and cube
InfoSphere Warehouse Cubing Services cube models and cubes are developed by using the InfoSphere Warehouse Design Studio IDE. The OLAP objects created are stored in a metadata repository database. Several setup tasks within Design Studio must be performed before starting to create the OLAP cube models. In this scenario, we created a cube model, SupplyDemand, and cube, Supply Demand Analysis to support ILOG ODM Enterprise Analytics and Reporting by using IBM InfoSphere Warehouse Cubing Services.
For more information about IBM InfoSphere Warehouse Cubing Services, see the DataWarehousing and Analytics, OLAP and Cubing Section of IBM DB2 Database for Linux, UNIX, and Windows Information Center at the following website:
http://publib.boulder.ibm.com/infocenter/db2luw/v9r7/topic/com.ibm.db2.luw.doc/welcome.html
Another helpful resource is IBM Cognos Business Intelligence V10.1 Handbook, SG24-7912.
5.2 IBM Cognos architecture
IBM Cognos 10 uses a service-oriented architecture (SOA) that provides separate components the ability to be applied within a single application framework. This chapter provides information about the components involved in reporting by using the Business Intelligence components of the IBM Cognos 10 platform.
70 IBM ILOG ODM Enterprise and Data Integration
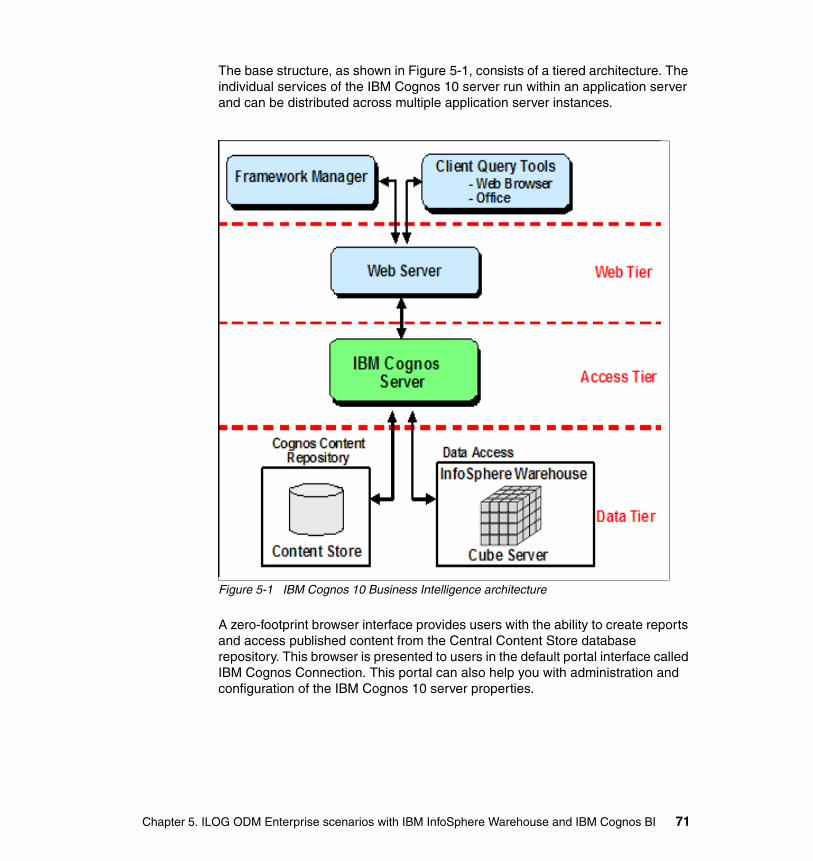
The base structure, as shown in Figure 5-1, consists of a tiered architecture. The individual services of the IBM Cognos 10 server run within an application server and can be distributed across multiple application server instances.
Figure 5-1 IBM Cognos 10 Business Intelligence architecture
A zero-footprint browser interface provides users with the ability to create reports and access published content from the Central Content Store database repository. This browser is presented to users in the default portal interface called IBM Cognos Connection. This portal can also help you with administration and configuration of the IBM Cognos 10 server properties.
Chapter 5. ILOG ODM Enterprise scenarios with IBM InfoSphere Warehouse and IBM Cognos BI 71
The IBM Cognos Framework Manager is the modeling and development tool that is used to generate the metadata model for end-user reporting. This tool is a full client application that is installed on the computer of the metadata modeler. Communication is still directed through the common tiered architecture when publishing packages to, or retrieving information from, the IBM Cognos 10 server.
5.3 IBM Cognos 10 metadata
IBM Cognos 10 supports a direct connection to Cubing Services. This level of support means that the metadata for the published package can be obtained directly from the Cube Server at run time, instead of requiring full metadata import into Framework Manager. You still must publish a package from Framework Manager to provide access to the cube, but changes are required to the cube properties in this scenario.
To connect to Cubing Services, you must define a data source connection to the Cube Server within IBM Cognos 10 and import the cube into Framework Manager. In this instance, the cube is a stub object that is used to reference the cube from the Cubing Services Cube Server. The full set of metadata for the dimensions, hierarchies, and levels remains within Cubing Services.
5.4 Importing into Framework Manager
To import into Framework Manager, complete the following steps:
1. If you are using an existing model, start the Import Wizard by selecting any namespace or folder object in your model, and select Actions Run Metadata Wizard.
New model: When creating a new model in Framework Manager, the Metadata Import Wizard opens. This scenario starts the import from the first panel of the Import Wizard.
72 IBM ILOG ODM Enterprise and Data Integration

2. Because IBM Cognos 10 can use Cubing Services as a data source, use Data Sources as the source for the metadata import. In the Select Metadata Source panel of the Import Wizard (Figure 5-2), select Data Sources, and then click Next.
Figure 5-2 Selecting the Metadata Source
Chapter 5. ILOG ODM Enterprise scenarios with IBM InfoSphere Warehouse and IBM Cognos BI 73

3. Create a data source connection to your Cubing Services data source in IBM Cognos 10, if you have not already created it. From the Metadata Import Wizard, complete the following steps:
a. To start the New Data Source Wizard, click New, and then click Next on the first page of the wizard to pass the welcome message. The window in Figure 5-3 is displayed.
b. In the Specify a name and description window (Figure 5-3), complete these steps:
i. In the Name field, enter a name. The name can be any logical name that you want to use to identify your Cubing Services data source connection.
Figure 5-3 Naming the Cubing Services Data Source
ii. Optional: Enter information in the Description and Screen tip text boxes.
iii. Click Next.
74 IBM ILOG ODM Enterprise and Data Integration
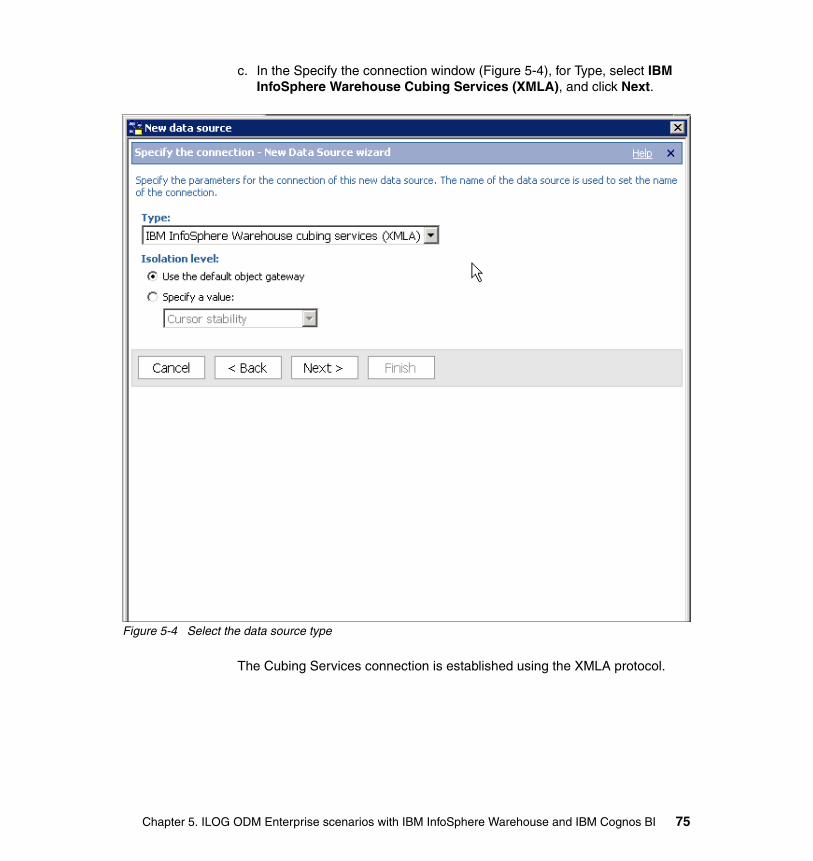
c. In the Specify the connection window (Figure 5-4), for Type, select IBM InfoSphere Warehouse Cubing Services (XMLA), and click Next.
Figure 5-4 Select the data source type
The Cubing Services connection is established using the XMLA protocol.
Chapter 5. ILOG ODM Enterprise scenarios with IBM InfoSphere Warehouse and IBM Cognos BI 75

d. In the Specify the IBM InfoSphere Warehouse cubing services (XLMA) connection string window (Figure 5-5), enter a server URL, such as server:port/InstanceName, and a valid Cubing Services user ID and password for the Cubing Services connection.
Figure 5-5 Data source server and sign-on
e. Click Test the connection in the final window of the New Data Source Wizard to test the connection from the IBM Cognos 10 server.
About the test: This test is not a test of the connection from the computer running Framework Manager. To reduce server load during modeling, Framework Manager establishes its own connection to the relational and OLAP data sources.
76 IBM ILOG ODM Enterprise and Data Integration

f. After the connection tests successfully, click Next to finish creating the data source. Upon completion, a confirmation message (Figure 5-6) is displayed.
Figure 5-6 Successful data source creation
4. In the Metadata Wizard window (Figure 5-7), select the data source and click Next.
Figure 5-7 Available data source connections
Chapter 5. ILOG ODM Enterprise scenarios with IBM InfoSphere Warehouse and IBM Cognos BI 77

5. From the list of cubes under Cubing Services (Figure 5-8), select the cube and click Next.
Figure 5-8 List of available cubes from Cube Server
6. Optional: Import the cube object.
When importing a cube object, you are prompted at the end of the Metadata Import Wizard to create a package. Typically, this step is the default action that you want to use for cube sources. This option creates a package containing the single cube reference. After you complete the Package Wizard, you are prompted to publish the package. Because no modeling tasks are required for cube sources, you can publish the new package to the IBM Cognos 10 server.
78 IBM ILOG ODM Enterprise and Data Integration

The resulting model created by this import is displayed, as shown in Figure 5-9.
Figure 5-9 Framework Manager view after a cube import
Chapter 5. ILOG ODM Enterprise scenarios with IBM InfoSphere Warehouse and IBM Cognos BI 79

5.5 Publishing a Framework Manager package
After you create your consolidated package, you can publish the contents to the IBM Cognos 10 server. To publish the contents, complete the following steps:
1. Select the package in Framework Manager and right-click the main menu or Actions menu.
2. In the Publish Wizard (Figure 5-10), select the IBM Cognos 10 Content Store option. In this window, specify the publish location and whether you want to use model versioning. For more information about this process and related settings, see the IBM Cognos Framework Manager Users Guide at:
http://publib.boulder.ibm.com/infocenter/c8bi/v8r4m0/index.jsp?topic=/com.ibm.swg.im.cognos.ug_fm.8.4.0.doc/ug_fm.html
Figure 5-10 Publishing to the IBM Cognos 10 Content Store
Then click Next.
80 IBM ILOG ODM Enterprise and Data Integration

3. In the Add Security window of the Publish Wizard (Figure 5-11), set the default IBM Cognos 10 access permissions for the package to be published to IBM Cognos Connection and click Next.
Figure 5-11 Add Security window
User access and package rights: If user access is not defined, the package access rights are inherited from the parent container within the IBM Cognos Connection portal. With the default object settings in IBM Cognos Connection, any user with access to IBM Cognos 10 can have access to the new Cubing Services package. Administrative access is restricted by default to the set of default administrative groups defined within IBM Cognos 10. For more information about default groups and access rights, see IBM Cognos 10 Administration and Security Guide at:
http://publib.boulder.ibm.com/infocenter/cbi/v10r1m0/index.jsp?topic=/com.ibm.swg.im.cognos.ug_cra.10.1.0.doc/ug_cra.html
Chapter 5. ILOG ODM Enterprise scenarios with IBM InfoSphere Warehouse and IBM Cognos BI 81

4. In the Options window (Figure 5-12), optionally select the Verify the package before publishing option. This window opens because the Cubing Services package is acting as a point and does not contain any actual data.
Then click Publish.
Figure 5-12 Options window with Verify the package before publishing enabled
82 IBM ILOG ODM Enterprise and Data Integration
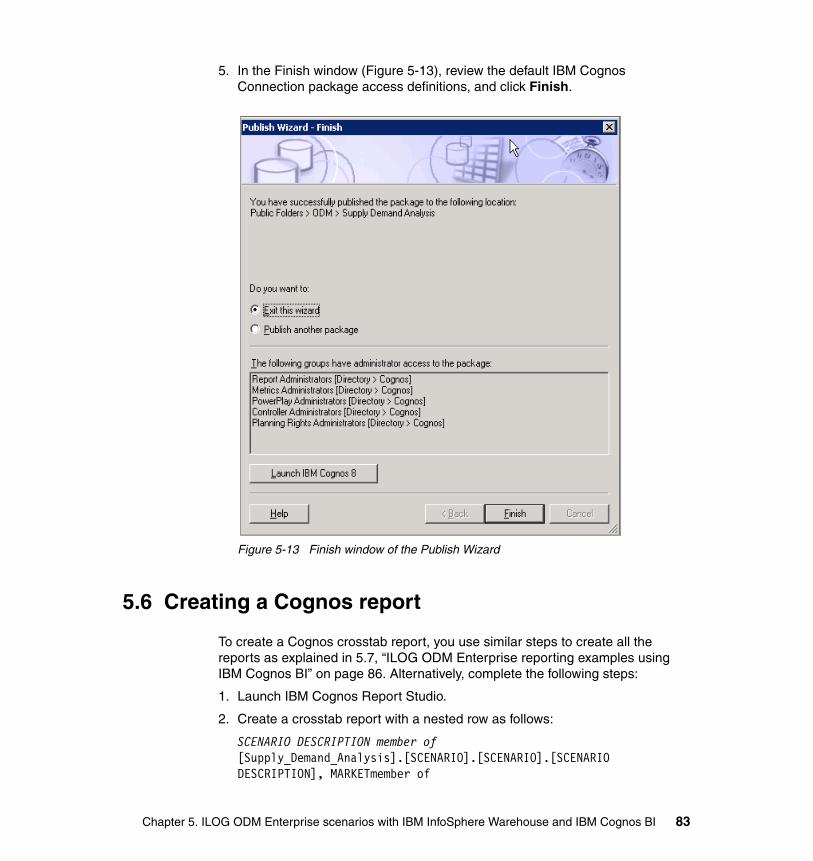
5. In the Finish window (Figure 5-13), review the default IBM Cognos Connection package access definitions, and click Finish.
Figure 5-13 Finish window of the Publish Wizard
5.6 Creating a Cognos report
To create a Cognos crosstab report, you use similar steps to create all the reports as explained in 5.7, “ILOG ODM Enterprise reporting examples using IBM Cognos BI” on page 86. Alternatively, complete the following steps:
1. Launch IBM Cognos Report Studio.
2. Create a crosstab report with a nested row as follows:
SCENARIO DESCRIPTION member of [Supply_Demand_Analysis].[SCENARIO].[SCENARIO].[SCENARIO DESCRIPTION], MARKETmember of
Chapter 5. ILOG ODM Enterprise scenarios with IBM InfoSphere Warehouse and IBM Cognos BI 83
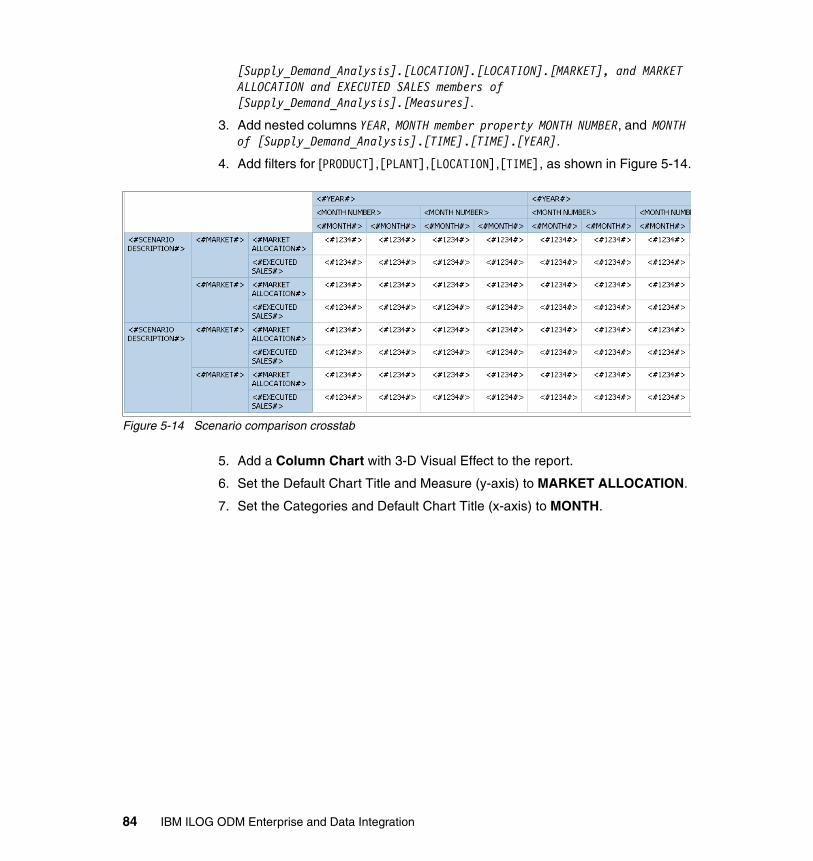
[Supply_Demand_Analysis].[LOCATION].[LOCATION].[MARKET], and MARKET ALLOCATION and EXECUTED SALES members of [Supply_Demand_Analysis].[Measures].
3. Add nested columns YEAR, MONTH member property MONTH NUMBER, and MONTH of [Supply_Demand_Analysis].[TIME].[TIME].[YEAR].
4. Add filters for [PRODUCT],[PLANT],[LOCATION],[TIME], as shown in Figure 5-14.
Figure 5-14 Scenario comparison crosstab
5. Add a Column Chart with 3-D Visual Effect to the report.
6. Set the Default Chart Title and Measure (y-axis) to MARKET ALLOCATION.
7. Set the Categories and Default Chart Title (x-axis) to MONTH.
84 IBM ILOG ODM Enterprise and Data Integration
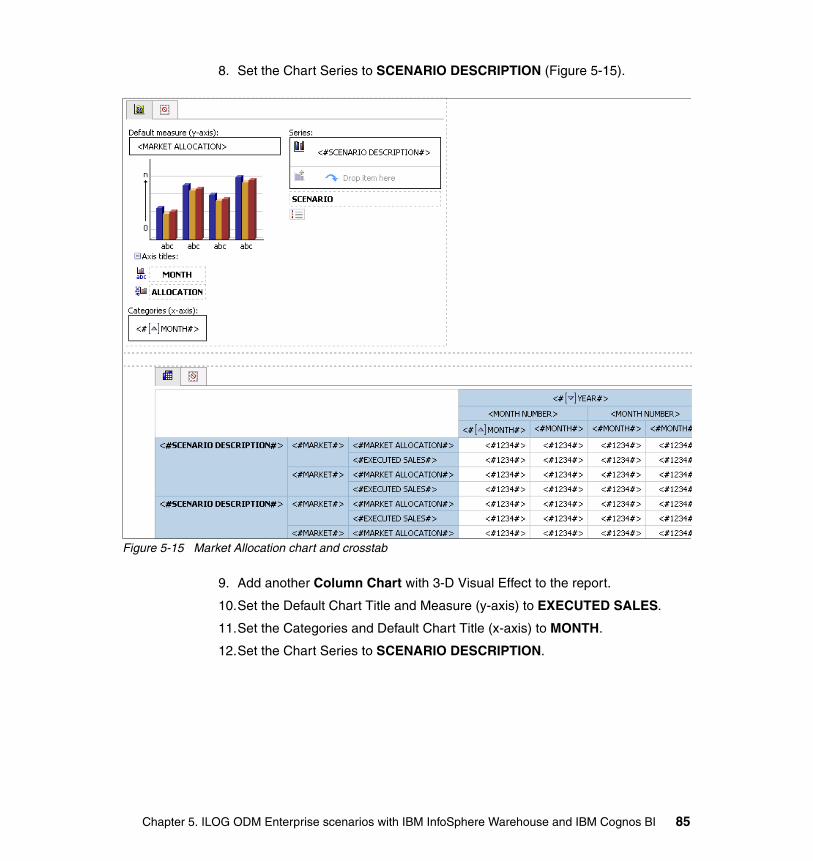
8. Set the Chart Series to SCENARIO DESCRIPTION (Figure 5-15).
Figure 5-15 Market Allocation chart and crosstab
9. Add another Column Chart with 3-D Visual Effect to the report.
10.Set the Default Chart Title and Measure (y-axis) to EXECUTED SALES.
11.Set the Categories and Default Chart Title (x-axis) to MONTH.
12.Set the Chart Series to SCENARIO DESCRIPTION.
Chapter 5. ILOG ODM Enterprise scenarios with IBM InfoSphere Warehouse and IBM Cognos BI 85
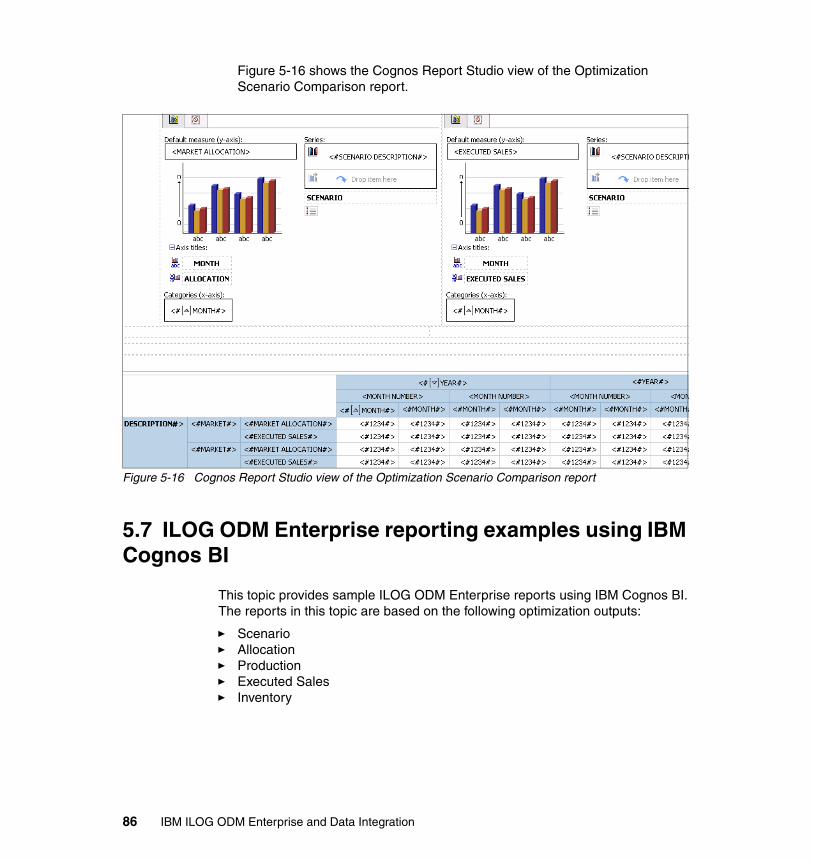
Figure 5-16 shows the Cognos Report Studio view of the Optimization Scenario Comparison report.
Figure 5-16 Cognos Report Studio view of the Optimization Scenario Comparison report
5.7 ILOG ODM Enterprise reporting examples using IBM Cognos BI
This topic provides sample ILOG ODM Enterprise reports using IBM Cognos BI. The reports in this topic are based on the following optimization outputs:
� Scenario� Allocation� Production� Executed Sales� Inventory
86 IBM ILOG ODM Enterprise and Data Integration
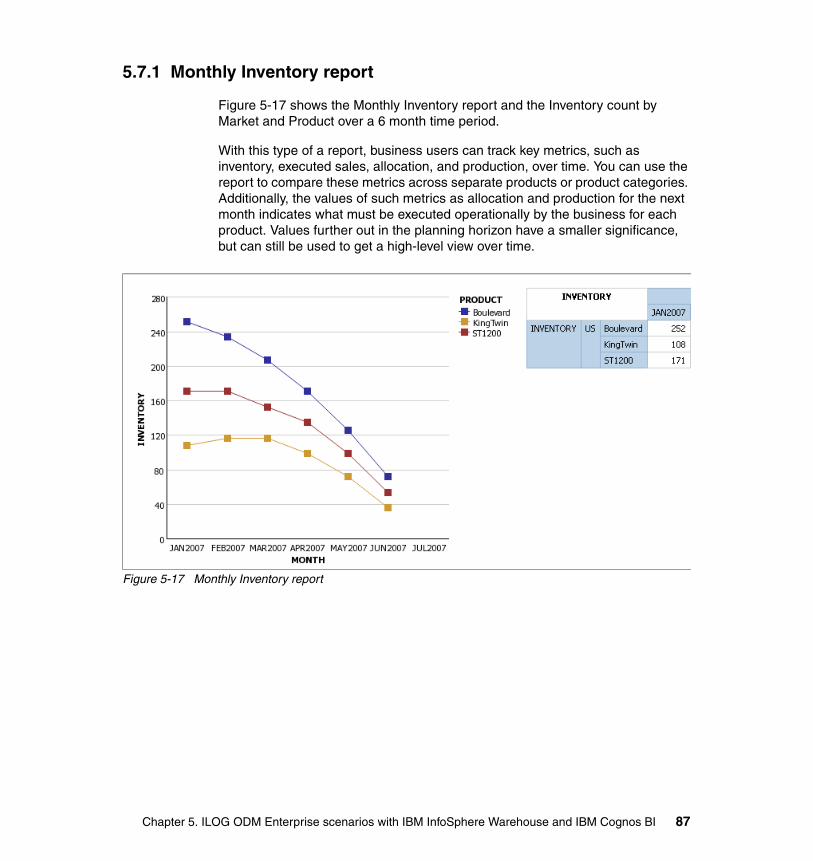
5.7.1 Monthly Inventory report
Figure 5-17 shows the Monthly Inventory report and the Inventory count by Market and Product over a 6 month time period.
With this type of a report, business users can track key metrics, such as inventory, executed sales, allocation, and production, over time. You can use the report to compare these metrics across separate products or product categories. Additionally, the values of such metrics as allocation and production for the next month indicates what must be executed operationally by the business for each product. Values further out in the planning horizon have a smaller significance, but can still be used to get a high-level view over time.
Figure 5-17 Monthly Inventory report
Chapter 5. ILOG ODM Enterprise scenarios with IBM InfoSphere Warehouse and IBM Cognos BI 87

5.7.2 Optimized Allocation versus Demand Input
Figure 5-18 shows the Allocation versus Demand Input report and identifies the demand deviation by market and product over a six month time period. This report shows how in certain cases, it might be valuable to track metrics over time and have the report execute simple calculations to highlight differences. In Figure 5-18, you can see the difference between how the expected demand and recommended allocations are tracked and how much demand is unsatisfied.
Figure 5-18 Allocation versus Demand Input report
88 IBM ILOG ODM Enterprise and Data Integration

5.8 Optimized Solution for a Single Month of Production
Figure 5-19 shows the Single Month Comparison report. This report displays the Production count by Plant, Product Maturity Level for a given month.
This report helps business users visualize and track the distribution of metrics, such as production and allocation, across the dimensions over which they change such as plants and markets respectively. For example, the report can show what percentage a certain product or product category is produced at a certain plant. The business users can then gauge the relative importance across plants or markets or other dimensions, depending on the metric that is being tracked, and have a sense of the most critical areas. This report is over the next month only when we expect the recommendations of the optimization solution to be executed in practice.
Figure 5-19 Single Month Comparison report
Chapter 5. ILOG ODM Enterprise scenarios with IBM InfoSphere Warehouse and IBM Cognos BI 89

5.8.1 Optimization Scenario Comparison
Figure 5-20 shows the Optimization Scenario Comparison report. The Optimization Scenario Comparison report compares multiple ODM scenarios to measure impact of a desired ODM scenario.
This type of report can be by far the most complex and most valuable report to the business users that want to review the results of the optimization engine. It helps business users compare key performance indicators across certain what-if scenarios. It is ideal when making critical strategic decisions, such as when and where to open a new plant or close an existing one or which market to enter or exit. With this report, it is possible to compare the values of key metrics across multiple scenarios instead of just two at the same time.
Figure 5-20 Optimization Scenario Comparison report
90 IBM ILOG ODM Enterprise and Data Integration

Appendix A. Additional material
This IBM Redbooks publication references additional material that can be downloaded from the Internet, as described in the following sections.
Locating the web material
The web material associated with this paper is available in softcopy on the Internet from the IBM Redbooks Web server. Point your Web browser at:
ftp://www.redbooks.ibm.com/redbooks/REDP4740
Alternatively, you can go to the IBM Redbooks website at:
ibm.com/redbooks
Select Additional materials and open the directory that corresponds with the IBM Redpaper form number, REDP4740.
A
© Copyright IBM Corp. 2011. All rights reserved. 91

Using the web material
The additional web material that accompanies this paper includes the following files:
Scripts.zip DDL scripts for ODME_STG, ODME_SCENARIO, and ODME_DIM schemas.
Javacode.zip Java program source code used in the paper.
System requirements for downloading the web material
The web material requires the following system configuration:
Hard disk space: 5 MB minimumOperating system: Windows or Linux
Downloading and extracting the web material
Create a subdirectory (folder) on your workstation, and extract the contents of the web material compressed file into this folder.
92 IBM ILOG ODM Enterprise and Data Integration
Related publications
The publications listed in this section are considered particularly suitable for a more detailed discussion of the topics covered in this paper.
IBM Redbooks
The following IBM Redbooks publication provides additional information about the topic in this document.
� IBM Cognos Business Intelligence V10.1 Handbook, SG24-7912
You can search for, view, or download Redbooks, Redpapers, Technotes, draft publications and Additional materials, as well as order hardcopy Redbooks publications, at this Web site:
ibm.com/redbooks
Online resources
These Web sites are also relevant as further information sources:
� IBM Cognos BI Information Center:
http://publib.boulder.ibm.com/infocenter/cbi/v10r1m0/index.jsp
� IBM ILOG ODM Enterprise Information Center:
http://publib.boulder.ibm.com/infocenter/odmeinfo/v3r4/index.jsp
� IBM InfoSphere Warehouse Information Center:
http://publib.boulder.ibm.com/infocenter/db2luw/v9r7/index.jsp
� IBM WebSphere Application Server Information Center:
http://publib.boulder.ibm.com/infocenter/wasinfo/v7r0/index.jsp
© Copyright IBM Corp. 2011. All rights reserved. 93

Help from IBM
IBM Support and downloads
ibm.com/support
IBM Global Services
ibm.com/services
94 IBM ILOG ODM Enterprise and Data Integration


®
REDP-4740-00
INTERNATIONAL TECHNICALSUPPORTORGANIZATION
BUILDING TECHNICALINFORMATION BASED ONPRACTICAL EXPERIENCE
IBM Redbooks are developed by the IBM International Technical Support Organization. Experts from IBM, Customers and Partners from around the world create timely technical information based on realistic scenarios. Specific recommendations are provided to help you implement IT solutions more effectively in your environment.
For more information:ibm.com/redbooks
Redpaper™
IBM ILOG ODM Enterprise and Data Integration
Learn about ODM Enterprise integration with IBM InfoSphere and Cognos BI
Follow the optimization scenario for the Supply Demand model
Understand ODM Enterprise integrations
IBM ILOG ODM Enterprise is a platform to implement and deploy corporate custom solutions for optimization-based planning and scheduling. Developing a realistic plan or schedule that provides the best possible balance between customer service and revenue goals is hard work. With ILOG ODM Enterprise, business leaders can make better decisions through what-if analysis, scenario management, and collaboration.
This IBM Redpaper publication showcases the optimization scenario of the Supply Demand application for ILOG ODM Enterprise. This scenario highlights the product features. It includes suggested practices for using IBM Cognos and InfoSphere offerings to extract data and build reports with ILOG ODM Enterprise driving the import and export of data.
The target audience for this paper is IT specialists and IT architects who implement ILOG ODM Enterprise solutions and decision makers such as IT managers.
Back cover