Embed Size (px)
Citation preview

WWW.IBISWORLD.COM� Animal�Food�Production�in�the�US October 2011 1
IBISWorld Industry Report 31111Animal Food Production in the USOctober�2011� Josh�McBee
Eating it up: Export growth and a rise in pet ownership will drive demand
2� About�this�Industry2 Industry Definition
2 Main Activities
2 Similar Industries
2 Additional Resources
3� Industry�at�a�Glance
4� Industry�Performance4 Executive Summary
4 Key External Drivers
5 Current Performance
7 Industry Outlook
10 Industry Life Cycle
12� Products�&�Markets12 Supply Chain
13 Products & Services
13 Demand Determinants
15 Major Markets
16 International Trade
18 Business Locations
21� Competitive�Landscape21 Market Share Concentration
21 Key Success Factors
21 Cost Structure Benchmarks
23 Basis of Competition
24 Barriers to Entry
25 Industry Globalization
26� Major�Companies26 Archer Daniels Midland Company
27 Cargill Inc.
28 Mars Inc.
29 Nestle SA
30 The Procter & Gamble Company
32� Operating�Conditions32 Capital Intensity
33 Technology & Systems
34 Revenue Volatility
35 Regulation & Policy
36 Industry Assistance
37� Key�Statistics37 Industry Data
37 Annual Change
37 Key Ratios
38� Jargon�&�Glossary
www.ibisworld.com��|��1-800-330-3772��| ��[email protected]

WWW.IBISWORLD.COM� Animal�Food�Production�in�the�US October 2011 2
Firms in this industry process raw ingredients into food for animal livestock and pets. The products are packaged and
sold to cattle ranches, dairy farms, other animal-production farms, grocery wholesalers and retailers.
The�primary�activities�of�this�industry�are
Prepared animal feed manufacturing
Canned animal food manufacturing
Bird feed manufacturing
Cattle lick manufacturing
Chaff manufacturing
Crushed grain manufacturing
Dog biscuit manufacturing
Grain offal manufacturing
Canned pet food manufacturing
Prepared poultry feed manufacturing
11 Agriculture,�Forestry,�Fishing�and�Hunting�in�the�USEstablishments mainly engaged in farming cattle, hogs, pigs, sheep, goats, poultry and fish.
31121 Flour�Milling�in�the�USThis industry purchases grains such as wheat, corn and barley from cereal grain wholesalers or directly from growers.
42451 Corn,�Wheat�&�Soybean�Wholesaling�in�the�USEstablishments primarily engaged in wholesaling grains, such as corn, wheat, oats, barley, and unpolished rice.
Industry�Definition
Main�Activities�
Similar�Industries
Additional�Resources
About�this�Industry
For�additional�information�on�this�industry
www.petfoodinstitute.org�Pet Food Institute
www.usda.gov�US Department of Agriculture
www.fda.gov�US Food and Drug Administration
The�major�products�and�services�in�this�industry�are
Livestock feed
Pet foods

WWW.IBISWORLD.COM� Animal�Food�Production�in�the�US October 2011 3
Inde
x
280
100
120
140
160
180
200
220
240
260
1703 05 07 09 11 13 15Year
Price of feed
SOURCE: WWW.IBISWORLD.COM
% c
hang
e
30
−30
−20
−10
0
10
20
1703 05 07 09 11 13 15Year
Revenue Employment
Revenue vs. employment growth
Products and services segmentation (2011)
50.4%Livestock feed
49.6%Pet foods
SOURCE: WWW.IBISWORLD.COM
Key�Statistics�Snapshot
Industry�at�a�GlanceAnimal�Food�Production�in�2011
Industry�Structure Life Cycle Stage Mature
Revenue Volatility High
Capital Intensity High
Industry Assistance Low
Concentration Level High
Regulation Level Heavy
Technology Change High
Barriers to Entry Low
Industry Globalization Medium
Competition Level High
Revenue
$39.3bnProfit
$1.4bnExports
$2.4bnBusinesses
2,487
Annual�Growth�11-16
2.9%Annual�Growth�06-11
3.4%
Key�External�DriversPrice�of�feedDemand�from�animal�productionDemand�from�pet�storesPrice�of�cornNumber�of�pets�(cats�and�dogs)
Market�ShareArcher Daniels Midland Company 43.2%
Cargill Inc. 21.0%
Mars Inc. 11.6%
Nestle SA 10.6%
The Procter & Gamble Company 7.9%
p. 26
p. 4
FOR ADDITIONAL STATISTICS AND TIME SERIES SEE THE APPENDIX ON PAGE 37
SOURCE: WWW.IBISWORLD.COM

WWW.IBISWORLD.COM� Animal�Food�Production�in�the�US October 2011 4
Key�External�Drivers Price of feedLivestock producers rely on animal feed as a key production input. Because livestock production forms a primary market for feed producers, increases or decreases in domestic feed prices will affect feed producers’ profitability. This driver is expected to increase during 2011.
Demand from animal productionCattle herd sizes and meat production from slaughtered cattle primarily drive demand for animal feed, while other livestock industries contribute as well. Increases in US cattle herds and other
livestock numbers will raise demand for feed. This driver is expected to increase during 2011, presenting a potential opportunity for the industry.
Demand from pet storesPet stores purchase large quantities of pet food for retail sale. At about 40.0% of the animal-food market, pet-food retail accounts for a substantial portion of industry demand. This driver is expected to increase during 2011.
Price of cornCorn is a key input to animal food production, particularly livestock feed.
Executive�Summary
From cattle to cats, the Animal Food Production industry provides sustenance for livestock and pets in the United States and around the world. Given the grain-based nature of most types of feed, industry operators depend largely on movements in agricultural inputs like corn, soybeans and wheat. Likewise, feed demand stems from the agricultural viability of livestock commodities like beef, pork and poultry.
Feed prices, demand for animal products and commodity movements are the key drivers of the industry’s fortunes. Demand for pets augments total sales. With regard to commodities, corn’s relationship to oil has been increasing feed prices, but recent spikes in the crop’s value have been at the detriment of feed producers. Meanwhile, growth in global meat consumption and, consequently, herd stocks has sustained modest revenue growth as meat producers continue to demand feed for livestock.
Also, Americans have stood by their pets during the Great Recession, with canine and feline ownership growing even as personal disposable incomes have fallen. Given these conditions, IBISWorld expects industry revenue to grow at an average of 3.4% per year and total $39.3 billion despite a marginal dip of 0.3% in 2011 due to volatile commodities.
The industry’s future prospects are modest, with slow but sustained growth anticipated through 2016. Advancements in crop technology and alternative energy sources combined with product innovation are expected to alleviate some of the inherent risks associated with commodity-based goods. Also, a projected increase in disposable incomes and, subsequently, pet ownership will likely drive demand for pet food, a segment typified by high profit margins and brand-loyal consumers. Export growth is also anticipated through 2016, as the economic rise of countries in the Asian Pacific and Latin America drive demand for meat and animal feed. To this end, industry revenue is forecast to grow at an average annualized rate of 2.9% and total $45.4 billion through 2016.
Industry�PerformanceExecutive�Summary�� |�� Key�External�Drivers�� |�� Current�PerformanceIndustry�Outlook�� |�� Life�Cycle�Stage
� Americans stood by their pets, even during the recession, stabilizing demand for pet food

WWW.IBISWORLD.COM� Animal�Food�Production�in�the�US October 2011 5
Industry�Performance
Current�Performance
As developing economies expand and personal incomes grow among their populations, consumers often eat more meat. Increased meat consumption requires more feed grains to match increased meat production, and this is good news for producers of animal food. Global population growth is expected to boost food demand too, which will flow on to the Animal Food Production industry in the form of increased demand for livestock feed.
Since 2007, spikes in feed prices, increasing demand from animal production and steady growth in pet ownership have boosted industry revenue at an average annual rate of
3.4%; however, sustained volatility in commodity inputs is expected to decrease industry revenue a marginal 0.3% to $39.3 billion in 2011.
Industry profitability, as measured by earnings before interest and tax, is estimated to be 3.5%, a marginal increase from the previous year. Relatively high value addition during the production process combined with favorable supply contracts in key downstream demand industries allow industry players higher gross margins and lower per-unit costs. Also, increasing capital intensity within the industry has reduced labor costs, resulting in improved profitability.
Key�External�Driverscontinued
Corn prices have been volatile in recent years due to the crop’s use in ethanol production, which ties it to oil prices. Because feed prices generally move in line with corn prices, demand for animal feed may increase or decrease. This driver is expected to increase during 2011, thus posing a potential threat to the industry.
Number of pets (cats and dogs)The propensity of households to keep pets drives demand for some animal foods, with food for dogs and cats comprising the majority of domesticated animal food demand. This driver is expected to increase during 2011.
% c
hang
e
9
2
3
4
5
6
7
8
1705 07 09 11 13 15Year
Demand from pet stores
SOURCE: WWW.IBISWORLD.COM
Inde
x
280
100
120
140
160
180
200
220
240
260
1703 05 07 09 11 13 15Year
Price of feed

WWW.IBISWORLD.COM� Animal�Food�Production�in�the�US October 2011 6
Industry�Performance
Fido�and�Fluffy Pet ownership usually constitutes an emotional bond between human and animal counterparts, especially cats and dogs. The emotional aspects of pet ownership increase the likelihood that owners spend top-dollar for their pets’ health even during overall economic hardship, and data from the American Pet Products Association (APPA) supports this assumption. Together, felines and canines occupy an estimated 85.2 million US homes in 2011, according to the APPA. Also, the group’s 2011-2012 survey expects pet food sales to total $19.53 billion in 2011, representing a 4.1% increase from 2010 sales of $18.76 billion.
Similarly, live-animal purchases are expected to increase a marginal 0.9%, from $2.13 billion to $2.15 billion, during the same period. IBISWorld data further supports the APPA’s findings, with
demand from pet stores increasing at an annualized rate of 4.3% since 2006 to an estimated $14.5 billion in 2011. Consumers’ dedication to owning pets has been a boon to the Animal Food Production industry, which derives an estimated 49.6% of its sales from pet food.
Feed�prices�and�animal�production
Even though US per capita consumption for every type of meat has fallen marginally during the five years to 2011, IBISWorld data indicate US demand from animal production has increased at an annualized rate of 2.1% in the same period. A spike in demand during 2007 offset previous and subsequent declines, and revenue moved accordingly, growing 16.2% to reach $38.7 billion. Also in 2007, the price of feed jumped 20.2% and a further 28.0% in 2008 to help revenue reach its five-year high of $47.9 billion.
When it comes to global demand for animal production, movements in exports help illustrate how international markets have contributed to revenue growth. Exports have grown at an average rate of 6.5% per year since 2007 to $2.4 billion, thanks largely to spikes of 11.5% and 14.6% in 2007 and 2008, respectively. While imports have attempted to encroach on domestic territory at an annualized rate of 8.9% during the past five years, their expected overall sales volume of $883
million in 2011 remains well below half of exports. Most other countries dedicate the majority of their crop production to the input of food for humans and, therefore lack the resources to create viable amounts of animal food for exports.
The world’s appetite for high-protein diets has positively influenced the livestock-production industry, thus increasing feed demand for cattle, swine, poultry and aquaculture. According to the United Nations’ Food and Agriculture Organization, a country’s gross domestic product forms the primary determinant of per capita meat consumption. Given this, the economic rise of developing countries such as Brazil, Russia and China has further increased demand. For example, half of the world’s pork is now consumed in China, while Brazil is second to the United States as the largest beef-consuming country. Developing nations’ attempt to meet increased demand for animal products has been beneficial to US feed producers.
US�pet�ownership�(2011)Pet Households (Millions)
Dog 46.3Cat 38.9Freshwater fi sh 11.9Bird 5.7Small animal 5.0Reptile 4.6Equine 2.4Saltwater fi sh 0.7
SOURCE: AMERICAN PET PRODUCTS ASSOCIATION

WWW.IBISWORLD.COM� Animal�Food�Production�in�the�US October 2011 7
Industry�Performance
Industry�Outlook
During the next five years, growth in global meat consumption will increase herd stocks, especially poultry, cattle and swine. Such booming livestock numbers will aid the Animal Food Production industry, as global meat demand flows through to increase feed demand. The economic rise of developing countries
has led to greater appetites for meat in those regions. Such developments will sustain demand for animal feed through 2016. Furthermore, continuing population growth and rising disposable incomes driven by an expected economic recovery will increase US meat consumption and pet ownership, thereby
Commodity�prices Given the historical volatility of key commodity prices, such as corn, wheat and oilseeds, and their dependence on uncontrollable factors like weather patterns, it is difficult for industry players to fully insulate themselves from risk. Moreover, unpredictable risks such as famine, disease and contamination threaten downstream demand from ranches and livestock farms. Therefore, the industry is subject to potentially dramatic fluctuations in revenue and consumption because its performance principally depends on volatile variables.
In recent years, corn-based ethanol as a gasoline substitute and soybean-based biodiesel as a diesel-fuel substitute have been increasing feed prices. High oil prices from 2007 through the first three quarters of 2008 increased the profitability of ethanol produced from corn and biodiesel produced from soybeans, thus driving up demand for the two crops and increasing prices for all corn and soybean products. Corn, soybeans and wheat operate as interchangeable substitutes on the animal feed market, so the high price of corn and soybeans drove feed demand toward wheat. Wheat prices rose with higher demand, meaning any increase in oil prices would cause the price of feed from all three main crops to rise as well. Consequently, the price of feed has increased during the period, exhibiting strong annualized growth of 8.9% since 2007.
Data from the Bureau of Labor Statistics indicates that the feed-price index increased sharply from 2006 to 2008. Feed prices then dropped in 2009 and 2010 as oil prices fell from their 2008 highs while the recession cut into demand for meat. In 2011, recovering oil prices and global meat demand is expected to increase prices back to 2008 levels. Although high feed prices are usually positive for animal feed producers, the volatile spikes exhibited from 2007 to 2008 were too high for most markets to match, and revenue during those years was relatively weak compared to 2009 and 2010 sales, when the price of feed fell 4.1% and 2.1%, respectively. As input crops become increasingly tied to movements in oil prices, extended periods of commodity volatility will induce farmers to grow their own feed inputs.
% c
hang
e
30
−30
−20
−10
0
10
20
1703 05 07 09 11 13 15Year
Revenue Exports
Revenue vs. exports
SOURCE: WWW.IBISWORLD.COM

WWW.IBISWORLD.COM� Animal�Food�Production�in�the�US October 2011 8
Industry�Performance
Industry�Outlookcontinued
boosting industry demand. In light of growing global meat demand and steady growth in pet ownership, IBISWorld forecasts the Animal Food Production
industry’s revenue to increase at an annualized rate of 2.9% through 2016 to $45.4 billion, including growth of 2.7% from 2011 to 2012.
Pet�food�demand�to�rise
In addition to animal production, demand for pet foods is also anticipated to rise as pet ownership steadily increases. IBISWorld forecasts demand from pet stores to increase at an annualized rate of 4.4% to about $18 billion by 2016. A projected trend toward greater brand optimization will help manufacturers retain and expand market share during the period. Also, producers will seek to minimize the adverse effects of product recalls, which can damage a company’s reputation and reduce brand loyalty. For example, Procter & Gamble’s market share of US pet food fell 1.0% solely from a voluntary recall of some wet pet foods in 2007.
Because most pet owners are relatively demanding of pet foods, focusing on attributes such as health, safety and quality will help producers minimize the incidences of recalls while ensuring safeguards against contamination or compromised quality during production.
Pet food claims are increasingly mirroring human foods, touting enrichments with multigrains, leafy greens and fruits or foods produced without preservatives or artificial flavors. Furthermore, organic and functional pet foods have also increased in popularity as evidenced by a host of new product introductions, such as Hill’s Science Diet Healthy Mobility
More�money,�more�meat,�more�feed
Global meat consumption is forecast to increase about 2.0% annually until 2016 and double by 2050, according to forecasts from the US Department of Agriculture. This growth is forecast to be most pronounced in emerging economies as population growth and increased incomes raise meat consumption. This trend bodes well for US feed manufacturers because countries like China and Indonesia will demand greater quantities of high-quality feed to match their rising livestock numbers.
In terms of US consumption, demand from animal production is forecast to increase 1.5% through 2016. In particular, an increase in poultry meats is projected as Americans become more aware of perceived health risks associated with red meat consumption. Furthermore, the production and farming of poultry is less imposing on
the environment when compared with beef or pork production, and environmental concerns are increasingly becoming a factor across all agricultural pursuits. For example, to produce one kilogram of feedlot beef requires nine kilograms of cereal grain, while the ratio is only 2:1 for chicken. In light of growing environmental concerns, livestock producers will seek ecologically forgiving production methods such as mixed farming and the judicious use of energy inputs in the pursuit of increased profit margins.
� Growth in global meat consumption and livestock production will benefit industry demand

WWW.IBISWORLD.COM� Animal�Food�Production�in�the�US October 2011 9
Industry�Performance
Pet�food�demand�to�risecontinued
Canine and other products featuring customized formulas. These products attract high margins, and demand remains relatively resilient since they target the market’s premium segment.
Current trends in pet food are forecast to bode well for manufacturers during the next five years as incomes rise and consumer confidence returns to prerecession levels.
Profit�and�size The industry is forecast to remain profitable, with operating profit accounting for an average of 4.0% of overall industry revenue in the five years to 2016. This percentage represents a marginal increase when compared to the past five years. Volatility in commodity prices and downstream demand are forecast to partially offset gains from production efficiencies and lower labor costs.
An increasing level of investment in technology and equipment will help
improve productivity and expand volumes without the need for additional labor, thereby increasing the average wage per employee. Consequently, wages are projected to increase at an annualized rate of 0.9% during the period and account for an estimated 4.8% of revenue. Meanwhile, industry employment is forecast to increase only modestly, at an annualized rate of 0.3% to total about 50,990, as establishments increase 0.6% and total about 3,200 through 2016.
The�future�of�corn The price of corn, like most commodities, is highly volatile and difficult to predict, especially since the price became tied to oil movements. Pressure from oil will cause the price of corn to continue increasing through 2016, but anticipated reductions in Farm Bill subsidies (which expire in 2012), advances in crop production via better technology and continued development of ethanol fuels derived from alternative crops will counteract price spikes. Although corn prices are forecast to remain volatile year over year through 2016, these trends will limit growth at an estimated rate of 0.9% annually to reach $4.44 per bushel.
The residual high feed prices of the past five years will push farmers to devote more land to growing the associated crops, thereby increasing
supply and lowering prices. Also, genetically modified strains of wheat, corn and soybeans that are more weather- and pest-resistant will almost completely supplant unmodified strains during the forecast period, resulting in higher crop yields. Harvest increases will prevent rising demand and oil prices from further increasing the price of feed. In light of these projections, the price of animal feed is forecast to decline a slight 1.5% through 2016.
� Farmers will increasingly use genetically modified seeds for their resistance properties

WWW.IBISWORLD.COM� Animal�Food�Production�in�the�US October 2011 10
Industry�PerformanceWholesale and ranch demand has been volatile during the past five years
Higher raw material costs have limited potential increases in profitability
The adverse effect of famine and drought on cattle has hurt demand for animal food
Life�Cycle�Stage
SOURCE: WWW.IBISWORLD.COM
30
25
20
15
10
5
0
–5
–10–10 100 20–5 155 25 30
%�G
row
th�o
f�pro
fi�t/G
DP
%�Growth�of�establishments
DeclineCrash or Grow?
Potential�Hidden�GemsFuture Industries
Quality�GrowthHigh growth in economic importance; weaker companies close down; developed technology and markets
Time�WastersHobby Industries
MaturityCompany consolidation;level of economic importance stable
Shake-out
Shake-out
Quantity�GrowthMany new companies; minor growth in economic importance; substantial technology change
Key�Features�of�a�Mature�Industry
Revenue grows at same pace as economyCompany numbers stabilize; M&A stageEstablished technology & processesTotal market acceptance of product & brandRationalization of low margin products & brands
Beef�Cattle�Production
Soybean�Farming
Flour�Milling
Dairy�Farms
Oilseed�Farming Animal�Food�Production

WWW.IBISWORLD.COM� Animal�Food�Production�in�the�US October 2011 11
Industry�Performance
Industry�Life�Cycle The Animal Food Production industry is in the mature stage of its life cycle, typified by a saturated market with little room for product innovation. In the 10 years to 2016, industry value added (IVA, i.e. the degree to which industry revenue contributes to US gross domestic product, or GDP) is expected to increase 1.4% per year. Meanwhile, real GDP is projected to grow 2.0% annually during the same period. This suggests that, because the American economy is growing near the same pace as the industry, the industry is in the mature phase of its life cycle.
Other indications of the industry’s life-cycle stage relate to industry structure in terms of new entry and acquisition activity. Employment has risen only 0.4% since 2007, with establishments also increasing modestly. In addition, the geographic spread of establishments has changed little in recent years, generally downsizing at similar rates across most regions of the country.
Product segmentation and production technology also provide some insight into the industry’s developmental phase. Currently, the industry offers a stable and clearly segmented range of product groups, which has undergone some product consolidation during the current period.
The industry also relies on traditional channels for its sales, which has resulted in the stagnation of new markets. In terms of technology, some advancement, principally through genetic modification and changing the chemical characteristics of key inputs, is allowing different product experimentation and innovation, particularly the development of new feed formulas.
The overall rate of technological change has been high and has focused on product quality and consistency, characteristics generally associated with the decline and growth phases of the life cycle, respectively. Consequently, it is reasonable to assume the industry fits somewhere between the two, i.e. the mature phase.
�This industry is Mature

WWW.IBISWORLD.COM� Animal�Food�Production�in�the�US October 2011 12
�Products�&�MarketsSupply�Chain�� |�� Products�&�Services�� |�� Demand�DeterminantsMajor�Markets�� |�� International�Trade�� |�� Business�Locations
KEY�BUYING�INDUSTRIES
11211� Beef�Cattle�Production�in�the�US�Cattle are the main source of demand for processed animal food in the United States.
11212� Dairy�Farms�in�the�US�Dairy cows are a significant source of demand for manufactured animal food products.
11213� Livestock�Ranching�&�Farming�in�the�US�Any properties running cattle require feed to maintain the herd’s health.
11221� Hog�&�Pig�Farming�in�the�US�Intensive farming such as swine production forms an important source of demand for animal food.
42441� Grocery�Wholesaling�in�the�US�Grocery wholesalers purchase pet foods for resale to supermarkets and other stores.
42491� Farm�Supplies�Wholesaling�in�the�US�Farm-supplies wholesalers distribute goods to crop and livestock farmers, including animal feed.
44511� Supermarkets�&�Grocery�Stores�in�the�US�Stores purchase a small amount of pet food for resale to consumers.
45391� Pet�Stores�in�the�US�Pet stores purchase a large amount of this industry’s products and comprise a major source of demand.
KEY�SELLING�INDUSTRIES
11111� Soybean�Farming�in�the�US�Soybeans are a key raw material used to produce animal food.
11112� Oilseed�Farming�in�the�US�Oilseeds are also a key raw material used to produce animal food.
11115� Corn�Farming�in�the�US�Corn is used to produce many animal foods for livestock and pets.
11117� Wheat,�Barley�&�Sorghum�Farming�in�the�US�Wheat is one of the major inputs used to produce some animal foods.
11120� Vegetable�Farming�in�the�US�Vegetables are used in the manufacture of animal foods, mostly for dogs and cats.
22121� Natural�Gas�Distribution�in�the�US�Manufacturing food products requires a reliable supply of natural gas to power plant and equipment.
31121� Flour�Milling�in�the�US�This industry mills corn, soybeans and other oilseeds and sells its products to animal-food producers.
42451� Corn,�Wheat�&�Soybean�Wholesaling�in�the�US�Grain and field-beans are key ingredients for making cattle and pet foods.
Supply�Chain

WWW.IBISWORLD.COM� Animal�Food�Production�in�the�US October 2011 13
Products�&�Markets
Products�&�Services
The Animal Food Production industry produces a wide range of finished products but can be broadly segmented into two main product groups: livestock feed and pet food.
Livestock feedLivestock feed, mainly cattle feed, represents the largest product segment and is estimated to account for about 50.4% of overall industry revenue. This includes the production and purchase of soybean meals and hulls, linseed meals, sunflower meals, meat and bone meals, feather meals, yellow grease, wheat bran, oat hulls, alfalfa meals and pellets, and gluten feed and meals. Feed for intensively farmed livestock generally includes grain and pellets manufactured from various crop types. This segment has lost some of its market share in the past 12 years, down from 67.8% in 1999, as climatic instability and volatile supply and demand factors have impeded growth.
Pet foodAt an estimated 49.6% of total revenue, pet food accounts for the other portion of industry production. This segment includes meat-, fish- and vegetable-based dried foods, whole meals, birdseed, hamster pellets, dry and wet cat food, dog biscuits and treats, and other specialized meals. This segment’s share of revenue has increased during the past five years, primarily driven by an increase in pet ownership during the period. Pet foods are also generally more profitable than cattle feed because pet owners constitute a captive market. Compared to ranchers and livestock farmers, owners of domestic pets have fewer options for animal nutrition. Whereas a rancher may feed his cattle a mix of naturally growing grass, feed from a co-op and nutritional supplements, pet owners usually succumb to whatever is available at a retail outlet. Also, livestock owners sometimes generate and process their own feeds or use regional supply chains that cut out major players.
Products and services segmentation (2011)
Total $39.3bn
50.4%Livestock feed
49.6%Pet foods
SOURCE: WWW.IBISWORLD.COM
DemandDeterminants
Livestock numbersThe largest portion of industry demand comes from livestock ranching and farming with regard to beef and milk
production. Collectively, dairy and beef ranches own the majority of US cattle stock, which considerably impacts demand for animal foods relating to

WWW.IBISWORLD.COM� Animal�Food�Production�in�the�US October 2011 14
Products�&�Markets
DemandDeterminantscontinued
cattle. The inventory of animal stocks within the sheep, lamb, goat, pig, horse, rabbit and poultry industries also impacts demand for animal food. Risks of disease and contamination pose the biggest threat to stocking levels and, in turn, industry demand.
Farming intensityIn addition to stocking levels, the intensity of livestock farming also affects industry demand. Intensive operations require more feed with more value add because they raise animals in feedlots with the main purpose of harvesting a maximum amount of meat or product from each animal. In feedlot farms, livestock rely only on processed animal feed and do not graze, thereby requiring a higher quantity of feed. For animals farmed on ranches, demand for animal feed will be lower because the livestock can feed on pastureland.
Changing dietary trendsConsumers’ lifestyles and dietary patterns have changed during the past five years. Increased awareness of the links between a red meat-rich diet and
the risk of obesity and heart disease has prompted Americans to revise their eating and living habits. There has been a switch to poultry consumption, which is lower in fat and more protein rich than traditional red meats. Consumer sentiment toward the health and nutritional benefits of meat consumption will impact demand for this industry’s products. For example, an increase in demand for grass-fed beef or other organically branded meats will reduce demand for processed feeds.
Pet ownershipGiven that pet food forms just over 40% of industry revenue, the number of households that own a pet also significantly affects demand for industry products. Pet food demand tends to be less susceptible to changes in price because, unlike some farmers, most pet owners lack the ability to produce pet-specific food. Also, because pet owners tend to become emotionally attached to their animals, they are more willing to endure price hikes for products they believe will boost health or immunity to disease.
WWW.IBISWORLD.COM� Animal�Food�Production�in�the�US October 2011 15
Products�&�Markets
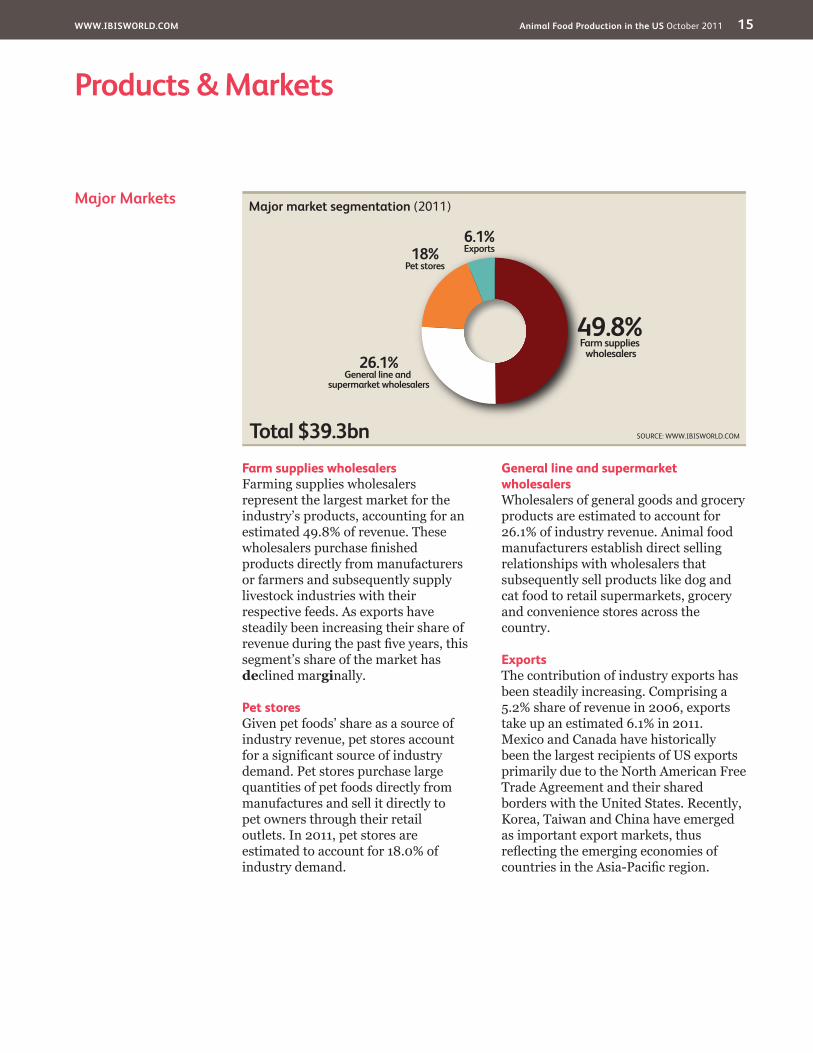
Major�Markets
Farm supplies wholesalers Farming supplies wholesalers represent the largest market for the industry’s products, accounting for an estimated 49.8% of revenue. These wholesalers purchase finished products directly from manufacturers or farmers and subsequently supply livestock industries with their respective feeds. As exports have steadily been increasing their share of revenue during the past five years, this segment’s share of the market has declined marginally.
Pet stores Given pet foods’ share as a source of industry revenue, pet stores account for a significant source of industry demand. Pet stores purchase large quantities of pet foods directly from manufactures and sell it directly to pet owners through their retail outlets. In 2011, pet stores are estimated to account for 18.0% of industry demand.
General line and supermarket wholesalers Wholesalers of general goods and grocery products are estimated to account for 26.1% of industry revenue. Animal food manufacturers establish direct selling relationships with wholesalers that subsequently sell products like dog and cat food to retail supermarkets, grocery and convenience stores across the country.
ExportsThe contribution of industry exports has been steadily increasing. Comprising a 5.2% share of revenue in 2006, exports take up an estimated 6.1% in 2011. Mexico and Canada have historically been the largest recipients of US exports primarily due to the North American Free Trade Agreement and their shared borders with the United States. Recently, Korea, Taiwan and China have emerged as important export markets, thus reflecting the emerging economies of countries in the Asia-Pacific region.
Major market segmentation (2011)
Total $39.3bn
49.8%Farm supplies wholesalers
26.1%General line and
supermarket wholesalers
18%Pet stores
6.1%Exports
SOURCE: WWW.IBISWORLD.COM

WWW.IBISWORLD.COM� Animal�Food�Production�in�the�US October 2011 16
Products�&�Markets
International�Trade The US domestic market accounts for the majority of demand, and US consumption is estimated to account for about 92.0% of total industry revenue. IBISWorld estimates domestic demand has increased in the five years leading up to 2011, reflective of increased herd stocks, an increase in pet ownership and higher spending during the period. International trade has been growing overall, with the trade-weighted index favoring exports and low-cost labor from emerging economies spurring rapid import growth.
ExportsThe total value of US animal food exports is expected to grow at an annualized rate of 6.5% and total $2.4 billion during the five years to 2011, thus accounting for 6.1% of total industry revenue. The fall of the American dollar during the same period has facilitated export growth, as a weak dollar increase the purchasing power of foreign currencies. The
industry’s major players account for the majority of exports, primarily owing to their size, vertical integration, international presence and easy access to foreign markets. In terms of overseas markets, Canada is expected to account for the majority of exports with 27.0%, followed by Japan (17.0%), China (9.0%) and Indonesia (6.0).
Level�&�Trend��Exports in the industry are Medium and Steady
�Imports in the industry are Low and Increasing
Imports From...
Total $883.1m
35%China
28%Canada
26%All other
10%Thailand
1%Ireland
Exports To...
Total $2.4bn
41%All other
27%Canada
17%Japan
9%China
6%Indonesia
Year: 2011SIZE OF CHARTS DOES NOT REPRESENT ACTUAL DATA SOURCE: USITC
$ m
illio
n
3000
−1500
−1000
−500
0
500
1000
1500
2000
2500
1703 05 07 09 11 13 15Year
Exports Imports Balance
Industry trade balance
SOURCE: WWW.IBISWORLD.COM

WWW.IBISWORLD.COM� Animal�Food�Production�in�the�US October 2011 17
Products�&�Markets
ImportsIn the past five years, import penetration has increased at an annualized rate of 8.9% to total $883.1 million, thus accounting for 2.3% of domestic demand. Lower wages in sourcing countries overseas helps producers pass
on savings to consumers. Also, decreased regulations on production, particularly in Asia, has helped imports grow during the period. China is expected to account for 35.0% of all imports, followed by Canada (28.0%), Thailand (10.0%) and Ireland (1.0%).
International�Tradecontinued

WWW.IBISWORLD.COM� Animal�Food�Production�in�the�US October 2011 18
�Products�&�Markets
Business�Locations�2011
MO3.7
West
West
West
Rocky Mountains Plains
Southwest
Southeast
New England
Great Lakes
VT0.4
MA0.2
RI0.1
NJ1.4
DE0.4
NH0.2
CT0.2
MD0.9
DC0.0
1
5
3
7
2
6
4
8 9
Additional�States�(as marked on map)
AZ0.4
CA11.0
NV0.3
OR0.4
WA1.1
MT0.1
NE2.5
MN2.5
IA8.3
OH5.0 VA
1.3
FL1.2
KS3.5
CO1.8
UT0.6
ID0.5
TX5.9
OK3.2
NC3.8
AK0.1
WY0.1
TN1.3
KY1.8
GA4.8
IL2.8
ME0.3
ND0.3
WI3.7 MI
0.6 PA5.4
WV0.1
SD0.7
NM0.3
AR3.4
MS1.5
AL3.0
SC1.0
LA0.6
HI0.1
IN3.4
NY3.9 5
67
8
321
4
9
SOURCE: WWW.IBISWORLD.COM
Mid- Atlantic
Revenue�(%)
� Less�than�3%� 3%�to�less�than�10%� 10%�to�less�than�20%� 20%�or�more

WWW.IBISWORLD.COM� Animal�Food�Production�in�the�US October 2011 19
�Products�&�Markets
Business�Locations IBISWorld analysis reveals establishments in the Animal Food Production industry are strategically located close to key inputs and major transportation hubs while remaining within serviceable distance to large city markets. In recent years, the industry’s top manufacturers have concentrated their operations on a small number of sites because high throughput, automatic equipment and almost-continuous operation produce significant economies of scale. Products are then transported in bulk to distribution centers across the country. The trend of rising geographic concentration is consistent with trends across the overall food manufacturing sector.
The PlainsThe Plains region houses the majority of industry establishments and is estimated to account for about 23.0% of the total. Expansive grain-farming belts, especially of corn, soybeans and wheat across Iowa, Missouri and Minnesota, make it ideal for animal food producers to base themselves in this region. Further, a
majority of the country’s cattle farms, which form the most important source of downstream demand for animal feed, are also located in this region. The Plains region also generates the largest share of revenue at 21.5%.
The SoutheastThe Southeast region is expected to account for 20.2% of total animal-food manufacturing establishments and 23.8% of revenue. This region is also home to extensive corn and soybean plantations and a substantial number of cattle and hog farms. These are mainly located in North Carolina, Florida and Georgia as the region is climatically favorable. Also, the region’s producers can service large markets such as Miami and Atlanta. Further, access to abundant and relatively inexpensive labor has also facilitated the presence of manufacturing plants in this region.
The Great LakesThe Great Lakes region is home to about 16.8% of all industry establishments and an estimated 15.5%
%
30
0
10
20
Sout
hwes
t
Wes
t
Gre
at L
akes
Mid
-Atla
ntic
New
Eng
land
Plai
ns
Rock
y M
ount
ains
Sout
heas
t
RevenueEstablishments
Revenue vs. establishments
SOURCE: WWW.IBISWORLD.COM
%
30
0
10
20
Sout
hwes
t
Wes
t
Gre
at L
akes
Mid
-Atla
ntic
New
Eng
land
Plai
ns
Rock
y M
ount
ains
Sout
heas
t
RevenuePopulation
Revenue vs. population

WWW.IBISWORLD.COM� Animal�Food�Production�in�the�US October 2011 20
�Products�&�Markets
Business�Locationscontinued
of revenue. Wisconsin, Illinois and Ohio account for 11.5% of all animal-food manufacturing facilities in the country, primarily due to their proximity to grain and flour mills and major
consumer markets like Chicago, Detroit, Cleveland and Milwaukee. Further, major player ADM is located in Decatur, IL, and operates a number of production facilities in the region.

WWW.IBISWORLD.COM� Animal�Food�Production�in�the�US October 2011 21
Cost�Structure�Benchmarks
Cost structures vary among industry players depending on their size and scale of production, ease of access to production inputs, level of technology and capital investments. The larger the manufacturer, the lower the per unit cost of production is because they benefit from economies of scale.
ProfitRelatively high profit margins characterize the industry, primarily due to a high level of value addition during the production process. That is, manufacturers employ considerable resources and costs in terms of capital, technology and branding that translate
Key�Success�Factors Effective quality controlProduct quality and safety determines the credibility and reputation of a manufacturer. Eliminating or reducing aberrations and anomalies will help ensure repeat customers and brand loyalty.
Access to high-quality inputsPurchasing agricultural inputs from healthy yields will ensure maximized end-product quality. Long-term contracts with growers can help ensure access to such inputs.
Ability to adapt to changing regulationsRegulations with respect to USDA health and safety requirements are constantly changing, and the industry is
required to comply. Compliance also helps build credibility.
Production of premium goods and servicesValue-added products include those that increase animal health or address specific conditions of an animal’s life cycle. Consumers are usually willing to pay more for a product if they believe it works as advertised.
Economies of scale and scopeThe scale and breadth of production largely determines marginal costs while also impacting the volume a producer is able to supply, which is a key determinant of market-share success.
Market�Share�Concentration
The Animal Food Production industry has a medium level of concentration, with the industry’s top four players expected to account for about 86.4% of total market share in 2011. The industry has experienced an increasing level of concentration over the past five years, growing from 58.5% in 2006. Increased concentration has been the result of some major players actively investing in new operations to further strengthen efficiencies from scale economies. Further, the rapidly growing and high-margin pet-food segment has encouraged
many producers to switch their production lines from livestock feed to these products.
Industry consolidation is expected to continue in the future through sustained merger and acquisition activity, primarily driven by major players such as Cargill, ADM and Mars. Given that economies of scale are imperative to maintaining industry profitability, it is very likely there will be fewer animal food manufacturers servicing wider geographic markets through the outlook period.
Competitive�LandscapeMarket�Share�Concentration�� |�� Key�Success�Factors�� |�� Cost�Structure�BenchmarksBasis�of�Competition�� |�� Barriers�to�Entry�� |�� Industry�Globalization
Level��Concentration in this industry is High
�IBISWorld identifies 250 Key Success Factors for a business. The most important for this industry are:

WWW.IBISWORLD.COM� Animal�Food�Production�in�the�US October 2011 22
Competitive�Landscape
Cost�Structure�Benchmarkscontinued
into high wholesale and retail prices that are eventually passed on to consumers. Recently, high volatility in commodity prices due to unpredictable weather has pressured profit margins and led producers to source their inputs from cheaper foreign markets, such as China. The rapid increase in import volumes evidences the effect high commodity prices can have on the industry. In 2011, IBISWorld estimates that earnings before interest and taxes will account for 3.5% of overall industry revenue.
PurchasesThe prices of key production inputs such as corn, soybeans, oilseeds, wheat and other grains are the primary drivers of overall purchase costs. Other raw materials required include paperboard containers and plastic packaging, especially for pet foods sold to consumer markets. In the past five years, the ratio of purchases to revenue has varied considerably with fluctuations in supply conditions, primarily due to the high level of unpredictability in weather conditions. At about 75.6% of total industry costs, IBISWorld estimates purchases will constitute the largest percentage of costs.
WagesWages and salaries are estimated to
account for 5.2% of overall revenue in 2011. Wages as a proportion of revenue have steadily exhibited a downward trend during the past five years, after comprising a 5.4% share of revenue in 2006. This outcome is consistent with the rising level of capital investment in technology, plant and equipment that aims to increase productivity without the need for additional labor costs.
Selling, general and administrative costs (SG&A)Expenses relating to selling, marketing, promotions and administration are expected to comprise 4.5% of overall industry costs. The proportion of SG&A costs varies with product segments, and animal-feed producers need fewer investments in promotion and advertising. On the other hand, pet food manufacturers need to promote their products more aggressively because they compete on a retail level.
Other costsOther costs that can significantly affect the industry include overhead expenses such as distribution, depreciation, research and development, and utility costs. Collectively, IBISWorld estimates these costs will represent about 11.2% of total industry expenses in 2011.
Industry�Costs�and�Average�Sector�Costs■�Profi�t■�Rent■�Utilities■�Depreciation■�Other■�Wages■�Purchases
Industry�Costs�(2011)
Average�Costs�of�all�Industries�in�sector�(2011)
3.5Profit
75.65.210.0
2.8
1.6
1.3
9.2Profit
58.511.214.63.3
2.1
1.2
SOURCE: WWW.IBISWORLD.COM
0 100%

WWW.IBISWORLD.COM� Animal�Food�Production�in�the�US October 2011 23
Competitive�Landscape
Basis�of�Competition The Animal Food Production industry is highly competitive, with the major players fiercely competing for market share. There is also a high element of unpredictability with regard to the weather, disease and contamination that can change industry dynamics during particular periods of time. Industry competition is principally based on price, product content, supply-chain management and marketing.
PriceAs with many industries, competition between animal-food producers has traditionally been based on price, with the majority of products regarded as essentially homogeneous. Further, as a majority of demand for the industry’s products comes from small- to medium-sized cattle and livestock industries, it is highly sensitive to changes in price. Price is also an important determinant in influencing demand for pet foods at the retail level. Consumer sensitivities vary between product segments and are inversely related to the perceived quality of a product or brand. In other words, if a consumer believes a product to be high quality, price will become less important to him or her. Thus, pricing is the most critical competitive factor for producers of low-grade, generic brands.
Nutritional contentGiven the increasing awareness of the nutritional requirements of animals, farmers are demanding healthier feed that is produced using high-quality ingredients and advanced safety
precautions. Brands that cater to these nutritional requirements and are yet affordable will realize the highest demand.
Relationship with key suppliersDeveloping and maintaining strong relationships with key suppliers is also a critical area of competition. The ability to secure coveted grocery store and supermarket shelf space has conventionally set market leaders apart from their competitors. Further, the ability of feed manufacturers to secure supply contracts with key demand industries such as livestock farming, beef ranchers and milk production is also critically important to their success.
Branding and promotionSimilar to pricing, the importance of branding varies between products segments. As mentioned, the perceived quality of a particular product or brand will determine the price consumers are willing to pay for it. Brand-loyal customers are numb to changes to price because of the associated perceptions of quality. Manufacturers of animal feed used as primary inputs in intermediate markets such as livestock and cattle farming have less need to aggressively promote their products, but producers supplying finished products such as pet foods to supermarkets and grocery stores have to compete with strong, household brand names and therefore will need to invest in marketing and promotional initiatives.
Level�&�Trend��Competition in this industry is High and the trend is Steady

WWW.IBISWORLD.COM� Animal�Food�Production�in�the�US October 2011 24
Competitive�Landscape
Barriers�to�Entry Barriers to entry in the Animal Food Production industry are relatively low but can depend on the scale of production the entrant wishes to pursue. The scale of entry defines the levels of capital, technology, labor and enterprise needed to commence operations. In the United States, food manufacturing is generally characterized by large-volume production. Most food products have low per unit values, making economies of scale necessary to minimize average production costs. Firms wishing to enter the market will therefore need to establish production of a similar scale to effectively compete against incumbent players.
Regardless of scale, the capital investment needed to establish certain industry operations can act as primary barrier for new participants. Generally, manufacturing animal food is capital intensive and requires substantial initial investments in plant and machinery, establishment costs, technology and mechanization.
Potential entrants also face strong competition against existing firms that have invested heavily in branding, promotion and distribution over many years. New firms can encounter difficulties winning market share from well-entrenched manufacturers that have built strong relationships with suppliers and customers. Furthermore, established firms will aggressively defend their market share and can afford to substantially discount their products, which will be difficult for new players to match.
Level�&�Trend��Barriers to Entry in this industry are Low and Steady
Barriers�to�Entry�checklist� LevelCompetition HighConcentration HighLife Cycle Stage MatureCapital Intensity HighTechnology Change HighRegulation & Policy HeavyIndustry Assistance Low
SOURCE: WWW.IBISWORLD.COM

WWW.IBISWORLD.COM� Animal�Food�Production�in�the�US October 2011 25
Competitive�Landscape
Industry�Globalization
On the whole, manufacturers in the Animal Food Production industry are exposed to a moderate level of globalization, and foreign ownership in the domestic market is relatively low. Smaller firms lack the resources to compete outside their US or regional markets, but major players such as Archer Daniels Midland (ADM), Cargill and Mars have an
extensive presence in overseas markets. For example, ADM operates more than 270 plants worldwide, and Cargill employs more than 158,000 people across 66 countries. Such corporations are able to leverage their interests in vertically integrated operations and their economies of scale and scope in order to fund such global expansion.
SOURCE: WWW.IBISWORLD.COM
Trade�Globalization Going�Global:�Animal�Food�Production�2000-2011
Expo
rts/
Reve
nue
Expo
rts/
Reve
nue
200
150
100
50
0
200
150
100
50
0
Imports/Domestic�Demand Imports/Domestic�Demand0 040 4080 80120 120160 160
International trade is a major determinant of an industry’s level of globalization.
Exports offer growth opportunities for fi rms. However there are legal, economic and political risks associated with dealing in foreign countries.
Import competition can bring a greater risk for companies as foreign producers satisfy domestic demand that local fi rms would otherwise supply.
Export ExportGlobal Global
ImportLocal ImportLocal
Animal�Food�Production 2000
2011
Level�&�Trend��Globalization in this industry is Medium and the trend is Steady

WWW.IBISWORLD.COM� Animal�Food�Production�in�the�US October 2011 26
Player�Performance With total revenue of $80.7 billion and about 30,000 employees, Archer Daniels Midland (ADM) is one of the world’s largest processors of oilseeds, corn, wheat, cocoa and related feed grains. Headquartered in Decatur, IL, the company is also a leading manufacturer of soybean oil, protein meal, corn sweeteners and other food ingredients in addition to maintaining an extensive storage and transportation network to procure, store, clean and distribute agricultural commodities. ADM’s operations are classified into three broad segments: oilseed processing, corn processing and agricultural services.
ADM’s agricultural services segment manufactures feed formulations and ingredients. The division produces proteins, vitamin blends and amino acids for poultry, goats, cattle, sheep, swine and horses. In addition to feed ingredients, wholly owned subsidiary Alliance
Nutrition manufactures animal-health products such as de-wormers, probiotics, hay tarps, preservatives, insecticides, medicated pellets and crumbles.
IBISWorld estimates the US operations of ADM’s agricultural services segment will realize about $17.0 billion in revenue in fiscal 2012, which represents an average annual growth rate of 14.4% during the five years to fiscal 2012. In the company’s fiscal 2011, higher average selling prices increased segment sales. Also, strong international demand drove exports in the wake of a weak dollar. In fiscal 2010, the segment’s sales decreased in line with falling commodity prices. In fiscal 2009, segment revenue declined again due principally to lower sales volumes of grain. Other sales decreased due to the sale of the company’s malting business during the first quarter of fiscal 2009 and lower average selling prices of wheat flour.
�Major�CompaniesArcher�Daniels�Midland�Company�� |�� Cargill�Inc.�� |�� Mars�Inc.Nestle�SA�� |�� The�Procter�&�Gamble�Company�� |�� Other�Companies
Archer�Daniels�Midland�Company�43.2%
Cargill�Inc.�21.0%
Mars�Inc.�11.6%
Nestle�SA�10.6%
The�Procter�&�Gamble�Company�7.9%SOURCE: WWW.IBISWORLD.COM
Major�players(Market share)
ADM�(US�agricultural�services)�–�fi�nancial�performance
Year*Revenue�
($ million) (% change)Operating�Income�
($ million) (% change)
2006-07 8,683.1 -0.4 164.0 39.6
2007-08 14,491.4 66.9 374.9 128.6
2008-09 13,970.5 -3.6 363.2 -3.1
2009-10 11,605.7 -16.9 254.5 -29.9
2010-11 16,457.6 41.8 357.0 40.3
2011-12** 17,000.5 3.3 361.5 1.3
*Year-end�June�30,�**EstimateSOURCE: ANNUAL REPORT AND IBISWORLD
Archer�Daniels�Midland�Company���Market share: 43.2% Industry�Brand�NamesADM Alliance Nutrition Grostrong Natural Glo Proud Paws
5.7%Other

WWW.IBISWORLD.COM� Animal�Food�Production�in�the�US October 2011 27
Major�Companies
Player�Performance Founded in Iowa in 1865, Cargill earns an astounding $119.5 billion in total annual revenue. The company is a global provider of food, agricultural and risk-management products and services. Cargill employs more than 130,000 people across 63 countries to process and distribute grain, oilseeds and other commodities to manufacturers of food and animal products. Cargill is organized into five segments and competes in the Animal Food Production industry through its animal nutrition division, which is a subset of agricultural services. As a private company, specific financial data are unavailable.
Cargill animal nutrition is the world’s largest feed company and provides nutrition products for dairy, poultry, aquaculture, horses and other animals. Some of its flagship brands include Nutrena, Acco Feeds, Promote and Cargill Animal Nutrition. The company has been aggressively pursuing an expansion strategy with a number of mergers and acquisitions completed in
the past decade. In 2011, Cargill spent more than $3.0 billion on acquisitions, including Calgary-based Agrium’s commodity-management business. In 2007, Cargill acquired LNB International Feed (an animal-nutrition company based in Europe) and Arkansas-based Mountaire Feeds.
During the five years to the company’s fiscal 2012, IBISWorld expects Cargill’s industry-relevant revenue to grow at a marginal rate of 0.1% per year and total an estimated $8.3 billion. At the same time, the company’s relevant earnings before taxes and interest are expected to grow at an annualized rate of 7.0% to total an estimated $342.5 million. Expansion into emerging economies around the world has diverted resources from Cargill’s US animal feed operations and are expected to keep revenue virtually flat. Meanwhile, increased process efficiencies and alternative grain sources have offset rising corn prices and allowed animal nutrition to become more profitable.
Cargill�Inc.�(animal�nutrition�segment)�–�fi�nancial�performance
Year*Revenue�
($ million) (% change)EBIT�
($ million) (% change)
2006-07 8,207.1 -0.4 244.1 29.0
2007-08 8,341.5 1.6 310.1 27.0
2008-09 8,576.7 2.8 277.2 -10.6
2009-10 8,868.3 3.4 237.8 -14.2
2010-11 8,835.1 -0.4 346.0 45.5
2011-12** 8,261.6 -6.5 342.5 -1.0
*Year-end�May�31,�**EstimateSOURCE: ANNUAL REPORT AND IBISWORLD
Cargill�Inc.��Market share: 21.0% Industry�Brand�NamesCargill Animal Nutrition Nutrena Acco Feeds Promote

WWW.IBISWORLD.COM� Animal�Food�Production�in�the�US October 2011 28
Major�Companies
Player�Performance Founded in 1922 with the idea of producing a portable version of chocolate malted milk while selling homemade butter cream candies, Mars Inc. has grown into a global food, pet-care and beverage-manufacturing leader. With over 65,000 employees worldwide, the company now services more than 100 countries and owns some of the most iconic brands in the food industry, such as M&M’s, Skittles and Snickers. Overall annual revenue for the company totals more than $30.0 billion.
Mars Inc. operates in the Animal Food Production industry through its Mars Petcare US Inc. segment. Mars Petcare is one of the world’s largest providers of pet food and has 29 US pet-food manufacturing facilities. According to the company’s web site, pet-food brands Pedigree, Whiskas and Royal Canin each command $1.0 billion in annual sales.
Although the company is privately owned and does not release financial results, the company’s web site claims
Mars Inc. to be worth $30.0 billion as of June 2011. IBISWorld estimates about $4.6 billion of that figure to stem from industry-related sales of pet food to dog and cat owners in the United States. At the same time, the company is expected to realize profit of about $460 million from such operations in 2011. The company’s 2011 revenue represents an estimated average annual growth rate of 9.4% over the five years to date.
In 2007, Mars Petcare purchased Nutro Products Inc., a premium dog- and cat-food manufacturer. In 2006, the company acquired the Doane Pet Care Company, a private-label dry pet-food manufacturer, along with S&M Nu Tec, a producer of dog treats. Also, Mars Inc. acquired pet-treat manufacturer Greenies in April 2006. The acquisition expanded and diversified the pet care segment’s US portfolio. During 2006, product introductions in the dog and cat food market helped boost overall company revenue to $21.0 billion.
Mars�Inc.�(Mars�Petcare)�–�fi�nancial�performance
YearRevenue�($ billion) (% change)
EBIT�($ million) (% change)
2006 2.93 16.7 293 -1.2
2007 3.15 7.5 315 7.5
2008 3.38 7.3 338 7.3
2009 3.93 16.3 393 16.3
2010 4.23 7.6 423 7.6
2011* 4.64 9.7 460 8.7
*EstimateSOURCE: IBISWORLD
Mars�Inc.��Market share: 11.6% Industry�Brand�NamesMars Petcare Pedigree Cesar Whiskas Sheba Kitekat Trill Aquarian Winergy

WWW.IBISWORLD.COM� Animal�Food�Production�in�the�US October 2011 29
Major�Companies
Player�Performance With total revenue of about $120.0 billion, Nestle SA is a Swiss-based multinational company and the world’s largest food producer. The company manufactures chocolate, confectionery, beverage, diary and pet food products that are sold in more than 61 countries with the help of about 281,000 employees. Nestle operates in the Animal Food Production industry through its pet care segment, which includes pet foods branded under the Nestle Purina label.
Based in St. Louis, Nestle Purina PetCare Company, a wholly owned subsidiary of Nestle SA, manufactures food items for cats and dogs. Started more than 75 years ago, the company offers a selection of behavior articles for cats and kittens. It offers stuffed morsels in beef, ocean fish and turkey flavors.
Nestle Purina PetCare also provides flavored fish. In 2001, Nestle SA acquired Ralston Purina Company. The resulting company, Nestle Purina PetCare Company, is private.
During the five years to 2011, IBISWorld estimates segment revenue to grow at an average annual rate of 6.2% and total $4.2 billion. The wide variety of pet-food products that the company markets worldwide through various wholly owned subsidiaries helps keep segment margins relatively stable from year to year. The company acquired the Waggin’ Train dog snacks business in 2010. It also received the Malcolm Baldrige National Quality Award from the Obama administration, becoming the first-ever pet-food manufacturer to win the award. In 2009, segment sales posted about $3.4 billion.
Nestle�SA��Market share: 10.6% Industry�Brand�NamesPurina Alpo Beneful Purina Cat Chow Friskies Fancy Feast Kit ‘N Kaboodle Busy Bone
Nestle�SA�(US�pet�care-segment)�–�fi�nancial�performance
YearRevenue�
($ million) (% change)EBIT�
($ million) (% change)
2006 3,091 N/C 1.97 N/C
2007 3,552 14.9 1.78 -9.6
2008 2,769 -22.0 2.12 19.1
2009 3,350 21.0 2.34 10.4
2010 3,421 2.1 2.58 10.3
2011* 4,166 21.8 3.27 26.7
*EstimateSOURCE: ANNUAL REPORT AND IBISWORLD

WWW.IBISWORLD.COM� Animal�Food�Production�in�the�US October 2011 30
Major�Companies
Player�Performance Procter & Gamble (P&G) rounds out the roster of multinational corporations that form this industry’s major companies. Although primarily involved in the manufacture of beauty, grooming, health and household products, P&G competes in the Animal Food Production industry through the US operations of its snacks and pet care global business unit (GBU). Formerly known as snacks, coffee and pet care, the division includes Iams- and Eukanuba-branded dog and cat foods that command about 7.6% of the total US market share. Iams has been around for more than 60 years, and Eukanuba has been around for more than 40. In that time, each has established their brands as leaders in pet foods designed for key characteristics of dogs and cats: breed, age and nutritional requirements. P&G earns total annual revenue of $78.9 billion, employs about 127,000 people and operates in 80 countries.
Lately, the company has been using social media to market its products. In 2011, the company launched its 28-Day Challenge, a marketing strategy in which consumers were asked to use Facebook to document changes in their dogs after feeding them Eukanuba dog food for 28 days. Despite such efforts, IBISWorld estimates PG is losing its grip on this
particular branch of its business, and revenue is expected to fall at an average annual rate of 7.3% and total $3.0 billion during the five years to 2011.
Some speculation surrounds P&G’s future intentions with its pet food operations. Earlier this year, P&G sold off the remaining food item (Pringles) in its snack and pet food GBU. In 2008, P&G completed divestiture of its assets in the Folgers coffee company. The removal of these brands from the company’s portfolio alleviates much of P&G’s dependence on goods related to agriculture, namely food stuffs, and thereby eliminates some of the volatility that can come with businesses that depend on unpredictable factors like weather. Given that Iams and Eukanuba account for a relatively marginal (about 3.0%) share of P&G’s total annual revenue, the company could benefit from focusing on larger product segments more in line with the majority of the goods it sells.
In 2010, the pet care segment was up thanks to product initiatives, increased online marketing and merchandising initiatives, according to P&G’s annual report. A voluntary recall of some wet pet foods led to a 1.0% drop in the company’s US market share in 2007. Combined with strong competition, segment revenue dropped nearly 32.0% for the year.
The�Procter�&�Gamble�Company�(global�pet�food�and�snacks)�–�fi�nancial performance
Year*Revenue�
($ million) (% change)EBIT�
($ million) (% change)
2006-07 3,000 -31.8 381.2 -39.2
2007-08 3,200 6.7 409.1 7.3
2008-09 3,100 -3.1 388.7 -5.0
2009-10 3,150 1.6 499.3 28.5
2010-11 3,000 -4.8 420.4 -15.8
2011-2012** 3,100 3.3 446.5 6.2
*Year-end�June�30,�**EstimateSOURCE: ANNUAL REPORT AND IBISWORLD
The�Procter�&�Gamble�Company��Market share: 7.9% Industry�Brand�NamesIams Eukanuba

WWW.IBISWORLD.COM� Animal�Food�Production�in�the�US October 2011 31
Major�Companies
Other�Companies Hill’s Pet Nutrition Inc.Estimated market share: 2.6%Worldwide dog- and cat-food manufacturer Hill’s Pet Nutrition operates in 95 countries under Coalgate-Palmolive’s pet nutrition segment. Hill’s pet products, including Hill’s Science Diet and Hill’s Prescription Diet, are sold through veterinary offices and specialty stores. As such, the company caters to vets and pet owners who purchase in the premium pet-food market, and the company’s annual report indicates success with new US products like Science Diet Small and Toy Breed Canine and Science Diet Weight Loss System. The company is expected to grow at an average annual rate of 3.6% during the five years to 2011, with revenue totaling an estimated $1.06 billion.
Westway Group Inc.Estimated market share: Less than 1.0%With interests stretching from North America to Australia, Westway operates in the Animal Food Production industry through its primary activity of producing liquid feed supplements. The company touts the ability of its products to increase the efficiencies of an animal’s
natural genetic make-up through blends of concentrated vitamins, protein and minerals. Horses, beef cattle and dairy cattle form the major markets for such supplements. The company’s liquid feed supplement segment earned about $254 million in 2010 net revenue, up from about $155 million in 2009. IBISWorld estimates Westway’s ongoing research and development efforts will increase revenue to about $290 million in 2011.
Farmers Feed Mill Inc.Estimated market share: Less than 1.0%Farmers Feed Mill, the manufacturer of Hallway Feeds, is a specialty equine-feed manufacturer based in Lexington, KY. Apart from servicing the equine industry, Hallway also produces feed products for cattle, sheep, swine, llama, shrimp and other animals. During the 1990s, the company introduced a new range of equine performance products called Hallway Racing Products, which is now internationally recognized as the premium feed for racehorses. As Hallway is a private, family-owned business, official financial data are unavailable; however, IBISWorld estimates about $6.5 million in total company sales for 2011.

WWW.IBISWORLD.COM� Animal�Food�Production�in�the�US October 2011 32
Capital�Intensity Players operating within the industry require a high level of capital investment, as measured by the capital to labor ratio. IBISWorld estimates producers require about $1.80 worth of labor for every $1 worth of capital invested. High intensity has resulted from a greater need for automation and mechanization in the production process, which has increased capital requirements.
All of the industry’s major players reflect the trend of increasing intensity, as each have undertaken a significant amount of capital expenditures in the past five years. For example, ADM spent $1.8 billion in 2008 on capital expenditures relating to the purchase and modernization of plant and equipment.
It is also important to note that capital intensity varies considerably with manufacturer size. Small- to medium-
�Operating�ConditionsCapital�Intensity�� |�� Technology�&�Systems�� |�� Revenue�VolatilityRegulation�&�Policy�� |�� Industry�Assistance
Tools�of�the�Trade:�Growth�Strategies�for�Success
SOURCE: WWW.IBISWORLD.COM
Labo
r�Int
ensi
veCapital�Intensive
Change�in�Share�of�the�Economy
New�Age�Economy
Recreation,�Personal�Services,�Health�and�Education. Firms benefi t from personal wealth so stable macroeconomic conditions are imperative. Brand awareness and niche labor skills are key to product differentiation.
Traditional�Service�Economy
Wholesale�and Retail. Reliant on labor rather than capital to sell goods. Functions cannot be outsourced therefore fi rms must use new technology or improve staff training to increase revenue growth.
Old�Economy
Agriculture�and�Manufacturing.�Traded goods can be produced using cheap labor abroad. To expand fi rms must merge or acquire others to exploit economies of scale, or specialize in niche, high-value products.
Investment�Economy
Information,�Communications,�Mining,�Finance�and�Real�Estate.�To increase revenue fi rms need superior debt management, a stable macroeconomic environment and a sound investment plan.
Beef�Cattle�Production
Flour�Milling
Dairy�FarmsCorn,�Wheat�&�Soybean�Wholesaling
Hog�&�Pig�Farming
Animal�Food�Production
Capital intensity
1.0
0.0
0.2
0.4
0.6
0.8
SOURCE: WWW.IBISWORLD.COMDotted line shows a high level of capital intensity
Capital units per labor unit
Animal Food Production
ManufacturingEconomy
Level��The level of capital intensity is High

WWW.IBISWORLD.COM� Animal�Food�Production�in�the�US October 2011 33
Operating�Conditions
Technology&�Systems
The Animal Food Production industry has adopted new technologies and processes to effectively compete in the global market. Research and development is primarily undertaken by individual producers and the Center for Feed Industry Research & Education within Texas Tech University’s Department of Animal Science and Food Technology. Some of the major developments include the adoption of stringent testing procedures used to assess and enhance the quality of ingredients used in the manufacturing process. There has also been an increasing use of agricultural data software to maximize nutrition levels by altering product formulations, especially for beef, dairy and swine products.
SustainabilityEnvironmental waste and discharge have become an area of increasing focus. Given the copious amounts of water the industry consumes, research efforts have sought to reduce, reuse and treat wastewater through advanced practices and improved packaging. For example, recent packaging changes at Tyson Foods have included the use of plastic liners within corrugated boxes, use of high density polyethylene plastic totes, and the substitution of foam food-packaging containers with those that are free from chlorofluorocarbons.
Safety initiativesWith respect to the manufacturing process, developments in process piping and agitator seals have ensured long periods of continuous, contamination-free production. Safety initiatives such as preventive maintenance ensure the
operational reliability of machinery and equipment by providing for inspection, detection and correction of incipient failures either before they occur or before they develop into major defects. The adoption of best practices technology and quality assurance programs such as hazard analysis-critical control point, which is the leading preventative approach to food safety, has further helped the industry maintain its reputation and credibility.
Recent spates of food disease and contamination have given rise to processes such as food irradiation, which is the process of exposing food to small doses of ionizing radiation in order to destroy harmful bacteria, viruses and other microorganisms. Further applications include sprout inhibition, delay of ripening and increase of juice yield that improve the overall shelf lives of perishable agricultural products; however, the public continues to be wary of such technologies, as there is still a lack of consensus on definitive enforcement, packaging and labeling of irradiated foods.
Computerized dataThe United States Department of Agriculture’s National Animal Feed Information System, widely available at several regional laboratories, is used to obtain information on bio-availability of different animal species and the optimum feed ingredient use for different regions across the United States. Other developments have also occurred in the area of new feed ingredients for ruminant diets, probiotics, chromium and the nutritional value of corn hybrids.
Capital�Intensitycontinued
sized facilities will have a higher capital-to-labor ratio because they lack the resources to invest in expensive
technology and equipment. Consequently, they must employ additional labor to increase production volumes.
Level��The level of Technology Change is High

WWW.IBISWORLD.COM� Animal�Food�Production�in�the�US October 2011 34
Operating�Conditions
Revenue�Volatility Industry volatility is a function of fluctuations in the cost of raw materials, energy and oil prices, household incomes and changes in downstream demand. In 2011, IBISWorld estimates a high level of volatility typifies the Animal Food Production industry.
First, the supply and prices of most key inputs to animal food such as corn, wheat, oilseeds, soybeans and feed grains have been volatile during the past five years. In fact, IBISWorld analyses have revealed very high volatilities for each of those industries. The very high level stems from the potential for and unpredictable nature of adverse weather conditions such as droughts, hurricanes and floods. Meanwhile, energy and oil prices depend on the relationship of supply to demand, and prices can rise and fall rapidly as speculation drives investment motions to either buy or sell. As a result, the energy and oil factor of this industry’s production chain also exhibits high volatility.
Next, most industry demand comes from various livestock industries. Like crop production, livestock industries can be highly unpredictable because they depend on uncontrollable factors such as climate change and disease outbreaks. Also, the viability of livestock operations depends partially on movements in the same crop inputs that flow through to animal-food production.
Last, changes in household discretionary income can impact pet ownership and, subsequently, demand for pet foods. In contrast to crop and energy volatility, disposable incomes have exhibited relatively low volatility during the past five years, hitting a five-year low of $32,271 in 2006 and a five-year high of $33,025 in 2010. Per capita disposable income has exhibited average movements of only 1.0% in either direction during the five years to 2011.
SOURCE: WWW.IBISWORLD.COM
Volatility�vs�Growth
Reve
nue�
vola
tility
*�(%
)
1000
100
10
1
0.1
Five�year�annualized�revenue�growth�(%)–30 –10 10 30 50 70
Hazardous
Stagnant
Rollercoaster
Blue�Chip
* Axis is in logarithmic scale
Animal�Food�Production
A higher level of revenue volatility implies greater industry risk. Volatility can negatively affect long-term strategic decisions, such as the time frame for capital investment.
When a fi rm makes poor investment decisions it may face underutilized capacity if demand suddenly falls, or capacity constraints if it rises quickly.
Level��The level of Volatility is High

WWW.IBISWORLD.COM� Animal�Food�Production�in�the�US October 2011 35
Operating�Conditions
Regulation�&�Policy The US government and consumers are demanding more stringent rules relating to manufacturers’ food labeling, advertising, packaging and other nutritional claims. Failure to abide by them can seriously impair a producer’s credibility, result in expensive product recalls, and open liability to civil or criminal penalties. Pending enforcement of new Food and Drug Administration (FDA) regulations has created new opportunities for food manufacturers to differentiate themselves from the competition. Those who can respond proactively rather than reactively to safety requirements can eclipse the competition in terms of efficiency, quality and brand integrity.
Public health and product labelingOverall, the FDA governs US food production. The FDA’s mission is to promote and protect public health by helping safe and effective products reach the market in a timely way and monitoring products for continued safety after they are in use. With regard to the Animal Food Production industry, the FDA’s Food, Drug, and Cosmetic Act (FD&C Act) and the Fair Packaging and Labeling Act mandate standards for production and labeling.
The Nutrition Labeling and Education Act, which amended the FD&C Act, requires most foods to bear nutrition labeling and requires labels that bear nutrient-content claims and certain health messages to comply with specific requirements. It is the manufacturer’s responsibility to remain current with the legal requirements for food labeling. Further, the FDA has also instituted the Food Ingredient Safety Program that governs and evaluates claims about ingredients, nutritional content and other such statements food producers make. This is particularly relevant for foods that have been irradiated or use genetically modified ingredients.
Environmental regulationThe Environmental Protection Agency (EPA) and state governments enforce environmental standards pertaining to food processing. Federal environmental regulations and statutes, such as the Clean Water Act (CWA), Clean Air Act, Pollution Prevention Act (PPA), and Resource Conservation and Recovery Act (RCRA), have changed the way processing facilities handle their products and dispose of their waste. The CWA’s increasingly rigorous regulations for discharging wastewater are the primary regulatory drivers for the food processing industry. RCRA regulations typically apply only to solid waste disposal issues.
Most federal and state regulations and statutes are typically met with resistance from private operators; however, the federal pollution-prevention principles and the subsequent development of clean technologies have been viewed as ways to provide cost savings and improve product quality. Further, adherence to these regulations can improve public sentiment toward companies or industries that aggressively pursue their implementation. Pollution prevention has also proven to be an effective means of reducing compliance and treatment costs for food manufacturers.
Pollution preventionPollution prevention and clean technologies are meant to reduce waste in air, water and on land. Solid waste and wastewater discharges tend to spark pollution-prevention advances. Unless located in remote areas, most food-processing facilities pre-treat and discharge wastewater directly to a publicly owned treatment plant. When a facility discharges any waste into the environment, the CWA mandates it to have a National Pollutant Discharge Elimination System permit.
Because the PPA lacks the regulatory power needed to force companies to
Level�&�Trend��The level of Regulation is Heavy and the trend is Steady

WWW.IBISWORLD.COM� Animal�Food�Production�in�the�US October 2011 36
Operating�Conditions
Regulation�&�Policycontinued
implement prevention practices into their production processes, the EPA is looking to promote voluntary pollution prevention. Environmental agencies are exploring ways to write more flexible permits that allow companies to make process changes without having to be subjected to lengthy bureaucratic formalities. Agencies also are encouraging pollution prevention by reducing the cost of a permit and extending the compliance schedules for companies that are proactive in their commitment.
USDA and SSOPsThe United States Department of Agriculture (USDA) enforces strict standards and guidelines that govern the quality and safety of all vegetables, meat, poultry and eggs manufactured in the country. The USDA’s Food Safety and Inspection Service has issued legislation that mandates food-processing facilities to develop a written set of sanitation standard-operating procedures (SSOPs) that ensures pre-operational sanitary conditions are satisfied. The USDA subsequently inspects the SSOPs.
Industry�Assistance IBISWorld analysis reveals that assistance to the Animal Food Production industry is light and steady. According to the US International Trade Commission, “products chiefly used as food for animals or as ingredients in such food” lack specific
import duties; however, the raw ingredients (e.g. bran, oilcake and vegetable materials) used to make such products do incur a number of tariffs. These measures allow local producers to compete in markets where imports would otherwise be cheaper.
Level�&�Trend��The level of Industry Assistance is Low and the trend is Steady

WWW.IBISWORLD.COM� Animal�Food�Production�in�the�US October 2011 37
�Key�StatisticsRevenue�
($m)
Industry�Value�Added�
($m)Establish-
ments� Enterprises� Employment�Exports�
($m)Imports�
($m)Wages�($m)
Domestic�Demand
Production�Volume�(Tons)
2002 28,041.2 10,567.5 2,787 2,161 47,990 1,339.0 407.4 1,759.2 27,109.6 171.82003 33,854.7 12,418.0 2,859 2,291 48,392 1,342.3 393.3 1,831.7 32,905.7 172.62004 31,987.2 12,559.7 2,894 2,321 50,141 1,333.1 407.1 1,735.9 31,061.2 174.52005 31,662.1 13,025.9 2,843 2,266 48,741 1,530.2 450.2 1,697.4 30,582.1 174.82006 33,304.7 13,985.8 2,941 2,366 49,317 1,745.3 575.5 1,833.1 32,134.9 175.12007 38,683.9 13,873.0 3,174 2,635 48,390 1,946.0 6770 1,957.7 37,414.9 181.52008 47,935.5 16,399.8 2,994 2,422 49,813 2,229.2 751.2 2,007.4 46,457.5 182.62009 38,305.8 15,579.4 3,045 2,442 49,896 2,173.0 757.4 2,020.5 36,890.2 184.82010 39,473.0 16,165.2 3,068 2,471 49,982 2,361.4 896.0 2,036.5 38,007.6 187.02011 39,341.0 16,028.7 3,109 2,487 50,957 2,385.7 883.1 2,063.4 37,838.4 189.32012 40,408.5 16,322.7 3,113 2,490 50,416 2,498.6 942.1 2,051.3 38,852.0 191.52013 38,463.9 16,815.0 3,143 2,610 51,571 2,651.0 1,025.5 2,086.7 36,838.4 193.82014 39,596.1 17,320.8 3,161 2,624 51,702 2,755.8 1,125.4 2,094.0 37,965.7 195.12015 44,350.0 16,985.2 3,179 2,580 50,850 2,890.5 1,210.2 2,110.0 42,669.7 196.42016 45,415.3 18,033.9 3,200 2,656 52,990 2,991.8 1,291.5 2,119.2 43,715.0 198.0Sector�Rank 30/195 20/195 28/195 31/195 75/195 78/182 138/182 86/195 39/182 N/AEconomy�Rank 202/706 157/706 407/705 392/705 431/706 99/230 159/229 425/706 48/229 N/A
IVA/Revenue�(%)
Imports/Demand�
(%)Exports/Revenue�
(%)
Revenue�per�Employee�
($’000)Wages/Revenue�
(%)Employees�
per�Est.Average�Wage�
($)
Share�of�the�Economy�
(%)2002 37.69 1.50 4.78 584.31 6.27 17.22 36,657.64 0.092003 36.68 1.20 3.96 699.59 5.41 16.93 37,851.30 0.102004 39.26 1.31 4.17 637.94 5.43 17.33 34,620.37 0.102005 41.14 1.47 4.83 649.60 5.36 17.14 34,824.89 0.102006 41.99 1.79 5.24 675.32 5.50 16.77 37,169.74 0.112007 35.86 1.81 5.03 799.42 5.06 15.25 40,456.71 0.112008 34.21 1.62 4.65 962.31 4.19 16.64 40,298.72 0.122009 40.67 2.05 5.67 767.71 5.27 16.39 40,494.23 0.122010 40.95 2.36 5.98 789.74 5.16 16.29 40,744.67 0.122011 40.74 2.33 6.06 772.04 5.24 16.39 40,492.96 0.122012 40.39 2.42 6.18 801.50 5.08 16.20 40,687.48 0.122013 43.72 2.78 6.89 745.84 5.43 16.41 40,462.66 0.122014 43.74 2.96 6.96 765.85 5.29 16.36 40,501.33 0.122015 38.30 2.84 6.52 872.17 4.76 16.00 41,494.59 0.112016 39.71 2.95 6.59 857.05 4.67 16.56 39,992.45 0.12Sector�Rank 60/195 165/182 137/182 29/195 182/195 180/195 158/195 20/195Economy�Rank 291/706 198/229 171/230 97/706 647/706 326/705 418/706 157/706
Figures are inflation-adjusted 2011 dollars. Rank refers to 2011 data.
Revenue�(%)
Industry�Value�Added�
(%)
Establish-ments�
(%)Enterprises�
(%)Employment�
(%)Exports�
(%)Imports�
(%)Wages�
(%)
Domestic�Demand�
(%)
Production�Volume�
(%)2003 20.7 17.5 2.6 6.0 0.8 0.2 -3.5 4.1 21.4 0.52004 -5.5 1.1 1.2 1.3 3.6 -0.7 3.5 -5.2 -5.6 1.12005 -1.0 3.7 -1.8 -2.4 -2.8 14.8 10.6 -2.2 -1.5 0.22006 5.2 7.4 3.4 4.4 1.2 14.1 27.8 8.0 5.1 0.22007 16.2 -0.8 7.9 11.4 -1.9 11.5 17.6 6.8 16.4 3.72008 23.9 18.2 -5.7 -8.1 2.9 14.6 11.0 2.5 24.2 0.62009 -20.1 -5.0 1.7 0.8 0.2 -2.5 0.8 0.7 -20.6 1.22010 3.0 3.8 0.8 1.2 0.2 8.7 18.3 0.8 3.0 1.22011 -0.3 -0.8 1.3 0.6 2.0 1.0 -1.4 1.3 -0.4 1.22012 2.7 1.8 0.1 0.1 -1.1 4.7 6.7 -0.6 2.7 1.22013 -4.8 3.0 1.0 4.8 2.3 6.1 8.9 1.7 -5.2 1.22014 2.9 3.0 0.6 0.5 0.3 4.0 9.7 0.3 3.1 0.72015 12.0 -1.9 0.6 -1.7 -1.6 4.9 7.5 0.8 12.4 0.72016 2.4 6.2 0.7 2.9 4.2 3.5 6.7 0.4 2.4 0.8Sector�Rank 163/195 166/195 47/195 54/195 54/195 138/182 159/182 102/195 155/182 N/AEconomy�Rank 621/706 622/706 216/705 279/705 193/706 179/230 199/229 410/706 193/229 N/A
Annual�Change
Key�Ratios
Industry�Data
SOURCE: WWW.IBISWORLD.COM

WWW.IBISWORLD.COM� Animal�Food�Production�in�the�US October 2011 38
Jargon�&�Glossary
BARRIERS�TO�ENTRY Barriers to entry can be High, Medium or Low. High means new companies struggle to enter an industry, while Low means it is easy for a firm to enter an industry.
CAPITAL/LABOR�INTENSITY An indicator of how much capital is used in production as opposed to labor. Level is stated as High, Medium or Low. High is a ratio of less than $3 of wage costs for every $1 of depreciation; Medium is $3 – $8 of wage costs to $1 of depreciation; Low is greater than $8 of wage costs for every $1 of depreciation.
CONSTANT�PRICES The dollar figures in the Key Statistics table, including forecasts, are adjusted for inflation using 2011 as the base year. This removes the impact of changes in the purchasing power of the dollar, leaving only the ‘real’ growth or decline in industry metrics. The inflation adjustments in IBISWorld’s reports are made using the US Bureau of Economic Analysis’ implicit GDP price deflator.
DOMESTIC�DEMAND The use of goods and services within the US; the sum of imports and domestic production minus exports.
EARNINGS�BEFORE�INTEREST�AND�TAX�(EBIT) IBISWorld uses EBIT as an indicator of a company’s profitability. It is calculated as revenue minus expenses, excluding tax and interest.
EMPLOYMENT The number of working proprietors, partners, permanent, part-time, temporary and casual employees, and managerial and executive employees.
ENTERPRISE A division that is separately managed and keeps management accounts. The most relevant measure of the number of firms in an industry.
ESTABLISHMENT The smallest type of accounting unit within an Enterprise; usually consists of one or more locations in a state or territory of the country in which it operates.
EXPORTS The total sales and transfers of goods produced by an industry that are exported.
IMPORTS The value of goods and services imported with the amount payable to non-residents.
INDUSTRY�CONCENTRATION IBISWorld bases concentration on the top four firms. Concentration is identified as High, Medium or Low. High means the top four players account for over 70% of revenue; Medium is 40 –70% of revenue; Low is less than 40%.
INDUSTRY�REVENUE The total sales revenue of the industry, including sales (exclusive of excise and sales tax) of goods and services; plus transfers to other firms of the same business; plus subsidies on production; plus all other operating income from outside the firm (such as commission income, repair and service income, and rent, leasing and hiring income); plus capital work done by rental or lease. Receipts from interest royalties, dividends and the sale of fixed tangible assets are excluded.
INDUSTRY�VALUE�ADDED The market value of goods and services produced by an industry minus the cost of goods and services used in the production process, which leaves the gross product of the industry (also called its Value Added).
INTERNATIONAL�TRADE The level is determined by: Exports/Revenue: Low is 0 –5%; Medium is 5 –20%; High is over 20%. Imports/Domestic Demand: Low is 0 –5%; Medium is 5 –35%; and High is over 35%.
LIFE�CYCLE All industries go through periods of Growth, Maturity and Decline. An average life cycle lasts 70 years. Maturity is the longest stage at 40 years with Growth and Decline at 15 years each.
NON-EMPLOYING�ESTABLISHMENT Businesses with no paid employment and payroll are known as non-employing establishments. These are mostly set-up by self employed individuals.
VOLATILITY The level of volatility is determined by the percentage change in revenue over the past five years. Volatility levels: Very High is greater than ±20%; High Volatility is between ±10% and ±20%; Moderate Volatility is between ±3% and ±10%; and Low Volatility is less than ±3%.
WAGES The gross total wages and salaries of all employees of the establishment.
Industry�Jargon
IBISWorld�Glossary
ETHANOL A form of alcohol used as a fuel that is made primarily from grains such as corn and soybeans. It is considered to be a renewable fuel with fewer pollutants than petrol.
FEEDLOT An animal feeding operation used for finishing livestock, notably beef cattle, prior to slaughter.
PROBIOTIC A live microorganism thought to be healthy for the host organism.

Disclaimer
This product has been supplied by IBISWorld Inc. (‘IBISWorld’) solely for use by its authorized licenses strictly in accordance with their license agreements with IBISWorld. IBISWorld makes no representation to any other person with regard to the completeness or accuracy of the data or information contained herein, and it accepts no responsibility and disclaims all liability (save for liability which cannot be lawfully disclaimed) for loss or damage whatsoever suffered or incurred by any other person resulting from the use
of, or reliance upon, the data or information contained herein. Copyright in this publication is owned by IBISWorld Inc. The publication is sold on the basis that the purchaser agrees not to copy the material contained within it for other than the purchasers own purposes. In the event that the purchaser uses or quotes from the material in this publication – in papers, reports, or opinions prepared for any other person – it is agreed that it will be sourced to: IBISWorld Inc.
At IBISWorld we know that industry intelligence is more than assembling factsIt is combining data with analysis to answer the questions that successful businesses askIdentify�high�growth,�emerging�&�shrinking�marketsArm�yourself�with�the�latest�industry�intelligenceAssess�competitive�threats�from�existing�&�new�entrantsBenchmark�your�performance�against�the�competitionMake�speedy�market-ready,�profit-maximizing�decisions
Who�is�IBISWorld?We are strategists, analysts, researchers, and marketers. We provide answers to information-hungry, time-poor businesses. Our goal is to provide real world answers that matter to your business in our 700 US industry reports. When tough strategic, budget, sales and marketing decisions need to be made, our suite of Industry and Risk intelligence products give you deeply-researched answers quickly.
IBISWorld�MembershipIBISWorld offers tailored membership packages to meet your needs.
Copyright 2011 IBISWorld Inc
www.ibisworld.com��|��1800-330-3772��| ��[email protected]