Embed Size (px)
Citation preview
REPORT DOCUMENTATION PAGE Form Approved
OMS No. 0704-0'S8
_ " „„„,„. M .n-cr-.it.-r •» *»tir%»5-e :c .*«•-.•;* : »Jur =<" '«»«r«. .neu... - t. *J", *'° ,_,r. -r-üburaen «timjtc or any other asDecl 0* mi
1. AGENCY USE ONLY (Leave fc.'o J-,-^1 2 REPORT DATE 3. REPORT TYPE AND DATES COVERED
.. TITLE AND SUBTITLE , . , , /^tNOlV,- 4^ Tob-Or der rco^rüc^Dn <Po*n4 .£ »cc^on . fl^C^l^i^,
5. FUNDING NUMBERS
6. AUTHOR(S)
f < UnfxfcT "PERFORMING ORGANIZATION NAME(S) AND ADDRESS(ES)
AFIT Students Attending:
■ ' . ,-f-n/-./ M»KJIC/C\ awn AnnRES
8. PERFORMING ORGANIZATION REPORT NUMBER
AFIT/CI/CIA
u
9. SPONSORING/MONITORING AGENCY NAME(S) AND ADDRESS(ES)
DEPRTMENT OF THE AIR FORCE • AFIT/CI 2950' P STREET WRIGHT-PATTERSON AFB OH 45433-7765
10 SPONSORING /MONITORING AGENCY REPORT NUMBER
11. SUPPLEMENTARY NOTES
72a. DISTRIBUTION/AVAILABILITY STATEMENT
Approved for Public Release IÄW 190-1 Distribution Unlimited MICHAEL M. BRICKER, SMSgt, USAF Chief Administration
12b. DISTRIBUTION CODE
13. ABSTRACT (Maximum 200 words)
«IB M7
14. SUBJECT TERMS
17. SECURITY CLASSIFICATION OF REPORT
16. SECURITY CLASSIFICATION OF THIS PAGE
19. SECURITY CLASSIFICATION OF ABSTRACT
15. NUMBER OF PAGES
16. PRICE CODE
20. LIMITATION OF ABSTRACT

JOB-ORDER CONSTRUCTION QUANTIFICATION:
AN APPLICATION OF FUZZY THINKING
by
C. S. Hoover
l .\ooes
k
A Thesis Presented in Partial Fulfillment of the Requirements for the Degree
Master of Science
M
ARIZONA STATE UNIVERSITY
December 1994
UM J I

JOB-ORDER CONSTRUCTION QUANTIFICATION:
AN APPLICATION OF FUZZY THINKING
by
C.S. Hoover
has been approved
November 1994
APPROVED:
.Chairperson
ervisory Committee
APPROVED:
c
WC&? Department Chairperson

ABSTRACT
In recent times the manufacturing industry has faced the reality of global
competition by adopting several concepts. Total Quality Management-largely Edwards
Demming's 14 Points of Continuous Improvement-has become one of the core ideas.
Differentiation and value chain analysis as defined and demonstrated in Michael Porter's
book Competitive Advantage, is another. However, these ideas have met limited success
in the construction industry. Facility managers in the civilian arena and base engineers
in the military do not have the necessary tools to optimize facility system performance.
This is the result of several influencing factors: the instability of the construction
industry (as defined by Kashiwagi), the emphasis on sales by marketing, the lack of
actual performance data, the existing procurement system structure, and the inability to
competitively evaluate potential alternatives.
The Performance-Based Evaluation and Procurement system, as developed by
Kashiwagi uses "off the shelf" software and the management of information to address
the competitive shortfalls of the construction industry. It promotes perfect competition
(meeting the requirements of the Federal Acquisition Regulation), while maximizing
system performance. It assesses the "value added" worth of new technology and quality
work. This is measured by customer satisfaction - not by minimally meeting
specifications. The process involves: the definition of performance criteria, the
collection of data, the establishment of a data base, the use of a system to calculate
equivalent uniform annual cost of alternatives (not lowest cost), and the employment of
a multi-criteria decision maker utilizing the concepts of relative distancing and the
in
amount of information. /The process also uses input from the facility manager to weight
each performance criteria to select the best performing system and constructor for each
application. This system has successfully fused the ideas of "Fuzzy Thinking,"
continuous improvement, perfect competition, product differentiation, and multi-criteria
decision making.
Applied to the evaluation and potential procurement of Job-Order (Army),
Delivery Order (Navy), and SABER (Air Force) contractors, the system has been
employed to relatively quantify overall performance, safety, and efficiency. Cost data
has also been collected, however, it may be suspect due to the varying cost of labor
across the country. Information from 65 installations across the military has been
collected and analyzed. This information evaluates each constructor on 26 direct and six
extrapolated criteria. Fuzzy set theory has been used to develop a method to evaluate
existing and potential contractors as well as corporate and minority-owned (8a)
contractors equally. Current procurement policy uses a government price book, a
coefficient bid on that book, and a "technical" proposal evaluated by engineering and
contracting personnel. The proposed system uses "value engineering" at the time of
award and the management of information to award the contract to the best-qualified,
best-price constructor.
IV

ACKNOWLEDGEMENTS
I am especially grateful to Dr. Dean Kashiwagi for his "fuzzy" gift of broadening
the way I think and to Dr. William Badger for always having an ear for my opinions and
being there for career advice. I am also grateful to Dr. Richard Mayo for helping me
get this assignment and permitting me to take Dr. O'Bannon's Soils class! Additionally,
I would like to thank the administrative staff of the School of Construction. Thanks,
Sharon, Arlene, and Gloria for helping get the paperwork completed. Lastly, I would
like to thank Colonel Todd Stewart for his assistance in being given this opportunity.
I am deeply indebted to Dr. Dean Kashiwagi for the privilege of using his
copyrighted and patent-pending Performance-Based System.

For my beautiful wife Laura
(and her two damned cats!)
VI

TABLE OF CONTENTS
Page
LIST OF TABLES xiv
LIST OF FIGURES xv
Chapter
One INTRODUCTION 1
Objective of the Report 1
Organization of the Report 2
Background of the Report 3
History and Development of Job-Order Contracting 4
Standard specifications 5
Cost book 5
Bid coefficient 5
Constructor and designer 5
Long-term relationship 6
Contractor/Agency team 6
The in-place system 6
Conclusion 8
Worldwide Competitive Marketplace 8
Construction Industry Environment 10
Department of Defense Contracting Environment 11
Types of Department of Defense Contract Awards 13
vn

Chapter Page
Department of Defense Construction Environment 17
Concluding Remarks 20
Overview of Report 20
Two LITERATURE SEARCH 21
Introduction 21
Contemporary Literature 22
U. S. Army Study 09004-215-011 22
United States Naval Facilities Engineering Command 24
Non-federal government contract Operations & Maintenance ... 25
Contracted maintenance in non-public areas 27
Concluding Remarks 30
Three AF STREAMLINED SOURCE SELECTION PROCEDURES 31
Overview 31
Introduction 32
AFR 70-30 Appendix BB 33
Overview 33
Scope and intent 34
Structure 34
Strengths 37
Fallacies 38
Summary 39
vin
Chapter Page
Concluding Remarks 40
Four METHODOLOGY & CONSTRUCTION INDUSTRY STRUCTURE 41
Methodology 41
Introduction 41
Overview 42
Forward Chaining and Backward Chaining 42
Fuzzy Logic 43
Heisenberg uncertainty principle 46
The Pythagorean theorem and the Cauchy-Schwarz inequality principle 47
Performance Criteria 50
Overview 50
Performance criteria 51
Multi-Criteria Decision Making & the Displaced Ideal Model 52
Overview 52
Performance criteria weighting 52
Relative priority 53
Entropy 53
Variable interdependence 54
Displaced ideal procedure 55
Summary 57
IX

Chapter Page
Construction Industry Structure 59
Introduction 59
Construction Industry Structure 59
Differentiation of product performance 59
Value added fair share 60
Totally competitive environment 62
Buyer protection 62
Entry and exit barriers 62
Industry Structure Diagram 62
Demming's 14 Points of Continuous Improvement 65
Continuous improvement 66
Low tolerance for poor performance 66
Eliminate inspection 66
Training and education 66
Drive out the fear 67
Continuous improvement policies 67
Application Summary 68
Five DATA COLLECTION, ANALYSIS & RESULTS 70
Objectives of this Chapter 70
Introduction 70
Data Collection 71

Chapter Page
Overview 71
Performance Survey 71
Results of Data Collection 72
Concluding Remarks 73
Data Analysis & Results 73
Objectives 73
Overview 73
Performance Lines 74
Average Performance Criteria Scores 75
Combined Performance Factors 76
Results 78
Large/Small Comparisons 80
Fuzzy Analysis 83
Initial analysis 83
Secondary analysis - informational maximum 85
Secondary analysis - low bid 86
Iterative Process 88
Potential Job-Order Contractors 89
Concluding Remarks 89
Six CONCLUSIONS 91
Objectives of the Report 91
XI

Chapter Page
Primary Objective Results 92
JOC performance quantification 92
Evaluation verification 92
Current award practices 92
Secondary Objective Results 93
JOC database 93
Air Force SABER procurement 93
Identification of negative practices 93
Small versus large contractors 94
Fuzzy management of fuzzy information 94
Existing to potential comparison 95
Recommendations 95
Methodological Conclusions 97
Future Studies 97
Concluding Remarks 98
REFERENCES 99
APPENDIX
A AFR 70-30 Appendix BB 103
B JOC Performance Survey 135
C Extrapolated Performance Criteria Equations 139
D Contractor Scores for All Criteria 141
xn

Chapter Page
E Displaced Ideal Model Results for All Versions Comparing All Six Contractors 143
F Displaced Ideal Model Results for All Versions Comparing Large and Small Contractors 147
G Potential JOC Performance Survey 151
xm

LIST OF TABLES
Table Page
3.1 Color Rating Definition 36
5.1 Military Distribution of JOC's Surveyed 71
5.2 Performance Criteria and Values 73
5.3 Extrapolated Performance Criteria and Values 75
5.4 Performance Criteria and Values for Large and Small Contractors 77
5.5 Initial JOC Performance-Based Evaluation Results 79
5.6 Initial Small/Large Performance-Based Evaluation Results 80
5.7 Information Maximum JOC Performance-Based Evaluation Results 81
5.8 Information Maximum Small/Large Performance-Based Evaluation Results 82
5.9 Low Bid JOC Performance-Based Evaluation Reults 82
5.10 Low Bid Small/Large Performance-Based Evaluation Results 83
xiv
LIST OF FIGURES
Figure Page
1.1 Construction Percentage of the GDP 10
1.2 DoD Contract Awards 12
1.3 DoD Contract Award Types 13
1.4 DoD Contract Types Distribution 15
1.5 DoD Contract Types Distribution Ammended 16
1.6 Maintenance, Repair & Minor Construction Funding 18
3.1 Source Selection Structure 35
3.2 Sample Evaluation Matrix 37
4.1 Uncertainty Principle Diagram 46
4.2 Unproven Relationship Diagram 47
4.3 Pythagorean Diagram 48
4.4-4.6 Pythagorean Relationship Diagrams 49
4.7 Hesienberg - Pythagorean Overlay Diagram 49
4.8-4.11 Minimum Specification Migration Diagrams 60
4.12 Organizational Adaptation Model 63
4.13 Construction Industry Structure Diagram 64
xv

Chapter One
INTRODUCTION
Objective of the Report
The purposes of this report are: to quantify the performance of Job-Order
Contractors (JOC's), specifically JOC's in the United States Military, verify the need for
a Performance-Based Evaluation of these contractors, and demonstrate that current
procurement practices for JOC's are non-competitive. Secondary objectives of this report
include:
1. To establish a JOC database as a benchmark for future use. 2. To identify the current means used to award these contracts in the United
States Air Force. 3. To identify practices that create poor performance, higher costs and
industry instability. 4. To identify how "set aside" contracts (8a contracts) perform when
compared to larger companies. 5. To use an artificially-intelligent, "fuzzy logic" based, information
management system to streamline and analyze procedures while defining problems to maximize facility performance and optimize repair and maintenance spending.
6. To develop the means to compare existing and potential contractors. 7. To offer recommendations that will improve the long-term performance
of military contractors and the construction industry as a whole.

2
Organization of the Report
The report use tenets of "fuzzy logic," relativity and deterministic relationships
as fused by Kashiwagi (1991) for its methodology, organization and analysis. Chapter
One will introduce the construction industry, the military construction environment, and
job-order contracting. Chapter Two will review literature on the state of JOC
construction. Chapter Three will review the "Streamlined Acquisition" procedures used
by the United States Air Force (USAF) for the procurement of JOC's. Chapter Four will
detail the report's methodology and discuss the structural stability of the construction
industry. Chapter Five will report the data collection, analysis and results of the
methodology applied to JOC's. Chapter Six will correlate the results of the previous
chapters and offer the resulting conclusions and recommendations.
This report will use proven techniques and models generated by the industrial
engineering community. These developments have stabilized the manufacturing industry
and will be promoted to stabilize the construction industry, while aiding the construction
industry to continually improve the quality and value of the constructed product. The
justification for the application of the industrial engineering tools and philosophy
includes:
1. The manufacturing industries have been in a "worldwide competitive" market since the 1980s.
2. These models have proven successful in stabilizing the manufacturing industries.
3. Although inherent differences exist between the delivery of manufactured goods and the constructed product, there are enough similarities to warrant application.
3
Previous studies of the construction industry have merely documented existing
efforts or trends attempting to improve the quality of construction. Examples are:
union/nonunion marketshare, Total Quality Management, design-build efforts, and
management techniques used by successful firms. This report will attempt to identify
actions that the United States Air Force can take to purchase the best-price, best-
performing JOC. A follow-on goal of this report is to identify actions the government
can take, along with private industry, to stabilize the construction environment and
promote the consistent, continual improvement of the constructed project. The success
of this system in the private sector in conjunction with contemporary theses detailing the
performance-based evaluations of roofing contractors, general contractors, carpenters,
mechanical contractors, and hopper dredge control settings validate the usefulness and
universal applicability of the system.
Background of the Report
Through contacts at Arizona State University and during his time in the USAF,
Kashiwagi gained considerable interest in the field of job-order contracting. After joining
the ASU faculty, Kashiwagi met with Mr. Richard Beaudoin, President of MCC
Construction Corporation, Colorado, in the spring of 1992. Kashiwagi proposed the
implementation of a country-wide JOC performance-based evaluation. Kashiwagi then
contacted several other large JOC's, including Mr. Ken Jayne, Business Development
Manager, for Brown & Root Service Corporation, Texas. Kashiwagi, Beaudoin and
Jayne then developed the initial 26 performance criteria upon which information would
be gathered. The process of collecting the data began in the spring of 1992. Hoover

4
(the author) joined the performance-based JOC team in the late fall of 1993. Hoover
collected and processed data on a total of 65 installations across the military. In the
spring of 1994, the first JOC performance-based conference was held at ASU with
Kashiwagi, Jayne, Hoover, Mr. Owen Jones (MCC) and Mr. Patrick Murphy, Director
of Business Development for Holmes & Narver Construction Services, Inc. in
attendance. Initial information was presented and discussions pertaining to the future
expansion of the performance-based evaluation committee were held. Murphy
volunteered to head the membership and information effort; however, this task was later
assumed by Jayne. The information in this report is based on this initial, 65-site data.
In September of 1994, the JOC committee reconvened at ASU. Ten members
from the JOC community discussed the existing JOC market, its likely expansion, as well
as the stabilization of the industry through the creation of a performance-based JOC sub-
committee under the Alliance for Construction Excellence (ACE) of the Del E. Webb
School of Construction, Arizona State University. The foundation of this sub-committee
was overwhelmingly agreed upon by the representatives present. All agreed to take the
information back to their respective approving parties to commit resources to this
creation. Data is to be collected on an annual cycle.
History and Development of Job-Order Contracting
Job-order contracts are indefinite-quantity, indefinite time, fixed price construction
contracts that are competitively bid (Erickson & Murphy, 1993). The development of
the JOC system paralleled the partnership movement in the Japanese automotive industry.
It was first conceived in the early 1980's by Harry Mellon, United States Army, the then

5
chief engineer for the North Atlantic Treaty Organization (NATO). The construction
needs of the NATO community in Brussels, Belgium were not being met by the in-place
contracting system. Mellon conceived the idea of many small jobs being combined into
a single, competitively bid, unit price contract - the job-order contract (Erickson &
Murphy, 1994). The basic components of the JOC system are as follows (Badger &
Kashiwagi, 1991).
Standard specifications. These include general and detailed specifications of every
type of basic maintenance, repair and minor construction work.
Cost book. This is government's price book. It lists a unit price for each type
of work described in the specifications and includes no overhead or profit.
Bid coefficient. Contractors wishing to bid on the JOC review the specifications
and cost books, estimate a set number of projects, determine the difference between their
cost and the government's cost, and use this information to calculate two bid coefficients
to the cost book. The first is for normal working hours and the second is for overtime.
These coefficients include the contractor's profit and overhead.
The basic principles of the JOC are as follows (Badger & Kashiwagi, 1991):
Constructor and designer. The governing agency supplies only the basic
description of services needed. A site meeting is held with concerned parties to clarify
the project scope, identify site access and/or problems, and offer alternatives. The
contractor then completes all necessary engineering, planning, scheduling and estimating
tasks necessary for submittal to the host agency. The engineering staff reviews this
proposal and subsequent meetings are held until all issues are resolved. Once approved,

6
the job order is issued and acts as a notice to proceed. The contractor then completes
all work required.
Long-term relationship. In competitively bid projects there is little incentive for
the constructor to do more than meet the minimum specifications. However, because the
issuance of more job orders depends on the quality completion of current work, there is
a quality motivator present. Thus, the foundation for a long-term relationship exists.
Typically these contracts are let for a base year and 3 optional years.
Constructor/Agency team. Due to the structure of the contract, the JOC
essentially becomes an extension of the in-house engineering staff. Customer service and
satisfaction as well as responsiveness are increased by the face-to-face contact between
agency, user and designer/constructor. Again, the motivation for quality, timely work
is the issuance of more job orders representing more profit.
From this point several variations of the method of actual procurement exist.
Mellon first conceived that the contract would be awarded to the contractor with the
lowest bid. Payment on completed work would be the government cost times the bid
coefficient. (Badger & Kashiwagi, 1991). In 1987 the system was implemented at the
United States Military Academy (West Point) and seven other Army posts in the US in
the manner described above. In this stateside test of the already successful European
system, $57 million worth of work under JOC maintenance contracts was completed
(Badger & Kashiwagi, 1991).
The in-place system. At West Point this contracting solution was an effective
avenue to tackle an ever-increasing backlog of work with ever-decreasing personnel and

7
funding. The in-place system combined several smaller projects into one large project.
A design professional would then be selected to develop and design the project, complete
with plans and specifications. This would typically take 3 to 6 months. The project
would then set idle until construction funding was available-regularly waiting for year-
end funding-another 6 months. Once funding was available, the competitive bidding
process, imposed by the Federal Acquisition Regulation (FAR), would require an
additional 3 months. Therefore, if the project ranked high enough for the available
funding, it might be completed some 2 years after identification. This response time was
not acceptable for critical maintenance work that was not of the emergency status (Badger
& Kashiwagi, 1991).
A second variation of the procurement occurred in United States Air Force
(USAF). As the requirement for more and more maintenance contractors arose (both in
the military and in the civilian sector), the number of firms offering these services also
rose (Katzel, 1989). A system capable of differentiating between competing firms was
required. In December of 1986 (updated in April of 1988) the USAF supplemented its
procurement regulation (AFR 70-30) with Appendix BB to address this need. Although
this will be discussed thoroughly in subsequent chapters, it is important to note that it is
essentially a combination of the negotiated and competitively bid process. With this
combination, each contractor is required to submit a technical proposal in addition to
completing the work previously described. The proposals are examined by engineering
and contracting personnel, evaluated and ranked. Only then is the bid coefficient
revealed. The highest ranking contractor is contacted. The parties then negotiate to

8
reach an acceptable bid coefficient. In the event the an acceptable coefficient cannot be
reached, the second highest ranking contractor is contacted and the procedure is repeated.
Conclusion. The successful implementation of the JOC system in Belgium and
at West Point are evidence that the system is a useful alternative to standard procurement
contracts. Response time under the JOC averaged between 20 and 25 percent of the time
required for the in-place methods, while the quality of construction improved (Badger &
Kashiwagi, 1991). The workloads of the corresponding in-house engineering staffs
dropped considerably and contract administration overhead dropped, as only one contract
is required instead of multiple design and build contracts under the traditional system.
The ability to hire multiple JOC's and not award further work to below-performance
constructors provided the incentive for contractor-promoted quality control. Largely due
to the reduction of risk to the contractor (work clearly defined, profit and overhead
guaranteed), lower construction costs were recorded. These reductions were seen as a
savings of 20 percent on small jobs (less than $15K), 40 percent on medium jobs
(between $15 and $100K), and 72% on large projects (Badger & Kashiwagi, 1991).
Worldwide Competitive Marketplace
As the worldwide competitive marketplace begins to affect all tiers of the
worldwide economy, the construction industry will face many challenges. The
construction industry should be considered a service industry to the manufacturing and
production sectors as well as the military and other government agencies. (Kashiwagi,
1991). Two main dangers are facing the construction industry:

1. If construction costs continue to increase higher than the serviced industry's profit, major facility owners will move their businesses to areas with lower operating costs. (Bopp,1993).
2. Increasing construction cost may reduce the volume of construction.
As the percentage of construction funding versus GNP falls, as costs rise, and
facility maintenance costs and lifetime cycle costs-termed equivalent uniform annual cost
(EUAC)--become more important, the construction industry will require methods and
means to become more efficient. Facility managers will be required to minimize the
need for new facilities (Bopp, 1993). This appears to be especially true in the military
construction environment as defense contracting has been consistently decreasing since
the mid 80s (US DoD Prime Contract Awards by Service Category and Federal Supply
Classifications, 1980-1993). The procurement of higher performing construction system
is one method of addressing this minimized need for new facilities and/or minimizing
maintenance costs. Before better systems can be procured, a system of quantifying
constructor and system performance must be in place. The performance-based evaluation
and procurement system meets this requirement (Kashiwagi, 1991). In recent times,
partnering, in both the private and public sectors, has been another approach used to
create performance standards(Gruhn, 1993)(Mosely, Moore, Slagle, and Burns, 1991).
These methods result in the motivation of constructors to increase the performance of
their methods, materials and products, while lowering the EU AC of facility procurement
and maintenance. Raising construction performance increases industry stability-one of
the goals of this report (Kashiwagi, 1991).

10
Construction Industry Environment
The construction industry consistently ranks eighth in the domestic industries of
the United States (U.S. Statistical Abstract, 1993). However, seen as a percentage of
the GDP, construction has dropped steadily over the years 1980 to 1992. From 11.7 to
8.2 percent (U.S. Statistical Abstract, 1993). See Figure 1.1 below. It is critical to
reinforce that the construction industry must be viewed as a service industry to other
sectors, especially production and manufacturing. As these sectors have competed in the
global marketplace, emphasis on lowering operation and maintenance costs has increased.
During a recent roundtable in the Phoenix metropolitan area, facility managers
universally cited the reduction of their operating and maintenance budgets by as much
as 20 percent per year (Phoenix Roundtable, 1994).
2 O
P»ro« >nt of Tc ital B mi
1 S
.-.--■ .... . .
-i . . . . . . . .
....
. . . . . . . . ... .
1 o
.... .... .... ....
r r r i r- r- r- r r
Percent of Toial GDP
"Slnclirn
□GDP
aa
FI>o«l Y*»«r
Figure 1.1 Construction Percentage of the GDP Source: Statistical Abstract of the United States
U.S. Department of Commerce. Bureau of the Census: 1993

11
However, as these businesses continue to keep facilities on-line for longer periods of
time, maintenance and repair expenditures must increase. The is supported by the ratio
of new construction to maintenance and repair seen in 1993. The nation spent $27.2
billion to renovate and upgrade commercial facilities-an increase of 3.3% from 1992.
The projection for 1994 is even higher (MacAuley, 1992). The construction industry
must assist its serviced sectors in reducing operating costs by producing higher
performing systems.
Department of Defense Contracting Environment
All Department of Defense (DoD) contracts fall in two broad categories-above
or below $25,000. For the purposes of this report, only actions above the $25,000
threshold are considered as the majority of construction contracts in the military fall in
this classification (DoD Prime Contracts, Service Category). DoD contracts are also
divided into three classifications: supplies & equipment; other services & construction;
and research, development, testing & evaluation (RDT&E). Figure 1.2 on the following
page demonstrates that while overall contracting actions and values have, more or less,
consistently dropped from a peak in the mid-Reagan era, the value of other services and
construction has experienced gradual, but steady growth. This is especially true in the
fiscal years (FY) 1985 -1993. Over this period, total contracting action value decreased
from $150.7 billion to $123.7 billion~a decrease of $27 billion (28 percent). However,
during this same period other services and construction experienced an increase from
$34.4 billion to $40.6 billion-an increase of $6.2 billion (18 percent). This increase
may appear to be small in value ($6.2 billion); however, as seen as a percentage of the

e: o
a. u =3
o- -fcl LU c ofl o
O <D oS LU
« CL CX
ai o
1= CO Ü a:
m m m m
c o
m c
o o o in CM
L. (U > 0
Ü (0 1_
c 0 Ü
Q o Q
0
<D 3 (0 >
0 Ü
CO >* 0) O. c*l
V) D. ON
T2 •— J oo
CM C3 fi >< 0) £ Ji B>
<: <u a)
T- a 1 "2 0) CO
lü Q •f-
o o 60 u
o Ü 2 e 0) U
Q 0) CO
o Q
C Q on u
(N •" >, CO ■3 -0
CO '""' 1° > a. i_ (1) (0
(SO
< a s 0) a M CO >- E 1 = c c
(0 o .«•
(Ü o u CO (0 fc!
LL CL,
m ü CO
3 O
C/3
^ CO
CO CO
CM CO
CO
o CO
o o o O O o o o (0 ^ CM O CO CO •* CM
13
total value of all contracting actions, other services and construction has increased a full
10 percent from 22.9 to 32.9 percent. The author believes that defense spending will be
further reduced in the future and as this occurs, other services and construction will
become a larger and larger portion of the military contract environment.
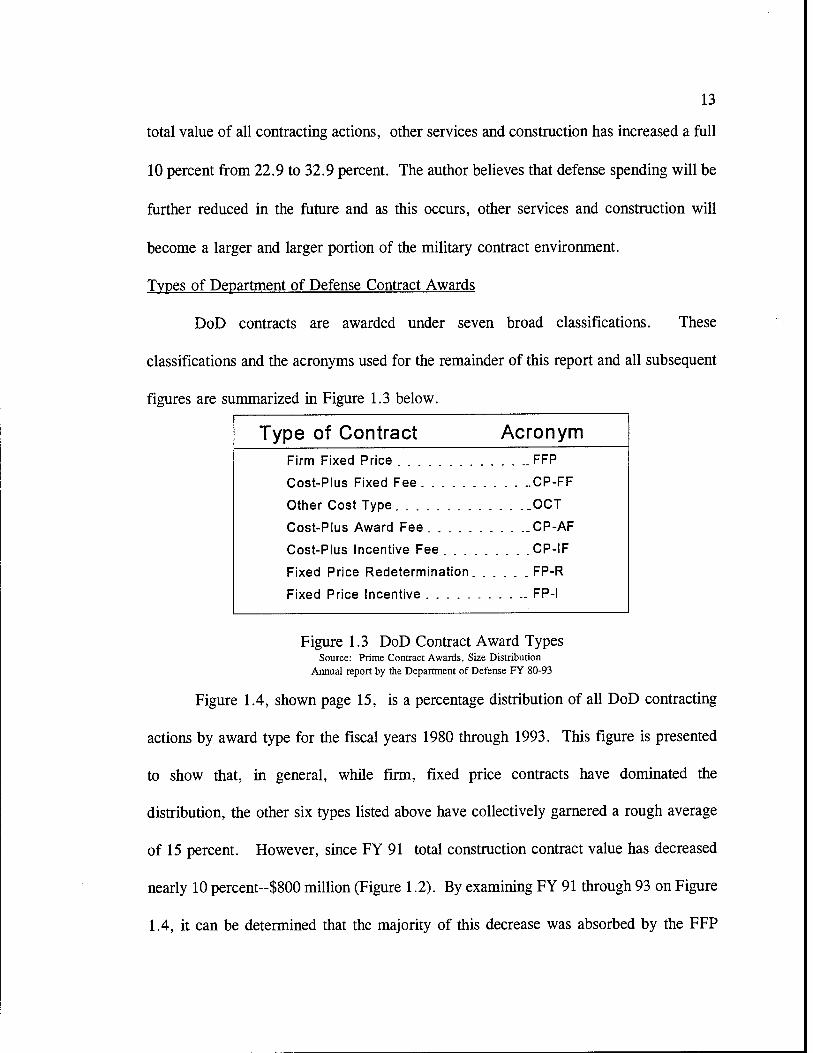
Types of Department of Defense Contract Awards
DoD contracts are awarded under seven broad classifications. These
classifications and the acronyms used for the remainder of this report and all subsequent
figures are summarized in Figure 1.3 below.
Type of Contract Acronym Firm Fixed Price FFP
Cost-Pius Fixed Fee CP-FF
Other Cost Type OCT
Cost-Pius Award Fee . . ..CP-AF
Cost-Pius Incentive Fee CP-IF
Fixed Price Redetermination. FP-R
Fixed Price Incentive FP-I
Figure 1.3 DoD Contract Award Types Source: Prime Contract Awards, Size Distribution
Annual report by the Department of Defense FY 80-93
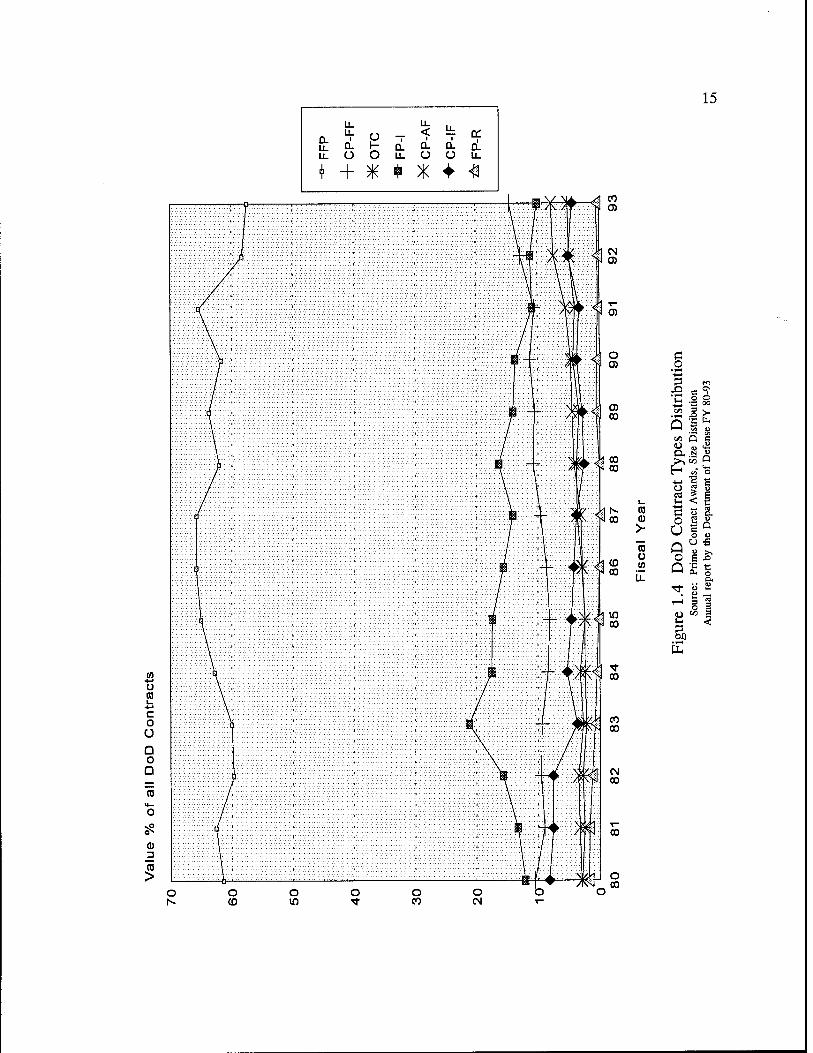
Figure 1.4, shown page 15, is a percentage distribution of all DoD contracting
actions by award type for the fiscal years 1980 through 1993. This figure is presented
to show that, in general, while firm, fixed price contracts have dominated the
distribution, the other six types listed above have collectively garnered a rough average
of 15 percent. However, since FY 91 total construction contract value has decreased
nearly 10 percent-$800 million (Figure 1.2). By examining FY 91 through 93 on Figure
1.4, it can be determined that the majority of this decrease was absorbed by the FFP

14
category. It is also important to note that FFP contracts have experienced a steady
(except between FY 90 and 91) decline since FY 87. Although no current government
information is available, the author believes that this affect is the result of two factors.
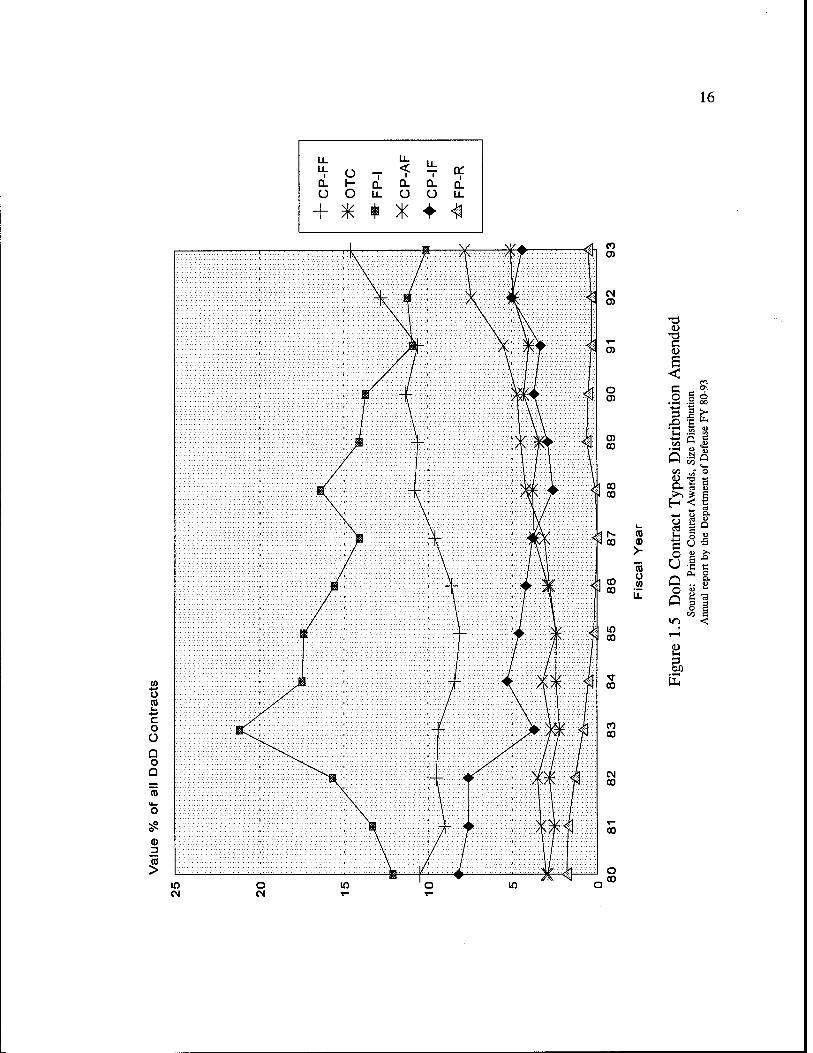
First, since FY 86 the total contracting value has steadily decreased and more
importantly, since FY 87 JOC's have been utilized. Figure 1.5, on page 16, is a
duplicate of Figure 1.4 with the FFP category removed to enhanced the readability of the
changes in the other six classifications. The importance of this figure and its
distribution lies in the consistent growth of the CP-FF category from FY 85. The United
States Army first utilized the JOC in FY 87 and, as previously discussed, procured $57
million worth of construction through this system. Between FY 86 and FY 87 an
increase of $1.1 billion in the CP-FF category was recorded-52 percent of this was the
result of the eight installation JOC test described earlier. Obviously other factors are
involved in the increase in CP-FF use; however, at the time of this writing, no other
information could be found to define the other 48 percent of this rise. The increase of
CP-FF actions between FY 85 and FY 86 was .3 percent or .5 billion (prior to the JOC
test implementation). Subtracting the .57 billion JOC expenditure between FY 86 and FY
87 leaves .53 billion in non-JOC actions. The consistency of this increase (.5 billion and
.53 billion) leads the author to believe that approximately half of the overall fluctuation
(since FY 87) in the CP-FF category is the result of JOC actions. The author believes
this to be especially true until FY 91. Although in that year CP-FF experienced a drop
of .7 percent, the United States Air Force implemented a test of the JOC system under
the acronym SABER (Simplified Acquisition of Base Engineering Resources). In
15 u.
O u.
_ < i a:
ul Q- H £L DL Q. a. LL O U U. O O u.
+ + X t X ♦ 4
4m
CO L-
c o Ü G o Q
15 M- o
a> D CO >
rS e <? Poo
HH so Qi .—■ to <« ß e
ft.ai </l o
ra
>-
"rä u 10
o l-l
C o U
g s < e O D. rt 4) e Q c M
o <u U 5
s « a, o
a •. tu U 1=
00
16
Li. Li. O
Li. _ < U.
Qi D. 1- OL ti- Q. D. O Ü ll. O O LL
+ * t X ♦ 4
(0 Ü
c o Ü Q o Q
5
.2 .IS
'C .a 8
■9fi
CO
Q
(0 ID >- 15 u CO
co „- o D -a —
1 So
s ^ •5 e o U
i § in T—I
Ö

17
FY 91 SABER was implemented across the Air Force. The United States Navy also
implemented the JOC system, under acronym DOC (Delivery-Order Contract) at some
time within these fiscal years, although at the time of writing exact dates could not be
found. The author believes that the strong growth of the CP-FF from FY 91 to FY 93
(3 % or $2.9 billion) is the direct result of increased service use of the JOC system. This
increase can also be seen as a measure of the relative success of the JOC system in
meeting customer requirements with a timely product. It is interesting to note, that the
initial data collected reflects the belief that JOC's are procuring higher quality projects
than the traditional design-bid-build method, albeit at a higher first cost.
Department of Defense Construction Environment
DoD construction falls into one of four congressionally specified categories:
maintenance, repair, minor construction and major military construction. The military
construction program (MILCON) is composed of all new major construction over
$300,000 and any renovation project containing more than $300,000 of new work. The
MILCON program is annually submitted to congress for funding approval. Minor
construction is congressionally specified as new work not to exceed $300,000.
Maintenance, repair and minor construction together can be thought of as the normal,
cyclical maintenance and minor alterations required by the changing needs of the using
organizations. Projects of this nature are seldom submitted for congressional approval.
Various levels of lower echelons typically approve these projects. Demonstrated by figure
1.6 on the next page, as a percentage of the total construction funds spent over the last
thirteen fiscal years, maintenance, repair and minor construction (M&R) has increased
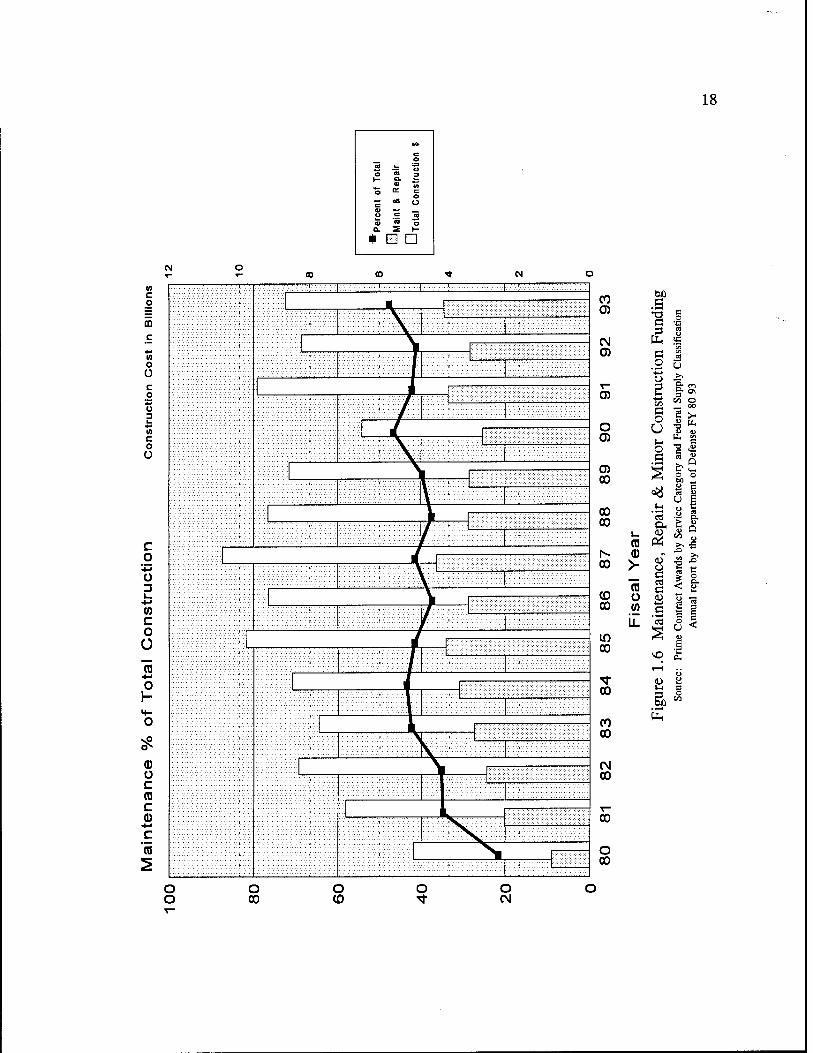
18
V»
c o
o
o IE
c aS O <D U
to Q. Ss 1-
* El □
00 CM
m c
o 0 c o !? Ü 3 u « C o Ü
C O
o 3 i_ +■< (0 c o Ü
"S +J o h
<D Ü c (0 c <D +■>
c "03
CO gp 0) *2 c
c 3
CM uu IS
0) c tfl
o u -t—< o >,
0)
o
B -t—»
e o u
3 ^ 00 o
2 >-
0) l-l o 0) CO
c S Q
^ CO CO
03
cd
Pi
•a S. S a &• 'S
h- <D „ 00 >■
< 2 03 CO n
(L) n (1) 00 W E 2 a
c S
in LL rt
s c5< 1 a, CO
VO 1—1
■* p Ü CO l-l
3> 3 O
00
CO ft
CO
CM 00
CO
o 00
o o o CO
o CO
o o CM

19
from 21.6 to 47.7 percent—a 26 percent rise. This constitutes an escalation from $1.1
billion in FY 80 (when total DoD construction spending exceeded $5.0 billion) to $4.1
billion in FY 93 (when total DoD construction spending exceeded $8.7 billion). As
defense spending is reduced and structures are kept in the inventory for longer periods
of time, M&R funding must increase. However, even as the need for this M&R funding
becomes a greater-it too will, in all likelihood-be reduced. This will increase the
backlog of needed maintenance work with insufficient resources for funding.
Traditionally these projects would be designed as A&E (architect and engineer) design
funding was available. These projects would then "sit on the shelf" awaiting the
possibility of year-end funding. This was the condition at West Point, as discussed
earlier. Customers might see work begin on a critical maintenance project two or more
years after they had identified their requirement. As discussed earlier, JOC's alleviate
the lengthy design time for a great deal of M&R projects, and since the
constructor/design team is already in-place, project development and quantity negotiations
can be prepared prior to actual funding. This facilitates the rapid award of project
funding during the tight time constraints of year-end, fiscal close out, and helps build the
constructor/agency team. Due to the inherent award structure and the apparent success
of various JOC systems, the author believes that increasingly more projects will be
executed under these contracts.

20
Concluding Remarks
This chapter has demonstrated that in the "new global market place," fierce
competition is increasing the pressure on facility managers to optimize facility system
performance, while keeping existing structures in the inventory for longer periods of
time. To accomplish this, M&R spending must increase and the procurement of the best-
performing system must become a priority. It has also demonstrated that, while not a
portion of the global market, the military has similar optimization requirements, facing
the probability of ever-decreasing defense budgets. It has introduced and defined the
components and tenets of job-order contracting and shown how JOC's can provide an
attractive, timely alternative to the traditional (design-bid-build) project procurement.
It has illustrated the increase (by percentage and value) of CP-FF contracting in the
Department of Defense. Through the analysis of this increase, the author has drawn the
conclusion that JOC systems across military are increasing in use and that this increase
is a measure of JOC success. This chapter has presented a summary of the development
of the Performance-Based subdivision under the Alliance for Construction Excellence and
laid the foundation upon which the objectives of this report can be built.
Overview of Report
This report's objectives are: to quantify the performance of Job-Order Contractors
(JOC's), specifically JOC's in the United States Military, verify the need for a
Performance-Based Evaluation of these contractors, and demonstrate that current
procurement practices for JOC's are non-competitive.
Chapter Two
LITERATURE SEARCH
Introduction
The objective of this report is to assist the United States military, and the government
in general, to procure higher levels of construction performance. This effort is directed at the
quantification and the understanding of the differentiation of building services, products and
systems. It is also to assist in the understanding of the true "value-added" nature of performing
systems. A secondary objective of this report is to identify the requirements that will produce
a stable construction industry-one which continually improves the constructed product. The
objective of the literature search is to explore publications containing information on contracted
maintenance alternatives facility managers (or base engineers) can utilize to meet maintenance
and repair requirements in the face of ever-shrinking budgets. Another objective of the literature
review was to investigate the existence of true performance information. If performance has
been quantified and the conditions or rules defining the performance can be identified, an
improved construction environment can be defined. The literature search led to the following
22
conclusions:
There is a lack of true performance data, as defined by Kashiwagi, in the construction industry. Traditional statistical tools have attempted to identify performance ranges in the construction industry. Because a large number of factors affect construction product performance, these efforts have been non- conclusive and lack the magnitude to implement changes, especially in the government. Clearly this methodology is not meeting its goal. A method of measuring true performance is necessary.
Published literature is generally limited to descriptive case studies. One such instance is a US Army Corps of Engineers study comparing JOC's to individually procured projects. Other topics include types of delivery mechanisms, current management strategies, and problems in the industry.
The remainder of this chapter will discuss the latter of the two conclusions. The first
conclusion will be thoroughly presented, discussed, and dissected in Chapter 4, as it is the
methodology upon which this report is based. The remaining conclusion will be addressed
through the discussion of descriptive studies and articles. The topic of maintenance contracting
is also introduced in this chapter, as the services offered nearly parallel those of a JOC and thus,
permit meaningful analyses.
Contemporary Literature
US Army Study 09004-215-011. July 10. 1991. JOC's have only been a significant
alternative to facility managers since the late 1980s. Therefore, little information, statistical or
otherwise is available. The most comprehensive study to date was completed in 1991 by Booz-
Allen & Hamilton Inc for the United States Army. This study was largely descriptive but
attempted to analyze current procedures to meet two goals. These goals were to produce a
decision matrix to help post engineering leadership decide between JOC execution and single
project contracting. The second goal was to provide a full cost breakdown of both methods.

23
This would allow the government to determine the most cost effective procurement method. The
report admits failure in its first goal (due to the small number of projects surveyed) and claims
success on its second. The author proposes that proposes that the report fails in its second goal
as well.
The study is quite comprehensive in its drive to include all applicable costs to project
award and procurement. It also addressed the time involved in both contract types. It is
important to note that the author is faulting the approach of the accounting firm, not a weakness
of the JOC system. The author proposes that scope of the project was too small (two
installations, eleven projects). The report used traditional approaches and statistics coupled with
descriptive verbiage to attempt to derive meaningful analyses. It also fell short in that it only
measured the pre-construction cost of the projects. Therefore it only measured the contract
acquisition cost of JOC projects versus single contract projects. The report found that the
acquisition cost of JOC projects averaged roughly 4 percent of the construction cost, while single
project acquisition costs averaged 8 percent. However, the projects compared were not similar
in their need for design or complexity of construction. The posts surveyed also used the JOC
system for very different types of projects-driven by the environments of the installations. One
of the installations had a large maintenance force capable of complex projects, thus used the JOC
for simple, repetitive work. The second had an almost non-existent maintenance force, thus
utilized the JOC for nearly all of its projects.
Although the study suggested that the average 4 percent savings in acquisition costs was
quickly absorbed by increased construction costs, it emphasized the JOC's reduced acquisition
time. A range of time savings from 45 to 98 percent was recorded. Since construction cost

24
comparisons were not included in the report, no further analysis can be offered. However, the
author proposes that the suggested increased JOC construction cost (counter-acting the
acquisition savings) is the cost of increased quality. As previously discussed, the JOC tenet of
continued work volume based on previous customer satisfaction provides the incentive necessary
to keep the contractor from "cutting corners" to save money. Seen in the perspective of long-
term budget reductions, including maintenance and repair funding, JOC projects should
consequently be more cost effective.
United States Naval Facilities Engineering Command (NAVFAC). In its attempt to
obtain a great deal of flexibility, NAVFAC has built, what they have deemed, the "portfolio of
contracting options" (Rispoli, 1991). It is the goal of this portfolio to include a wide range of
strategic acquisition alternatives. Then depending on the circumstances of the project, Naval
personnel can choose the best alternative for the given circumstances. The most prolific use of
the portfolio strategy is in the arena of environmental restoration and remediation. In this
program all of the contract types described in Figure 1.3 are used. However, it does appear that
FFP contracts are only used when nearly complete scopes are attainable. The rigidity of the
FFP contract does not offer an attractive solution to many of the Navy's environmental
problems. Its ability to accommodate expanding or reducing scope only by continuous
modification severely limits the contract's economic feasibility (Handley, 1989). Therefore, the
Navy has included a time and materials mechanism in the form of a CP-AF contract. This
option meets the changing scope shortfall of the FFP contract. However, these contracts are
typically let for a base year and one to three option years. The Navy's long range plan is a ten
year strategy to meet all of the requirements of the Comprehensive Environmental Response,

25
Compensation and Liability Act (CERCLA). Although the standard CP-AF contract met some
of the Navy's needs, it could not address the long range aspect. The Western Division
(WESTDIV) of NAVFAC was the driving force behind the search for an appropriate contract
solution. After scrutinizing many alternatives, especially the Environmental Protection Agency's
Alternate Remedial Contract Strategy, WESTDIV developed the Comprehensive Long-Tern
Environmental Action Navy (CLEAN) contracting scheme. This approach is a ten-year CP-AF
contract that has a base of one year and nine option years. The incentive for quality, timely,
and cost effective construction lies in the promise of nine years of future awards. The structure
also gives the Navy a mechanism to terminate the contract if performance is not satisfactory.
It is interesting to note that both design and construction services are being tenured with this
tool. Since its creation in 1989, the CLEAN contract has been implemented in eight of the
Navy's geographic areas. The maximum value of these contracts is either $100 or $130 million
dollars depending upon the requirements (Rispoli, 1991). One of the most attractive features
of these contracts is its duration. Having a constructor on-line and able to help in the project
definition and exploration as well as complete some projects while the professional engineering
work is ongoing, has been very beneficial. The engineering work required under CERCLA
often takes four to six years in itself. The implementation of the CLEAN contract has not
eliminated the use of other contracting alternatives. The Navy states that compliance projects
are also planned and will be awarded through the traditional invitation to bid approach (Rispoli,
1991).
Non-Federal government contract operations and maintenance. The city of Cranston,
Rhode Island was faced with many operations and maintenance difficulties with their waste water

26
treatment facility. In 1989, the decision to contract the operations and maintenance of the
facility to a commercial company was made. The contract was for a fixed price with the firm
paying all of the operating expenses, including salaries, utilities, supplies, and laboratory
services. In the first five years of the contract, a savings of $3.7 million has been reported
(Payton, 1994). This savings was the result of many aggressive strategies. Most of the
approaches centered around the optimization. This was accomplished through data collection
and analysis of various chemical processes, a proactive preventative maintenance program,
replacement or recalibration of existing equipment, and the minimization of waste. However,
continued education and training of the staff, most of which are the original city employees, can
also be accredited with some of the savings. Educational topics ranged from microbiology to
energy conservation. Many indirect benefits of this contracted maintenance were also reported.
These included relieving the city of union relations, employee benefits and general liability
insurance.
In 1989, the Washington State government contracted with the accounting firm of
Delloite, Haskins and Sells to create a comprehensive costing system. This program would bill
government-run M&R jobs for all of the costs associated with the project. The Associated
General Contractors of America (AGC) took a very proactive role in the implementation of this
system. The AGC felt that contracted maintenance and repair was cheaper than government
work, and that a true comparative study would result in increased work for contractors. One
of the tactics of this study was to run standard FFP projects with the government being one of
the bidders. However, as the initial results were tabulated, projects were "awarded" to the
government, questions were raised. Comparisons of the bids showed labor rates for the

27
government at half what the contractors listed (Brain, 1989). The reason cited was that
contractors pay prevailing wage rates and insurance costs that the government doesn't. Delving
by the AGC found a major discrepancy in the way the government was costing equipment.
Equipment idle time (and the cost thereof) was not included. Therefore, the true cost of
equipment was not used. An example is when a project is only billed for the time it uses a truck
from the state motor pool instead of the cost of the truck. In one instance the government bid
came in 28 percent lower than the next lowest bid. As the bidder compared the bids line item
by line item, it was discovered that the government estimator did not include all the equipment
required by the bid document (Brain, 1989). Another issue, brought up in the form of
inaccurate comparisons, was in quality. A recent study in Portland reported that less than half
of the asphalt paving installed by the city met the degree of compaction required in standard
contracts (Brain, 1989). When faulty work requires repair, the taxpayers must pay for the
rework. This cost is not included in the government estimate; however, it is included in the
non-government bids as any rework is the contractor's responsibility. Although the study
appeared wrought with problems the AGC felt the end product would be useful, providing AGC
members aggressively forced the government to consider at and include all of its costs. Final
results of this study were to be reported in 1991; however, at the time of this writing, no further
information could be found.
Contracted Maintenance in Non-Public Areas. The most common use of maintenance
contracting has traditionally been in janitorial, security and cafeteria type functions. However,
more industrial plants are turning to contracted maintenance to augment their in-house staffs.
The major advantage of contract services is the flexibility to adapt to "leaner" economic times

28
by reducing the amount of services. In the past, when contracted services were seldom used,
these economic lean periods would often cost permanent employees their jobs. This in turn
lowers the quality and experience of the in-house staff while the need for maintenance continues
to increase. This is especially true in the chemical and petrochemical industries. Within these
industries, painting services and "turn-around" (major, temporary plant-closing overhauls)
services are the most popular. The increase in companies seeking these services has
correspondingly spawned an increase of the number of firms offering them (Katzel, 1989).
Maintenance contracts appear in the almost every form of contract type. Among the most
common are cost-plus, unit price, and fixed price (Katzel, 1989). These services are not "labor
brokers." They are complete packages of trained labor and management. However, because
these services require low capital investment, they attract participants that do not possess the
technical knowledge or experience to provide a performing product effectively (Katzel, 1989).
Thus, the process of differentiating between performing and non-performing providers has
become more important.
Current literature only offers descriptive methods of evaluating potential contractors.
Often, partnering is presented as a vehicle to establish a long-term relationship between the
facility owner and the provider (Hower, 1991). Fundamental to the establishment of this
relationship is the foundation of a solid trust between the parties. Partnering increases customer
satisfaction by giving the provider immediate feedback. These relationships often take the form
of multi-year renewable contracts. Thus, the incentive for timely, quality, cost-effective work
is in the promise of future work.
Other literature specifies areas that might be of potential concern to facility owners, but

29
seldom, if ever, offers an objective, information-based mechanism to measure these areas.
Typical areas are (Katzel, 1989):
1. Types of services provided. 2. Contract type. 3. Company assets, experience, and time in the field. 4. The company's employee turnover rate. 5. Contractor's willingness to bid solely on the specifications (rather than site visits). 6. Speed of contractor response. 7. Contractor's attitude toward safety. 8. Contractor's attitude toward quality. 9. Procedure for contractor's employees being hired and qualified.
Many attempts to ensure contractor compliance and quality through various forms of
inspection are also presented. Methods range from "spot" inspections to required third-party
inspection services. All claim near equal success based on the amount of trust between the
owner and contractor.
One common philosophy appeared in nearly all of the literature reviewed. This was the
emphasis on continuous, quality communication between the owners and the contractors.
30
Concluding Remarks
The objectives of this chapter was to explore publications containing information on
maintenance contracting alternatives available to facility managers and base engineers. The
United States military's uses of contracting alternatives, chiefly cost-plus type contracts, was
discussed not only as applied to JOC's and DOC's, but also applied to large-scale environmental
programs. These programs include both design and construction services. Non-federal
government attempts to quantify the comparative costs of maintenance and repair projects
completed by contractors and government employees were presented. The most notable shortfall
of this attempt was in the poor accounting practices of the government. The increase in
popularity and use by private industry of contracted maintenance services was introduced through
the descriptive efforts of several authors.
A second objective of this chapter was to explore the existence of true performance data
as defined by Kashiwagi. Due to the relatively new definition of "Kashiwagi" performance
information, it was quickly determined that very few proven performance measurements are
available.
Chapter Three
AIR FORCE STREAMLINED SOURCE SELECTION PROCEDURES:
A REGULATION 70-30 APPENDIX B
Overview
One of the objectives of this report is to demonstrate that current JOC award practices
are non-competitive. This chapter will detail a current Air Force procurement strategies used
in awarding JOC's. The method to be discussed is prescribed by Air Force Regulation (AFR)
70-30 Appendix B. The complete regulation has been included in Appendix A of this report.
It is important to note that as of January 1994, this regulation had been rescinded by the Air
Force. However, as of this writing (October 1994), no further operating procedures had been
issued. The relevance of this discussion lies in that the author knows of at least three
applications of this regulation, to procure JOC's, in the calendar year 1994.

32
Introduction
During the data collection phase of this research, three Air Force installations were
contacted that were in the process of beginning the JOC (SABER) selection process. One of the
installations had terminated the previous contract "for the convenience of the government." The
JOC's at the other two bases had run there full duration and been renewed for all available
years. The author proposed using the performance-based evaluation and procurement system
in conjunction with the information collected during this research (if applicable) to select the
best-performing, best-price constructor for two of these installations. The first installation
contacted was very interested in the system and wanted to implement the system. However, the
base was trying to award the contract before the end of the fiscal year-in order to be prepared
for possible year-end funding as discussed in Chapter 1. Although Kashiwagi and Hoover
conveyed that this time constraint could be met, the engineering leaders at the base did not
believe the base leadership could be convinced of the new procedures in the time available.
These engineers also believed they had a method, prescribed AFR 70-30 Appendix B, to
quantify performance. The author was unfamiliar with the specifics of this regulation and could
not comment on the "performance quantification procedure" contained therein.
The second installation contacted had had more serious problems with the quality of their
JOC. Although they believed the JOC system to be an attractive alternative, the engineering
community of this installation was unhappy with the performance of this particular constructor.
When the author contacted this installation, for a evaluation of their current contractor, several
questions were immediately raised. Base personnel were worried that the information being
requested was being sought by the constructor as a potential tool for litigation against the

33
government. They were also very interested in the amount of information the performance-based
evaluation was collecting. Personnel at this location had spent the last six months collecting
"performance" and procurement information from roughly fifteen locations across the United
States. This was an attempt to find a better way of procuring a performing constructor. Once
again, Hoover offered the services of Kashiwagi and himself to the installation. The engineering
community (understanding the value of the information based on their own efforts) wanted very
much to solicit the services of the performance-based evaluation. However, the contracting
community could not be convinced to the point of a procurement solely on the performance-
based evaluation system. The contracting officer did express interest and wished to run the
system simultaneously with their "in-place" system to compare the results. Kashiwagi and
Hoover deemed this as unproductive as the amount of work involved was too extensive for a
"comparative" study of the system. When the contracting officer was asked about the "in-place"
system, he informed the author that AFR 70-30 Appendix B would be used. It is important to
again note that this was at least five months after the regulation had been rescinded. At this
point the author decided that a discussion of this regulation was necessary. Having collected
data from 65 installations across the military, 31 of which were in the Air Force (see Table 5.1),
the author knew that a wide range (from extremely satisfied to extremely dissatisfied) of
customer satisfaction was being reported. The conclusion drawn is that the current system is
awarding contracts to and permitting the participation of performing and non-performing
constructors.
AFR 70-30 Appendix B
Overview. It is not the purpose of this section to reiterate the entire procurement
34
regulation seen in Appendix A. However, an overview of the regulation's intent, structure,
strengths, fallacies and a summary will be presented.
Scope and intent. AFR 70-30 Appendix B is a source selection procedure applying to
competitive, negotiated procurements. It is a supplement to AFR 70-30 and AFFARS (Air
Force Federal Acquisition Regulation Supplement). The primary intent of AFR 70-30 Appendix
B is to select the provider whose proposal has the highest degree of creditability, and whose
performance can best meet the needs of the government at an affordable cost (Section A,
paragraph 2). The regulation also states that the system "... must be .... capable of balancing
the technical, cost and business considerations consistent with requirements and legal constraints"
(Section A, paragraph 2). AFR 70-30 Appendix B attempts to provide a mechanism for a
procurement method when considerations in addition to cost are strategic.
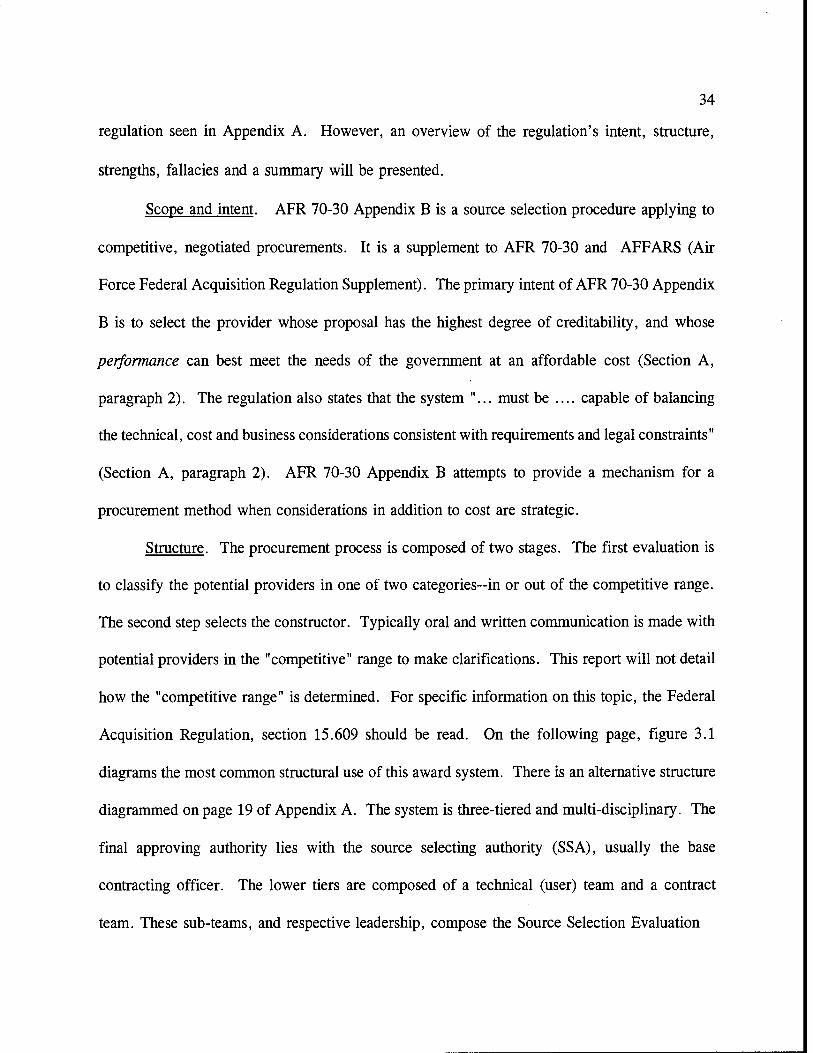
Structure. The procurement process is composed of two stages. The first evaluation is
to classify the potential providers in one of two categories~in or out of the competitive range.
The second step selects the constructor. Typically oral and written communication is made with
potential providers in the "competitive" range to make clarifications. This report will not detail
how the "competitive range" is determined. For specific information on this topic, the Federal
Acquisition Regulation, section 15.609 should be read. On the following page, figure 3.1
diagrams the most common structural use of this award system. There is an alternative structure
diagrammed on page 19 of Appendix A. The system is three-tiered and multi-disciplinary. The
final approving authority lies with the source selecting authority (SSA), usually the base
contracting officer. The lower tiers are composed of a technical (user) team and a contract
team. These sub-teams, and respective leadership, compose the Source Selection Evaluation
35
Source Selection Authority
Source Selection Evaluation Team (SSET)
Contract Technical Team Team
Figure 3.1 Source Selection Structure Source: AFR 70-30 Appendix B, 27 April 88, Attachment 3, p 19
Team (SSET). In the case of a JOC the technical team is composed of civil engineering
representatives. These personnel are responsible for evaluating contractor proposals against a
predetermined scale. The criteria upon which the proposals are to be graded are included in the
solicitation. The comprehensive area to be evaluated is referred to as the "Specific Criteria."
The sub-section to be evaluated under the comprehensive area is deemed the "Assessment
Criteria." These assessment criteria are evaluated in a matrix format. The format includes color
rankings and arrows. The arrows are used to indicate a change from the initial rating, typically
signifying a clarification as mentioned previously. However in the data collection phase, the
author found an installation using the arrows to identify the color as a "strong" (up arrow),
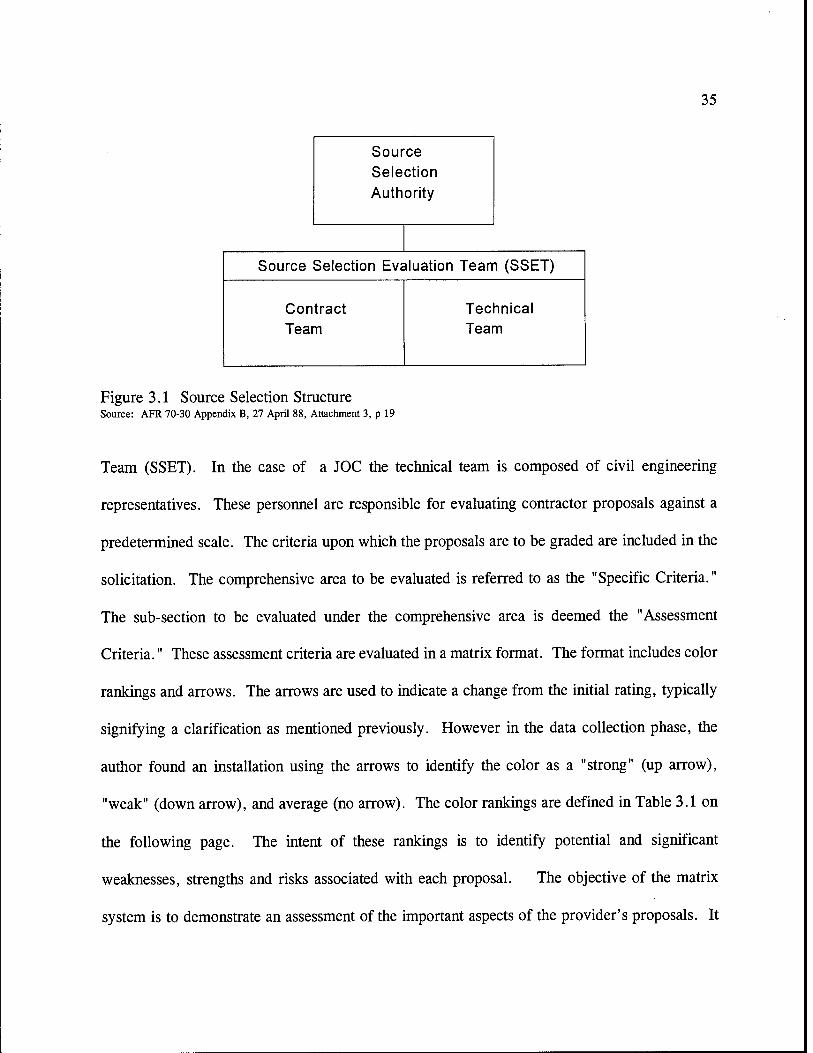
"weak" (down arrow), and average (no arrow). The color rankings are defined in Table 3.1 on
the following page. The intent of these rankings is to identify potential and significant
weaknesses, strengths and risks associated with each proposal. The objective of the matrix
system is to demonstrate an assessment of the important aspects of the provider's proposals. It
36
is important to note that the technical team does not have access to any cost information. This
is only evaluated by the cost team and will be discussed later in this section.
Table 3.1 Color Rating Definition
Color Rating
Blue Exceptional
Green
Yellow
Red
Acceptable
Marginal
Unacceptable
Definition
Exceeds specified performance or capability in a beneficial way to the Air Force; and high probability of satisfying the requirement; and has no significant weakness
Meets evaluation standards; and has a good probability of satisfying the requirement; and any weaknesses can be quickly corrected.
Fails to meet minimum evaluation standards; and has a low probability of satisfying the requirement; and has significant deficiencies but correctable.
Fails to meet the minimum requirement; and deficiency requires major revision to the proposal to make it correct.
Source: AFR 70-30 Appendix B, 27 April 1988 , p 10
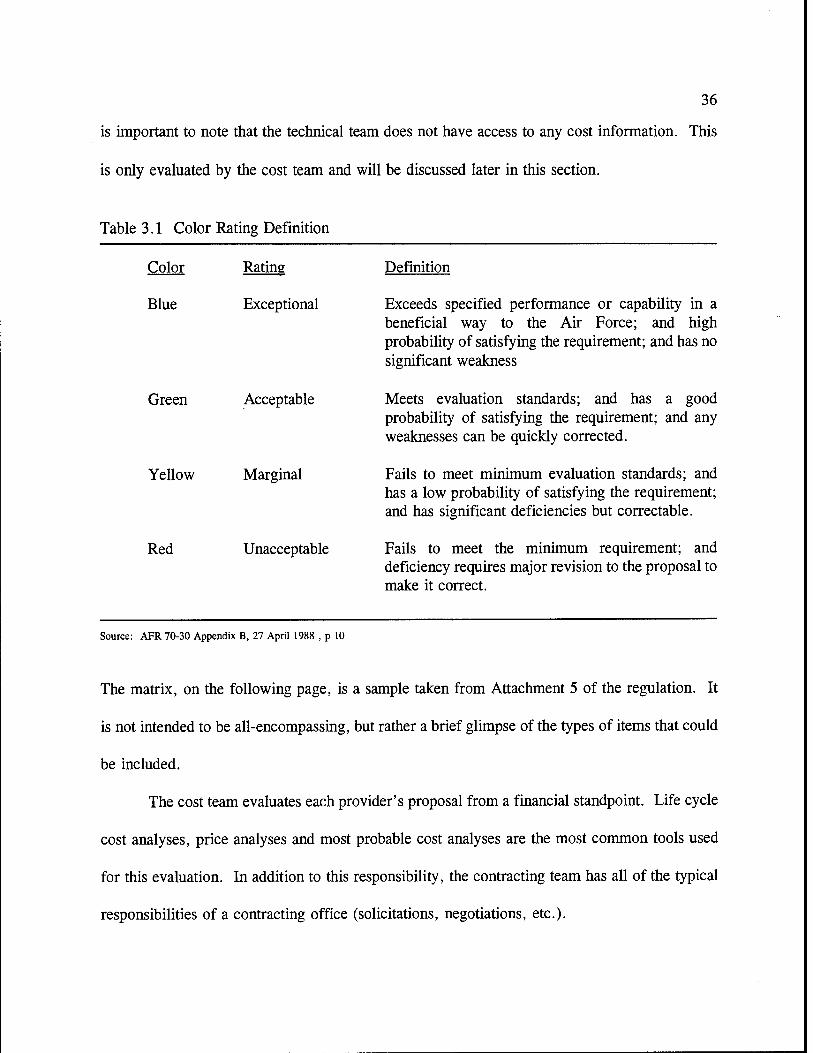
The matrix, on the following page, is a sample taken from Attachment 5 of the regulation. It
is not intended to be all-encompassing, but rather a brief glimpse of the types of items that could
be included.
The cost team evaluates each provider's proposal from a financial standpoint. Life cycle
cost analyses, price analyses and most probable cost analyses are the most common tools used
for this evaluation. In addition to this responsibility, the contracting team has all of the typical
responsibilities of a contracting office (solicitations, negotiations, etc.).

ITEM
SUMMARY
/ 'G(L)
Item
Reliability Maintainability Producability
Soundness Of
Approach
/ G
Understanding Of
Requirement G
Compliance With
Requirement G
AREA: TECHNICIAL DESIGN AND INTEGRATION
Y(M)
Item Systems
Engineering and
Integration
Y(M)
Item
Airframe Design
R(H)
Item Weapon Control Systems Design
Arrows indicate change since initial evaluation of proposal Abbreviations: R = red, Y = Yellow, G = Green, B = Blue, H = High Risk, M = Moderate Risk, L = Low R
B(L)
Item
Communi- cations Design
37
Figure 3.2 Sample Evaluation Matrix Source: AFR 70-30 Appendix B, 27 April 88, Attachment 5, p 21
The final contract and technical team evaluations are utilized by the SSET to produce the
Proposal Analysis Report (PAR). The PAR summarizes the strengths and weaknesses of each
of the proposals. It includes all matrices and cost analyses completed. The PAR is then
forwarded to the SSA for final selection.
Strengths. There are two positive attributes in the Streamlined Source Selection
Procedures worthy of note in the context of this report. As the title suggests these procedures
are markedly shorter and easier to facilitate than previous methods attempting to include factors
other than price. Several engineering and contracting officers contacted during the initial
surveying were quick to praise the streamlined nature of these procedures. When asked why

38
they believed this system was praiseworthy, they universally credited the ease of use and the
"shortness" of the procedures. The second significant characteristic of this system is its attempt
to quantify performance as a means of evaluating contractors and using this information to
contribute in the award process. AFR 70-30 Appendix B clearly states in paragraph 17 that past
performance is an acceptable example of an assessment criteria.
Fallacies. The inconsistencies with the streamlined procedure are markedly more notable.
The primary goal of the regulation is to provide contracting officers with a vehicle to
award contracts based on the offeror's ability to perform in concurrence with the government's
needs. It attempts to do this by providing technical proposals to be evaluated by the people
who possess the knowledge to differentiate between alternatives coupled with cost proposals to
be analyzed by the financial experts. This appears to be a valid approach. However, there are
several problems inherent to this concept:
1. The FAR requires the solicitation to contain all assessment criteria. Contractors write their proposals around these criteria. Seldom is research involved to validate any information other than financial reportings. Therefore, the award is based on how well the contractor professes their ability to accomplish the items that the government announced were part of the evaluation.
2. Price can not be divorced from performance. Contractors must be allowed to keep their "fair" share of the value added nature of quality work.
3. Technical experts do not possess enough information to be able to differentiate between offerors (Kashiwagi, 1994). Therefore, the predetermination of performance standards is, at best, an educated guess. This "education" comes not only from experience and skill as an engineer (or other technical expert), but also from marketing material published by performing and non-performing manufacturers alike. The environment is saturated with unproven claims about performance.
4. Financial experts do not typically possess enough technical background to

39
understand the true value of performing work. However, the author proposes that this should also work to the benefit of the Air Force, when present in moderation. Used correctly, it should prevent needless over expenditures, commonly called "gold-plating."
Summary. AFR 70-30 attempts to provide a vehicle that includes past performance as
a means for future awards. However, it cannot because the mechanism it offers as a measure
of performance does not quantify actual performance. It measures contractor-prepared
marketing. This may appear to be a bold statement; however, after analyzing the range of the
initial data collected, it is clear that the current system can not differentiate between performers
and non-performers prior to award.

40
Concluding Remarks
This chapter has discussecLthe intent and the methodology inherent in AFR 70-30
Appendix B, Streamlined Source Selection Procedures. It has put forth the events that led to
the inclusion of this regulation in the report. The chapter has presented the foundations of the
current Air Force procurement environment. It has demonstrated that past performance is an
acceptable assessment tool under the FAR (Ichniowski, 1994) (AFR 70-30 Appendix B). It has
demonstrated that current mechanisms simply do not measure true performance-they measure
marketing. This assessment is bolstered by a recent quote of Mr. Harry Mellon (now retired
from Army service and a promoter of JOC usage), "Procurement (ofJOC's by the military) is
now a one-year process of low-bids. Technical proposals in the 1980's meant something. Today
they don't. Everyone (contractors) is max'd out at the technical level and it boils down to
price!" Mr. Mellon offered the award of multiple JOC's as a possible solution. In this manner,
the non-performing contractor is simply not issued any additional job orders. This is an
attractive solution to metropolitan JOC's. Baltimore, Maryland currently has three non-
jurisdictional JOC's completing job orders. However, it is unrealistic that smaller installations
across the military can generate enough work to merit multiple JOC awards.
It is a goal of this report to provide the military, especially the United States Air Force,
a mechanism that can save critical construction funding while: permitting perfect competition,
increasing the performance of procured systems, and stabilizing the construction industry as a
whole. This mechanism must address the shortfalls of the existing procurement strategies
presented in this literature review. The author promotes the performance-based system as this
mechanism.

Chapter Four
METHODOLOGY &
CONSTRUCTION INDUSTRY STRUCTURE
Methodology
Introduction
The primary objectives of this report are:
1. To quantify the performance of JOC's, specifically JOC's in the United States military.
2. To verify the need for a performance-based evaluation of these contractors.
3. To demonstrate that current procurement practices for JOC's are non- competitive.
A secondary objective is to identify actions the military can take to assist in the long term
improvement and stability of the construction industry and its ability to consistently
improve and provide a quality construction product. As discussed in Chapter 3, the Air
Force has attempted to address the shortfalls of past procurement policies with the
Streamlined Acquisition Regulation. The shortcoming of this effort has been the minimal
impact on the product quality of construction contractors and overall performance. This
statement is supported by the range of the data that will be discussed in Chapter 5. This
performance is perceived as steadily declining (more expensive, lower performance,
shorter performance period) (Kashiwagi, 1991)(Kashiwagi, 1994).
42
Overview
Theories from industrial engineering research, premises from Demming's Total
Quality Management, and philosophies from the science of Fuzzy Logic will be presented
in this chapter. These ideas will be used to characterize the Performance-Based
Evaluation and Procurement System as developed by Kashiwagi (1991). At the
conclusion of this chapter, an overall summary of these topics and their application to
the JOC evaluation will be presented.
Forward Chaining and Backward Chaining
The majority of studies performed in the construction industry use the
conventional process of problem solution by moving from a given data set to a solution.
A second and newer method used in computers and artificial intelligence is to move from
a well defined goal backwards to a data set or sub-goal. The first method, a data driven
search often called "forward chaining," starts with the facts of a problem.
Mathematically proven rules are used to generate new facts and the operation is repeated
until the new facts satisfy the final goal condition. Mathematically proven rules or
techniques include the tools of probability and statistics. Solving construction industry
structure problems using forward chaining or data driven searches has several problems
(Luger & Stubblefield, 1989):
1. Construction delivered products, unlike the typical manufacturing product, are affected by many more external factors. The construction environment, skill of the constructor, management skills, design of the constructed product, facility owner requirements, economic condition of the area, and the laws and regulations governing the procurement of construction all affect the finished product and are continuously changing. Therefore, defining the given data set is difficult.
43
2. There is a lack of construction performance data. Performance data has not been compiled on products, constructors, or construction systems.
3. Problems with the construction industry are difficult to pin point.
4. Statistical studies may lead to results which do not correspond with actual conditions. For example, Steven Allen's study determined that on large projects, signatory labor was 29% more economical than "open shop" labor. If this condition is true, over a period of time, large construction projects should be dominated by constructors utilizing union labor and non-union unemployment should be reduced significantly. There is no published evidence that supports this hypothesis. It is difficult for facility owners and constructors to implement the results of statistical studies that do not reflect actual trends in the construction industry.
An alternative method of solution derivation is called "backward chaining" or
"goal driven" data searches. This method first determines the goal condition, and works
repetitiously back to a sub-goal condition which matches the details of the problem.
Each iteration results in a sub-goal, which is a step closer to the goal representing the
problem. Goal driven searches use knowledge about the goal to eliminate branches of
space to search. Backward chaining is more efficient in the following situations (Allen):
1. The problem involves many complex rules and relationships that can produce a large number of new conclusions.
2. Goals (success criteria) can be easily stated for the problem.
Fuzzy Logic
Fuzzy logic was developed by Zadeh (1965) in response to the inability of
traditional mathematical and statistical tools to quickly and accurately identify
relationships of factors to give meaningful information. Using the concepts of relativity,
Zadeh introduced fuzzy logic to bypass the task of defining an infinite number of
relationships. Instead he measured the "amount of information" present to determine

44
critical relationships. The mathematical proof of fuzzy logic is based on the "Heisenberg
Uncertainty Principle," the "Pythagorean Theorem," and the "Cauchy-Schwarz
Inequality Principle" (Kosko, 1993). These concepts will be elaborated in the
following sections.
Fuzzy logic has several similarities with the "backward chaining" data search
mechanism. Fuzzy logic concentrates on input and output, measuring and defining
solution states using relativity. The main objective of fuzzy logic is not to identify
relationships, but to make decisions on solutions based on relative information or
differences between sub-goals. Proponents of statistical studies claim that statistical
based models are capable of duplicating solutions derived through fuzzy logic. The
objective of this report is not to compare the efficiency of fuzzy logic with the more
traditional statistical approach, but to use the economics of the fuzzy logic philosophy
(due to its similarity of backward chaining of selecting only pertinent sub-goals or
factors) in combination with backward chaining to identify actions that will permit the
selection of the best price, best performing provider and lead to the stabilization of the
construction industry.
The tenets of fuzzy logic are: (1) all things are deterministic, (2) results are
always related to specific causes, and (3) all events have causes and reactions based on
physical laws or relationships between entities. Physical laws are merely the description
of the interaction of factors over time. Physical laws, because they are descriptions of
reality, can be discovered or perceived but not created. For example, before fire and
combustion was discovered by man, the law of combustion existed. In other words, the
45
lack of knowledge of the law of combustion did not prevent man from using fire. If this
concept of laws is correct, the following conclusions can be made (Kashiwagi, 1991)
(Kosko, 1993):
1. The number of laws do not change over time. They are only "newly perceived" or "discovered."
2. The more information one can gain of laws (or factors) pertaining to an event, the greater accuracy a person will have to predict the outcome of any event.
If all the details of a coin flip could be gathered (velocity, acceleration, angle of the thumb, the angle which the descending coin strikes the hand, the affect of the air, etc) the outcome of the flip would be very predictable. This is because the world is deterministic.
3. The more information one has about an event, the less value the results of probability and statistical analysis have. This seemingly ironic statement can be proven using the following simple case of probability.
Two people are trying to decide who will perform a task first. One person pulls out a coin and unseen by the other person, puts it in one of her hands. The second person attempts to guess which hand the coin is placed in. The second person's probability of guessing correctly is 1 of 2, or .50 probability of being correct if either hand is chosen. However, if the first person was guessing, the probability would be 1 of 1, or 1.00 of being correct. The first person would never predict incorrectly. The difference between the first and second person, is the first person has more information. As information increases, the applicability and value of probability decreases.
4. Because the world is deterministic (governed by laws, known or unknown) true randomness does not exist. Because all events have causes and effects, they can be reproduced if all of the information pertaining to an event is available. Again, an example will support this statement.
A lottery is supposed to be "completely random" selection of six numbered balls out of 40. However, if all the information pertaining to the release of the balls (timing, weight, length of time in the mixer, interactive forces between the balls, etc) could be

46
gathered, the results would be quite predictable.
5. All events are related in some degree. Some events will have more of an effect on other events. Opponents of this philosophy do not believe this statement. Proponents would argue that law governing this interaction has not been "perceived" or "discovered" yet.
Fuzzy logic permits a perceptive, relative description of an environment or state
to be quantified and measured against other "states" without describing the relationships
between the states. The differential between "states" will identify the critical elements
or lmkings between the current construction industry and a more stable industry
structure.
Heisenberg uncertainty principle. In the late 1920s, Werner Heisenberg
developed his uncertainty principle for quantum mechanics. The essence of this principle
is in the statement "The closer you look, the less you see" (Kosko, 1993). This is
explained through the example of the relative information available about an automobile's
position and velocity at a specific instant in time. The velocities discussed here are
extreme. The uncertainty lies in the fact that the more you know about the velocity the
less you know about the car's position. Consider the bell curves below (Kosko, 1993).
1 , 1
A
Car Position Car Velocity
Figure 4.1 Uncertainty Principle Diagram. Source: Kosko, Bart (1993) Fuzzy Thinking. Chapter 7, page 106. Hyperion, New York
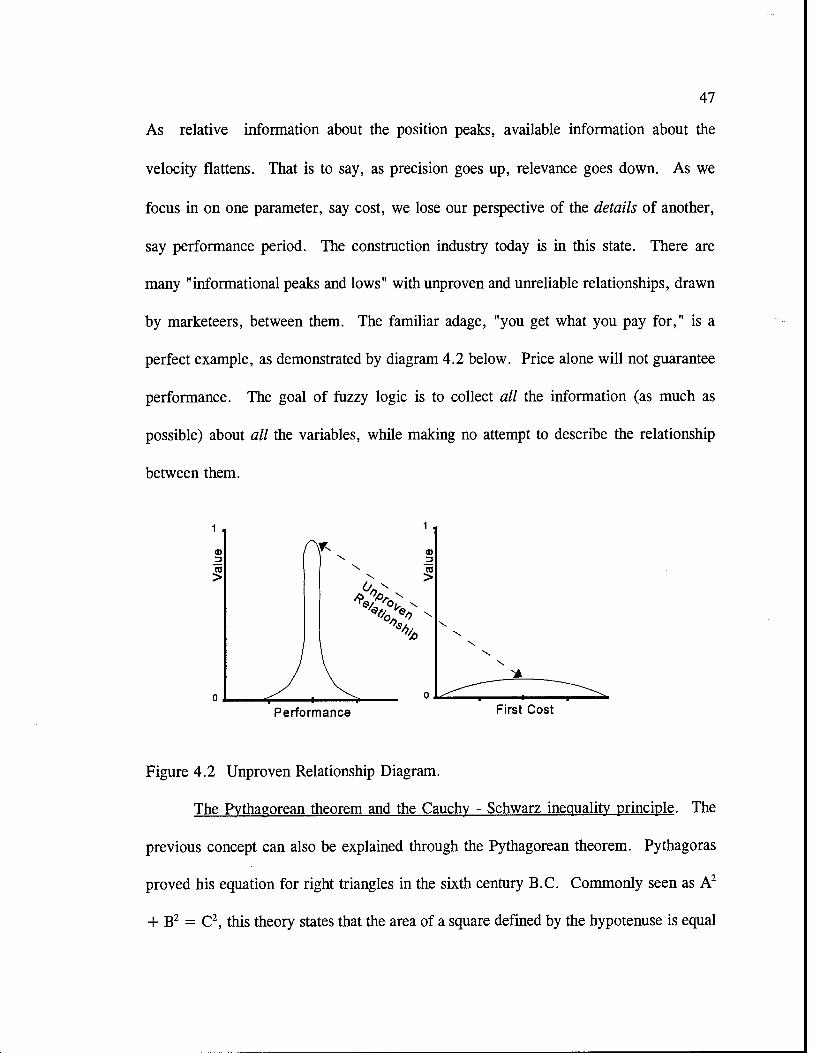
47
As relative information about the position peaks, available information about the
velocity flattens. That is to say, as precision goes up, relevance goes down. As we
focus in on one parameter, say cost, we lose our perspective of the details of another,
say performance period. The construction industry today is in this state. There are
many "informational peaks and lows" withunproven and unreliable relationships, drawn
by marketeers, between them. The familiar adage, "you get what you pay for," is a
perfect example, as demonstrated by diagram 4.2 below. Price alone will not guarantee
performance. The goal of fuzzy logic is to collect all the information (as much as
possible) about all the variables, while making no attempt to describe the relationship
between them.
1 ,
A*
'% ''f>
Performance First Cost
Figure 4.2 Unproven Relationship Diagram.
The Pythagorean theorem and the Cauchv - Schwarz inequality principle. The
previous concept can also be explained through the Pythagorean theorem. Pythagoras
proved his equation for right triangles in the sixth century B.C. Commonly seen as A2
+ B2 = C2, this theory states that the area of a square defined by the hypotenuse is equal

48
to the sum of the areas of squares defined by the legs of a 90 degree triangle. If the
square defined by the hypotenuse "C" represents the total amount of information known,
as precision (information) increases about either leg "A" or "B" the remaining leg
correspondingly decreases. See Figure 4.3 below.
B
Figure 4.3 Pythagorean Diagram. Source: Kosko, Bart (1993) Fuzzy Thinking. Chapter 7, page 112. Hyperion, New York
The Pythagorean condition also describes the optimum (orthagonal) solution, when two
abstract objects or pieces of information intersect (Kosko, 1993). Consider the following
figures 4.4 - 4.6. Figure 4.4 is two points in space. Figure 4.5 is the same two points
with vectors drawn from a common starting point. Figure 4.6 shows the perpendicular
distance between them. Returning to the Heisenberg velocity and position example and
overlaying the Pythagorean conditions permits the gleaning of the true amount of
information represented by the two data points. See figure 4.7.
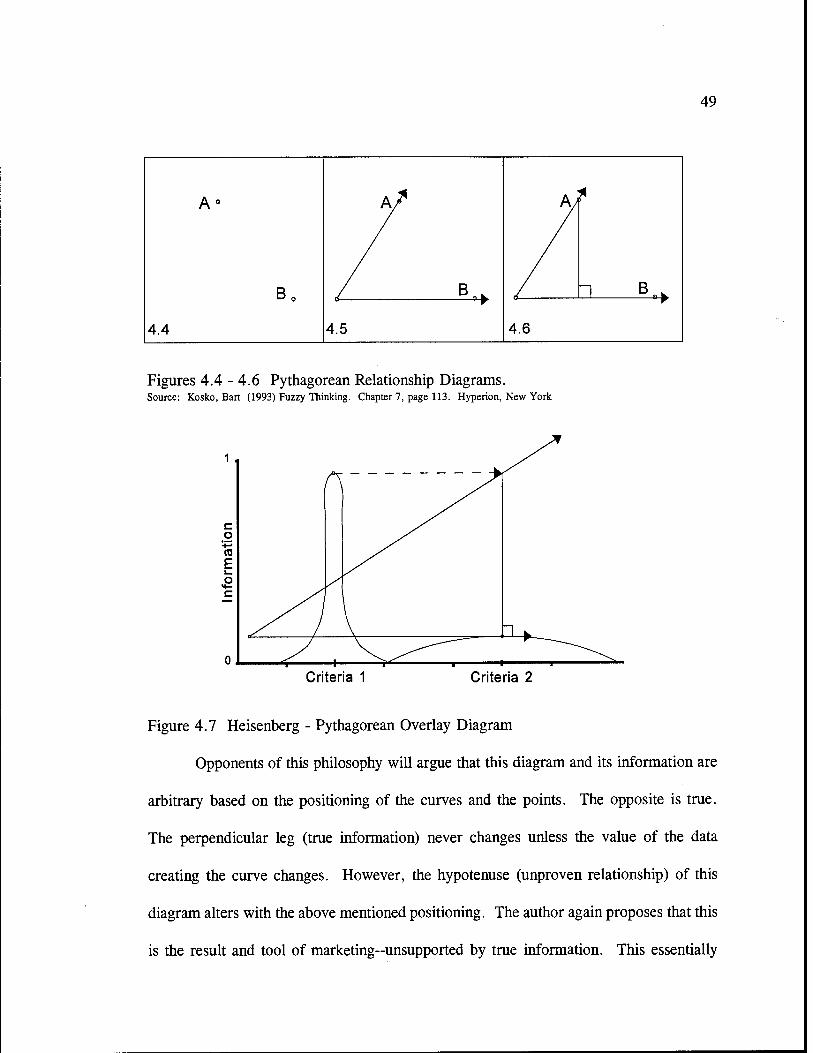
49
A0
B0
4.4
A/
Z B^ 4.5
Ay
"I B_
4.6
Figures 4.4-4.6 Pythagorean Relationship Diagrams. Source: Kosko, Bart (1993) Fuzzy Thinking. Chapter 7, page 113. Hyperion, New York
Criteria 1 Criteria 2
Figure 4.7 Heisenberg - Pythagorean Overlay Diagram
Opponents of this philosophy will argue that this diagram and its information are
arbitrary based on the positioning of the curves and the points. The opposite is true.
The perpendicular leg (true information) never changes unless the value of the data
creating the curve changes. However, the hypotenuse (unproven relationship) of this
diagram alters with the above mentioned positioning. The author again proposes that this
is the result and tool of marketing-unsupported by true information. This essentially

50
defines the Cauchy - Schwarz inequality principle. It relates the amount of information
to the relative certainty about any one criteria. As this distance decreases to zero (lines
converge), the relative information about one of the criterion reaches a maximum and
uncertainty reaches an absolute minimum. Correspondingly, the uncertainty about the
other criterion reached a maximum. Consider marketing versus performance. As
emphasis increases (uncertainty decreases) on marketing, information decreases
(uncertainty increases) regarding proven performance.
Performance criteria
Overview. Although the actual number of criteria is not critical, it is important
that the performance factors accurately describe the owner's requirements. Standard
practices attempt to use detailed and complex specifications to describe these
requirements. As the number of litigations in the construction industry has increased,
so has the amount of detail in these specifications (Badger, 1993). More often than not
these specifications attempt to predict and ensure performance through the use of
standard tests, thicknesses, and other physical characteristics. However, these do not
reflect performance. Few owners or owner's representatives can recite ASTM
(American Society of Tests and Materials) test numbers to describe their requirements.
However, most can verbally describe what they want accurately. In the case of a roofing
system for a computer chip production facility (where a roof leak mandates complete
shutdown), "I want a roof that doesn't leak." is accurate and concise. Thus, the number
of times a system has leaked versus the number of applications is a good performance
factor. Other performance factors can range from equivalent uniform annual cost to
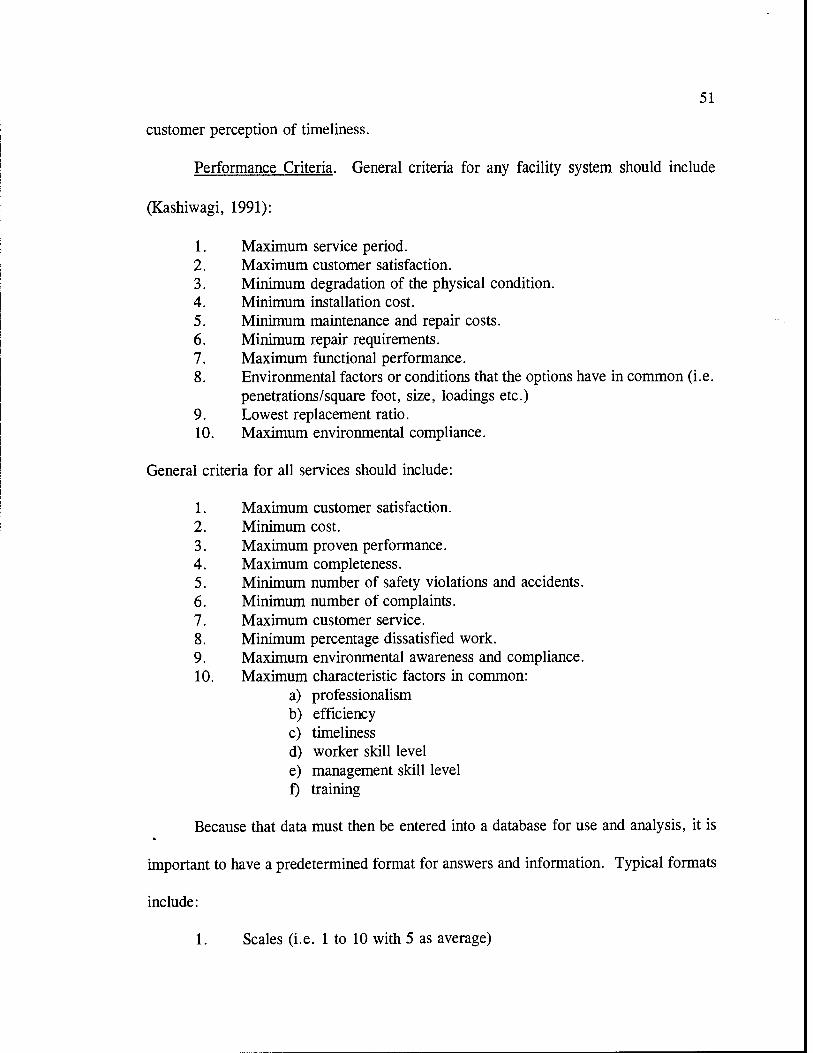
51
customer perception of timeliness.
Performance Criteria. General criteria for any facility system should include
(Kashiwagi, 1991):
1. Maximum service period. 2. Maximum customer satisfaction. 3. Minimum degradation of the physical condition. 4. Minimum installation cost. 5. Minimum maintenance and repair costs. 6. Minimum repair requirements. 7. Maximum functional performance. 8. Environmental factors or conditions that the options have in common (i.e.
penetrations/square foot, size, loadings etc.) 9. Lowest replacement ratio. 10. Maximum environmental compliance.
General criteria for all services should include:
1. Maximum customer satisfaction. 2. Minimum cost. 3. Maximum proven performance. 4. Maximum completeness. 5. Minimum number of safety violations and accidents. 6. Minimum number of complaints. 7. Maximum customer service. 8. Minimum percentage dissatisfied work. 9. Maximum environmental awareness and compliance. 10. Maximum characteristic factors in common:
a) professionalism b) efficiency c) timeliness d) worker skill level e) management skill level f) training
Because that data must then be entered into a database for use and analysis, it is
important to have a predetermined format for answers and information. Typical formats
include:
1. Scales (i.e. 1 to 10 with 5 as average)

52
2. Yes and no (for customer satisfaction, etc) 3. Raw numbers (number of complaints, percentage dissatisfied work, etc) 4. Selective options of text (government, unions, regulations, etc)
Whether the information is collected via actual, physical inspection (product) or through
surveys (service) it must then be converted to a numerical format. With the use of
current "off the shelf" spreadsheet software each performance factor can be quickly
transformed into information to construct a single performance line for each alternative.
The chosen software for this project is Quattro Pro for Windows by Borland International
Inc. of Scotts Valley, California.
Multi-Criteria Decision Making (MCDM)& the Displaced Ideal Model
Overview. The objective of the MCDM module is to competitively compare the
performance of alternative facility systems, constructors, or applications of a system
(Kashiwagi, 1991). This mechanism allows competitors to improve overall performance
by improving one (or more) of the performance criteria. The resultant should then be
the provider using "backward chaining" and "value chain analysis" to identify and
improve performance shortfalls. This process parallels the continuous improvement
foundation of Demming's Total Quality Management (Demming, 1991). These concepts
will be discussed later in this chapter. It also permits the performing provider to
understand and utilize the "value added" nature of quality work to charge higher prices.
Unproven systems or providers must charge a lower price to be competitive.
Performance criteria weighting. Weighting of the individual performance criteria
is intended to reflect the strategic plan of the owner. It permits tailoring of the
application to meet the user's current requirements whether low first cost, long service
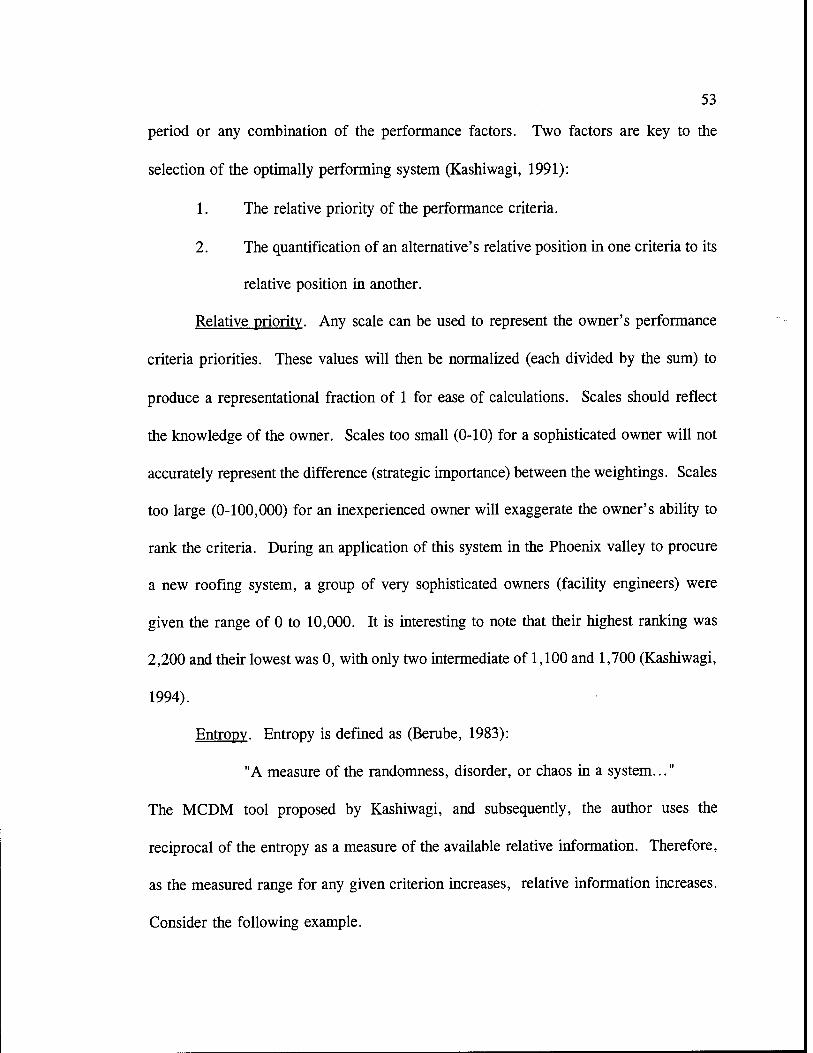
53
period or any combination of the performance factors. Two factors are key to the
selection of the optimally performing system (Kashiwagi, 1991):
1. The relative priority of the performance criteria.
2. The quantification of an alternative's relative position in one criteria to its
relative position in another.
Relative priority. Any scale can be used to represent the owner's performance
criteria priorities. These values will then be normalized (each divided by the sum) to
produce a representational fraction of 1 for ease of calculations. Scales should reflect
the knowledge of the owner. Scales too small (0-10) for a sophisticated owner will not
accurately represent the difference (strategic importance) between the weightings. Scales
too large (0-100,000) for an inexperienced owner will exaggerate the owner's ability to
rank the criteria. During an application of this system in the Phoenix valley to procure
a new roofing system, a group of very sophisticated owners (facility engineers) were
given the range of 0 to 10,000. It is interesting to note that their highest ranking was
2,200 and their lowest was 0, with only two intermediate of 1,100 and 1,700 (Kashiwagi,
1994).
Entropy. Entropy is defined as (Berube, 1983):
"A measure of the randomness, disorder, or chaos in a system..."
The MCDM tool proposed by Kashiwagi, and subsequently, the author uses the
reciprocal of the entropy as a measure of the available relative information. Therefore,
as the measured range for any given criterion increases, relative information increases.
Consider the following example.

54
A facility owner wishes to procure a new roof. Ten different constructors, offering ten different systems, bid nearly the same price for the job. The relative, decision-making information from price alone is very small.
As discussed previously the Heisenberg Uncertainty, Cauchy - Schwarz Inequality, and
the Pythagorean principles demonstrate that as the distance between relative values for
a given criterion increases, the amount of information that can be gleaned from that
criterion increases and thus, "reciprocal entropy" becomes smaller.
Variable interdependence. The MCDM tool must also address one other
important aspect of the performance criteria. Zeleny (1974) summarized the problem
accurately:
"... there is no single criteria of optimality, but rather a disconcerting mixture of conflicting, multiple, and noncommensurable intrapersonal as well as interpersonal objectives."
Because the world is deterministic and all events are related to some degree, attributes
(criteria) are not independent, the MCDM tool must address the "best of each."
Kashiwagi (1991) promotes the use of Zeleny's "displaced ideal" (1974) model,
Kashiwagi's concept of entropy, and performance criteria weighting to meet this
shortfall. The system selects the optimal value for each criteria and thus creates an
"imaginary optimum" alternative. Then each alternative is measured against this
optimum (through the amount of relative information presented by each criterion) to
determine a relative fuzzy distance from the imaginary, perfect solution. If one
alternative is the best in every criteria, it would dominate and have a fuzzy distance of
0.00. In any non-dominated case the highest performing system is the alternative with
the lowest fuzzy distance from the imaginary optimum. The displaced ideal model is also
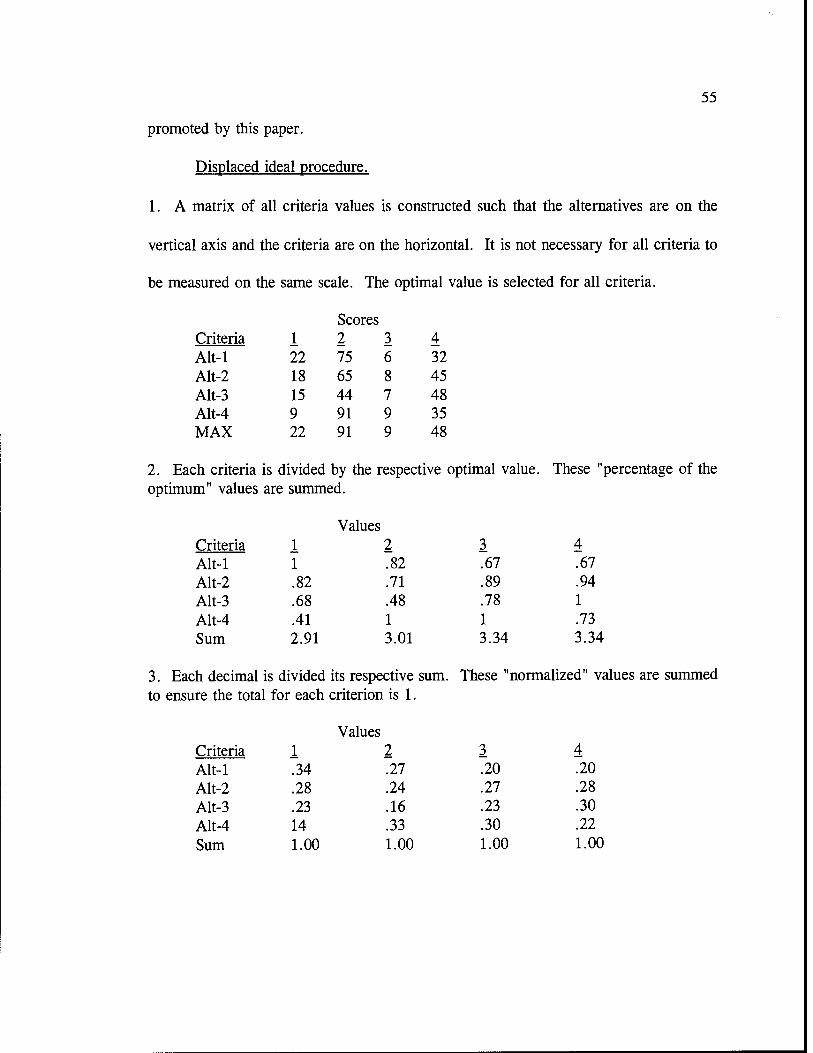
55
promoted by this paper.
Displaced ideal procedure.
1. A matrix of all criteria values is constructed such that the alternatives are on the
vertical axis and the criteria are on the horizontal. It is not necessary for all criteria to
be measured on the same scale. The optimal value is selected for all criteria.
Scores Criteria 1 2 3 4 AIM 22 75 6 32 Alt-2 18 65 8 45 Alt-3 15 44 7 48 Alt-4 9 91 9 35 MAX 22 91 9 48
2. Each criteria is divided by the respective optimal value, optimum" values are summed.
Values
These "percentage of the
Criteria 1 2 3 4 AIM 1 .82 .67 .67 Alt-2 .82 .71 .89 .94 Alt-3 .68 .48 .78 1 Alt-4 .41 1 1 .73 Sum 2.91 3.01 3.34 3.34
3. Each decimal is divided its respective sum. These "normalized" values are summed to ensure the total for each criterion is 1.
Values Criteria 1 2 3 4 AIM .34 .27 .20 .20 Alt-2 .28 .24 .27 .28 Alt-3 .23 .16 .23 .30 Alt-4 14 .33 .30 .22 Sum 1.00 1.00 1.00 1.00

56
4. Each normalized value is multiplied by the natural log of itself. These "natural log" values are summed.
Criteria 1 2 3 4 Alt-1 -.37 -.35 -.32 -.32 Alt-2 -.36 -.34 -.35 -.36 Alt-3 -.34 -.29 -.34 -.36 Alt-4 -.28 -.37 -.36 -.33 Sum -1.35 -1.35 -1.37 -1.37
5. The absolute value of each sum is multiplied by the reciprocal of the natural log of the number of alternatives. These values are summed.
Values Sum Criteria 12 3 4
.97 .97 .99 .99 3.92
6. The reciprocal of the difference between the number of alternatives and the previous sum is multiplied by 1 minus each criterion value. These values are multiplied by the owner's weighting for each criterion. The weighted products are then summed.
Criteria 12 3 4 Sum .45 .31 .11 .14
Weighting 24 19 21 36 Product 10.8 5.89 2.31 5.04 24.04
7. The products are normalized, producing a total weighted factor for all criteria.
Total Weighted Factor Criteria 12 3 4
.449 .245 .096 .210
8. A matrix is generated using 1 minus the values created in step two.
Values Criteria 1 2 3 4 Alt-1 0 .18 .33 .33 Alt-2 .18 .29 .11 .06 Alt-3 .32 .52 .22 0 Alt-4 .59 0 0 .27
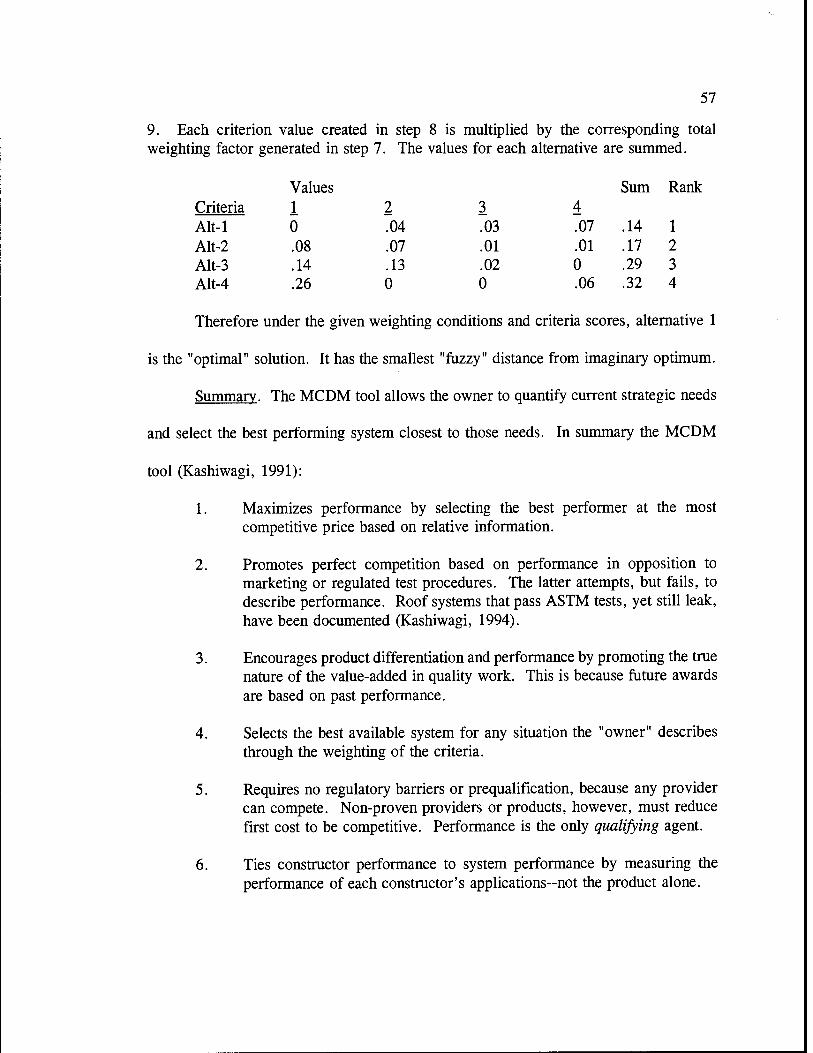
57
9. Each criterion value created in step 8 is multiplied by the corresponding total weighting factor generated in step 7. The values for each alternative are summed.
Values Sum Rank Criteria i 2 3 4 AIM 0 .04 .03 .07 .14 1 Alt-2 .08 .07 .01 .01 .17 2 Alt-3 .14 .13 .02 0 .29 3 Alt-4 .26 0 0 .06 .32 4
Therefore under the given weighting conditions and criteria scores, alternative 1
is the "optimal" solution. It has the smallest "fuzzy" distance from imaginary optimum.
Summary. The MCDM tool allows the owner to quantify current strategic needs
and select the best performing system closest to those needs. In summary the MCDM
tool (Kashiwagi, 1991):
1. Maximizes performance by selecting the best performer at the most competitive price based on relative information.
2. Promotes perfect competition based on performance in opposition to marketing or regulated test procedures. The latter attempts, but fails, to describe performance. Roof systems that pass ASTM tests, yet still leak, have been documented (Kashiwagi, 1994).
3. Encourages product differentiation and performance by promoting the true nature of the value-added in quality work. This is because future awards are based on past performance.
4. Selects the best available system for any situation the "owner" describes through the weighting of the criteria.
5. Requires no regulatory barriers or prequalification, because any provider can compete. Non-proven providers or products, however, must reduce first cost to be competitive. Performance is the only qualifying agent.
6. Ties constructor performance to system performance by measuring the performance of each constructor's applications-not the product alone.

58
The MCDM tool also encourages the following (these will be thoroughly discussed in the following section):
7. Encourages movement towards quadrant II of the Hrebiniak and Joyce "Organizational Adaptation" model (Kashiwagi, 1991). This quadrant is defined by differentiation by performance at a competitive price.
8. Promotes stabilization of the construction industry as defined by Porter and Kashiwagi (1991) by completing the above listed actions. Again, this will be elaborated in the following section.

59
Construction Industry Structure
Introduction
Tools proven in the manufacturing industry will be introduced to analyze the
construction industry structure. In addition to the concepts mentioned in the previous
section, these will include:
1. Industry structure stability as defined by Porter and Kashiwagi. 2. Industry structure sectors as defined by Hrebeniak and Joyce and
subsequently by Kashiwagi. 3. Demming's 14 points of total quality.
Industry Structure Stability
Porter (1985) and Kashiwagi (1991) identify the critical elements required for a
stable industry. Defined by Kashiwagi, a stable construction industry must have the
ability to continually improve the performance of its product. Several tenets are
necessary to promote this stability. They include:
1. Differentiation by product performance. 2. The need of industry participants to keep a fair share of the value added
nature of a quality product. 3. Totally open and fair competition based on performance. 4. Buyer protection beyond the minimum liability protection of the industry
participant. 5. Entry and exit barriers for industry practioners based on performance.
It is important to note that industry instability does not preclude the possibility of
current participants producing performing products. However, it does confirm that the
current industry environment is non-competitive, because non-performing and performing
providers are both participating.
Differentiation of product performance. Porter (1985) defines generic
differentiation as:
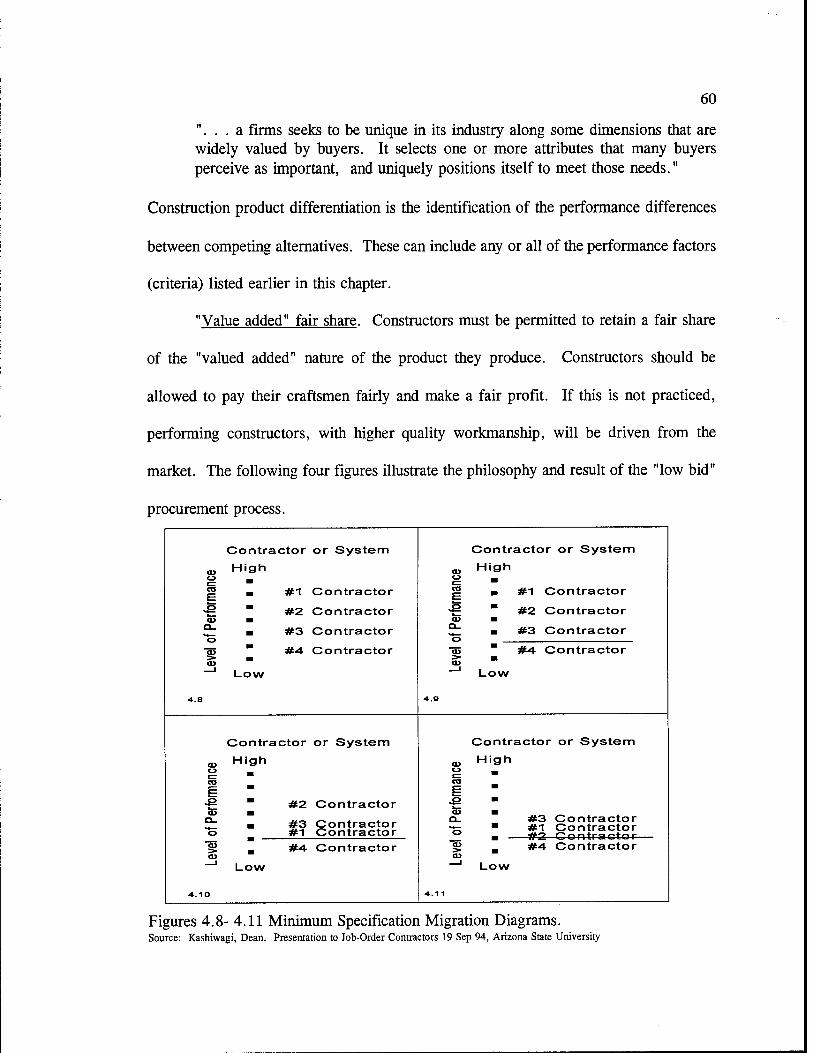
60
". . .a firms seeks to be unique in its industry along some dimensions that are widely valued by buyers. It selects one or more attributes that many buyers perceive as important, and uniquely positions itself to meet those needs."
Construction product differentiation is the identification of the performance differences
between competing alternatives. These can include any or all of the performance factors
(criteria) listed earlier in this chapter.
"Value added" fair share. Constructors must be permitted to retain a fair share
of the "valued added" nature of the product they produce. Constructors should be
allowed to pay their craftsmen fairly and make a fair profit. If this is not practiced,
performing constructors, with higher quality workmanship, will be driven from the
market. The following four figures illustrate the philosophy and result of the "low bid"
procurement process.
is Le
vel o
f Per
form
ance
Contractor or System High
■ #1 Contractor
™ #2 Contractor
■ #3 Contractor
" #4 Contractor
Low
(0
Leve
l of P
erfo
rman
ce
Contractor or System High
■ #1 Contractor
™ #2 Contractor
■ #3 Contractor
™ #4 Contractor
Low
°
Le
vel o
f Per
form
ance
Contractor or System
High
" #2 Contractor
■ #3 Contractor #1 Contractor
Leve
l of P
erfo
rman
ce
Contractor or System
High
#3 Contractor ■ #1 Contractor
Low
#4 Contractor m #4 Contractor
Low
Figures 4.8-4.11 Minimum Specification Migration Diagrams. Source: Kashiwagi, Dean. Presentation to Job-Order Contractors 19 Sep 94, Arizona State University
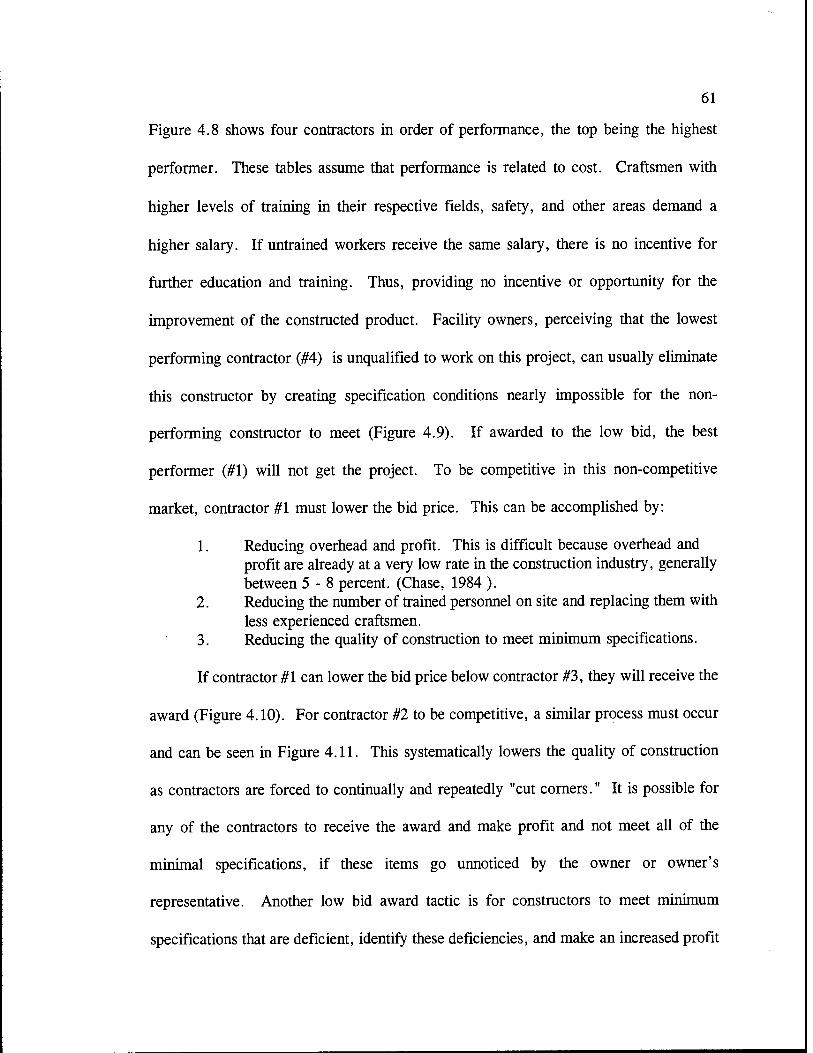
61
Figure 4.8 shows four contractors in order of performance, the top being the highest
performer. These tables assume that performance is related to cost. Craftsmen with
higher levels of training in their respective fields, safety, and other areas demand a
higher salary. If untrained workers receive the same salary, there is no incentive for
further education and training. Thus, providing no incentive or opportunity for the
improvement of the constructed product. Facility owners, perceiving that the lowest
performing contractor (#4) is unqualified to work on this project, can usually eliminate
this constructor by creating specification conditions nearly impossible for the non-
performing constructor to meet (Figure 4.9). If awarded to the low bid, the best
performer (#1) will not get the project. To be competitive in this non-competitive
market, contractor #1 must lower the bid price. This can be accomplished by:
1. Reducing overhead and profit. This is difficult because overhead and profit are already at a very low rate in the construction industry, generally between 5-8 percent. (Chase, 1984 ).
2. Reducing the number of trained personnel on site and replacing them with less experienced craftsmen.
3. Reducing the quality of construction to meet minimum specifications.
If contractor #1 can lower the bid price below contractor #3, they will receive the
award (Figure 4.10). For contractor #2 to be competitive, a similar process must occur
and can be seen in Figure 4.11. This systematically lowers the quality of construction
as contractors are forced to continually and repeatedly "cut corners." It is possible for
any of the contractors to receive the award and make profit and not meet all of the
minimal specifications, if these items go unnoticed by the owner or owner's
representative. Another low bid award tactic is for constructors to meet minimum
specifications that are deficient, identify these deficiencies, and make an increased profit

62
in the change order items (Badger, 1993)(Chasel994)(Kashiwagi, 1994).
The process outlined in figures 8 through 11 represents the gravitation from high
performance to minimum specifications, which frequently have little correlation to
performance(Kashiwagi, 1991).
Totally competitive environment. A stable construction industry is a freely
competitively industry and must include:
1. A competitive provision of each provider's product. 2. Determination, by the facility owner, of the performance of each product
from each contractor. 3. Competitors receive their fair share of the " valued added" nature of quality
performance. 4. Deficient performers are penalized.
Buyer protection. Facility service periods are indefinite. Therefore, standard
one-year warranties provide little protection and little proof that the system or service
being purchased is the best that the industry presently offers. The performance-based
system permits selection of an alternative with a proven performance period.
Entry and exit barriers. Barriers must be in place to prevent unqualified
contractors from constructing facilities. Constructors must also be prevented from
leaving the industry and avoiding the ramifications of their poor construction. The
seemingly opposing requirements of the construction industry are completely free
competition, but to only those who qualify (perform).
Industry Structure Diagram
Kashiwagi first studied Hrebiniak and Joyce's industry structure diagram (Figure
4.12) to determine the present state of the construction industry. This diagram plots
competition versus performance. Quadrant 1 is the lower right hand corner and is an

63
arena of high competition and low performance. This is the "low bid," minimum
specification environment with the ramifications described previously. Quadrant 3 is the
upper left hand corner and is a climate of high performance and low competition.
Quadrant III Quadrant II High Strategic Choice Differentiation
Differentiated by Performance
0 o r High Emphasis on Means
(0 E o 1_
Qi LL Quadrant IV Quadrant 1
Unstable Environment Minimum Choice Cost Leader Emphasis on Means
Environmental Determinism
Figures 4.12 Organizational Adaptation Model. Source: Kashiwagi, Dean T (1991) Development of a Performance Based Design/Procurement System for Non-Structural Facility Systems. Dissertation. Arizona State University
Procurement systems of this quadrant include sole-sourcing and negotiated contracts,
where performance is the driving concern not cost. The shortfall of this quadrant is the
"perceived" high cost due to the lack of competition, although, as discussed previously,
it is possible that this cost is "fair." Quadrant 4 is a temporary, unstable environment
that appears periodically as a new contractor carves a niche in the construction industry.
This quadrant is dominated by low price and low competition coupled with low
performance. With ever-shrinking facility maintenance budgets, fewer owners are
willing to chance the possibility of high performance with low competition and low price
(Phoenix Roundtable, 1994). Constructor's in Quadrant 4 must raise performance and

64
migrate to quadrants 1 or 3 to garner awards. Quadrant 2 is the most stable of the four
and is the performance-based quadrant. This environment is one of high competition
among performers, because constructor and product performance is tied to price.
Facility owners in Quadrant 1 (who seek higher performance) and in Quadrant 3 (who
seek more competition) will migrate to Quadrant 2.
Significant conclusions drawn from Kashiwagi's industry diagram include:
1. The quadrant can be represented by procurement systems:
a) Quadrant 1: Low bid, with a low level of proven performance. b) Quadrant 2: Performance-based. c) Quadrant 3: Negotiated, sole source and partnering. d) Quadrant 4: Low bid, with no proven performance.
This is demonstrated in Figure 4.13 below.
O o w
Quadrant /// Partner/n'ff ~ ~ "
Negotiated B/ds So/e Source
Quadrant it ■Performance-Basad
Awards
' Quandrant tV ■ / Quadrant/ 'Low Bid and ,' / Low Bid
'Short-Term. UnsJabjfify./. Product.Dec/Jne. . Long-Term instability
Competition
Figures 4.13 Construction Industry Structure Diagram. Source: Kashiwagi, Dean T., William C. Moor, and J Pablo Nuno. (1994) Optimizing Facility Maintenance Using Fuzzy Logic and the Management of Information. ICC & IE, Industrial Engineering Conference.

65
2. Due to this representation, logic dictates that the owner-selected procurement process describes and drives the state of the industry.
3. Facility owners can have a great impact on the stability of the construction industry by the selection of the procurement process.
4. The degree of stability of the construction industry is measured by the percentage of contracts awarded by the performance-based system (Kashiwagi, et al).
The previous discussion is bolstered by a recent Office of Management and
Budget (OMB) directive permitting the procurement of constructors based on past
performance. It is also supported in the private sector by major manufacturers
(Motorola, General Motors, IBM and others) using this system to procure contracts in
the Phoenix valley and across the United States.
Demming's 14 Points of Continuous Improvement
"The 14 points apply anywhere, to small organizations as well as to large ones,
to the service industry as well as to the manufacturing. They apply to a division within
a company" (Demming, 1991). The major thrust of each of the 14 points is listed below
(Demming, 1991).
1. Create a constancy of purpose toward improvement. 2. Adopt a new leadership philosophy. 3. Cease dependence on inspection to achieve quality. 4. End the practice of awards based solely on cost. 5. Constant improvement. 6. Institute training. 7. Institute leadership. 8. Drive out fear. 9. Breakdown barriers, become team oriented. 10. Eliminate slogans. 11. Eliminate quotas. 12. Remove barriers that remove the pride of workmanship. 13. Institute education and self-improvement. 14. Everyone in the company must work to accomplish these tasks.

66
Although nearly all of these tenets can be broadly applied to the performance-based
system, only the following points will be elaborated.
1. Continuous improvement of performance. 2. Low tolerance for poor performance. 3. Eliminate the need for inspection by building quality into the product. 4. Eliminate awards based solely on low price. 5. Continually educate and train. 6. Drive out the fear. 7. Implement policies to accomplish the above.
Continuous improvement. The identification that current practices (low bid and
negotiated awards) are non-competitive, is the first, most difficult step to take in
implementing continuous improvement.
Low tolerance for poor performance. Contracts awarded via the low bid system
force minimum and marginal performance, as previous discussed.
Eliminate inspection. Deficiency lists at the end of the project should not be the
responsibility of the owner or owner's representative. They should fall under the
responsibilities of the constructor. Deficiency lists are the result of poor performance.
Since future awards will be based on the constructor's performance on the current and
past jobs, non-performing constructors will not be awarded more work and be forced out
of the marketplace or to improve the performance of their product.
Training and education. Training is a large part of performance. Constructors
who are not permitted to keep a "fair share" of the value added nature of performing
work, will not have the resources to train and educate. This leads to an ever-decreasing
spiral of the quality of the constructed project.

67
Drive out the fear. Past attempts to apply optimization strategies to the
construction industry, often improperly used, have frequently resulted in reducing the
size of the work force (Chase, 1994). This has created a "produce or else" mindset that
is in direct opposition to Demming's point number 12--remove the barriers to pride of
workmanship. The performance-based system encourages the continual improvement of
the constructed produce, and therefore, encourages the work force to optimize their
efforts not based on the "fear" factor but based the goal of obtaining future work and
improving quality of life. This is an important step for the construction industry.
Continuous improvement policies. The following activities support the
implementation of the above activities:
1. Collection of performance data. 2. Publication of the analyzed performance information. 3. Use of this information to set new, higher standards of performance. 4. Implementation of training programs. 5. Reward performers by basing procurement on performance.

68
Application Summary
This report has used backward chaining to describe the environment necessary to
stabilize the JOC industry. This "stabilized" environment is characterized by high
competition and high performance. However, to encourage the current industry to
migrate to this environment, relative performance of constructors, products and systems
must be determined. This performance must then be utilized to award future contracts-
in affect tieing constructor performance to product performance. The current JOC
industry is characterized by high competition with little differentiation by true
performance. As discussed in Chapter 3, the United States Air Force attempted to
provide a mechanism to quantify performance, but failed. The author promotes the use
of the Performance-Based system as developed by Kashiwagi (1991) to meet this
requirement. The Performance-Based system uses performance information (customer
satisfaction, etc) instead of operational information (financial stability, etc.) to evaluate
the relative performance of the providers. Demming's tenets of continuous improvement
and low tolerance for poor performance emphasize the relationship of this performance
information to construction industry stability. This system applies the mathematical
proofs of Fuzzy Logic to eliminate the task of defining the inter-relationships of variables
in the construction arena and permits the gleaning of relative performance information.
The system uses a function of the reciprocal of the variable entropy to accomplish this
gleaning. The mechanism proposed-by Kashiwagi, and subsequently the author-to
quantify this fuzzy information is the displaced ideal model. This model evaluates the
range of the value points relative to the amount of information present, to rate each

69
contractor against the "imaginary optimum" that is offered by the measured criteria.
Tailoring to any strategic requirement of the facility owner is then facilitated through the
weighting of the performance criteria.

Chapter Five
DATA COLLECTION, ANALYSIS & RESULTS
Objectives of this Chapter
The purposes of this chapter are:
1. To quantify the performance JOC's, specifically JOC's in the United States Military.
2. To identify a differential in JOC performance to demonstrate that a performance-based system is required. This is opposition to current beliefs because, as stated by Kashiwagi (1994), the current low-bid system assumes that all bidding systems are equivalent.
3. To identify how "set aside" contracts (8a contracts) perform when compared to larger companies.
Introduction
In Chapter 1 of this report the importance of optimizing available construction
funding, both in the civilian and military sectors, was explained. The history and success
of the JOC in meeting the requirements of the military was also presented. In Chapter
2, literature documenting current attempts at optimizing contracted maintenance and
evaluating JOC costs were presented to show the lack of true performance data. Chapter
3 addressed the shortfalls of the AFR 70-30 Appendix BB attempts to provide a measure
of performance. Chapter 4 laid the theoretical foundations for the collection of data and
the analyses that follow. This effort will not reveal the best performing contractor by
name as that information is privately owned and is not relevant without an owner's
strategic plan.

71
Data Collection
Overview
To meet the first goal of this chapter, a performance survey was developed for
completion by facility managers and/or base engineers. At the time of the of data
collection, job-order contracting was a procurement alternative used almost solely by the
United States military. Thus, the survey is tailored to fit the specific situations of the
Army, Air Force and Navy. Recently, JOC has become a popular alternative in the
private sector as well. However, data in this environment was unavailable at the time
of writing. One of the primary concerns of this project was to ensure that the people
being contacted were the proper personnel to quantify JOC performance. Experience
with contracting (financial) personnel (who do not truly understand construction quality
and performance) has driven this research to contact the base (or post) engineering
personnel working directly with the JOC.
Performance Surveys
The data collection survey (see Appendix B) entailed 58 questions that resulted
in 26 direct performance criteria and six combined criteria. After phone contact was
made with each JOC point of contact, surveys were telefaxed to each installation and
subsequently returned to ASU.
The development of the performance criteria is an important step in quantifying
performance. Traditionally, operational information (material thickness, ASTM test
results, etc.) have attempted to ensure performance. Performance information does not
address the physical qualities of the system or product, it addresses such factors as
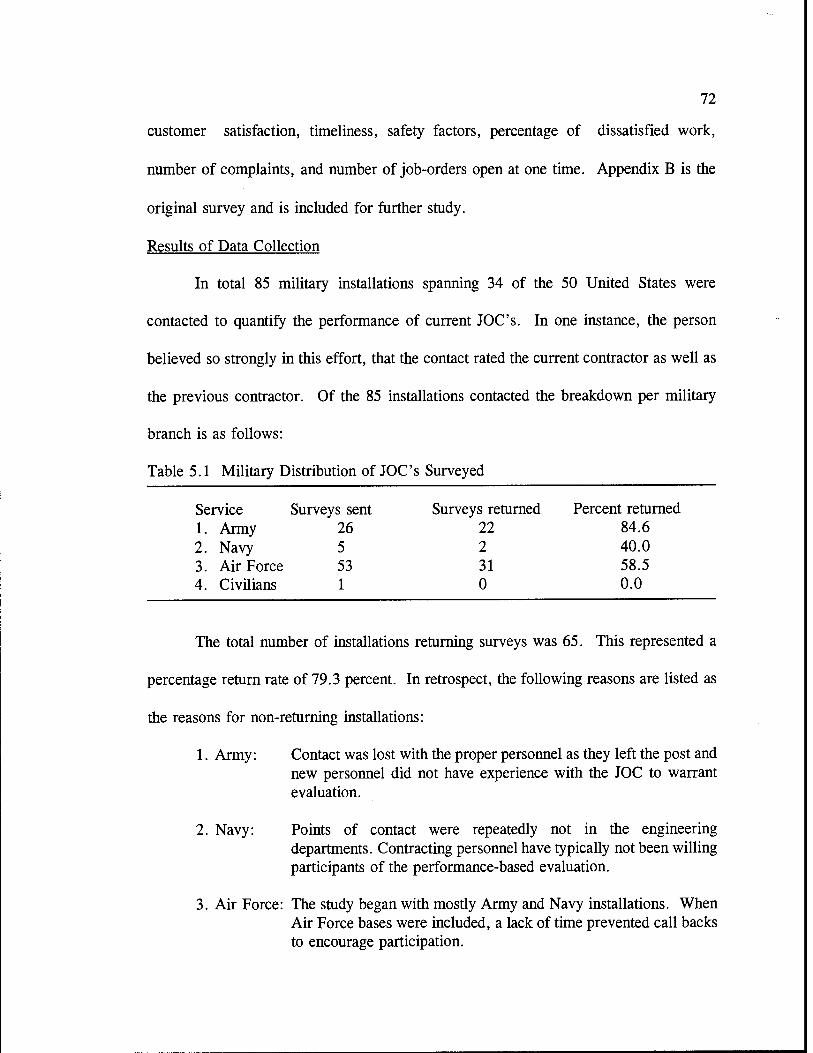
72
customer satisfaction, timeliness, safety factors, percentage of dissatisfied work,
number of complaints, and number of job-orders open at one time. Appendix B is the
original survey and is included for further study.
Results of Data Collection
In total 85 military installations spanning 34 of the 50 United States were
contacted to quantify the performance of current JOC's. In one instance, the person
believed so strongly in this effort, that the contact rated the current contractor as well as
the previous contractor. Of the 85 installations contacted the breakdown per military
branch is as follows:
Table 5.1 Military Distribution of JOC's Surveyed
Service Surveys sent Surveys returned Percent returned 1. Army 26 22 84.6 2. Navy 5 2 40.0 3. Air Force 53 31 58.5 4. Civilians 1 0 0.0
The total number of installations returning surveys was 65. This represented a
percentage return rate of 79.3 percent. In retrospect, the following reasons are listed as
the reasons for non-returning installations:
1. Army: Contact was lost with the proper personnel as they left the post and new personnel did not have experience with the JOC to warrant evaluation.
2. Navy: Points of contact were repeatedly not in the engineering departments. Contracting personnel have typically not been willing participants of the performance-based evaluation.
3. Air Force: The study began with mostly Army and Navy installations. When Air Force bases were included, a lack of time prevented call backs to encourage participation.
73
4. Civilian: Only one civilian enterprise (an airport) was contacted to evaluate the performance of their JOC (at the contractor's request). However, the facility manager refused to participate feeling that the evaluation was illegal.
Concluding Remarks
With the development of the performance criteria and the collection of the 65-
installation data, the first objective of this chapter-quantifying overall JOC performance-
was met. This data also serves as a benchmark of performance data for future
evaluations.
Data Analysis & Results
Objectives
The objective of this section is not to promote the use of JOC, or the interests
of any one particular provider. The objective of this section is to show that current
award practices are non-competitive and are promoting the participation of non-
performing constructors. This is seen as a JOC performance differential. Demonstrating
this differential is the second objective of this chapter. It is also the objective of this
section to determine whether large, country-wide contractors are doing a better or worse
job than smaller, often minority-owned, contractors. The author understands that some
JOC's across the country will be "set asides" (8a contracts) for minority contractors.
The author is promoting this system to select the best performing contractor under any
stipulation imposed by the Government.
Overview
Several elements presented in the previous sections will be drawn together in this
section. The analysis of the information collected was done through the methodology
74
presented in Chapter 4. The concept of relative distancing, or the amount of true
information, is evidenced in the DIM and is demonstrated by the differential in JOC
performance. Two broad sets of performance analyses are presented. The first presents
data from six different constructors (detailed later) and demonstrates a product
performance differential in the range of the values reported. The second is intended to
meet the third objective of this section-evaluate 8a performance. To meet this objective,
the author divided (through the concepts of fuzzy logic) the 65-site data into two
categories-large and small. The "large" contractors are corporate providers of JOC
services. The "small" contractors are essentially single-site providers. The author
promotes this comparison as an accurate evaluation of 8a constructors, due to the
similarity of characteristics (size, etc.) these providers share with 8a constructors. Again
the basis for this assumption lies in the proof of the fuzzy logic philosophy.
Performance Lines
To support the use of the displaced ideal model, a contractor performance line
must be generated. In the case of JOC's, the performance line is the average of the
individual criteria scores across the sites surveyed. Kashiwagi and Hoover set the
minimum number of installations to warrant a separate constructor performance line at
five. This was based on Kashiwagi's experience with the performance-based system and
Hoover's familiarity with the JOC data. Over 25 different contractor's performance has
been quantified. However, for accuracy of evaluation the 65 sites evaluated have been
considered as only six separate providers. An index follows:
1. Contractors 1, 2, 3, and 5 are major, country-wide providers with a total of 33 sites.

75
2. Contractor 4 is a conglomeration of all contractors surveyed with less than five sites.
3. Contractor 6 is a provider currently working at five installations in the western United States.
Average Performance Criteria Scores
The JOC performance survey produced a wide range of performance scores, thus
verifying the assumption that the low-bid procurement system cannot differentiate
between performing and non-performing systems and emphasizing the differential itself.
Again this lack of differentiation is because the low-bid system treats all alternatives as
essential equals (Kashiwagi , 1994). The average scores, score range, and score scale
is provided below.
Table 5.2 Performance Criteria and Values
Performance Criteria Score Range Scale
Average Award Coefficient 1.143 0.821 - 1.350 Straight #
Percent Renewed 0.984 0.905 - 1.000 0.0- 1.00
Average Size Call Order 59.922 49.734 -73.187 $ (000)
Average Duration 3.679 3.00- 4.80 Years
Perception of Efficiency 0.931 0.667 - 1.000 0.0- 1.00
Perception of Timeliness 0.913 0.750 - 1.000 0.0- 1.00
Perception of Cost Effectiveness 0.626 0.333 - 1.000 0.0- 1.00
Average % of Dissatisfied Work 13.722 3.500 - 30.250 1 - 100
Average Response Time 11.550 8.125- • 15.786 Days
Average Quality of Drawings 5.885 4.333 ■ • 6.900 1 - 10
Response time ECO 4.182 1.50- 6.00 Days
Avg on time Completion (%) 75.36 52.615 - 99.300 1 - 100

Table 5.2 Continued
76
Avg # of Complaints 6.532
Avg Construction Quality 7.422
Avg Changes per Job 0.416
Avg Professional Level 7.214
Avg Housekeeping Rating 7.157
Avg On-Site Mgmt Rating 7.051
Avg Rating of Eng Support 5.702
Avg Rating of PR/Customer SVC 7.327
Avg Performance Level of Subs 6.639
Avg MCO Management Level 6.928
Avg # Outstanding Jobs 19.682
Avg # of Safety Problems per Site 3.945
Avg # of Contr. Pers. On-Site 9.679
% Customers Satisfied with JOC 0.843
1.00- 16.452
5.714 - 9.300
0.264 - 0.666
5.429 - 9.400
5.50 - 8.80
5.429 - 9.00
3.00 - 7.40
5.286 - 9.400
5.286 - 8.000
5.286 - 9.200
9.50 - 29.545
2.40-5.185
4.538 - 20.40
0.50- 1.000
Straight #
1 - 10
Straight #
- 10
- 10
- 10
- 10
- 10
- 10
- 10
Straight #
Straight #
Straight #
0.0 - 1.00
Combined Performance Criteria
The concept of combining performance factors to evaluate constructor, product,
or service performance is currently under Kashiwagi's pending patent. These criteria
augment the evaluation of the performance differential by presenting information not
readily seen in the initial criteria scores. Based on the concepts of fuzzy thinking and
relativity, including Kosko's tenets of elementhood and subsethood (Kosko, 1993)
(Kashiwagi, 1991), the following six combined criteria (Table 5.3) were drawn from the
above criteria. Kosko (1993) defines subsethood as the degree to which one set contains
another, and elementhood as the degree to which each member of the subset has the
77
property being measured. Thus, the combined criteria evaluate the overlap of certain
criteria. For example, a facility owner may desire to know the number of roof system
applications over 10,000 square feet, where the square feet per penetration exceeded 15
and that were constructed on a metal deck substrate. A JOC example follows. Overall
customer perception of expertise considers the customer's perception of a constructor's
efficiency, timeliness, cost effectiveness, and the percentage of dissatisfied work. The
criteria presented in Table 5.3 are the result of many iterations and analyses of the initial
data, scores and information present. By combining factors that, in general describe one
broad characteristic, the author poses that these criteria more accurately describe
performance as seen by the facility manager or base engineer. In effect, the combined
criteria evaluate "overall" performance for each of the combined categories listed. This
parallels the discussion in Chapter 4 concerning performance factors versus operational
factors. A facility manager can accurately describe what he/she wants (a roof that
doesn't leak), but traditionally attempts to ensure this through operational criteria - not
performance criteria. The JOC combined criteria may permit the facility manager or
base engineer to say "I want a constructor whose overall construction
proficiency/knowledge is very high." This is requirement would be very difficult to
describe in a specification document, but is readily seen in the combined performance
criteria. As a footnote, the seemingly "odd" scores and scales are due to the calculations
involved in creating the criteria. These calculations are listed in Appendix C.

Range Scale
3.250 - 9.40 1 - 10
25.132-96.50 1 - 100
4.30 - 14.024 1 - 10
8.783 -33.170 0.2 - 490
8.775 - 47.996 1 - 100
16.397 - 69.936 1 - 100
78
Table 5.3 Combined Performance Criteria and Values
Performance Criteria Score
Overall Customer Satisfaction 6.216
Total Cust. Opinion of Expertise 49.245
MCO Customer Satisfaction 8.195
Timely Customer Service Rating 20.612
Overall Eng. Proficiency Level 25.864
Overall Const. Proficiency Level 37.675
Results
The scores of the "six" contractors can be seen in Appendix D. The importance
of these results is not in the values recorded. The range of the scores is of the most
value. It is this range (differential) that verifies the need for a performance-based
evaluation-one of the primary goals of this report. As discussed in Chapter Four, if
these values were very close, entropy would be great and the available information would
be low. However, in almost every criterion listed, the range is quite large. This is
especially true in the combined criteria. The author proposes that these are the most
valuable criteria of the 32 listed due to the overlapping effect of combining criteria. The
proofs of fuzzy logic allow owners to use these and all criteria to "backward chain" to
define a goal state that meets their specific requirement. Thus, the more relative
information present in a criteria, the more decision-making potential it "has." Another
factor in validating the need for the performance-based evaluation is not accurately
represented in the criteria. However, it is hinted at in the "percent renewed"
performance criterion. Although the range for this factor is relatively small, two

79
instances where the contract was terminated at the convenience of the government were
reported. In both of these instances, generally poor performance was listed as the
primary cause. In hindsight it was clear to the base personnel that the JOC's were
awarded to non-performing contractors, at least for the given conditions surrounding
these contracts (too low of bid coefficient, etc.). Combining the information from these
cancellations and the relatively large range of the other values previously discussed is
evidence that performing and non-performing constructors are operating in the same
environment-again emphasizing the product differentiation and need for a performance-
based evaluation.
Another of the primary goals of this report was to demonstrate that current award
practices are non-competitive. As discussed in Chapter 4, a totally competitive
environment must include a penalty for non-performers and a mechanism to tie each
constructor to their product. During the award of these contracts, the personnel (both
engineering and financial) evaluating the technical proposals in conjunction with the
financial solidity of the constructors did not or could not ascertain the best-performing,
best-price contractor. The author poses that this is because the system has de-evolved
into a low-bid system as stated by Mellon. Low bid systems assume that all proposals
will meet the requirements (specifications and technical data) and therefore are essentially
equal. Two other possible reasons exist for this deficiency: collusion or mistakes on the
part of the evaluating parties, or use of a system that does not measure true performance.
The author proposes that the second reason coupled with the "de-evolved low-bid system"
is to blame. The award of job-order contracts no longer includes a useful or an accurate

80
mechanism for the evaluation of construction performance. The author poses that this
is due to the proliferation of the market by unproven products and services. These claim
to perform through ASTM standards in the case of products and through financial
stability in the case of services. However, these items are not accurate measures of
construction performance. The current system can not differentiate, and the range of the
data values collected proves it.
Large/small comparison. A secondary objective of this report and a primary
objective of this chapter was to compare the performance of smaller (often minority-
owned firms) and larger corporate contracts. Contractor number 5 was included in the
"small" category. The summation of these results is seen in the following figure.
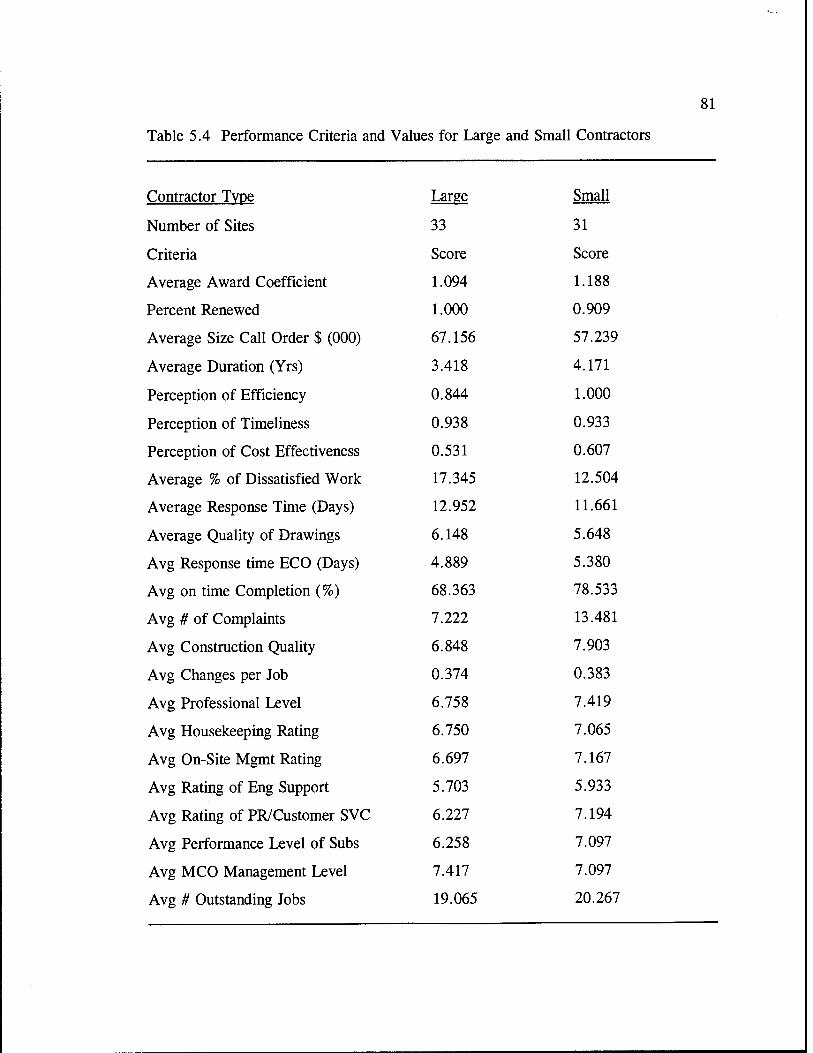
81
Table 5.4 Performance Criteria and Values for Large and Small Contractors
Contractor Tvpe Large Small
Number of Sites 33 31
Criteria Score Score
Average Award Coefficient 1.094 1.188
Percent Renewed 1.000 0.909
Average Size Call Order $ (000) 67.156 57.239
Average Duration (Yrs) 3.418 4.171
Perception of Efficiency 0.844 1.000
Perception of Timeliness 0.938 0.933
Perception of Cost Effectiveness 0.531 0.607
Average % of Dissatisfied Work 17.345 12.504
Average Response Time (Days) 12.952 11.661
Average Quality of Drawings 6.148 5.648
Avg Response time ECO (Days) 4.889 5.380
Avg on time Completion (%) 68.363 78.533
Avg # of Complaints 7.222 13.481
Avg Construction Quality 6.848 7.903
Avg Changes per Job 0.374 0.383
Avg Professional Level 6.758 7.419
Avg Housekeeping Rating 6.750 7.065
Avg On-Site Mgmt Rating 6.697 7.167
Avg Rating of Eng Support 5.703 5.933
Avg Rating of PR/Customer SVC 6.227 7.194
Avg Performance Level of Subs 6.258 7.097
Avg MCO Management Level 7.417 7.097
Avg # Outstanding Jobs 19.065 20.267

82
Table 5.4 Continue
Avg # of Safety Problems per Site 4.424 4.774
Avg # of Contr. Pers. On-Site 6.633 11.077
% Customers Satisfied with JOC 0.813 0.897
Overall Customer Satisfaction 5.060 5.863
Overall Customer Perception of Expertise 34.734 49.581
MCO Customer Satisfaction 8.448 8.329
Timely Customer Service Rating 14.786 20.215
Overall Engineering Proficiency Level 23.695 24.864
Overall Construction Proficiency Level 28.960 41.613
The "large" contractors have better scores on 14 of the 32 criteria. The "small" firms
have better scores on the remaining 18. For the most part, the larger firms scored better
on management, safety and cost functions. The smaller firms garnered better scores in
the actual "hands-on" production functions, especially noteworthy are "overall customer
perception of expertise" and "overall construction proficiency level." Because the initial
data is presented without a strategic plan of an owner (all criteria are considered equal),
it is only shown to demonstrate product differential. However, some interesting
conclusions can be drawn. Although cost figures are suspect due to geographical labor
rates and different price books, the author promotes comparing these two "broad"
categories (large and small) as meaningful. This conclusion is based on the assumption
that the shear number of sites (31 and 33) evaluated for each category offset these
discrepancies. If this is accepted as true, smaller firms, who cost more (higher bid
coefficient) are perceived to be slightly more cost effective, while having a lower

83
percentage of dissatisfied work. The author poses that this is due to the perception of
the higher quality work the smaller firms seem to demonstrate. This statement is
evidenced in the combined criterion "overall construction proficiency." The smaller
firms average more complaints, but have a substantially higher score in construction
quality and professional level, while completing their work on time an average of 10
percent more often. Again, the author poses that this is the product of the overall
perception that the smaller firms are doing a better job at the "hands-on" work.
Fuzzy Analysis
Initial analysis. Application of the multi-criteria decision making (MCDM) tool
at this point is the only method that evaluates the amount of information presented by the
criteria, while permitting tailoring of the procurement to the strategic needs of the owner.
For the purpose of determining the amount of information present in the individual
criteria, the initial "owner's weightings" (importance factor for each criteria) were all set
at one (1). The results can be seen in Appendix E (along with the results of all
subsequent scenarios), but are summarized by the figure below.
Table 5.5 Initial JOC Performance-Based Evaluation Results
Contractor Fuzzy Distance from the Imaginary Optimum Rank
1 1.795 3 2 1.952 4 3 0.609 2 4 3.394 6 5 2.007 5 6 0.371 1

84
The initial results of this evaluation identified a shortfall in the initial data
collection. Contractor #3 ranks second overall based solely on the relative information
provided by the range of values recorded. However, this contractor is currently
withdrawing from the JOC arena. The apparent reason for this withdrawal (offered by
other JOC providers at the second JOC Performance conference detailed in Chapter 1)
is the lack of profit, driven by bid coefficients that were too low. This information must
been understood to be speculation. However, it is interesting to note that, apparently,
while losing money on several JOC's, this company kept its customers very happy. The
author proposes that one of the reasons this is possible is the size of the firm. Contractor
#3 is a large firm with project sites across the country, both in and out of the JOC arena.
It is possible for a company of this size to lose money and please its customers
simultaneously, for a short time, while making profits elsewhere. Smaller firms may not
have this option and thus, may be forced to utilize non-performing methods to remain
in business or go out of business.
A similar process was used to compare the large and small categories. The
results can be seen in Appendix F (along with the results of all subsequent scenarios),
but are summarized below.
Table 5.6 Initial Small/Large Performance-Based Evaluation Results
Contractor Fuzzy Distance from the Imaginary Optimum Rank
Small 0.153 2 Large 0.029 1

85
It is again important to note that although the results of both of these "fuzzy" analyses
are valuable as benchmarks only. For a true representation of the application of the
performance-based evaluation, actual "owners" must be included to reflect the strategic
plan for the facility, installation or structure.
Secondary analysis - informational maximum. Previously, the author proposed
the combined criteria to be the most important due to the overlapping nature of their
design. The six-contractor DIM scores for these combined criteria ranged from 0.023
to 0.062. Only four of the direct criteria scored above the minimum value of 0.023.
One criteria, perception of cost effectiveness, scored just below with 0.022. The
remaining criteria scored comparatively low. Therefore to test the "informational
maximum" results, the author proposed weighting the six combined criteria and the four
higher scoring direct criteria at a value of 100 on a 1 to 100 scale. Note the scale is
irrelevant because the products are normalized (see Chapter 4). The results are
summarized in the following table.
Table 5.7 Information Maximum JOC Performance-Based Evaluation Results
Original New Contractor Fuzzy Distance from the Imaginary Optimum Rank Rank
1 2.190 3 3 2 2.542 4 5 3 0.569 2 2 4 3.763 6 6 5 2.236 5 4 6 0.115 1 1

86
It was expected, that the ranking of the contractors would remain constant, but the
spread of scores would increase. This was due to the belief that this evaluation would
only magnify the affects of the "most valuable" (based on information) criteria.
However, the true nature of the available information reflected a slight change in the
ranking. Contractors #2 and #5 switched positions. Results supporting the first
assumption were obtained when this concept was applied to the large/small evaluation.
The range of the values did increase. See below.
Table 5.8 Informational Maximum Small/Large Performance-Based Evaluation Results
Contractor Fuzzy Distance from the Imaginary Optimum Rank
Small 0.292 2 Large 0.036 1
Secondary analysis - low bid. In the conclusion of Chapter 3, the author sites
Mellon's (1994) belief that the award process for JOC's has de-evolved from a
meaningful evaluation of the technical proposal to a "one-year, low-bid process." To test
the affect of a "low-bid" award on performance, the author proposes weighting the award
coefficient at 100 and the remaining criteria at 0. In the initial evaluation, very little
information could be gleaned from this criteria as it scored (in the DIM) a range of only
0.00016. The results are seen in Figure 5.9. This exercise must be understood to be
solely for a hypothetical evaluation. As previously stated, cost factors are suspect and
vary due to the influence of many external factors. Therefore, this "low-bid" analysis
(and all others presented in this chapter) must be seen as demonstrative only. However,
these "cost" analyses do reinforce that belief that when the current system views JOC

ll New Rank
3 4 4 3 2 1 6 5 5 2 1 6
87
construction through "cost only" glasses, it cannot differentiate between performing and
non-performing constructors prior to award.
Table 5.9 Low Bid JOC Performance-Based Evaluation Results
Original Contractor Fuzzy Distance from the Imaginary Optimum Rank
1 0.1168 2 0.0979 3 0.0000 4 0.1849 5 0.0773 6 0.1928
Note that in this exercise all of the providers changed position. Contractor #3 moved
from position 2 to position 1; however, this contractor is leaving the JOC arena as stated
earlier. It is interesting to note that Contractor #6 dropped from first to sixth. That is
to say the constructor with the best proven product ranks last when first cost is the only
consideration. As discussed in Chapter 4, in this contracting environment constructor
#6 must lower costs to be competitive, even though the price that they are charging may
be "fair" for the value of work they are providing. This clearly is in opposition to the
conditions of a stable and competitive construction environment. An unstable
construction environment only leads to one inevitable result~the consistent decline of the
constructed product.
The results of applying the "price only" scenario were not as noticeably effective
on the results of the large/small comparison evaluation. See Table 5.10

88
Table 5.10 Low Bid Small/Large Performance-Based Evaluation Results
Original New Contractor Fuzzy Distance from the Imaginary Optimum Rank Rank
Small 0.080 2 2 Large 0.000 1 1
However, it did reduce the range of values considerably. This proposes that, based
solely on price there is a very small difference between the small and large categories.
However as any type of construction performance is evaluated, the difference becomes
significantly greater. It would appear, the larger companies are producing a better, less
expensive product. Again it is important to note that the conditions presented here are
extreme situations, do not reflect a strategic plan, and costs vary due to external factors.
The incorporation of a strategic plan to the weighting factors would, in all likelihood,
change the results significantly.
Iterative Process
It is important to note that the owner's weightings cannot be set and the system
run one time to select the optimum provider or product. Because of the relative
comparisons of the alternatives, owners can only roughly estimate the importance of one
factor in relation to the others. For a specific JOC example, if an owner weighted the
"number of complaints" heavily (in relative terms), constructors who may actually meet
their requirements may be eliminated. This is due to the high relative information
possessed by this criteria. Owners must use their initial weightings as a benchmark, and
run the system several times to understand the ramifications of what they perceive as
important on the other criteria and the relative distancing effect. Through this manner

89
the owners better understand their own requirements and the true performing providers
standout (Kashiwagi, 1994).
An additional benefit to not setting criteria weightings prior to award is present.
This method prevents providers from tailoring their surveyed products to meet the
requirements of the project at hand.
Potential Job-Order Contractors
Another secondary objective of this report was to develop a method to compare
potential and existing contractors "equally." Although it is nearly impossible to ensure
an absolutely equal comparison by any procurement strategy, the performance-based
evaluation provides the platforms of fuzzy thinking and the management of information
to compare new and potential contractors. A survey was developed by the author to
parallel the original survey designed by Kashiwagi, Beaudoin and Jayne. Using the
survey presented in Appendix G, data can be collected on any general contractor wishing
to bid on a JOC. A performance line, nearly identical to the existing JOC performance
lines, can be generated. This information can be utilized in the DIM to competitively
award the contract based on performance and the management of available information.
Concluding Remarks
In this chapter many of the goals of this report were met. JOC performance has
been quantified with a reliable set of data. The current procurement environment-
deemed non-competitive in Chapter 3-was proven to be in an unstable state with a wide
performance differentiation. The ability to compare existing and potential JOC's "on a
level playing field" through the concepts of fuzzy thinking was designed. Using the
90
concepts of a stable construction environment and the range of the results, the need for
the performance-based evaluation was validated. The average results from the 65 sites'
raw data was presented in conjunction with the performance criteria. In all, 26 direct
criteria and six combined criteria were used to evaluate the "six" different contractors
as well as the "larger" contractors versus the "smaller" contractors. The fuzzy similarity
between the smaller constructors and the 8a providers was discussed. Although the
information gleaned from the data is somewhat inconclusive (only due to the lack of an
owner's strategic plan) as to which specific contractor or type of contractor is best,
specific conclusions about some overall performance factors can be determined. Larger
firms appear to be better in the administrative and management functions while smaller
firms appear to be better in the actual work-related functions. Based on the information
produced by the DIM, Contractor #6 appears to be the best performing contractor, albeit
at the highest price. In this sector of the JOC arena, the tenets of a stable construction
environment appear to be in play. Contractor #6 is permitted to keep a "fair" share of
the value added nature of performing, quality work. Considering the entire military JOC
environment, it would seem that this situation is an anomaly. In general the DoD JOC
arena has been shown to be non-competitive and unstable and therefore a contributing
factor to the inevitable decline of the quality of the constructed project.

Chapter Six
CONCLUSIONS
Objective of the Report
The primary purposes of this report are:
1. To quantify the performance JOC's, specifically JOC's in the United States Military.
2. To verify the need for a Performance-Based Evaluation of these contractors.
3. To demonstrate that current procurement practices for JOC's are non- competitive.
Secondary objectives of this report include:
1. To establish a JOC database as a benchmark for future use. 2. To identify the current means used to award these contracts in the United
States Air Force. 3. To identify practices that create poor performance, higher costs and
industry instability. 4. To identify how "set aside" contracts (8a contracts) perform when
compared to larger companies. 5. To use an artificially-intelligent, "fuzzy logic" based, information
management system to streamline and analyze procedures while defining problems to maximize facility performance and optimize repair and maintenance spending.
6. To develop the means to compare existing and potential contractors. 7. To offer recommendations that will improve the long-term performance
of military contractors and the construction industry as a whole.

92
Primary Objective Results
JOC performance quantification. A total of 65 military installations across the
United States were surveyed to determine the level of performance of their respective
JOC's, DOC's, or SABER contractors. The 65 were subsequently divided into six
separate "contractors" and analyzed. They were also divided into two broad categories
(large and small) and analyzed. Performance lines were generated, using information
gleaned from collected performance surveys, that consisted of 26 direct criteria and six
extrapolated criteria. The author promotes this information as a reliable data set, as a
JOC performance benchmark.
Evaluation verification. The product performance differentiation documented
across the installations surveyed verifies the evaluation requirement. If the spread of
these ratings was very small, then by the methodology prescribed in this report, the
evaluation would not be warranted. However, as demonstrated in both sets of analyses
(large/small and "six contractors") of analyses a clear product differential was reported
and presented.
Current award practices. Viewing the information presented in Chapter 5 through
the eyes of performance and industry stability enumerated in Chapter 4, it is clear that
the current system, used by the United States military, cannot differentiate between
performing and non-performing constructors prior to award. This inability is due to the
failed attempt to measure past performance through the use of technical proposals that
are contractor- prepared marketing tools. Tools that are written around the requirements
specified by the agency and seldom, if ever, verified. The current system, used by the

93
United States military is non-competitive and the recorded product differential
substantiates it.
Secondary Objective Results
JOC database. The 65-site information collected has laid the foundation upon
which a comprehensive, reliable database can be built. The creation of the JOC
subdivision of the Alliance for Construction Excellence, its proposed annual evaluation
of JOC services, and the data reported will facilitate its growth.
Air Force SABER procurement. AFR 70-30 Appendix BB, although rescinded,
is both a past and a current method of awarding SABER contracts. Chapter 3 illustrates
that this regulation fails in its attempt to quantify and measure JOC construction
performance with technical proposals. It fails by separating price from performance by
having "financial experts" analyze the cost factors and "technical experts" analyze
operational factors. This separation assumes that cost and performance are not dependant
upon each other, and is faulty. As proposed by Kashiwagi and the author, this separation
of cost and performance is not possible in a stable construction environment, for the
value-added in quality work cannot be realized. The regulation does not contain a
mechanism to evaluate performance, because technical experts are overwhelmed with
unproven performance claims (marketing) and cannot differentiate prior to award.
Identification of negative practices. Poor industry practices were detailed
throughout this report. Most notable is the migration to the minimum specification, and
therefore, to the minimum (or below) quality. This is the result of low-bid procurement
process. This process assumes that all providers will meet all requirements

94
(specifications). The demonstrated product performance differential proves this
assumption to be faulty. Award practices that can not differentiate, do not penalize non-
performers (non-performance is recorded in the performance database and affects future
awards), and do not sanction the continuous improvement of the constructed product are
creating high industry instability by permitting the participation of performing and non-
performing constructors alike. Unproven claims, made by marketeers, are common
place in the industry and also promote high instability by not relating true performance
information.
Small versus large contractors. It is not the purpose of this report to promote the
use of either type of firm, but rather to promote the use of the performance-based system
to select the best value contractor under any stipulations asserted by the government.
The author is fully aware that "set asides" are, and will be, an inherent part of
government spending. However, the author proposes that the government select the best-
price, best-performing contractor for the given situation. The scenarios that were run
in Chapter 5 of this report (informational maximum and cost alone) suggest that the
larger firms are producing a better product at a cheaper price. Although this is to be
expected (due to the size and experience of the corporate providers), these conclusions
must be taken in view of the fact that these scenarios reflect no strategic plan. There is
a set of given circumstances (criteria weightings) in which each of the contractors is the
best value.
Fuzzy management of fuzzy information. By eliminating the tedious requirement
to identify the infinite relationships between the infinite number of variables, fuzzy

95
thinking, relativity, entropy and the displaced-ideal model facilitate the selection of the
best-price, best-performing contractor. In place, this system can save critical funding
in the face of continued budget cuts, while streamlining the procurement process.
Existing to potential comparison. The survey seen in Appendix G is an outgrowth
of more than 15 months of work on this project. Analyzing the data collected from the
military installations permitted the "bracketing" of several of the answers to permit the
maximum amount of information with the minimum amount of disclosure by private
patrons. Kashiwagi's standard sample size is 100, of which 50 are randomly selected to
be inspected (product) or surveyed (service). This number has been arbitrarily chosen.
However, the sample size should be sufficiently large to prohibit the constructor from
selecting an "other than representative" sample. Kashiwagi (1991) details procedures
detect possible biased samples. The author proposes the same numbers for potential
JOC's with at least half being return customers. The argument that this is too many for
smaller firms to compete may be applicable; however, tailoring to the given situation is
possible.
Recommendations
The author concludes that the JOC construction industry is currently in an
unstable state, because performance is not paramount to success. Both facility managers
in the civilian sector and military engineers are faced with ever-shrinking maintenance
and repair budgets. This "down-sized" funding emphasizes the need for leaders to
procure higher performing systems. To address this requirement, facility managers often
are forced to resort to negotiated contracts and accept the risk of paying a price that is

96
over-inflated. The United States military, and the government in general, has also
realized that the best value product seldom comes at the lowest cost. However, until
recent times, there has not been a mechanism to truly evaluate and select the best
performing provider. Kashiwagi's Performance-Based Evaluation and Procurement
system uses industry-proven techniques to inject the concept of industry stability into the
construction environment. The current instability is the result of numerous poor
practices:
1. Proliferation of "unproven" marketing. 2. The lack of true performance information. 3. Procurement systems that prohibit the constructor from realizing their
"fair share" of the value-added nature of quality work. 4. Procurement strategies that do not penalize non-performing providers.
Therefore any recommendations to the construction industry as a whole and especially
the government must be centered around addressing these ever-more-present shortfalls
of the current system. Long-range strategic plans must be fused with the concepts of this
report and those of Kashiwagi and should include the following:
1. The collection of true performance data. 2. The use of a system that ties each constructor to their product. 3. The use of a system that promotes real competition by addressing the
value-added nature of performing systems. 4. A procurement system that fosters the continuous improvement of the
constructed product. 5. The use of a system that measures true performance and can differentiate
between performing and non-performing systems.
Only through the implementation of these information-based concepts can the
government, the military, or a facility manager hope to meet the requirements of the
future with an ever-shrinking budget.
97
Methodological Conclusions
This report has presented and fused many ideas, techniques, philosophies and
concepts to present a mechanism that gives facility managers the ability to award
contracts to the best-value constructor through the fuzzy management of fuzzy
information. Several conclusions follow.
1. Customer satisfaction is performance.
2. All things are relative, interrelated and deterministic.
3. The infinite inter-relationship details of factors are not important. The
amount of information present is.
4. Marketeers draw "unproven" relationships between factors that appear to
provide meaningful information. However, these "hypotenuses" do not
represent true information. Only by examining the perpendicular distance
represented by the data can true information be gleaned.
Future Studies
The Performance-Based Studies Research Group will:
1. Collect annual data on JOC's.
2. Continue to educate owners, constructors and academicians on the need
for industry stability.
3. Explore other applications of the Performance-Based system.
98
Concluding Remarks
The procurement of JOC's or any type of product should not be based on any one
criteria alone-especially price. In its attempt to wisely spend taxpayer dollars, the
government has been "a penny wise and a dollar dumb." This is largely due to the lack
of a mechanism to measure true performance. This application of the Kashiwagi
Performance-Based Evaluation and Procurement system has provided this badly-needed
mechanism, while meeting the competitive requirements of the Federal Acquisition
Regulation. On going performance work in the areas of general contracting, union/non-
union labor, mechanical contractors, janitorial contractors, and dredging control systems
demonstrate the universal applicability of the system. The question is no longer low-bid
or negotiated, it is no longer corporate or "set aside" contractors, it is now performance
and stability versus the continued decline of the constructed product while wasting
critical construction funding.

REFERENCES
Allen, Steven. Unionized Construction Workers are More Productive. Assistant Professor of Economincs, North Carolina State University.
Badger, William W. (1993, October) Lecture notes from Construction Contract Administration class. Arizona State University.
Badger, William W. & Kashiwagi Dean T. (1991, March) Job Order Contracting. A New Contracting Technique of Maintenance and Repair of Construction
Projects. Cost Engineering. 33 (3), 21-24.
Berube, Margery S. (Ed.) (1985) The American Heritage Dictionary. Boston. Dell Publishing Co ., Inc. & Houghton Mifflin Company.
Brain, Sally. (1989, November) Who Costs Less? Construction 100-101.
Bopp, Peter. (1993, October) Why International? Presentation to the International Construction class. Arizona State University.
Chase, Gerald W. (1994, June) Lecture notes from Implementing Total Quality Management in a Construction Company class. Arizona State University. June 1994.
Deming, W. Edward. (1989) Out of the Crisis. Massachusetts: Massachusetts Institute of Technology, Center for Advanced Engineering Study.
Dodge Report. (1984-1993) Construction Potentials.
Erickson, Leif & Murphy, Patrick. (1993, September) Job Order Contracting: The Modern Approach to Meeting Construction Needs." Public Managment. 33 (3) 21-24.
Erickson, Leif & Murphy, Patrick. (1994, April) The Job-Order Contracting Solution. Civil Engineering 64 (4) 68-70.
Gordon, Christopher M. (1994) Choosing Appropriate Construction Contracting Method. Journal of Construction Engineering and Management 120 (1) 196-210.
Gruhn, Arthur W. (1993, October) Connecticut DOT Turns to Partnering. Public Works 124(11) 57-58, 82
100
Handley, Mark A., Lt, USN, (1989, August) WESTDIV's Approach to Installation restoration Contracting. The Military Engineer. 81 (530) 6-7.
Hower, Harold E. (1991, September) Quality Control of Maintenance Painting in Chemical Plants. Journal of Protective Coatings & Linings. 8 9 66-70.
Hrebiniak & Joyce. (1978) Strategy Formulation: Analytical Concepts. West Publishing Company, 1978
Hrebiniak & Joyce. (1985) Organizational Adaptation: Strategic Choice and Environmental Determinism. Administrative Science Quarterly. 30 336-349
Ichniowski, Tom. (1994, February) OMB Test Weighs Past Work. Engineering News Record. 11.
Kashiwagi, Dean T. (1994, Spring) Notes from the application of the Performance -Based Procurement of a roofing system for the Motorola Corporation in the Phoenix Valley.
Kashiwagi, Dean T. (1991) Development of a Performance Based Design/ Procurement System for Nonstructural Facility Systems. Diss. Arizona State University.
Kashiwagi, Dean T., Nuno, J. Pablo, & Moor, William C. (1994) Optimizing Facility Maintenance Using Fuzzy Logic and the Management of Information. ICC & IE. Industrial Engineering Conference.
Katzel, Jeanine. (1989) Contracting for Maintenance. Plant Engineering. 43 (14) 50-55.
Katzel, Jeanine. (1990) Working with Maintenance Contractors. Plant Engineering. 44(16) 72-77.
Kosko, Bart . (1993) Fuzzy Thinking. New York: Hyperion.
Luger, George, & Stubblefield, William A. (1989) Artificial Intelligence and the Design of Expert Systems. New York: The Benjamin/ Cummings Publishing Company Inc.
MacAuley, P.H. (1992) US Industrial Outlook-Construction. Construction Review 36(6) 1-13.
Mahetesian, Charles. (1994, March) Low-Bid Hazards in a High-Tech World. Governing. 64-70.

101
Mellon, Harry (1994, September) JOC Performance-Based Seminar. Arizona State University.
Mosley, D., Moore C, Slagle M. & Burns D. (1991, Summer) Partnering in the Construction Industry: Win-Win Strategic Management in Action. National Productivity Review. 10 (3) 319-325
Payton, William J. and Domenic V. Tutela. (1994) Contract O&M at POTW Operations Reduces Costs. Water Engineering & Management 141 20-22.
Phoenix Valley Facility Manager's Round Table. (1994, February) Open dicussion.
Porter, Michael E. (1985) Competitive Advantage. London: The Free Press
Rispoli, James A. Capt. USN (1991) NACFAC's Environmental Strategy. The Military Engineer. 83 (541) 45-46.
US Army Engineering and Housing Support Center. (1991, 10 July) Job Order Contracting Versus Single Project Contracting: Selection Criteria and Cost Benefits. Fort Belvoir, Virginia. Study Number 09004-215-011.
US Department of the Air Force. (1988, 27 April) Steamlined Source Selection Procedures. AF Regulation 70-30 Appendix BB.
US Department of Commerce, Bureau of the Census. (1990) Statistical Abstract of the United States 1990. Washington, DC.
US Department of Commerce, Bureau of the Census. (1993) Statistical Abstract of the United States 1993. Washington, DC.
US Department of Defense. (1980-1993) Prime Contract Awards by Service Category and Federal Supply Classification. Directorate of Information Operations and Reports. US Government Printing Office, Washington DC.
US Department of Defense. (1980-1993) Prime Contract Awards, Size Distribution. Directorate of Information Operations and Reports. US Government Printing Office, Washington DC.
Wang, Mao-Jun, J. (1991) Fuzzy Set Evaluation of Inspector Performance. International Journal of Man-Machine Studies 35 587-596
Zadeh, L.A. (1965) Fuzzy Sets. Information and Control 8 338-53.

102
Zeleny, Milan. (1974) A Concept of Compromise Solutions and the Method of the Displaced Ideal. Computers & Operations Research 1 479-496.
Zionist, Stanley. (1992) Some Thoughts on research in Multiple Criteria Decision Making. Computers & Operations Research 19 (7) 567-570.

APPENDIX A
AFR 70-30 APPENDIX BB
AIR FORCE STREAMLINED SOURCE SELECTION PROCEDURES

7 /' •- DEPARTMENT OF THE AIR FORCE AF REGULATION 70-30 / / Headquarters, US Air Force . and
j / Washington, D.C. 20330-5040 AFFARS Appendix BB
/-/ _ 27 April 1988
■' /
/ Contracting and Acquisition
STREAMLINED SOURCE SELECTION PROCEDURES
This regulation provides streamlined procedures for source selections which fall below the dollar thresholds or are out- side the scope of competitive negotiated procurements described in AFR 70-15/AFFARS Appendix AA, Formal Source Selection For Major Acquisitions. It provides policies, general objectives and procedures which are to be implemented by the specific procedures of major commands (MAJCOMs) including the Air Force Reserve and separate operating agencies (SOAs). It does not apply to the Air National Guard.
Faragraph Fngc
SECTION A-General Information and Basic Policies Applicability and Scope 1 3 Objectives of Streamlined Source Selection Process 2 3 Source Selection Policies 3 3 Source Selection Organization 4 4 Source Selection Authority (SSA) 5 4 SSA Responsibilities 6 4 Source Selection Evaluation Team (SSET) Organization 7 4 SSET Chairperson Responsibilities 8 4 Contract Team and Technical Team Responsibilities 9 ""5 Conflicts of Interest 10 5 Interface With Contractors 11 5
SECTION B~Pre-Evaluation Activities Business Strategy Panels 12 5 Selection of Prospective Sources 13 5 Source Selection Plan (SSP) 14 5 Solicitation Preparation 15 6 Notice of Source Selection Action 16 6 Basis of Award and Evaluation Criteria 17 6 Reduction in Number of Source Selection Personnel 18 7 Reduction in Number of Evaluation Items and Factors 19 7 Reduction in Size of Proposals 20 7 Evaluation Time 21 7 Developing Evaluation Standards 22 8
SECTION C-Proposal Evaluation Scope of Guidance 23 8 Oral Presentations 24 8 Proposal Evaluation 25 8 Technical Evaluation ?. 26 9 Cost or Price Evaluation 27 9 Evaluation of Other Factors 28 9 Assessment of Risk 29 9 Color Code Rating Technique 30 9 Determination of Competitive Range 31 10 Conducting Discussions With Offerers 32 Proposal Analysis Report (PAR) 33 Source Selection Briefings 34 Source Selection Decision Document and Contract Award 35 Notifications 36 12 Debriefings 3/ 1-
Supersedes AFR 70-30, 31 December 1986 No. of Printed Pages: 30 OPR: SAF/AQCS
104

/ G
AFR 70-30/AFFARS Appendix BB 27 April 1988
SECTION D-Source Selection Documentation . Release of Source Selection Information M
SECTION E--Allemative Source Selection Organization SSAC-SSEB Alternative Organization ^ *± SSA Responsibilities and Duties ™ j^ SSAC Responsibilities and Duties *' " SSEB Responsibilities and Duties *t " SSAC-SSEB Pre-Evaluation Activities ~ " SSAC-SSEB Proposal Evaluation ^ u SSAC-SSEB Source Selection Documentation 4->
Attachments j7 1. Glossary of Key Terms jg 2. Regulatory References j^ 3. Source Selection Organization 2rj 4. SSET Source Selection Events 21 5. Example of Evaluation Matrix ; 22
6. Examples of Standards -3 7. Format for Preparing Deficiency Reports 8. SSET Format for Preparation of Proposal Analysis Report (PAR) 9. Example of Format for Source Selection Decision Document ~ 10. Source Selection Documentation Guidelines 27
11. Source Selection Sensitive Coversheet „ 12. SSAC-SSEB Alternative Organization Events 2g
13. SSEB Evaluation Report Example Contents „ 14. SSAC Analysis Report Example Contents
105

AFR 70-30/AFFARS Appendix BB 27 April 1988
SECTION A-General Information and Basic Policies
1. Applicability and Scope. These source selection poli- cies and procedures apply to competitive negotiated pro- curements which fall below the thresholds or are outside the scope of AFR 70-15/AFFARS Appendix AA. AFR 70- 15/AFFARS Appendix AA may be used as a guide in con- junction with this regulation. Each MAJCOM and SOA having contracting authority is encouraged to establish spe- cific procedures supplementing this regulation (e.g., estab- lishing dollar thresholds) in order to tailor the process for its own individual project requirements and for its own organizational application, including thresholds and proce- dures for base level contracting offices. The poiicies and procedures in this regulation need not be applied to acqui- sitions for basic research; acquisitions under $5 million; or any other acquisition for which the Head of the Contracting Activity (HCA) determines them to be inappropriate. The use of these procedures for architect engineer services is prohibited.
2. Objectives of Streamlined Source Selection Process. The principal objective in a source selection is to select the offeror whose proposal has the highest degree of credibili- ty, and whose performance can best meet the government's requirements at an affordable cost. The process must be impartial, equitable, and comprehensive with regard to evaluating competitive proposals and related capabilities. The process must be efficient and capable of balancing technical, cost, and business considerations consistent wiih requirements and legal constraints. The process stresses the use of fewer resources by using a limited number of discriminating evaluation items and factors, limiting the size of proposals and reducing the complexity and size of the source selection organization. Although this may result in some variations in procedure from AFR 70-15/ AFFARS Appendix AA, the essential principles of the source selec- tion process must be maintained.
3. Source Selection Policies. The following policies apply:
a. The Source Selection Authority (SSA) must be pre- sented with sufficient information on each of the compet- ing offerors and their proposal to make an objective and equitable selection decision.
b. The solicitation document must use the Department of Defense Federal Acquisition Regulation Supplement (DFARS) uniform contract format and specify requirements in a way which facilitates competition. The solicitation shall indicate the basis for evaluation and shall require the submis- sion of essential information for making a source selection decision.
c. The rating system to be used in evaluating and ana-
lyzing proposals shalfbc described in the Source Selection Plan (SSP) submitted to the SSA for approval. The rating system shall be structured to identify significant strengths, weaknesses, and risks associated with each proposal. The rating system may be a narrative alone, or a narrative with a.descriptive color code at the area and item levels. The objective of the rating system is to display an assessment of all important aspects of the offerors' proposals.
d. Normally, written or oral discussions will be con- ducted with all offerors in the competitive range. The negotiation shall culminate in signed, contractual docu- ments representing the firm commitment of each offerer suitable for execution by the contracting officer upon receipt of direction from the SSA.
e. Auction techniques (indicating to an offeror a price which must be met to obtain further consideration, or informing an offerer that the price is high or low in relation to that of another offerer) are strictly prohibited. Dis- cussing price or cost elements that are not clear or appear to be unreasonable or unjustified is permissible. Discussions may also encourage offerors to put forward their most favorable price proposals. The price elements of any other offeror must not be discussed, disclosed, or com- pared. See Federal Acquisition Regulation (FAR) 15.610(d) for prohibitions on technical leveling and techni- cal transfusion as well as auction techniques.
f. The requirement for a Best and Final Offer (BAFO) in negotiations must not be used as either an auctioning technique or a squeeze for lower prices. All changes in price at BAFO must be fully substantiated by offerors. The common cutoff date for conclusion of discussions and requests for a BAFO must be designed to make sure that all offerors have an equal opportunity to compete.
g. Cognizant Contract Administration Office person- nel should take part, as necessary, in preparing the solicita- tion and negotiating the contract.
h. The basic procedures of this regulation apply to for- eign military sales (FMS) and cooperative international agreement acquisitions.
(1) The FMS customer countries are not part of the formal source selection process; however, they may be called upon after approval by the Source Selection Authority to clarify technical or management question1;;r !-s
ing during evaluation of contractor proposals. Cost twin, oi any part of a contractor's cost proposal, shall not be released to any representative of the FMS customer. A representative of the FMS customer country shall not participate in con- tract negotiations.
(2) Source selection decisions in international 106

AFR 70-30/AFFARS Appendix BB 27 April 1983
, cooperative projects are the responsibility of the host nation 'in accordance with the terms of the cooperative agreement. When the Air Force represents the United States as host nation, the procedures of this regulation should be followed. In accordance with terms of the specific cooperative agree- ment, all participating nations may be represented on the SSET (or SSEB and SSAC), but the SSA shall normally, after considering the advice of the SSET (or SSEB and SSAC), make the source selection decision.
i. The source selection policies of this regulation may be applied to acquisitions involving a cost comparison per- formed under OMB Circular A-76 procedures when large and complex functions are being considered for conversion to contract performance.
j. Chief of Contracting Responsibilities. The chief of contracting will perform the following responsibilities:
(1) Serve as primary advisor to commanders on source selection policy.
(2) Convene and chair (or co-chair) business strat- egy panels in accordance with this regulation, AFR 70-14/ AFFARS Appendix CC, and local procedures.
k. Key Terms and Regulatory References. A glossary of key source selection terms is provided in Attachment 1. A list of regulatory references are provided in Attachment 2.
4. Source Selection Organization. For acquisitions using the procedures of this regulation, primary and alternative source selection organizations are provided. The primary source selection organization consists of the Source Selection Authority and a Source Selection Evaluation Team. The alternative organization consists of the Source Selection Authority, Source Selection Advisory Council and a Source Selection Evaluation Board. The policies and procedures in this regulation apply to both types of organi- zations even though the primary organization is described typically throughout the text. Specific procedures for the alternative organization that differ from the primary organi- zation procedures are provided in Section E. Refer to Attachment 3 for example diagrams of the primary and alternate organizations.
5. Source Selection Authority (SSA). For acquisitions using these procedures, the SSA will be the HCA or com- mander of SOAs with power of delegation according to command procedures. SSAs should be of sufficient rank: and hold positions which enable them to be familiar with the objectives of the work being contracted.
6. SSA Responsibilities. The SSA is responsible fur the proper and efficient conduct "of the entire source selection process and has full authority to make the source selection
decision. Responsibilities and duties also include:
a. Approval, in writing, of the-appointment of the source selection evaluation personnel and chairpersons.
b. Review and approval, in writing, of the SSR
c. Authorization to release the solicitation document.
d. Approval of the Contracting Officer's determination to exclude offerers from die competitive range.
e. Approve all cases where it is necessary for the con- tracting officer to reiterate a call for B AFO.
f. Documentation of selecüon rationale.
7. Source Selection Evaluation Team (SSET) Organization. The single SSET will first evaluate propos- als and then prepare a comparative analysis of the evalua- tion. Widiin the SSET, there will be a Contract Tcam.and a Technical Team, each with a designated Team Chief.
a. The Contract Team will include the contracting officer, buyer, and price analyst. The Team will be respon- sible for cost (price) analysis of the offerers' proposals, contract definitization, and negotiation.
b. The Technical Team will include at least two or three representatives from the. program or project office, and functional experts in applicable fields such as logistics, civil engineering, manufacturing, or management. The size of the Technical Team will be dependent on the complexity of the acquisition.
c. If warranted by size and complexity of the proposed acquisition, senior management representatives from the contracting discipline, the program or project office, the legal office and others as appropriate may serve as advisors to the SSET. When necessary, advisors (both government and non-government) may be utilized to objectively review a proposal in a particular functional area and provide com- ments and recommendations to the government's decision makers. They may not determine strengths and weakness- es, establish initial or final assessments of risks, or actually rate or rank offerer's proposals. When non-government advisors are used, the solicitation must include a provision that non-government contractor employees will have access to offerer's proposals. All advisors shall comply with this regulation including procedures far conflicts of interest and safeguarding of source selection sensitive infor- mation.
3. SSET Chairperson Responsibilities. The SSET chair- person responsibilities include:
107

AFR 70-30/AFFARS Appendix BB 27 April 1988
a. Preparing the SSP in coordination with Ihc program or project office and the contracting officer.
b. Reviewing and approving proposal evaluation stan- dards prepared by the Technical Team.
c. Providing an independent review of the Contract and Technical Team's assessments of the offerors' proposals.
d. Preparing the Source Selection Decision Document for the signature of the SSA, if requested by the SS A.
9. Contract Team and Technical Team Responsibilities.
a. The Technical Team will establish the basis for tech- nical evaluation of proposals, develop evaluation criteria, establish the relative order of importance of the criteria and provide this to the Contract Team for inclusion in the solici- tation. The Technical Team should prepare evaluation stan- dards before release of the solicitation, but no later than before receipt of proposals. After receipt of proposals, the Technical Team will rate the technical areas, items, and fac- tors of the proposal, identify and prepare proposal Deficiency Reports (DRs) and/or Clarification Requests (CRs), and prepare narratives for technical evaluation reports. For off-the shelf types of procurements, a technical assessment will be made of those features of the offerors' proposal, which will most impact the selection decision.
b. The Contract Team is responsible for coordinating the development of the solicitation, conducting prepropos- al briefings, establishing procedures to protect contractor proposal information and government source selection data, conducting negotiations or discussions, determining contractor responsibility, and debriefing unsuccessful offer- ors. The Procuring Contracting Officer (PCO) is responsi- ble for issuing DRs and CRs, conducting all written and oral discussions, and making competitive range determina- tions (with the approval of the SSA).
10. Conflicts of Interest. The SSET chairperson will instruct all persons receiving information or data on source selection activities to comply with AFR 30-30. All persons involved in the source selection process (including people other than Air Force personnel) will inform the SSET chairperson if their participation in source selection acuvi- ties might result in a real, apparent, or possible conflict of interest. When so advised, the SSET chairperson will dis- qualify any person whose participation in the source selec- tion process could raise questions regarding real, potential, or perceived conflicts of interest.
11. Interface With Contractors. Contacts with prospec- tive contractors after release of the solicitation must be made only by the contracting officer.
SECTION B-Pre-Evaluation Activities
12. Business Strategy Panels. ABusincss Strategy Panel should be convened at the earliest practicable date according to MAJCOM procedures. The policies and procedures of AFR 70-14/AFFARS Appendix CC, Business Strategy Panel, and MAJCOM supplements to that regulation should be used. Typical major issues to be discussed are the desig- nation of an SSA, the statement of work, the adequacy of specifications, source selection criteria, the contracting aspects of the acquisition, funding, logistics, quality assur- ance, and contract administration. This meeting is a \\\s\ planning session needed to achieve competitive, cccrwiiicaJ, and effective procurement. It applies to modifications, ser- vices, construction, automatic data processing equipment, contracting out, and operations and maintenance efforts as well as research and development and production.
13. Selection of Prospective Sources.
a. Government policy requires full and open competi- tion in soliciting offers and awarding contracts unless one of the exceptions in FAR Part 6 is approved. Market surveys (FAR Part 7) are conducted to ascertain whether qualified sources are likely to be available to satisfy requirements. Screening criteria should be developed and applied in estab- lishing a source list. In seeking competition, prospective offerors should not be encouraged to prepare proposals when they are not capable of satisfying the requirements.
b. Synopses of the acquisition shall be accomplished according to FAR Subpart 5.2. FAR Subpart 5.1 provides guidelines for issuing solicitations to potential sources and requesters.
c. If, after the solicitation document is distributed to the prospective offerors, an unsolicited source requests a solicitation, the contracting officer may advise the offeror of the reasons why they were not previously selected to
a receive the solicitation. If the source insists on receiving the solicitation document (and when required, has the necessary security clearance), a copy will be furnished. If that source submits a proposal, the proposal will be con- sidered without prejudice.
14. Source Selection I'lan (SSP).
a. The SSP is a key document for initiating and con- ducting the source selection. It should contain the elements described below to ensure timely review and S-SA approval. The SSP should be jointly developed by the'eon- tracting and requiring activity. It must be submitted suffi- ciently in advance of the planned acquisition action to facilitate review and approval by the SSA and early estab- lishment of the source selection organization. The SSP must be approved before release of the solicitation.
108

AFR 70-30/AFFARS Appendix BB 27 April 1988
" -bv The SSP (see FAR Subpart 15.6) will address the coif :3 below. Supporting details may be provided in ref- erenced attached documents:
(1) Program or project overview and description of requirement
(2) Description of source selection organization, assigned responsibilities, and listing of participants (advi- sors and team members) by organizational symbol. Participation should be limited only to essential personnel consistent with the complexity of the acquisition.
(3) The proposed presolicitation activities will be described, including market survey, list of prospective can- didates, synopsis, and solicitation preparation and release approval actions.
(4) Significant events and the schedule for their completion should be identified. (See source selection events at Attachment 4.)
(5) The evaluation criteria will be described, and the relative importance of all specific criteria will be stated. The illustration at Attachment 5 may be used for displaying the criteria.
' - • (6) Areas, items, and factors to be rated should be identified. ' The methodology and rating system for the technical proposal will be described. The methodology for evaluating cost proposals must be described. Cost (or price) is a mandatory evaluation factor and is evaluated for completeness, realism, and reasonableness. While cost is ranked in order of importance, it is not given a color code rating or score of its own. (See paragraph 30.)
(7) Summary of acquisition strategy.
15. Solicitation Preparation.
a. Early industry involvement, including use of draft solicitations is desirable.
b. Solicitations are to be prepared by the Contract Team according to appropriate FAR procedures. The solic- itation must accurately convey to offerors the technical, schedule, cost, and contractual requirements of the acquisi- tion. In addition:
(1) The evaluation criteria, as approved by the SSA, must be provided in the solicitation as they appear in the SSP. The relative ranked order of importance of cost, tec;' !al, and other specific evaluation criteria must be indicated, including factors.
(2) The solicitation shall include a notice stating that
unrealisticaJly low price or cost estimates, initially or subse- quently, may be grounds for eliminating a proposal from com- peution either on the basis that the offerer does not understand the requirement, or has made an improvident proposal.
(3) An executive summary should accompany the solicitation to briefly describe and highlight the salient aspects of the solicitation.
(4) The size of the solicitation should be kept short and uncomplicated. Applicable regulations may be referenced rather than reprinted. How or where the refer- enced regulations are made available should also be iden- tified.
c. The solicitation shall be thoroughly reviewed for consistency with laws, policies, and regulations. Both management and technical data requirements shall be similarly evaluated to eliminate nonessential or unduly restrictive requirements. If source selection evaluation members have been identified, they may participate in the preparation and review of the solicitation document.
16. Notice of Source Selection Action. Upon release of the solicitation document, the contracting officer shall inform all appropriate Air Force offices and the potential offerors, that a source selection action is in progress. The notification will identify the project involved; the anticipat- ed period of the source selection; and will include a state- ment informing them that contacts regarding the project by participating offerors are not allowed. The Contracting Officer is the only person authorized to contact offerors; the SSA is the only person with authority to release infor- mation regarding an ongoing source selection.
17. Basis of Award and Evaluation Criteria.
a. Award will be based on an integrated assessment of each offerer's ability to satisfy the requirements of the solicitation. The integrated assessment will include evalua- tion of general considerations stated in the solicitation, as well as the results of the evaluation of the proposals against specific areas of evaluation criteria whose relative order of importance has been established. Examples of general con- siderations include past performance, proposed contractual terms and conditions, and the results of preaward surveys.
b. Evaluation criteria will be set forth in the solicita- tion, and will communicate to potential offerors the impor- tant considerations which will be used in the evaluation of proposals. The evaluation criteria will be listed in descend- ing order of importance. The evaluation criteria included in the SSP will be set forth, verbatim, in the solicitation. Evaluation criteria must be tailored to the characteristics of a particular requirement and will include only those fea- tures which will have an impact on the selection decision.
109
AFR 70-30/AFFARS Appendix BB 27 April 1988
c. One proven evaluation system applies three types of evaluation criteria: cost (price) criterion, specific crite- ria, and assessment criteria. The cost (price) criterion relates to the evaluation of the offeror's proposed costs (price). The specific criteria relate to program or project characteristics. The assessment criteria relate to aspects of the offeror's proposal, abilities and past performance. The assessment criteria are applied to the specific criteria in a matrix fashion.
(1) Cost (price) is a mandatory evaluation criteri- on that is utilized according to FAR techniques to deter- mine realism, completeness and reasonableness. Evaluation results are summarized without use of color coding.
(2) Specific criteria relate to program or project characteristics. The specific criteria are divided into appro- priate technical and (or) management evaluation areas. Areas of specific criteria are evaluated in a matrix fashion against assessment criteria. Examples of specific criteria might include technical, logistics, manufacturing, opera- tional utility, design approach, readiness and support, test and management. These areas are further subdivided into items, factors, and in some instances, subfactors. The low- est level of subdivision depends on the complexity of the area being evaluated. Items used as specific criteria should be related to characteristics which are important to program (project) success such as reliability and maintainability,
' system effectiveness, producibility, supportability, and data management (including the Contract Data Requirements List).
(3) Assessment criteria relate to the offeror's pro- posal and abilities. They typically include but arc not limit- ed to such aspects as soundness of technical approach, understanding of the requirement, compliance with the requirement, past performance and the impact on schedule. Assessment criteria may also be ranked in relative order of importance unless they are regarded to be of equal impor- tance. The result of applying assessment criteria against specific criteria in a matrix fashion is normally summarized at the item level. See Attachment 5 for an example of the general format of an evaluation matrix.
(4) The solicitation must indicate the relative impor- tance among evaluation criteria to include areas, items and any significant factors. If requirements or conditions significanüy change so as to negate or modify the evaluation criteria origi- nally established in the solicitation, the SSA shall make sure that each potential offerer is informed by a solicitation amend- ment of the adjusted criteria and basis for award. The offerers shall be given enough time to modify their initial proposals.
d. The general considerations typically include but are not limited to proposed contractual terms and conditions, or results of prcaward surveys. Past performance may be
included in the evaluation as an assessment criterion or a general consideration, or both.
18. Reduction in Number of Source Selection Personnel.
a. Every effort should be made to keep the total num- ber of members and advisors to an efficient level. Teams with excessive numbers of evaluators tend to slowdown the source selection process.
b. Where feasible, members of the evaluation team should be experienced in a number of disciplines. Members so qualified may evaluate a number of items or factors.
19. Reduction in Number of Evaluation Items and Factors.
a. A major cause of lengthy source selection proce- dures is a proliferation of evaluation items and factors which, in lum, results in lengthy proposals and extended evaluation sessions. Too often, these evaluations involve items and factors which are not source selection discrimi- nators.
b. The choice of evaluation factors should be tailored to that which is essential to the selection of the best offerer. In some instances, this may be done by combining a num- ber of similar factors into one overall factor.
20. Reduction in Size of Proposals.
a. One of the source selection objectives is to elimi- nate the submission of data and information which is not germane to the decision making process. Excessive size of proposals is both costly to the offeror and unnecessarily time consuming to the evaluator.
b. Limitations on number of pages and number of ' copies of proposals is encouraged. This limitation should
be tailored to the complexity of the acquisition. Page limi- tations shall not be imposed for cost proposals.
c. When imposing a page limitation, the solicitation must state that the evaluators will read only up to the maxi- mum number of pages specified. Pages in excess of die maximum are to be removed from the proposal and returned to ensure that they are not evaluated.
21. Evaluation Time. Sufficient, time must be prrviii-:! for evaluation consistent with the nature of die acquismivi. i!i,,;
requires planning by the SSET chairperson. Complex acqui- sitions or those which generate many proposals may require more evaluation time.
110

AFR 70-30/AFFARS Appendix Bß 27 April 1988
22. Developing Evaluation Standards.
a. The Technical Team will establish objective stan- dards at the lowest level of subdivision of specific evalua- tion criteria.
b. Standards, which indicate the minimum perfor- mance or compliance acceptable to enable a contractor to meet the requirements of the solicitation and against which proposals are evaluated, will be prepared for the lowest level of subdivision within each area of the specific evalua- tion criteria and be approved by the SSET chairperson. See examples of standards in Attachment 6.
c. Standards will not be. included in die SSP or the solicitation. They will not be released to any potential offerer nor to anyone who is not direcdy involved in the source selection evaluation effort.
SECTION C--Proposal Evaluation
23. Scope of Guidance. This section provides guidance on the evaluation of ofreror's proposals from die receipt of initial proposals up to the source selection decision. The proposal evaluation is to be conducted in a fair, compre- hensive, and impartial manner.
_24. Oral Presentations. A determination regarding whether oral presentations should be conducted is to be made by the SSET chairperson dependent on die complexi- ty of the proposals. When used, offerers' oral presentations will be made to die SSET before commencing the evalua- tion of the proposals. To ensure objectivity, SSET mem- bers must make diemselves available for all oral presenta- tions or alternatively to none of the presentations. The SSET chairperson shall ensure that minutes of each oral presentation are made for the source selection file.
25. Proposal Evaluation:
a. The project should lend itself to the development of meaningful evaluation criteria against which proposals may be evaluated. The evaluation criteria may include, for example, technical, management, schedule, logistics, or any combination of these evaluation areas. The evaluation shall be consistent with the evaluation criteria set forth in the solicitations as the basis for award. See paragraph 17.
b. Technical approach and ability to meet stated mini- mum performance requirements are of major importance in proposal evaluation. The term "technical" in this context is not limited to scientific or engineering concepts or princi- pals, but may include any performance skills which require education or training. Cost or price may or may not be the controlling evaluation area in selecting the contractor.
c. The project should offer a reasonable expectation of an interested and capable marketplace to ensure effe- competition.
d. Deficiency Reports (DRs). During the initial evalu- ation of proposals, the SSET should record separately and in addition to the narrative analysis, the deficiencies found in each offerer's proposal. It is important that deficiency reports be prepared at the time the deficiency is discovered. Late preparation often results in poorly substantiated reports. It is important that the evaluator document die effect the uncorrectcd deficiency would have on the pro- gram or project. (See Attachment 7 for an example format for preparing deficiency reports.) A copy of the deficiency reports will be provided to die Contract Team who will in turn provide the offerers with the opportunity to amend their proposals to correct the deficiency. Deficiency reports will not be sent nor discussions begin with the offerer before the initial competitive range determination. For tlic purpose of source selection actions, a "deficiency" is defined as any part of an offerer's proposal which when compared to the pertinent standard fails to meet the gov- ernment's minimum level of compliance. Examples include:
(1) Proposed approach which poses an unaccept- able risk.
(2) Omission of data which makes it impossible ... assess compliance widi the standard for that requirement.
(3) An approach taken by an offerer in the design of its system or project which yields a performance which is not desired.
e. Clarification Requests (CRs). Evaluators should identify those aspects of the proposal which require clarifi- cation. If data provided in the proposal is inadequate for evaluation or contradictory statements are found, a clarifi- cation request should be issued. Clarification requests should specifically identify the aspect of die offeror's pro- posal for which clarification is required. Copies of clarifi- cation requests are sent to the Contract Team and submitted to tlie offerers the same way as deficiencies.
(1) Clarification requests which are for die pur- pose of eliminating minor irregularities, informalities or apparent clerical mistakes and which do not give the offer- or an opportunity to revise or modify its proposal do not constitute discussions. Such clarification requests may he sent prior to die initial competitive range determination.
(2) Any CRs (other than subparagraph (1) abc constitute discussions and shall not be sent before die co.. pctitivc range determination.
Ill

AFR 70-30/AFFARS Appendix BB 27 April 1988
26. Technical Evaluation.
a. Technical as well as cost (price) proposals will be submitted to the contracting officer, who will send techni- cal proposals to the technical evaluators. The technical evaluation will be conducted independent of the cost or price evaluation. Technical evaluators will not have access to cost data during the source selection.
b. The Technical Team will prepare a written report documenting the results of the evaluation of tiie proposals against the standards. Care must be taken at this time to avoid comparative analysis of technical proposals from dif-
ferent offerers. The report may include:
(1) A color rating of each proposal against all established evaluation standards reflecting the strengths,
weaknesses and risks of each proposal.
(2) A detailed narrative evaluation of eacli proposal.
(3) Identification of areas for future discussion
with each offeror.
c. The Technical Team's written report will be modified after discussions, receipt of BAFOs, and final evaluation.
d. The Technical Team report will be used by the SSET for preparation of the Proposal Analysis Report (PAR). (See paragraph 33.)
27. Cost or Price Evaluation. The Contract Team shall pre- pare a cost or price analysis. Price or cost to the government shall be included as a specific evaluation criteria in every source selection; however, price or cost will not be scored. Note that FAR 15.804-2 also applies to streamlined source selection. Appropriate use shall be made of Field pricing reports and audits, when analyzing cost proposals. Government-developed Independent Cost Analysis or Most Probable Cost Estimates shall be used, as applicable. Life Cycle Cost will be considered, if appropriate. Review of con- tractor cost data will consist of analysis to determine thai prices are fair and reasonable (EAR 15.805-2).
28. Evaluation of Other Factors.
a. In addition to cost or price analysis, the Contracting Team is responsible for evaluating all other contracting factors such as offerer's contract terms and conditions, prenward sur- veys and the making of a determination of a prospective con- tractors' responsibility according to FAR Suupart 9.1. Note die admonition in die FAR that an award "based on lowest evaluated price alone can be a false economy if there is subse- quent default, late deliveries, or other unsatisfactory perfor- mance resulting in additional contractual or administrative
costs."
b. The Contract learn will prepare a report which
includes the cost or price analysis to be used by the SSET
for preparation of the PAR. .
29. Assessment of Risk.
a. Identification and assessment of the risks associated with each proposals essential. The acquisition activity should prepare and furnish to the source selection organiza- tion an independent assessment of potential risks before receipt of proposals. The following definitions of risk
should be used:
(1) HIGH (H)~Likely to cause significant serious disruption of schedule, increase in cost, or degradation of performance even with special contractor emphasis and close government monitoring.
(2) MODERATE (M)-Can potentially cause some disruption of schedule, increase in cost, or degrada- tion of performance. However, special contractor emphasis and close government monitoring will probably be able to
overcome difficulties.
(3) LOW (L)--Has little potential to cause disrup- tion of schedule, increase in cost, or degradation of perfor- mance. Normal.contractor effort and normal government monitoring will probably be able to overcome difficulties.
b. As a part of their proposal, offerers may be required to submit a risk analysis which identifies risk areas and the recommended approaches to minimize the impact of those risks on the overall success of the program.
c. The risks assessed are those associated with cost, schedule, and performance or technical aspects of the pro-
gram.
d. It is the responsibility of the Technical Team to make sure that the Contract Team is informed of identified risk areas to determine potential impact on costs.
e. Risk assessment ratings should be identified anci discussed in the evaluation at the item summary level.
Refer to para 30b (below).
30. Color Code Rating Technique. To provide for a stan- dard color code scheme, die spectrum (Page 10) shall be used when rating evaluation criteria (except cost or price, at the item level (and at die area level if area ratings arc assigned). The color code rating depicts how well the offerer's proposal meets the evaluation standards.
a. It is important that the evaluator take advantage o.
the full range of ratings if circumstances warrant, so tha the variances between proposals may be readily idoiitinc;;
112

10 AFR 70-30/AFFARS Appendix BB 27 April 1988
'.... The evaluation process should not merely attempt to classify ( 'ill proposals as either fully acceptable or as unacceptable.
b. Risk assessments (high, moderate or low in accor- dance with paragraph 29) should be described at the item summary level with color ratings when used. Refer to Attachment 5 for an example of how color ratings and risk assessments might be graphically displayed in a matrix. Any risk assessment rating may be used with any color code as appropriate according to evaluation results. The "probability of satisfying the requirement" statements with- in the color code definitions assess different evaluation aspects than do the risk assessment ratings. The "probabili- ty of satisfying the requirement" statements within the color code definitions reflect evaluation of how well the technical or management approach (for example) within the proposal meets the requirements. The risk assessment rating (high, moderate or low) reflects evaluation of how likely the proposed approach will actually be achieved.
c. Proposals should be rated twice:
(1) Upon completion of the evaluation of the initial proposal before the competitive range determination, and
(2) After the submission of BAFOs. This is not needed where award is based on an original proposal sub- mission without discussion in accordance witli FAR 15.610.
d. The SSET will evaluate proposals against the estab- lished standards. The SSET will not compare proposals against each other until preparation of the PAR.
31. Determination of Competitive Range. The Contract Team shall review the results of the Technical Team's ini- tial evaluation and the cost and price proposals. Based on
this review, the Contracting Officer shall determine which firms are within the competitive range. FAR 15.609 pro- vides guidance regarding the competitive range determina- tion. Elimination of an offeror from the competitive range at any time during the source selection process is subject to the approval of the SSA.
a. The competitive range is determined after evalua- tion of all proposals received, on the basis of price or cost, technical, and other salient factors including proposal defi- ciencies and their potential for correction. Before includ- ing or excluding a proposal from within the competitive range, the possibility of its selection for award should be assessed. The objective is not to eliminate proposals from the competitive range, but to facilitate competition by con- ducting written and oral discussions with all offerors who have a reasonable chance of being selected for an award.
b. Only proposals that have a reasonable chance for selection are to be included in the competitive range; how- ever, where there is doubt as to whether a proposal is or is not within the competitive range, that doubt must be resolved by considering the proposal as being within the competitive range. The determination of competitive range is based on informed judgment and is complex in nature. All such decisions must be completely and adequately doc- umented for the record. A proposal may be determined outside the competitive range if:
(1) It does not reasonably address the essential requirements of the solicitation.
Color
Blue
Green
Yellow
Red
Rating
Exceptional
Acceptable
Marginal
Unacceptable
Definition
Exceeds specified performance or capability in a beneficial way to thettAir Force; and has high proba- bility of satisfying the requirement; and has no significant weakness.
Meets evaluation standards; and has good probability of satisfying the requirement; and any weaknesses can be readily corrected.
Fails to meet minimum evaluation standards; and has low probability of satisfying the requirement; and has significant deficiencies but correctable.
Fails to meet a minimum requirement: and deficiency requires major revision to the proposal to make it correct.
113
AFR 70-30/AFFARS Appendix BB 27 April 1988
U
(2) A substantial technical drawback is apparent in the proposal and sufficient correction or improvement to consider the proposal further would require virtually an entirely new technical proposal.
(3) The proposal contains major technical or busi- ness deficiencies or omissions, or out-of-line costs, which initial or continuing discussions with the offeror could not reasonably be expected to cure. Before eliminating an offer- or from the competitive range based on unrealistic costs or prices, it will be necessary to the extent possible, without discussions with the offeror, to determine the reason for the out-of-line costs or prices. For example, the costs might be attributable to a unique design approach, a technical break- through or an accelerated delivery. These may be legitimate reasons for the apparent out-of-line costs or prices.
c. Under specific circumstances, contract award may be made after evaluating competitive proposals without discussion. Normally, written or oral discussions shall be conducted with all offerors in the competitive range and shall culminate in signed contractual documents represent- ing the firm commitment of each such offeror.' However, by statute (10 U.S.C. 2305(b)(4)) contract award may be made after evaluating competitive proposals without dis- cussions. When awarding without discussions, it must be clearly demonstrated from the existence of full and open competition or from accurate prior cost performance with the product or service that acceptance of an initial proposal without discussions would result in the lowest overall cost to the United States. Reference FAR 15.610.
32. Conducting Discussions With Offerors.
a. Discussions, whether written or oral, shall be led by the Contracting Officer as outlined in FAR 15.610. Discussions should:
(1) Ensure that the offerors clearly understand the objective of the acquisition and the government's require- ment.
(2) Ensure that the Air Force cvaluators clearly understand the offerer's proposal.
(3) Explore areas of deficiency or those requiring clarification in the offerer's proposal. All offerors deter- mined to be in the competitive range and selected to partic- ipate in oral and written discussions must be advised of any deficiencies in the proposals, and offered a reasonable opportunity to correct or resolve the deficiencies. Offerors must submit such price or cost, technical, or other proposal revisions as may result from the discussions. Discussions with each offeror in the competitive range must be con- fined exclusively to die offerer's proposal and its identified deficiencies relative to the solicitation requirements.
Discussions must be conducted in a way thai scrupulously avoids disclosure of the relative strengths and weaknesses of competing offerors, technical information or ideas, or cost (price) data from any other offerer's proposal.
b. After discussions, offerors who are determined to be within the competitive range shall be afforded the opportuni- ty to submit BAFOs as explained in FAR 15.611 for all aspects of their proposals, including cost or price. The BAFO request shall be in writing and advise offeror.- -.if the requirement to submit rationale for all changes (inciwiiug cost or price) from the initial proposal. The BAi:0 request must include information to the effect that discussions arc being concluded and that the offerors arc to submit their BAFO. The offerers' confirmation of a prior offer or revised final offer must be submitted by the final common cut-off date specified. Any revision to a proposal received after the established final common cut-off date must thereafter be handled as "late" in accordance with FAR 15.412.
c. After BAFOs are received, the Technical Team will document any changes in an offerer's technical proposal and any resulting changes to previous technical evaluations and ratings. Arrows (T i) may be used to denote improvement or degradation from initial proposal evaluations. The Contract Team will likewise explain changes lo cost proposals and pre- pare a report on the cost or price evaluation of each proposal.
d. Contracting officers shall not call for BAFOs more than once unless approved by the SSA.
33. Proposal Analysis Report (PAR). The final Technical Team and Contracting Team reports will be used by the entire SSET for preparation of a PAR (see Attachment 8). The SSET, under the guidance of the chair- person, shall prepare a PAR summarizing the strengüis, weaknesses, and risks of each proposal and their resultant ratings (color coded or narrative). This summary, together with the Technical Team report and the Contracting Team report, will be sent to the SSA for the final source selection decision.
34. Source Selection Uriefings. The chairperson of the SSET is responsible for briefing the results of the SSET analysis to the SSA. The recipients and the scope of die briefings depend on the organization level at which the SSA has been established. Ail in attendance must com- plete a certification in which they agree to safeguard source selection sensitive information and abide by the standards of conduct set Tordi in AFR 30-30. When appropriate, die SSA may waive the requirement for a formal briefing and utilize the PAR during discussions with the SSET.
35. Source Selection Decision Document and Contract Award. The Source Selection Decision Document, which sets forth the rationale in support of the decision,
114

12 AFR 70-30/AFFARS Appendix BB 27 April 1988
shall be prepared by the SSET chairperson per instruc- tions from the SSA. It shall be signed by the SSA, and sent to the contracting officer who shall execute the con- tract. The decision document should describe the basis for the decision in terms of beneficial value to the gov- ernment especially when award is to be made to an offer- or with other than the lowest price or cost. When award is made to a higher priced, higher rated offeror, the SSA should make a specific determination in the decision doc- ument that the technical superiority of the higher priced proposal warrants the additional cost involved. See Attachment 9 for an example format of the Source Selection Decision Document.
36. Notifications. The contracting officer is responsible for notifying successful and unsuccessful offerors as pre- scribed by FAR 15.10. For contract awards over S3 mil- lion, coordinated, public announcement will be made through the Office of Legislative Liaison and the Office of Information at HQ USAF. Refer to AFFARS 5.303.
37. Debriefings. Debriefing of unsuccessful offerors shall be made according to FAR 15.10. All debriefings will be conducted after award and confined to a general discussion of the offerer's proposal, its weak and strong points in rela- tion to the requirements of die solicitation and not relative to die other proposals. No information will be disclosed as to ratings assigned.
SECTION D--SOURCE SELECTION DOCUMENTA- TION
38. Release of Source Selection Information.
a. Release of source selection data while the source selection is in process is the responsibility of the SSA. Subsequent to contract award, disclosure authority lo per- mit access to and release of source selection records is vested in the HCA. See Attachment 10 for examples of source selection documentation guidelines. Refer to Attachment 11 for the format of a source selection sensi- tive covcrshect which may be reproduced locally, normal- ly on yellow colored paper when available and appropri- ate.
b. When a protest has been lodged before or after con- tract award to the General Accounting Office (GAO), General Services Board of Contract Appeals (GSBCA), or other level in which the Air Staff or Secretariat is involved, pertinent source selection documents shall be forwarded to SAF/AQCX. Refer to protest procedures in FAR and AFFARS Part 33. Such information shall be marked to prevent its inadvertent release. The final decision as to which source selection records are pertinent to the protest rests with SAF/AQC.
c. Request for Source selection data by the Congress or the General Accounting Office (GAO), for other thr protest issues, will be processed under AFR 11-7 and AJ 11-8. Requests for data from the Office of the Assistant Inspector General for Auditing will be processed under AFR 11-38. These activities must be informed of the restrictions against public disclosure of confidential infor- mation or proprietary data provided by offerors.
SECTION E-ALTERNATIVE SOURCE SELECTION ORGANIZATION
39. SSAC-SSEB Alternative Organization. The SSA has the option of using an alternative source selection organization in which a separate Source Selection Advisory Council (SSAC) and Source Selection Evaluation Board (SSEB) are utilized rather than combin- ing them into a single SSET. The policies and procedures of earlier paragraphs in this regulation apply to this alter- native approach except as modified by instructions in this section. Since the SSAC-SSEB approach is usedjn major source selections, AFR 70-15/AFFARS Appendix AA may be used as a reference guide in conjunction with this section. The alternative organization shall consist of an SSA, SSAC and SSEB for each acquisition. The SSAC is a group of senior civilian and military personnel appoint- ed by the SSA to advise on the conduct of the source selecdon process. The SSAC is responsible for prcparr a comparative analysis of the evaluation results compik by the SSEB. The SSEB is a group of civilian and mili- tary government personnel representing the various rele- vant functional and technical disciplines. The SSEB con- sists of a Technical Team and a Contract Team who per- form duties as described earücr in Ulis regulation <v.'-.i-pi that they report their findings to -he- SSAC.
40. SSA Responsibilities and Duties. Tlic SSA is respon- sible for the proper and efficient conduct of the enlire source selection process and has full authority to make the source selection decision subject to law and applicable reg- ulations. The SSA shall:
a. Review and approve in writing the SS? including any special instructions or guidance regarding solicitation, contract provisions and objectives.
b. Authorize release of the solicitation document. This authority may be delegated to no lower than the SSAC Chairperson.
c. Appoint Ute chairperson and members of the SSAC.
d. Provide the SSAC and SSEB with guidance ar special instructions to conduct the evaluation and seicctio. process.
115
AFR 70-3Ü/AFFARS Appendix BB 27 April 1988
13
' e. Take necessary precautions to ensure against pre- mature or unauthorized disclosure of source selection information.
f. Approve the Contracting Officer's determination to exclude offerers from the competitive range at any point in the selection process.
g. Make the final selection decisions) and document the supporting rationale in the Source Selection Decision Document.
h. Approve ail cases where it is necessary for the Contracting Officer to reiterate a call for BAFO.
41. SSAC Responsibilities and Duties. The SSAC responsibilities and duties normally include the following:
a. Making sure that personnel resources and time devoted to source selection are not excessive in relation to die complexity of die acquisition or project.
b. Reviewing and approving Lhe evaluation standards developed by die SSEB.
c. Designating the chairperson and approving mem- bership of the SSEB.
d. Making sure that appropriate actions are taken con- sistent with the FAR to obtain compeddon in die selection process.
e. Instructing all source selection personnel to comply with conflict of interest procedures of AFR 30-30 and dis- qualifying any person regarding real, potential or perceived conflicts of interest.
f. Reviewing and recommending approval of die source selection plan to lhe SSA.
g. Reviewing and recommending the release of the solicitation to the SSA (unless the SSA has delegated release audiority to die SSAC Chairperson).
h. Determining whether oral presentations should be conducted and ensuring that the SSEB Chairperson records minutes of oral presentations.
i. Reviewing the Contracting Officer's competitive range determination and providing comments to die SSA when any offcror is excluded at any point in the evaluation process.
j. Analyzing the evaluation and Undings of die SSEB and applying weights, if established, to the evaluation results.
k. ComparingThe proposals based on analysis of the SSEB evaluation and results of contract negotiations.
1. Preparing the SSAC Analysis Report for submis- sion to die SSA with the SSEB report attached. The
.. SSAC must present a report analyzing relevant informa- tion resulting from evaluation of proposals and other con- siderations to permit the SSA to arrive at the final selec- tion decision.
m. Offering a recommendation, if requested by lhe SSA. (This is not normally requested.) ' '
n. Preparing the Source Selection Decision Document for the SS A's signature, if requested by the SSA.
o. Providing briefings and consultations as requested by the SSA.
42. SSEB Responsibilities and Duties. The SSEB con- sists of a Technical Team and a Contract Team similar to the SSET organization (see paragraph 9). The SSEB responsibilities and dudes include die following:
a. Developing evaluation standards for approval by die SSAC.
b. Recording minutes of oral presentations if conducted.
c. Conducting an in-depth review and evaluation of each proposal against the soliciation requirements, the approved evaluation criteria, and die standards.
d. Preparing and submitting the SSEB evaluation report to the SSAC for analysis along with a summary report of the findings.
e. Providing briefings, draft reports and consultations concerning the evaluation as required by the SSA or SSAC.
43. SSAC-SSEB Pre-Evaluation Activities. The policies and procedures of Section B apply to the SSAC-SSEB source selection organizadon except that the SSAC shall approve die evaluaüon standards. See Attachment 12 for a schedule of SSAC-SSEB organizadon events.
44. SSAC-SSEB Proposal Evaluation. The policies and procedures of Section C apply to the SSAC-SSEB source selection organization as modified by the following instruc- tions:
a. A determination regarding whether oral orescma- lions should be conducted 'drill be made by lhe >SA( chairperson, and die SSEU ch-i person shall <;i :v:" utcs arc made for the source selection file.
116
14 AFR 70-30/AFFARS Appendix Uli
27 April 1988
'b. Technical and cost evaluations shall be made by the SSEB technical and contract teams and provided to the SSAC in a written report which is, in turn, used by the SSAC to prepare its report to the SSA.
c. The SSEB evaluates proposals against the estab- lished standards and presents a report to the SSAC. See Attachment 13 for an example of a format for an SSEB report. See Attachment 5 for an example of a graphic depiction of ratings using a matrix.
d. Comparison of proposals is the responsibility of the SSAC and is based on an analysis of the evaluation per- formed by the SSEB and the results of contract negotia- tions.
e. The SSAC must present to the SSA a report analyz- ing all relevant information resulting from evaluation of proposals and other considerations to permit the SSA to arrive at the final selection decision. See Attachment 14 for an example of a format for a SSAC report.
f. A recommendation of the final decision should not be included in the SSAC analysis report unless requested by the SSA. This is normally not requested.
g. Briefings may be desirable by the SSEB chairper- son to the SSAC and by the SSAC chairperson to the SSA in addition to the written reports. Sec Attachment 5 for an example of a method to graphically display ratings and risk assessments on a matrix.
h. The Source Selection Decision Document should be prepared by the SSAC chairperson for signature by the SSA in accordance with paragraph 35 and Attachment 9.
45. SSAC-SSEB Source Selection Documentation. The policies and procedures of Section D apply. Also see Attachment 10 for guidance on source selection documenta- tion.
117
AFR 70-30/AFFARS Appendix BB 15/16
27 April 1988
BY ORDER OF THE SECRETARY OF THE AIR FORCE
OFFICIAL LARRY D. WELCH, General, USAF "Chief of Staff
WILLIAM 0. NATIONS, Colonel, USAF Director of Information Management
and Administration
SUMMARY OF CHANGES
This revision to the regulation adds procedures for an alternative source selection organization and amplifies source selec- tion guidance in several areas of text and new attachments including foreign miliary sales, responsibilities of chief or con- tracting, evaluation criteria, color code definitions, assigning risk assessment ratings at item summary level, H<*- MY or terms, source sciecton documentation markings, examples of evaluation matrix and standards, and sample formt'.* I<- (,..-.<i- ciency reports, decision documents, and evaluation report contents.
118

AFR 70-30/AFFARS Appendix BB Attachment 1 27 April 1988
17
GLOSSARY OF KEY TERMS
Assessment Criteria. A type of evaluation criteria that relates to the offerer's proposal and abilities and is applied to specific criteria (that relates to program/project charac- teristics) in a matrix fashion.
Best and Final OfTer (BAFO). A final proposal submis- sion by all offerors in the competive range submitted at a common cut-off date at the request of the Contracting Officer after conclusion of discussions.
Business Strategy Panel (BSP). A group of experts to advise the Program Office on its recommended acquisition strategies (Also see AFR 70-14/AFFARS Appendix CC).
Contract Team. A group of government personnel within the SSET (or SSEB) who are responsible for cost (or price) analysis of the offerors' proposals, contract definkization and negotiation.
Evaluation Criteria. The basis for measuring each offer- or's ability as expressed in its proposal, to meet the govern- ment's needs as stated in the solicitation. Evaluation crite- ria is an "umbrella" term that includes the cost (price) crite- rion, specific criteria and assessment criteria.
Evaluation Standards. A statement of the minimum level of compliance with a requirement which must be offered for a proposal to be considered acceptable.
General Consideration. Element of evaluation in the source selection that typically relates to proposed contrac- tual terms and conditions, results of preaward surveys, past performance and others. Evaluation of general considera- tions and evaluation of the proposal using evaluation crite- ria both combined to provide the basis for award in an inte- grated assessment.
Independent Cost Analysis (ICA). An independent test of the reasonableness of an official program office cost estimate of a major weapon system. ICAs are prepared by the Comptroller to support the Defense Acquisition Board (DAB) process and at other selected points in the acquisi- tion process (see AFR 173-11).
Life Cycle Cost. The total cost to the government for a system over its full life including the cost of development, procurement, operation, support and disposal.
Most Probable Cost (MPC). The government estimate of the total cost most likely to be incurred by each offeror if a contract is awarded. This should include any government cost incurred such as government furnished property or facilities.
Program or Project Manager or Director. The person responsible for managing a program or project (see AFR 800-2).
Program Office. The office under the direction of Program Manager that will carry out the program or pro- ject.
Solicitation Review Panel. A group of highly qualified government officials that review the Request for Proposal (RFP) and other documentation for selected acquisitions to make sure that excessive or nonessential technical, man- agement or acquisition related requirements are eliminated; that the solicitation documentation outlines clearly what the government plans to buy and that business management considerations are assessed.
Source Selection Advisory Council (SSAC). Part of the alternative source selection organization, this group of senior government personnel is appointed by the SSA to advise the SSA on the conduct of the source selection pro- cess and to prepare for the SSA a comparative analysis of the evaluation results of the Source Selection Evaluation Board (SSEB).
Source Selection Authority (SSA). The official designat- ed to direct the source selection process and make the source selection decision.
Source Selection Evaluation Board (SSEB). Part of the alternative source selection organization, this group of gov- ernment personnel represents the various functional technical disciplines relevant to the acquisition, evah. proposals and reports its findings to the SSAC. The SSu^ consists of a Contract Team and a Technical Team.
Source Selection Evaluation Team (SSET). The primary source selection organization within this regulation that evaluates proposals, prepares a comparative analysis of the evaluation, and presents the results to the SSA. The SSET consists of a Contract Team and a Technical Team.
Source Selection Plan {SSI')- A plan, prepared <"•■- the approval of the SSA, for orgv.ni7.ing and conducing me evaluation and analysis of proposals and selection of tiic source or sources.
Specific Criteria. A type of evaluation criteria that relates to project characterisitics which are further subdivided into areas, items, factors and subfactors as necessary. The low- est level of indenture depends upon the complexity of the area being evaluated. Note that die FAR 15.406-5 term "factor" includes the terms "area" and "item" in diis regula- tion. The FAR term "subfactor" equates to the term "fac- tor" in this regulation.
Technical Team. A group of government personnel wilhin the SSET (or SSEB) representing the various functional
" and technical disciplines (other than cost and contracting who evaluate the proposals and report their findings.
119

18 AFR 70-30/AFFARS Appendixe BB Attachment 2 27 April 1988
REGULATORY REFERENCES
Federal Accmisition Reeulation (FAR)
2.1 Definitions 3.501 Buying-in 4.1 Contract Execution 5.1 Dissemination of Information 5.2 Synopses of Proposed Contract Actions 6.1 Full and Open Competition 7.1 Acquisition Plans 9.0 Contractor Qualifications 15.4 Solicitation and Receipt of Proposals and Quotations 15.6 Source Selection 15.610 Written or Oral Discussions 15.8 Price Negotiation 15.10 Preaward, Award, and Postaward Notifications, Protests, and Mistakes 24.2 Freedom of Information Act 33.1 Protests 42.4 Correspondence and Visits
DOD FAR Sunolement fDFARS")
15.613 Alternative Source Selection Procedures Appendix L DOD Freedom of Information Act Program
AF FAR Supplement ( AFFARS1
5.303 Announcement of Contract Awards 33.1 Protests Appendices AA,
BB.CC See AFR 70-15, AFR 70-30 and AFR 70-14 (below)
Other Reeulations
. Air Force Relations with Congress AFR 11-7 AFR 11-8 Air Force Relations with Government Accounting Office (GAO) AFR 11-12 Correspondence With and Visits to Contractor Facilities AFR 11-38 Air Force Relations With the Office of the Assistant Inspector General for
Auditing and Auditing Followup, Department of Defense AFR 12-30 Air Force Freedom of Information Act Program AFR 30-30 Standards of Conduct AFR70-14/AFFARS
Appendix CC Business Strategy Panels „ AFR70-I5/AFFARS
Appendix AA Formal Source Selection for Major Acquisitions AFR 70-30/AFFARS
Appendix BB Streamlined Source Selection Procedures AFR 173-11 Independent Cost Analysis Program AFR 205-1 Information Security Program AFR 800-2 Acquisition Program Management AFR 800-11 Life Cycle Cost Management Program AF Pamphlet 70-1 Do's and Don'ts of Air Force-Industry Relations AF Manual 12-50 Disposition of Air Force Documentation DODD 4105.62 Selection of Contractual Sources for Major Defense Systems DODD 5000.1 Major and Non-Major Defense Acquisition Programs
: 120 ~«
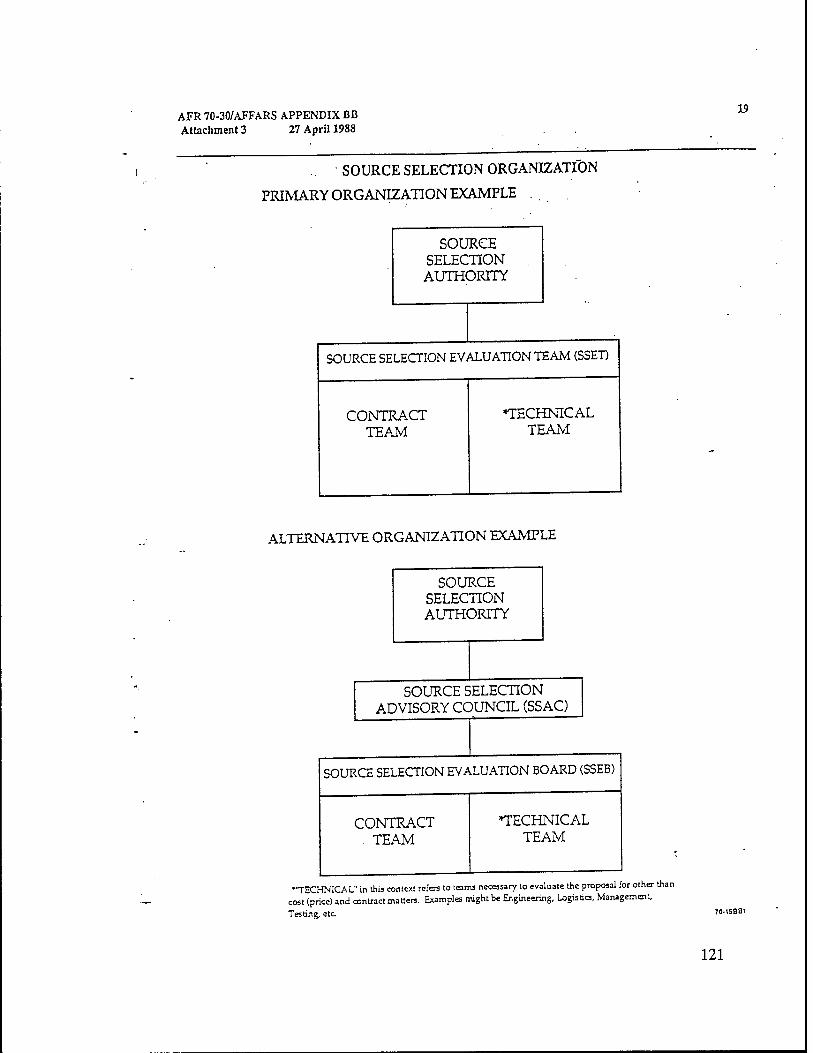
AFR 70-30/AFFARS APPENDIX BB Attachment 3 27 April 1988
SOURCE SELECTION ORGANIZATION
PRIMARY ORGANIZATION EXAMPLE .
19
SOURCE SELECTION AUTHORITY
SOURCE SELECTION EVALUATION TEAM (SSET)
CONTRACT TEAM
»TECHNICAL TEAM
ALTERNATIVE ORGANIZATION EXAMPLE
SOURCE SELECTION AUTHORITY
SOURCE SELECTION ADVISORY COUNCIL (SSAC)
SOURCE SELECTION EVALUATION BOARD (SSEB)
CONTRACT TEAM
TECHNICAL TEAM
"TECHNICAL" in this context refers to teams necessary to evaluate the proposal for other than cost (price) and contract matters. Examples might be Engineering, Logistics, Management,
Testing, etc. 70-15881
121

20 AFR 70-30/AFFARS Appendix BB Attachment 4 27 April 1988
SSET SOURCE SELECTION EVENTS
1. Business Strategy Panel 2. Sources Sought Synopsis 3. Acquisition Plan 4. Source Selection Authority Named 5. Source Selection Evaluation Team Chief Named 6. Source Selection Plan 7. Source Selection Evaluation Team Established 8. Request For Proposal (RFP) Preparation 9. Complete Reviews of RFP 10. Evaluation Standards Approved by SSET Chief 11. Source Selection Authority Briefed on RFP 12. RFP Released 13. Proposals Received 14. Evaluation:
a. Request Audit Support b. Request Past Performance Information c. Evaluate Proposals d. Prepare Deficiency Report and Clarification Requests e. Prepare Initial Evaluation Report
15. Competitive Range Determination and Briefing (as appropriate) 16. Contracts Prepared 17. Receive Best and Final Offer 18. Review Bestand Final Offer 19. Complete Proposal Analysis Report 20. Source Selection Authority Decision Briefing 21. Source Selection Decision Document Preparation 22. Contract Award 23. Notification to Unsuccessful Offerors 24. Debricfings 25. Post Award Conference .
NOTE: These are typical events that may or may not occur depending on the particular source selection. For example, if award is made without discussions in accordance with FAR 15.610, items 14d, 14e, 17 and 18 would not be applica- ble.
122
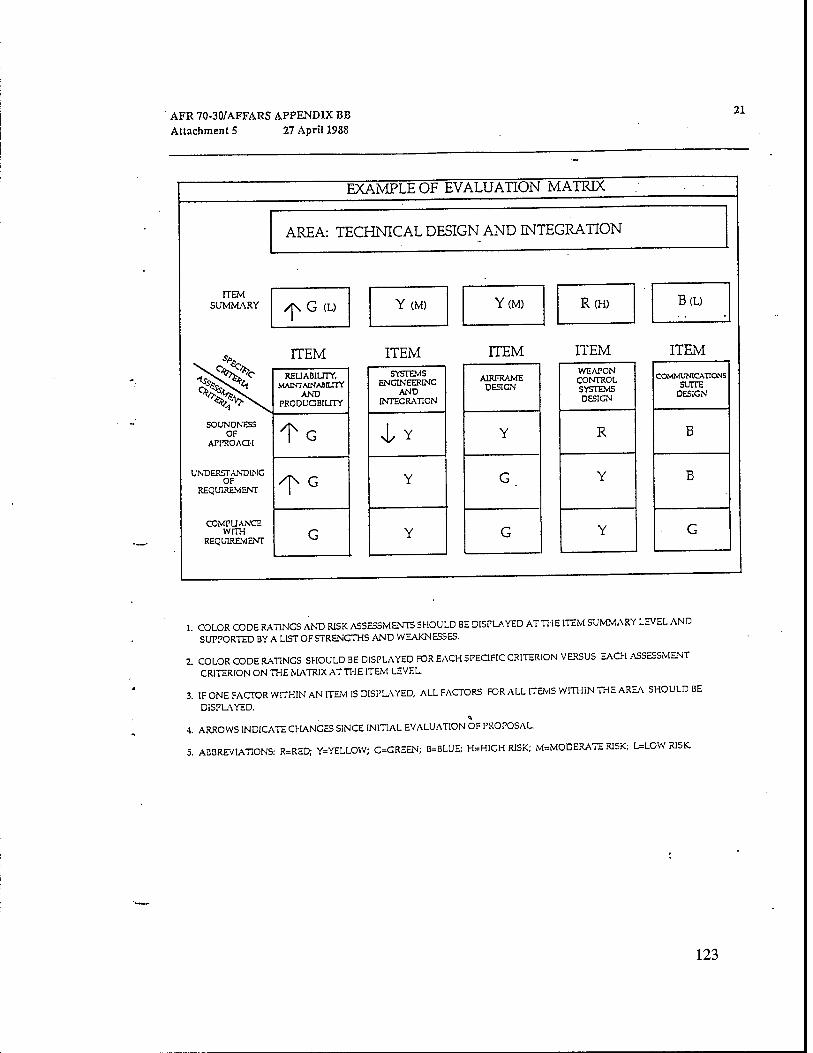
AFR 70-30/AFFARS APPENDIX BB Attachment 5 27 April 1988
21
ITEM SUMMARY
UNDERSTANDING OF
REQUIREMENT
COMPLIANCE WITH
REQUIREMENT
EXAMPLE OF EVALUATION MATRIX
AREA: TECHNICAL DESIGN AND INTEGRATION
1s G (U
ITEM RELIABILITY,
MAJNTAttiAamrY AND
PRODUdBlLITY
"T
Y (M)
ITEM SYSTEMS
ENCINEERINC AND
INTEGRATION
iv
Y
Y
Y(M)
TTEM
AIRFRAME DESIGN
Y
R(H)
ITEM WEAPON CONTROL SYSTEMS DESIGN
R
Y
Y
B(L)
ITEM
COMMUNICATIONS SUITE
DESIGN
B
B
1. COLOR CODE RATINGS AND RISK ASSESSMENTS SHOULD BE DISPLAYED AT THE ITEM SUMMARY LEVEL AND
SUPPORTED BY A LIST OF STRENGTHS AND WEAKNESSES.
2. COLOR CODE RATINCS SHOULD BE DISPLAYED FOR EACH SPECIFIC CRITERION VERSUS EACH ASSESSMENT
CRITERION ON THE MATRIX AT THE ITEM LEVEL.
3. IF ONE FACTOR WITHIN AN ITEM IS DISPLAYED, ALL FACTORS FOR ALL ITEMS WITHIN THE AREA SHOULD BE
DISPLAYED.
4. ARROWS INDICATE CHANGES SINCE INITIAL EVALUATION OF PROPOSAL.
5. ABBREVIATIONS: R=RED; Y=YELLOW; G=CREEN; B=BLUE; H=HIGH RISK; M=MODERATE RISK; L=LOW RISK.
123
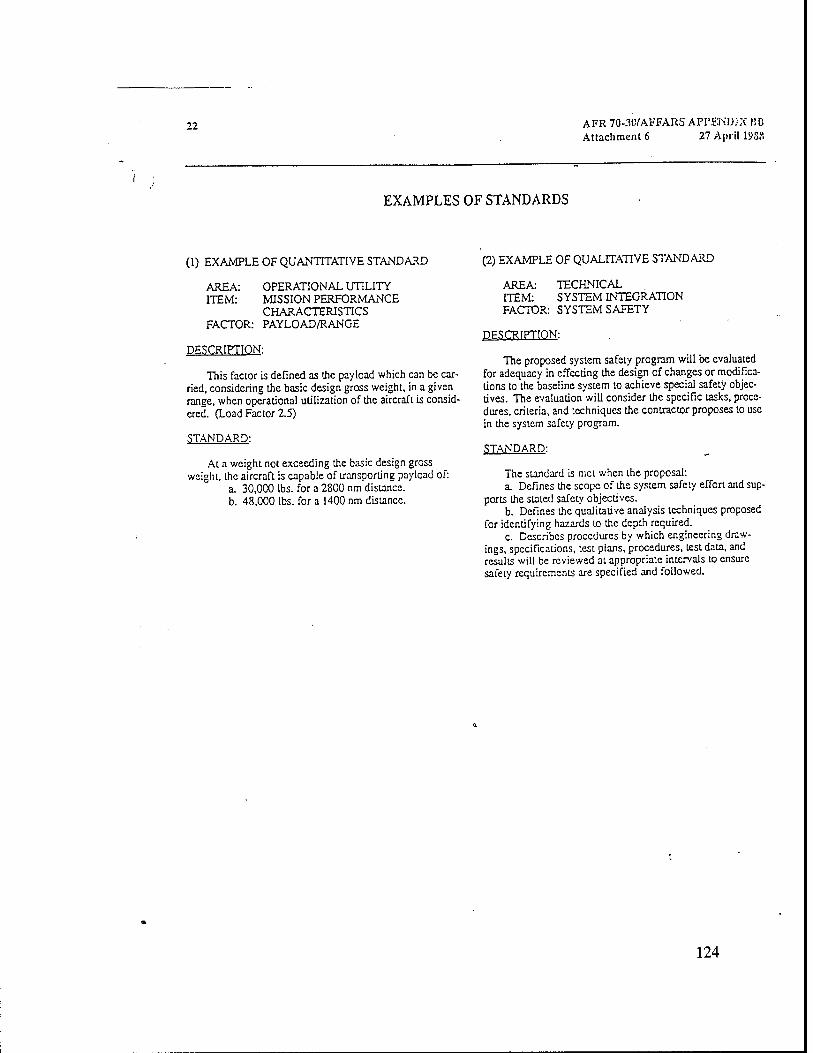
22 AFR 70-30/AFFARS APPENDIX CD Attachment 6 27 April 193S
EXAMPLES OF STANDARDS
(1) EXAMPLE OF QUANTITATIVE STANDARD
AREA: OPERATIONAL UTILITY ITEM: MISSION PERFORMANCE
CHARACTERISTICS FACTOR: PAYLOAD/RANGE
DESCRIPTION:
This factor is defined as the payload which can be car- ried, considering the basic design gross weight, in a given range, when operational utilization of the aircraft is consid- ered. (Load Factor 2.5)
STANDARD:
At a weight not exceeding the basic design gross weight, the aircraft is capable of transporting payload of:
a. 30,000 lbs. for a 2800 nm distance. b. 48,000 lbs. for a 1400 nm distance.
(2) EXAMPLE OF QUALITATIVE STANDARD
AREA: TECHNICAL ITEM: SYSTEM INTEGRATION FACTOR: SYSTEM SAFETY
DESCRIPTION:
The proposed system safety program will be evaluated for adequacy in effecting the design of changes or modifica- tions to the baseline system to achieve special safety objec- tives. The evaluation will consider the specific tasks, proce- dures, criteria, and techniques the contractor proposes to use in the system safeLy program.
STANDARD:
The standard is met when the proposal: a. Defines the scope of the system safety effort and sup-
ports the slated safety objectives. b. Defines the qualitative analysis techniques proposed
for identifying hazards to the depth required. c. Describes procedures by which engineering draw-
ings, specifications, test plans, procedures, test data, and results will be reviewed at appropriate intervals to ensure safety requirements are specified and followed.
124

u
AFR 70-30/AFFARS Appendix BB Attachment 7 27 April 1988
23
FORMAT FOR PREPARING DEFICIENCY REPORTS
AREA.
DEFICIENCY REPORT NO.
ITEM
FACTOR OFFEROR.
Nature of Deficiency:
State the nature of the deficiency. Be concise. Include a reference, by offerer's document, paragraph and page that will quickly identify the offeror's submission.
Summary of Effect of Deficiency:
State how the uncorrected deficiency would affect the program if it were accepted "as is."
Reference:
Indicate the references that adequately substantiate that the data evaluated are deficient. These may be statements in the solicitation, statements of work, specifications, etc.
Area Captain Evaluator Area and Item Designator
125

24 AFR 70-30/AFFARS Appendix BB Attachment 8 27 April 1988
SSET FORMAT FOR PREPARATION OF PROPOSAL ANALYSIS REPORT (PAR)
1. Introduction. Information included in this section con- sists of the following:
a. The authority for the source selection action.
b. Data pertaining to the Source Selection Plan (SSP), its date of approval, who prepared the plan, etc.
c. Basis for award and evaluation criteria.
d. The composition of the Source Selection Evaluation Team (SSET), with the lists of commands and organizations who participated as SSET members.
e. The basic composition of the Technical Team and Contract Team identified by functional specialities and by organization.
f. Discussion of the requirements set forth in the solicitation, including salient points and a listing of the sources to whom the solicitation was provided.
g. Identification of the offerers who responded and those in the competitive range.
2. Description of Proposals. This section contains a brief summary description of the proposals submitted by each offerer within the competitive range. No judgments or comparisons as to the quality, rating, or ranking of propos- als will appear in this section.
3. Comparative Analysis of Proposals. This section con- tains a comparative analysis of the proposals within the competitive range by identifying and comparing strengths, weaknesses, and risks by area, items, and significant fac- tors other than cost. If a strength, weakness, or risk appears in one proposal and is noteworthy, comments per- taining to similar strengths, weaknesses, or risks should be included for every offerer.
5. Risk Assessment. The general impact of all significant risks associated with each proposal within the competitive range is contained in this section. These will include:
a. Technical risks inherent in the offerer's proposal.
b. Schedule risk as assessed against the technical approach.
c. Confidence that can be placed in the cost or price estimate provided by each offerer, taking into consideration technical and schedule risk.
6. Overall Assessment of Past Performance. Provide an integrated analysis of the offerer's past performance history on contractual efforts that is relevant to the proposal being reviewed.
7. Contractual Considerations. Discuss significant con- tractual agreements with each offerer in the competitive range, and any significant differences between offerers.
8. SSET Findings. Provide a comparative analysis, expressed in brief statements, of the issues considered by the SSET to be significant to the decision. If requested by the Source Selection Auüiority (SSA) a recommendation will be included.
9. Signature Page. A page bearing the signature of the chairperson (and members of the SSET when appropriate).
NOTE: The sections of the PAR are mandatory as a mini- mum; however, supporting data may be incorporated by reference if included elsewhere in the source selection records.
4. Cost. The reasonableness, realism, and completeness of each contractor's cost proposal should be compared, and fully explained.
126

AFR 70-30/AFFARS Appendix BB 25
Attachment 9 27 April 1988
EXAMPLE OF FORMAT FOR SOURCE SELECTION DECISION DOCUMENT
FOR OFFICIAL USE ONLY
SOURCE SELECTION DECISION
FOR THE (Name of!
RFP No..
Pursuant to Air Force Regulation 70-30, as the Source Selection Authority for this acquisition I have determined the (Name of System1) proposed hv (Successful Offerer) provides the best overall value to satisfy Air Force needs. This selection was made based upon the criteria established in Section M of the Request for Proposal (RFP) "Evaluation Factors for Award" and my integrated assessment of the proposals submitted in response to the RFP, the terms and con- ditions agreed upon during negotiations, and the capability of (Successful Offerer) to fulfill the subject requirement.
The (five') evaluation criteria against which the potential sources were measured in order of importance, were (1) Operational Utility; (2) Readiness and Support; (3) Life Cycle Cost; (4) Design Approach; and (5) Manufacturing Program and Management.
While all proposals in the competitive range for the system are adequate when measured against the above cri- teria, the (Successful Offerer's) proposal offers significant operational utility and clearly provides the best system in terms of operational effectiveness. 's proposal is superior in terms of operational effectiveness, in part because of its excellent instrument arrangement which includes a logically designed and uncluttered instrument panel, in addition to excellent access to all controls. 's proposal displayed outstanding consideration for opera- tional supportability by building a full-scale mock-up to refine reliability and maintainability concepts. The system has the strongest characteristics in the area of reliability, maintainability and availability. The design is also the best, meeting or exceeding all RFP requirements. It is exceptional for crew station, escape system and avion- ics design. The design substantially enhances its reliability and maintainability. 's manufacturing approach to the system clearly makes it the leader in this area. Its team of managers and employees, coupled with exist- ing facilities, assure development and fielding of a quality system.
Although the most probable total life cycle cost of 's system is not the lowest, it is only ___* percent more than the lowest total life cycle cost and offers the lowest evaluated operating support cost. It is my view that the small difference in total life cycle cost is more than offset by the superior characteristics of 's system.
In summary, based on my assessment of all proposals in accordance with the specified evaluation criteria, it is my deci- sion that 's proposed system offers the best overall value.
(Source Selection Authority) SOURCE SELECTION AUTHORITY
FOR OFFICIAL USE ONLY
»NOTE: Most probable life cycle cost or most probable cost is a government estimate of something other than the instant contract cost (price). Therefore, the percentage does not reveal the source selection sensitive proposed price of a non-winning offerer.
127
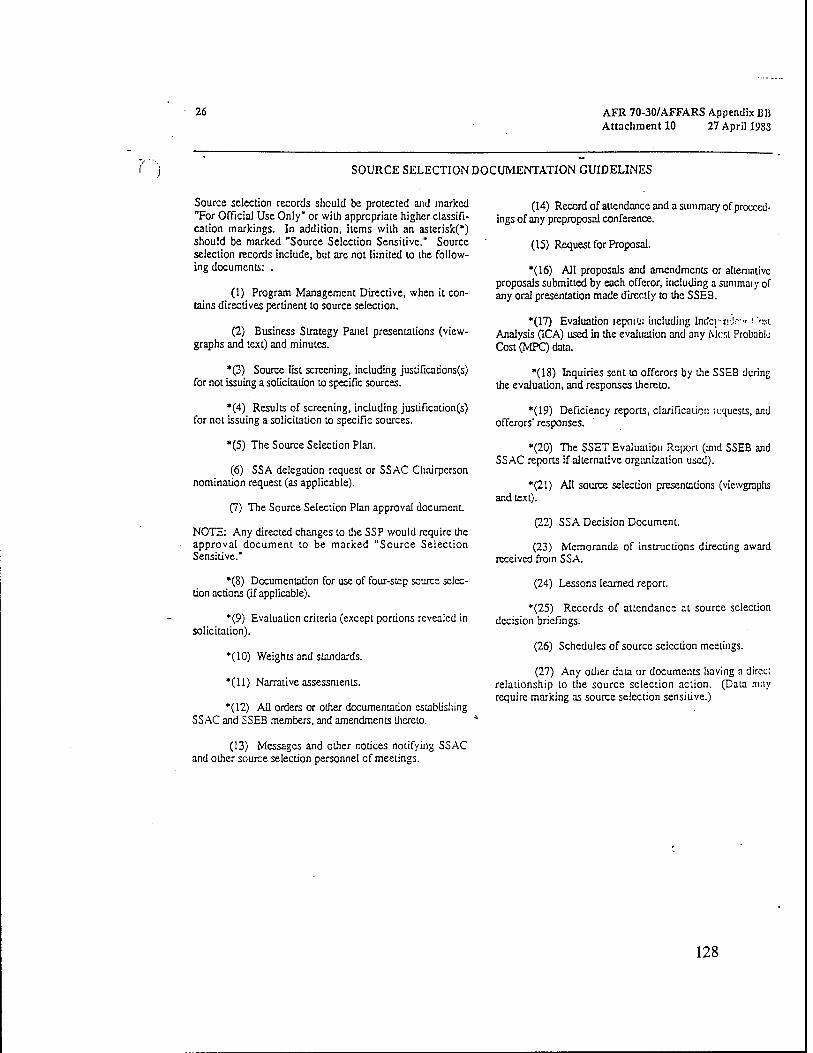
26 AFR 70-30/AFFARS Appendix Bli Attachment 10 27 April 1983
SOURCE SELECTION DOCUMENTATION GUIDELINES
Source selection records should be protected and marked "For Official Use Only" or with appropriate higher classifi- cation markings. In addition, items with an asterisk(*) should be marked "Source Selection Sensitive." Source selection records include, but are not limited to the follow- ing documents: .
(1) Program Management Directive, when it con- tains directives pertinent to source selection.
(2) Business Strategy Panel presentations (view- graphs and text) and minutes.
*(3) Source list screening, including justifican'ons(s) for not issuing a solicitation to specific sources.
*(4) Results of screening, including justification(s) for not issuing a solicitation to specific sources.
*(5) The Source Selection Plan.
(6) SSA delegation request or SSAC Chairperson nomination request (as applicable).
(7) The Source Selection Plan approval document.
NOTE: Any directed changes to the SSP would require the approval document to be marked "Source Selection Sensitive."
*(8) Documentation for use of four-step source selec- tion actions (if applicable).
*(9) Evaluation criteria (except portions revealed in solicitation).
*(10) Weights and standards.
* (11) Narrative assessments.
*(12) All orders or other documentation establishing SSAC and SSEB members, and amendments thereto.
(14) Record of attendance and a summary of proceed- ings of any preproposal conference.
(15) Request for Proposal.
*(16) All proposals and amendments or alternative proposals submitted by each offeror, including a summaiy of any oral presentation made directly to the SSEB.
*(17) Evaluation iepoit;; including Indzrvir-' '■ '"A Analysis (ICA) used in the evaluation and any Most Probable Cost (MPC) data.
*(18) Inquiries sent to offerers by the SSEB during the evaluation, and responses thereto.
*(19) Deficiency reports, clarification requests, and offerers' responses.
*(20) The SSET Evaluation Report (and SSEB and SSAC reports if alternative organization used).
*(21) All source selection presentations (vicwgraplis and text).
(22) SSA Decision Document.
(23) Memoranda of instructions directing award received from SSA.
(24) Lessons learned report.
*(25) Records of attendance at source selection decision briefings.
(26) Schedules of source selection meetings.
(27) Any odier data or documents having a direct relationship to the source selection action. (Data may require marking as source selection sensitive.)
(13) Messages and other notices notifying SSAC and other source selection personnel of meetings.
128
AFR 70-30/AFFARS Appendix BB Attachment 11 27 April 1988
27
' -sgasHsak "«BSEsaas^.
THIS IS A COVER SHEET DO NOT DEFACE
ONLY INDIVIDUALS HAVING AUTHORIZATION TO
SOURCE SELECTION SENSITIVE MATERIAL MAY READ
THE ATTACHED INFORMATION.
RETURN TO
U.S. GOVERNMENT INFORMATION ATTACHED-SAFEGUARD AT ALL TIMES
SOURCE SELECT SENSITIV
129

28 AFR 70-30/AFFARS Appendix BB Attachment 12 27 AprU 1988
SSAC-SSEB ALTERNATIVE ORGANIZATION EVENTS
1. Business Strategy Panel
2. Sources Sought Synopsis
3. Acquisition Plan
4. Source Selection Authority Named
5. Source Selection Advisory Council Chairperson Named
6. SSAC formally established and convened to:
- Designate the chairperson and approve membership of the SSEB
- Review and approve contractor source lists
- Approve standards
-- Establish evaluation criteria weights, if desirable
- Review Source Selection Plan
7. Source Selection Plan approved by SSA
8. Synopsis in Commerce Business Daily
9. Solicitation preparation and reviews
10. SSA Authorization of solicitation release
11. Solicitation Released
12. Proposals received - evaluation starts
13. SSEB Evaluation:
a. Request Audit Support
b. Request Past Performance Information
c. Evaluate Proposals
d. Prepare Deficiency Notices and Clarification Requests
e. Prepare Initial Evaluation Report
14. Contracting Officer Competitive Range Determination
15. SSAC reviews initial evaluation results and contract- ing officer's competitive range determination:
-- Summary meeting with SSA normally occurs .
-- SSA must approve the elimination of any offeror from competitive range
16. Release of Deficiency Reports and start of discussions
17. Discussions completed
18. Receipt and Evaluation of Best and Final Offer (BAFO)
19. SSEB Evaluation Report and Briefings to SSAC
20. SSAC Analysis Report Completed
21. SSAC Analysis and Briefing given to SSA
22. Review and Execution of Contracts) is made by the Contracting Officer
23. SSA Decision
24. SSA Decision Document Completed
25. SSA Announces Award (includes the following simultaneous actions)
-- Manual approval and contract distribution
- Congressional notification
- Press release is made
- Notification to unsuccessful offerers
26. Contract Award
27. Debriefings to offerers if requested
28. Post Award Conference
130
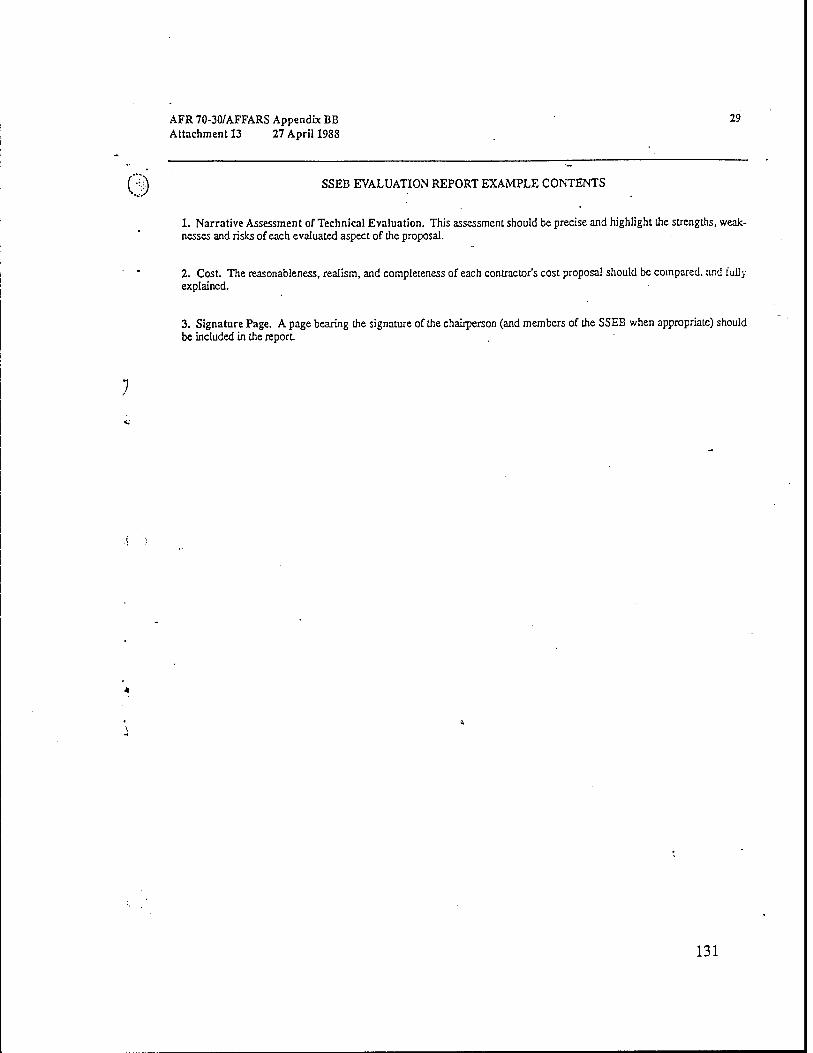
©
AFR 70-30/AFFARS Appendix BB 29 Attachment 13 27 April 1988
SSEB EVALUATION REPORT EXAMPLE CONTENTS
1. Narrative Assessment of Technical Evaluation. This assessment should be precise and highlight the strengths, weak- nesses and risks of each evaluated aspect of the proposal.
2. Cost. The reasonableness, realism, and completeness of each contractor's cost proposal should be compared, and fully explained.
3. Signature Page. A page bearing the signature of the chairperson (and members of the SSEB when appropriate) should be included in the report.
131
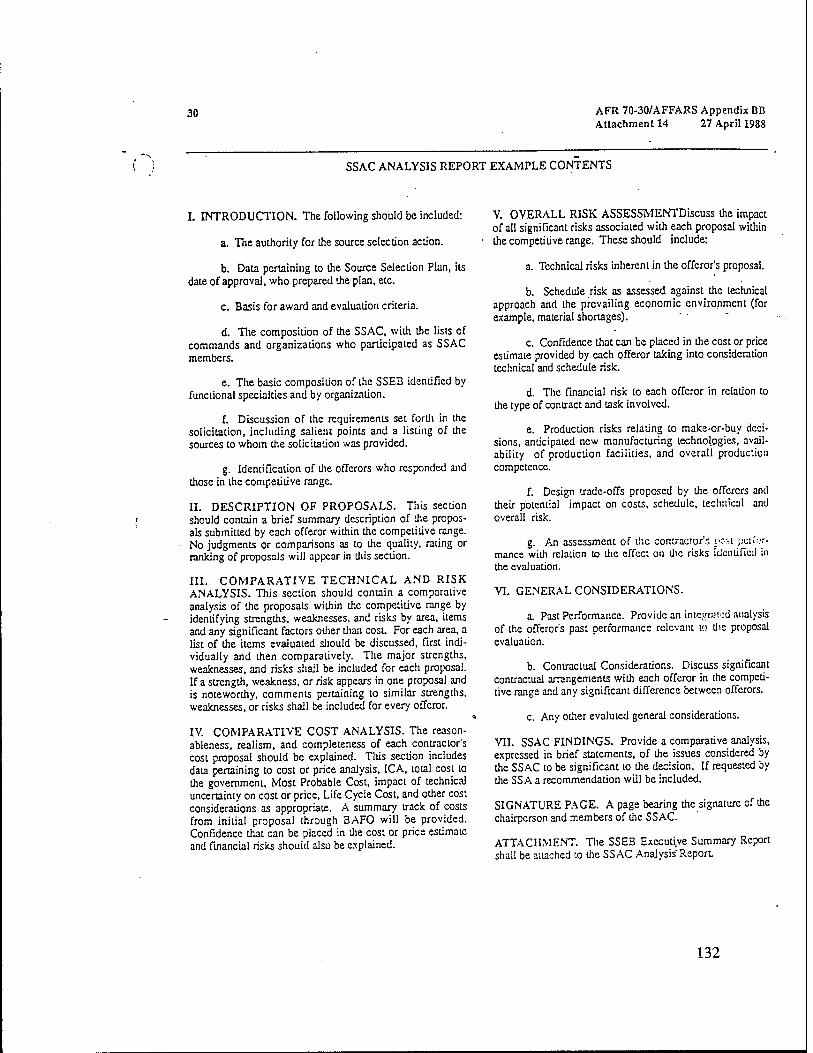
30 AFR 70-30/AFFARS Appendix BB Attachment 14 27 April 1988
SSAC ANALYSIS REPORT EXAMPLE CONTENTS
I. INTRODUCTION. The following should be included:
a. The auihority for the source selection action.
b. Data pertaining to the Source Selection Plan, its date of approval, who prepared the plan, etc.
c. Basis for award and evaluation criteria.
d. The composition of the SSAC, with die lists of commands and organizations who participated as SSAC members.
e. The basic composition of the SSEB identified by functional specialties and by organization.
f. Discussion of the requirements set fordi in the solicitation, including salient points and a listing of the sources to whom the solicitation was provided.
g. Identification of the offerers who responded and those in the compedtive range.
II. DESCRIPTION OF PROPOSALS. This section should contain a brief summary description of die propos- als submitted by each offeror within the competitive range. No judgments or comparisons as to the quality, rating or ranking of proposals will appear in Ulis section.
III. COMPARATIVE TECHNICAL AND RISK ANALYSIS. This section should contain a comparative analysis of the proposals within the competitive range by identifying strengths, weaknesses, and risks by area, items and any significant factors other dian cost. For each area, a list of the items evaluated should be discussed, first indi- vidually and then comparatively. The major strengths, weaknesses, and risks shall be included for each proposal. If a strength, weakness, or risk appears in one proposal and is noteworthy, comments pertaining to similar strengths, weaknesses, or risks shall be included for every offeror.
IV. COMPARATIVE COST ANALYSIS. The reason- ableness, realism, and completeness of each contractor's cost proposal should be explained. This section includes data pertaining to cost or price analysis, ICA, total cost to the government, Most Probable Cost, impact of technical uncertainty on cost or price, Life Cycle Cost, and other cost considerations as appropriate. A summary track of costs from initial proposal through BAFO will be provided. Confidence that can be placed in die cost or price estimate and financial risks should also be explained.
V. OVERALL RISK ASSESSMENTDiscuss the impact of all significant risks associated with each proposal within the competitive range. These should include:
a. Technical risks inherent in the offerer's proposal.
b. Schedule risk as assessed against the technical approach and the prevailing economic environment (for example, material shortages).
c. Confidence that can be placed in the cost or price estimate provided by each offeror taking into consideradon technical and schedule risk.
d. The financial risk to each offeror in rcladon to the type of contract and task involved.
e. Production risks relating to make-or-buy deci- sions, andcipated new manufacturing technologies, avail- ability of production facilities, and overall production competence.
f. Design trade-offs proposed by the offerers and their potential impact on costs, schedule, technical and overall risk.
g. An assessment of the contractor's i'?r,t perfor- mance wiih relation to die effect on die risks identified in the evaluation.
VI. GENERAL CONSIDERATIONS.
a. Past Performance. Provide an imegrsied analysis of the offeror's past performance relevant to the proposal evaluation.
b. Contractual Considerations. Discuss significant contractual arrangements with each offeror in the comped- tive range and any significant difference between offerers.
c. Any odier evaluted general considerations.
VII. SSAC FINDINGS. Provide a comparative analysis, expressed in brief statements, of the issues considered by the SSAC to be significant to the decision. If requested by the SSA a recommendation will be included.
SIGNATURE PAGE. A page bearing the signature of the chairperson and members of the SSAC.
ATTACHMENT. The SSEB Executive Summary Report shall be attached to the SSAC Analysis Report.
132
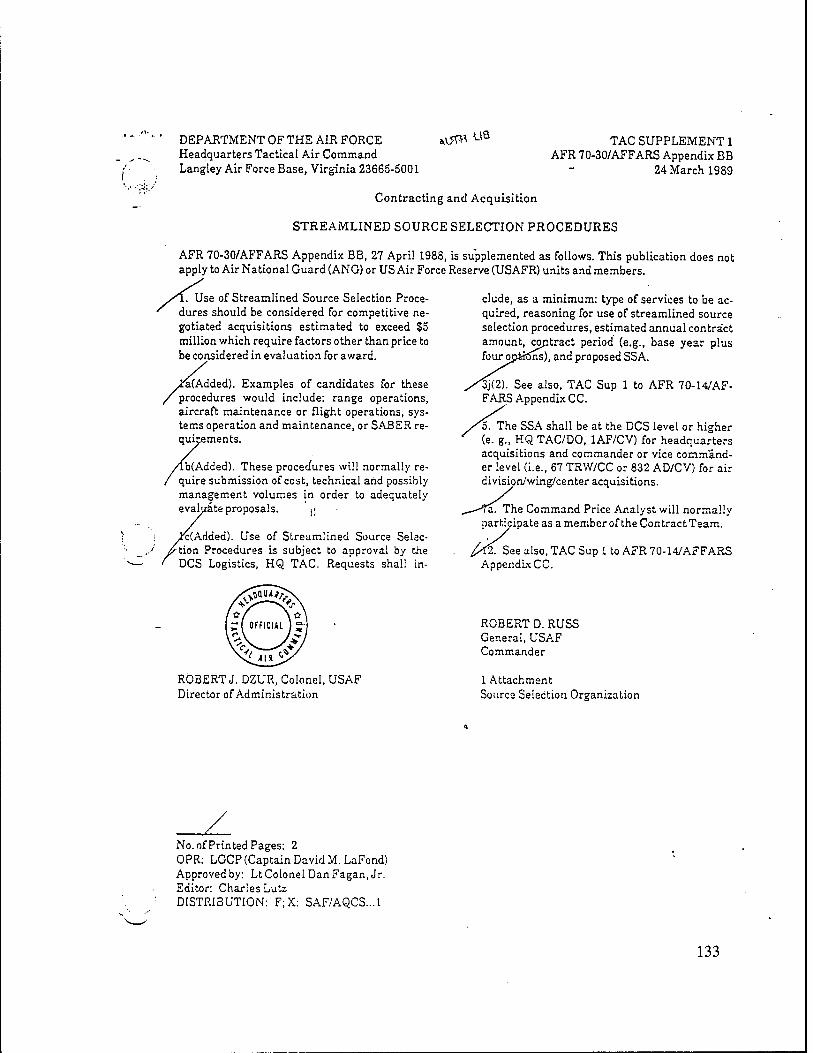
DEPARTMENT OF THE AIR FORCE Headquarters Tactical Air Command Langley Air Force Base, Virginia 23665-5001
MM UQ TAC SUPPLEMENT 1
AFR 70-30/AFFARS Appendix BB 24 March 1989
Contracting and Acquisition
STREAMLINED SOURCE SELECTION PROCEDURES
AFR 70-30/AFFARS Appendix BB, 27 April 1988, is supplemented as follows. This publication does not apply to Air National Guard (ANG) or US Air Force Reserve (USAFR) units and members.
1. Use of Streamlined Source Selection Proce- dures should be considered for competitive ne- gotiated acquisitions estimated to exceed $5 million which require factors other than price to be considered in evaluation for award.
Fa(Added). Examples of candidates for these procedures would include: range operations, aircraft maintenance or flight operations, sys- tems operation and maintenance, or SABER re- quirements.
Lb(Added). These procedures will normally re- quire submission of cost, technical and possibly management volumes in order to adequately evaluate proposals. f;
ft(Added). Use of Streamlined Source Selec- tion Procedures is subject to approval by the
DCS Logistics, HQ TAC. Requests shall in-
clude, as a minimum: type of services to be ac- quired, reasoning for use of streamlined source selection procedures, estimated annual contract amount, contract period (e.g., base year plus four oDÜtfns), and proposed SSA.
^j'(2). See also, TAC Sup 1 to AFR 70-14/AF- FARS Appendix CC.
' o. The SSA shall be at the DCS level or higher (e. g., HQ TAC/DO, 1AF/CV) for headquarters acquisitions and commander or vice command- er level (i.e., 67 TRW/CC or 832 AD/CV) for air division/wing/center acquisitions.
fa. The Command Price Analyst will normally participate as a member of the Contract Team.
'/U.. See also, TAC Sup 1 to AFR 70-14/AFFARS Appendix CC.
•A OFFICIAL 1:
II«
ROBERT J. DZUR, Colonel, USAF Director of Administration
ROBERT D. RUSS General, USAF Commander
1 Attachment Source Selection Organization
No. of Printed Pages: 2 OPR: LGCP (Captain David M.LaFond) Approved by: Lt Colonel Dan Fagan, Jr. Editor: Charles Lutz DISTRIBUTION: F;X: SAF/AQCS...1
133
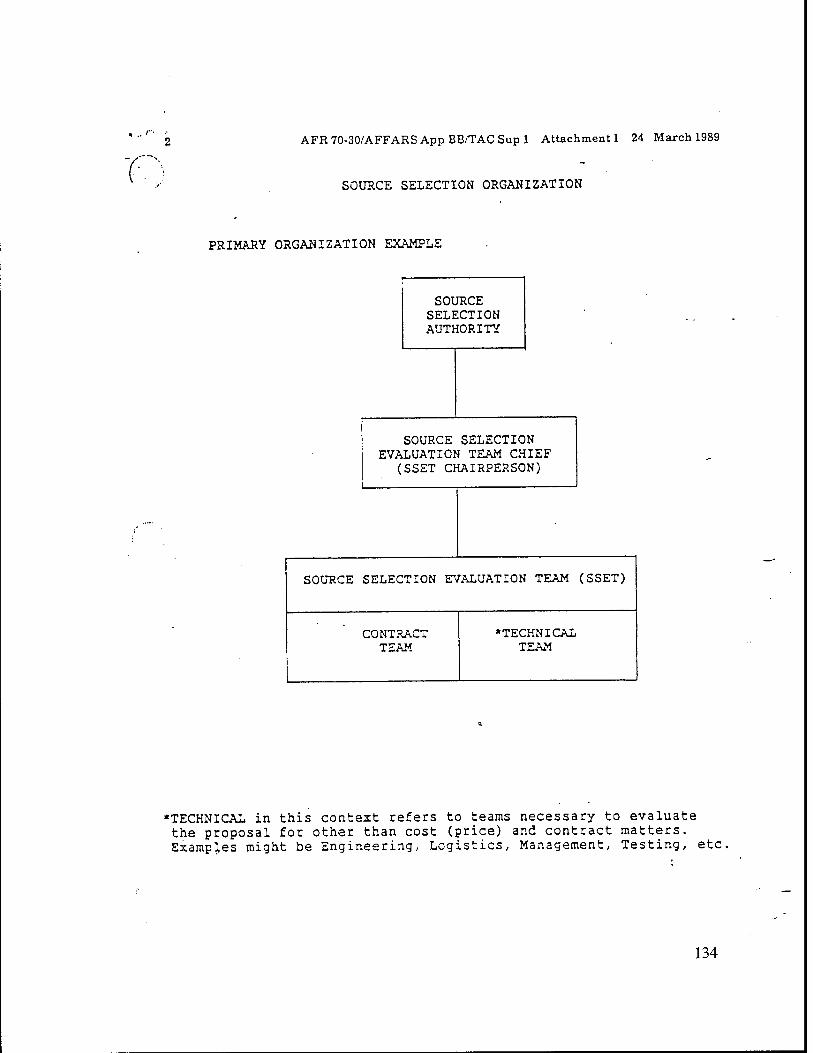
n AFR 70-30/AFFARS App BB/TAC Sup 1 Attachment 1 24 March 1989
SOURCE SELECTION ORGANIZATION
PRIMARY ORGANIZATION EXAMPLE
SOURCE SELECTION AUTHORITY
SOURCE SELECTION EVALUATION TEAM CHIEF
(SSET CHAIRPERSON)
SOURCE SELECTION EVALUATION TEAM (SSET)
CONTRACT TEAM
»TECHNICAL TEAM
«TECHNICAL in this context refers to teams necessary to evaluate the proposal for other than cost (price) and contract matters. Examples might be Engineering, Logistics, Management, Testing, etc.
134

APPENDIX B
JOC PERFORMANCE SURVEY

136
Date:
From: Dean T. Kashiwagi, Maj, PhD, PE Performance Based Studies Del E. Webb School of Construction Arizona State University Tempe, AZ 85287-0204
Tel: (602)965-3615 FAX: (602)965-1769
Subject: Evaluation of JOC/DOC/SABER Contractors
To: XXXXXXXXXXX
Pages: 3
Fax: (000) 000-0000 Tel: (111) 111-1111
Thank you for participating in our research effort. Please fill out the accompanying questionaire as best as possible. Estimate where you have to. FAX the questionaire back to us if possible or mail it to the above address. I will call and answer any possible questions. All replies will remain confidential. The source of data will not be disclosed. Only calculated percentages of total results will be used.
The purpose of this study is determine the performance of the contractors. We will be collecting data from 75 to 100 contracts, and 5-10 contractors. We will use the data for educational purposes at ASU. You will receive a copy of the results and will be able to see how your contract performance relates to other contractors.
Once again, thank you for your participation.
DEAN T. KASHIWAGI

137
Questionaire Job Order Contract or Delivery Order Contract
Contractor Performance Respond to the following questions as accurately as possible (estimating when needed) and return questionaire to:
Dean Kashiwagi PE, PhD Del E. Webb School of Construction
Arizona State University Tempe, AZ 85287-0204
All information is confidential! Questions can be answered at: Tel: (602)965-3615
FAX: (602)965-1769
I. Contractor Information:
II.
B. Contract Awarded _/_/_ (YR/MO/DA) C. Duration (years) D. Amount Min $ Max $ Actual to Date $ E. Awarded coefficient F. Renewal option (Y or N) Renewed
Customer or Facility Manager Information: A. Point of Contact:
(Y or N)
B. Customer: C. Position Tel ( ) - D. FAX( ) - E. Address F. City State Zip
III. Success of JOC/DOC A. Is the JOC/DOC more efficient than the previously used "in-house" or
"conventional contracting by individual job" services? (Y/N) more timely? (Y/N) more cost effective? (Y/N)
B. Are you satisfied with your JOC contractor? (Y/N) C. What percentage of call orders on your JOC are you dissatisfied
with? D. Do you have any documentation or proof that the JOC/DOC resulted in
substantial time or money savings? (Y/N) If so, how much? (either in saved $/year or weeks/job)
All Information will remain confidential!
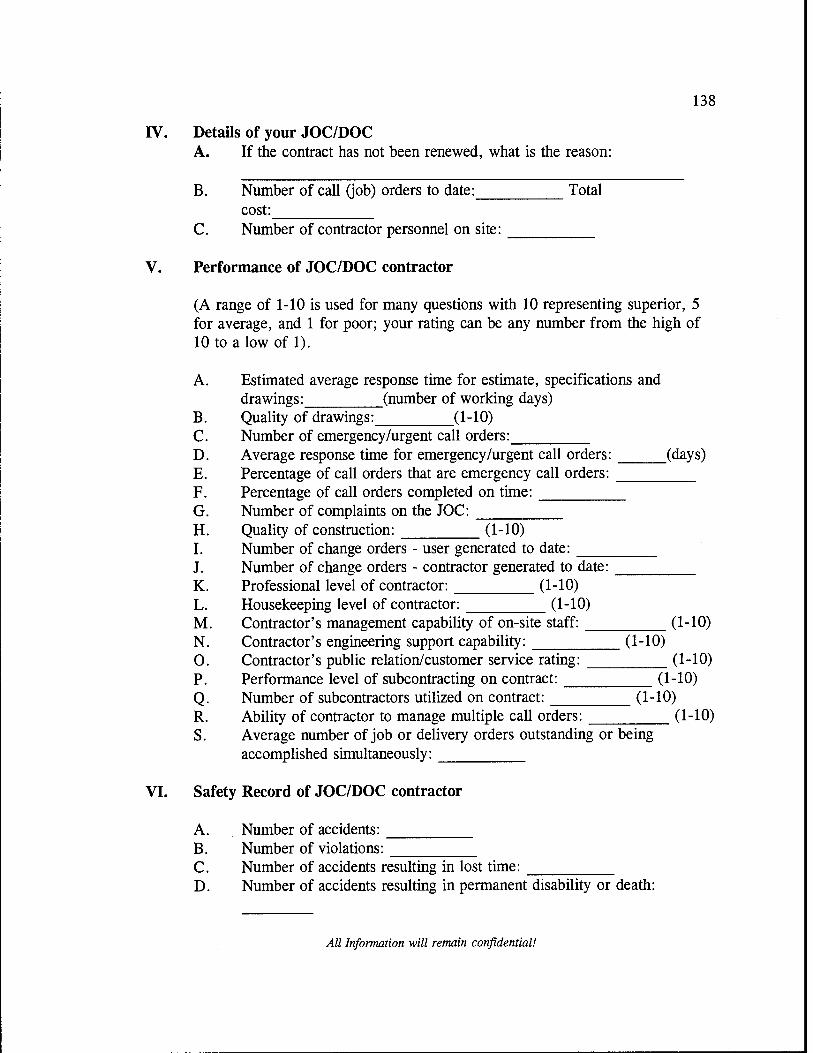
138
IV. Details of your JOC/DOC A. If the contract has not been renewed, what is the reason:
B. Number of call (job) orders to date: Total cost:
C. Number of contractor personnel on site:
V. Performance of JOC/DOC contractor
(A range of 1-10 is used for many questions with 10 representing superior, 5 for average, and 1 for poor; your rating can be any number from the high of 10 to a low of 1).
A. Estimated average response time for estimate, specifications and drawings: (number of working days)
B. Quality of drawings: (1-10) C. Number of emergency/urgent call orders: D. Average response time for emergency /urgent call orders: (days) E. Percentage of call orders that are emergency call orders: F. Percentage of call orders completed on time: G. Number of complaints on the JOC: H. Quality of construction: (1-10) I. Number of change orders - user generated to date: J. Number of change orders - contractor generated to date: K. Professional level of contractor: (1-10) L. Housekeeping level of contractor: (1-10) M. Contractor's management capability of on-site staff: (1-10) N. Contractor's engineering support capability: (1-10) O. Contractor's public relation/customer service rating: (1-10) P. Performance level of subcontracting on contract: (1-10) Q. Number of subcontractors utilized on contract: (1-10) R. Ability of contractor to manage multiple call orders: (1-10) S. Average number of job or delivery orders outstanding or being
accomplished simultaneously:
VI. Safety Record of JOC/DOC contractor
A. Number of accidents: B. Number of violations: C. Number of accidents resulting in lost time: D. Number of accidents resulting in permanent disability or death:
All Information will remain confidential!

APPENDIX C
EXTRAPOLATED PERFORMANCE CRITERIA EQUATIONS

140
Extrapolated Performance Criteria Formulas
Overall Customer Satisfaction:
Percent Renewed * Average Rating of Public Relations/ Customer Service *
Percentage of Customers Satisfied with JOC
Overall Customer Perception of Expertise:
(Perception of Efficiency * Perception of Timeliness * Perception of Cost
Effectiveness) * (100 - Average Percentage of Dissatisfied Work)
Multi-Call Order Customer Satisfaction:
[(50 - Average number of Contractor Personnel on Site) * Average Multi-Call Order
Management Level * Percentage of Customers Satisfied with JOC] / (50 - Average
number of Outstanding Jobs)
Timely Customer Service Rating:
[Perception of Timeliness * (50 - Average Response Time) * Average on Time
Completion * Average Rating of Public Relations/ Customer Service] / 1000
Overall Engineering Proficiency Level:
[Average Quality of Drawings * Average Professional Level * Average of
Engineering Support] / 10
Overall Construction Proficiency Level:
[Average Construction Quality * Average Professional Level * Average Performance
Level of Subcontractors] / 10

APPENDIX D
CONTRACTOR SCORES FOR ALL CRITERIA

142
Performance Criteria C#1 C#2 C#3 C#4 C#5 C#6
Average Award Coefficient Percent Renewed Average Size Call Order $ (000) Average Duration (Yrs) Perception of Efficiency Perception of Timeliness Perception of Cost Effectivness Average % of Dissatisfied Work Average Response Time (Days) Average Quality of Drawings Avg Response time ECO (Days) Avg on time Completion (%) Avg # of Complaints Avg Construction Quality Avg Changes per Job Avg Professional Level Avg Housekeeping Rating Avg On-Site Mgmt Rating Avg Rating of Eng Support Avg Rating of PR/Customer SVC Avg Performance Level of Subs Avg MCO Management Level Avg # Oustanding Jobs Avg # of Safety Problems per Site Avg # of Contr. Pers. On-Site % Customers Satisfied with JOC
Overall Customer Satisfaction Overall Cust. Perception of Expertise MCO Customer Satisfaction Timely Customer Service Rating Overall Eng. Proficiency Level Overall Const. Proficiency Level
1.12 1.10 1.00 1.19 1.08 1.20 1.00 1.00 1.00 0.90 1.00 1.00
57.82 58.00 62.25 58.54 73.19 49.73 3.08 3.00 3.13 4.05 4.03 4.8 0.67 1.00 1.00 1.00 0.92 1.00 0.92 0.75 1.00 0.89 0.92 1.00 0.54 0.50 1.00 0.58 0.33 0.80
20.15 30.25 3.50 13.86 10.27 4.30 15.79 10.00 8.13 12.29 10.80 12.30 6.14 4.33 6.67 5.39 5.88 6.90 5.21 6.00 1.50 5.86 4.22 2.30
52.62 55.00 99.30 74.50 77.18 93.60 5.08 3.63 3.33 16.45 9.70 1.00 5.71 7.00 7.50 7.69 7.33 9.30 0.67 0.30 0.50 0.37 0.26 0.39 5.43 6.75 7.00 7.04 7.67 9.40 5.50 7.00 7.50 6.78 7.36 8.80 5.43 6.50 6.75 6.96 7.67 9.00 5.14 3.00 6.63 5.50 6.55 7.40 5.29 6.50 7.00 6.78 9.00 9.40 5.29 6.25 6.63 6.93 6.75 8.00 5.29 6.00 7.00 6.67 7.42 9.20 9.50 20.00 17.67 19.58 29.55 21.80 5.00 3.25 3.25 5.19 4.58 2.40 4.54 7.00 10.00 8.68 7.45 20.40 0.77 0.50 1.00 0.88 0.91 1.00
4.07 3.25 7.00 5.40 8.18 9.40 26.46 26.16 96.50 44.67 25.13 76.56 4.56 4.30 8.66 7.97 14.02 9.66 8.78 10.73 29.11 16.92 24.96 33.17
17.15 8.78 30.92 20.87 29.48 48.00 16.40 29.53 34.78 37.46 37.95 69.94

APPENDIX E
DISPLACED IDEAL MODEL RESULTS
FOR ALL VERSIONS COMPARING ALL SIX CONTRACTORS

Displaced Ideal Model: Initial Analysis (all weighting = 1)
144
o CO O C «I £
■g CD 0.
U 3
T3 O
TI <U N
•t-t c <a
"o
% o O
1 ID O] 2 CD
3
-o
1 co c CO or 4-» c 0) 2 ID a.
o o o
k_ CD
•a k_
O
'S o
CO N
co (B D) CO
"io > c o
2 Q
CD O) CO k- (D
1
> Ü c CD
'o !£ LU »♦— o c o
CD
2 CD a.
CO CO CD .c "to E i- »♦- o c o s. CD Ü k. CÜ 0.
10 CO CD c .>
'•4J Ü
tu "lo o Ü
o c o S.
CD o k. CD a.
o
TI CD
CO CO to
a »4- o
^s
CD O) 2 CD
3
(0 > CO Q
CD
E i-
CD to c o a to CD a. CD O) CO k_ CD
3
to O) c > (0 k. Q »♦- o
£ CO 3
a CD O) CO k_ CD
1
to >> CO Q
o Ü LU
CD
E '+-'
CD to c o a to CD
cc
I
5 c q CD
a E o ü
CD
E c o
CO
c 'co a E o ü »*- o
D)
3
co 3 a c o s c o Ü O)
J3 o
L_
CD a to CD
c CO .c Ü D)
CD
g _J
75 c o to to
o 1—
0_ D)
3
'■♦-' CO Ü.
c Q CD CO
CD to
O I Dl
3
c CO
on
E
5
CO ■ c O us
t o a a
w Ol c
LU 4- o 0} c 'to 0- □1
ü > co
CD
E
Ü CC a. «♦- o D! C
'IS cc
to
3 w
'S CO
_J
CD Ü c CO
E
CD 0-
CD > CO _l
c CO
E CO U! CO c CO
S
O o s
3
to
o ~3 en c TI c iS CO 3
o *
I
w
CO a to
£ CD
XI 2 a.
2:
■s CO CO
'S
D)
3
w i c O
to L. CD
Q.
C o Ü >4- o
O O ~3 x: -♦-'
> TJ
CO li= to
'15 w to
CD
E o to 3
o
c o S •H to
15 w 0) E % 3 Ü
'S CD > o
CD to t CD a X
LU M- O
c o
'•& co ü k_ CD 0.
+j to 3 Ü
"cö k. CO > O
c .o S 45 to
13 w L_ CO
E 2
CO 3
Ü
O o 5
_c CO
Ü.
CD o
'£: CO
co k- CÜ
E o Io 3 Ü >- CD
E i—
CD > CD _l
>. O c CD
O «= 2 0.
Dl C
LU
"2 CD > o
% ID
_J
>> O c CD
Ü
2 Q.
■*-» to c o Ü
"2 CD > O
o 0)
o o o ci
o o o o o o d
CO
CN r- O O
d
O o o o o o d
o o o o o o d
o o o o o o d
•fl- CN CD CD O O
d
ro ro CM o d
CO CO o CD o o d
o o o o o o d
in ro CO CM o d
00 oo o o o d
o o o o o o d
o o o o o o d
CO CD
CO x— o d
o o o o o o d
O o o o o o d
o o o o o o d
o o o o o o d
o o o o o o d
o o o o o o d
o o o o o o d
ro CN O h- O O
d
CM
o
o d
CO 10 CN 10 CO CN
d
o o o O O o d
o o o o o o d
CN
in
o a
ro o o •fl- T—
o d
o o o o o o d
o o o o o o d
o o o o o o d
CD h- O O O O
d
o o o o o o d
o o o o o o d
CM in •fl- o o d
in CO ■fl- o o o d
in o CN o o o d
ro h- o CM CM O
d
CD a CM CN in CM
d
in CD co CO o o d
CN
ro o o o d
CO ro CO CO en o d
CO •fl- ■fl- CO o o d
00
o CN
O O
d
o o o o o o d
00 00 CO
o o d
CN
CO O O O
d
co ro ro o o o d
CN CN CN CN O O
d
00 in •q- o o o d
CO in CO o o o d
CO c- CD
o o d
o o o o o o d
r- CO CN O O
d
o in CM CO
o d
io f-
o o d
in -fl- ea
o o d
co CD CN CD O
d
o o o o o o d
co ro CO <fl- v- o d
o co CM in CM o d
CO ■>r CN CN o d
to CO
o o o d
CD co o o o o d
ro in I-- o o o d
ro o ■fl-
o o d
o o o o o o d
CO h- CN O o o d
o o CO CO r- o d
co CM f- in 00 CO
d
x- CM o CO o o d
CO
CO
o o d
CD 00 ■^•
m
d
CD CO CO o o d
n n en
«5 CM
x— ro ro o o o d
co o CD
o d
CO ro oo r— o o d
co CN CN
o o d
CM m T—
o o d
•<* ro o o d
o o o CO o o d
CO CO in o o o d
r-- r-~ co CN o o d
1^-
o ro o o d
o o o o o o d
CO in
r- CD o d
io io
o o d
CD CO CN in
o d
CN CM m in ■fl- ea d
CM
ro o d
CN ro oo CM o d
o
co o d
co o CO CN CN o d
o o o o o o d
o o o o o o d
CD CD in o o o d
ro ro CO o o d
o o o o o a d
o o o o o o d
o o o o o o d
o o o o o o d
o o o o o o d
co o CN o o o d
o o o o o o d
o o o o o o d
ro ro h- in co CO
d
in o
o o d
CO ro in 10 CM o d
CN CN ro o o d
ro co r~- o o o d
CO co CD
o o d
CD
O CN O O
d
in
CN O O
d
CM
o o o d
■fl- ea o CN O O
d
5 o
o d
CM m "*■
h- o o d
■5f o o
co o d
o o o o o o d
CM 10
ro o o d
o o o o o o d
o CM
O
d
m CM
o o d
CM o CO CO CN o d
CD oo CO
CN o d
0) o o o o d
o o o o o o d
r-- co
o o o d
CO
co CO o o d
o o o o o o d
m T— CD O o o d
o CD in CD
o d
co CM
CD CD ro d
ro o 1"- CM o o d
-fl- co CN CM o o d
ro •■fl- CD CN CO
d
O) co CO o o d
•fl- CM o ■fl- CO •fl- d
5- o o d
CO CM co CO o o d
CO CN
CM o o d
CO ro o
o o d
h- C0
o o d
CO
o d
co CO o o d
CN CN ro o o o d
CN o o CO o o d
CO CD CD CO o o d
CN m
o o d
ro o io CD CO o d
CN CO -fl- ea o o d
m ■t CO CM O
d
oo
5 o d
ro ^— CO o d
CD CO CO ro CO o d
o
LO CO IO o d
CO
co oo CN O
d
IT)
T- o o o d
o o o o o o d
CD ro o o o d
ro CN CN CO o o d
CM
o o d
ro CO
o o o d
CD CO CM in t^ o d
CO CD
o CN CD
d
ro CD o
o d
■fl-
CD o o o d
o in CM ■fl- CO
d
CO CD CM r». o o d
CO
in CD
d
o o CM CM O O
d
o CO
o d
CO
CO o o d
o o CN O O
d
CN r- CD CN o o d
o co in o o d
CD o
o o d
ro CN
x— o o d
CO
CD CO o o d
CN ro 5 o d
CO
o o o d
o o o o o o d
CO co ro CN o o d
o
co o CM O
d
CO
m
CD o d
CO o CO o d
I-- CM
o d
co o CN ■fl- o d
CD CD in r- co o d
o CO i= .* c c o co
MÜLL
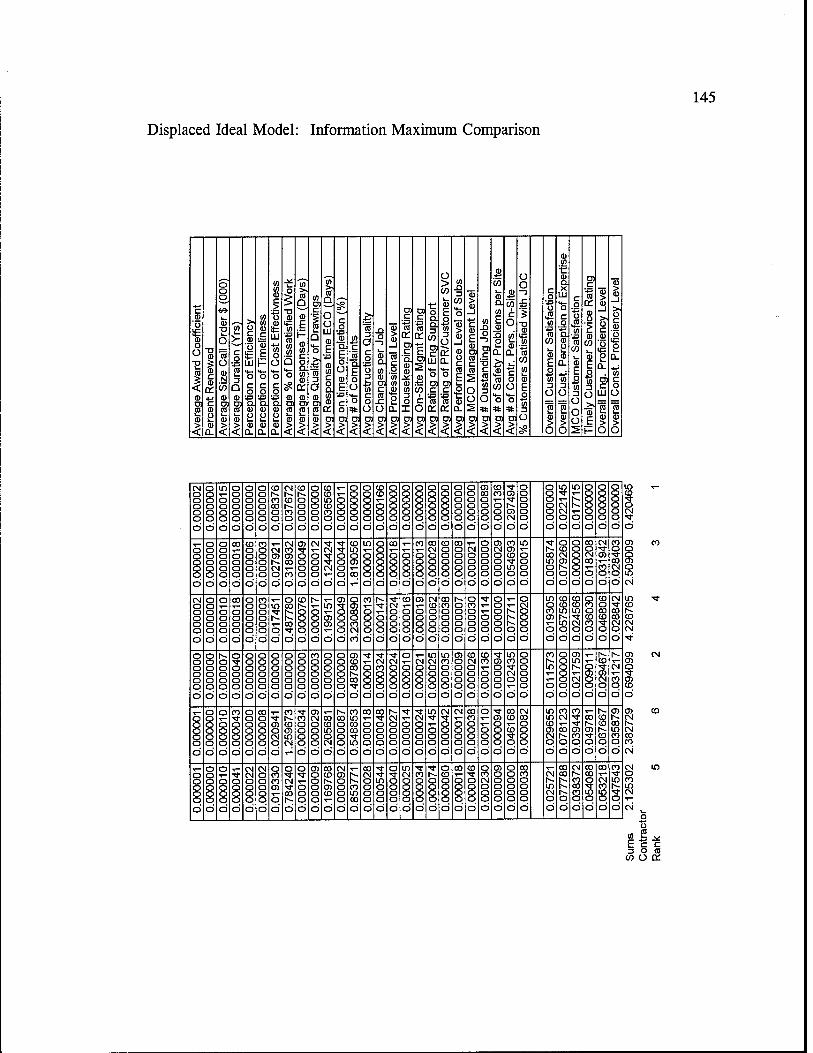
145
Displaced Ideal Model: Information Maximum Comparison
Q <D . ai a.
ü
>. w u ID c r (1)
it E LU H- *^- O o r r o ü
9- c.
in
CM O O O O O
Ö
o o o o o o d
w o o a o d
o o o o o o d
o o o o o o d
o o o o o o d
CD f- co co o o d
CM f- CO r~- co o d
(0 r~- o o o o d
o o o o o o d
CO CO m CD CO o d
o o o o d
o o o o o o d
o o o o o o d
CD CD
O O O
d
o o o o o o d
o o o o o o d
o o o o o o d
o o o o o o d
o o o o o o d
o o o o o o d
o o o o o o d
en co o o o o d
CO CO
o o o d
cn
cn CM
d
o o o o o o d
o o o o o o d
in
CN CN O
d
in
h-
o d
o o o o o o d
o o o o o o d
o o o o o o d
O O O o o ci
o o o o o o d
o o o o o o d
co T— o o o o d
to o o o o o d
CO o o o o o d
CM 03 r~- CM o d
CM CO en CO
CO
d
en ■<r o o o o d
CM
o o o o d
CM
CM
d
■■a-
o o o o d
CD in o en cö r-
in o o o o d
o o o o o o d
co o o o o d
V—
o o o o d
CO
o o o o d
CO CN o o o o d
CD o o o o o d
co o o o o o d
CM o o o o d
o o o o o o d
en CM o o o o d
CO en CD
m o d
in o o o o d
h- co in o o d
o CO CM 0) N- O d
o o o o o o d
co o CM co o d
CM "T 03 T— CO o d
CO o CO CN o d
CM O O O O o d
o o o o o o d
o o o o o d
CO
o o o o d
o o o o o o d
CO o o o o o d
■c-
in
o d
o CO
co ■«*■
d
CD I-- o o o o d
o o o o d
r— ID x— C3 en
d
en o o o o d
o en co o co CM
CO
CO
o o o o d
o o o d
CM O O o o d
CD
o o o o d
en o o o o d
CM CD o o o o d
CO CO o o o o d
r-- o o o o o d
o CO o o o o d
-a-
o o o d
o o o o o o d
r-- o d
o CM o o o o d
in o CO en r- o d
CO CO m h- in o d
CD CD in ■■a- CN o d
o CO o CD CO o d
CD o co CD
O
d
CM
co co CM o d
o o o o o o d
o o o o o o d
o o o o o d
o "3- o o o o d
o o o o o o d
o o o o o o d
o o o o o o d
o o o o o o d
o o o o o o d
CO o o o o o d
o o o o o o d
o o o o o o d
en CD co r-- co
d
o o o o d
CM CO O O O
d
CM o o o o d
o T— o o o o d
CM O o o o d
CM o o o o d
w CO o o o o d
en o o o o o d
CD CM o o o o d
CO CO
o o o d
CD o o o o d
in CO
CN o d
o o o o o o d
CO
m
o d
o o o o o o d
en m
CM o d
o en o o d
co 03 CN O d
CM
CO o d
o o o o o d
o o o o o o d
o o o o o d
CO
o o o o d
o o o o o o d
CO o o o o o d
5 CD o CM O
d
CO h- CD en in CM
co o o o o d
en CM o o o o d
v- co <D m o CM
d
r-- co o o o o d
CO in co CO
in d
CO
o o o o d
co ■q- o o o o d
CM o o o o d
o o o o d
CM O O O O
d
in
o o o d
CN
o o o o d
CM
o o o o d
co CO o o o o d
o
o o o d
en o o o o d
CO CD
5 o d
CN CO o o o o d
in m CO en CN o d
CO CM
CO I*- o d
CO ■<r
en CO o d
CO r~- en "3- o d
CD CD
CD o d
en CO in CO o d
T- o o o o o d
o o o o o o d
o o o o o d
5 o o o o d
CM CM O O O o d
CM o o o o o d
o CO CO en o d
o CM
co
d
o •<r o o o d
en o o o o o d
co CO
cn CD
d
CM en o o o o d
r-
co ID CO
d
CO CM O O O O
d
w o o o d
o O O O O d
m CM o o o o d
■<!■ CO o o o o d
-a- h- o o o o d
o CD o o o o d
CO
o o o o d
CD
o o o o d
o CO CM o o o d
en o o o o o d
o o o o o o d
co CO o o o o d
CM h- in CM o d
CO co
O d
CM r-- CO CO CO o d
co CO o m o d
CO
CM CO m o d
CO
in
o d
in T- ;o •q- n IN •* O
m CO r> n rn n in CM
m ■*
to N- to rN CM ■*
m CM m n "3" m CD O
m CO IN r~- rN oo C) CM
CN in n to in CM T~
CN o
(0 F
2 C.
~i o ra (0ÜK
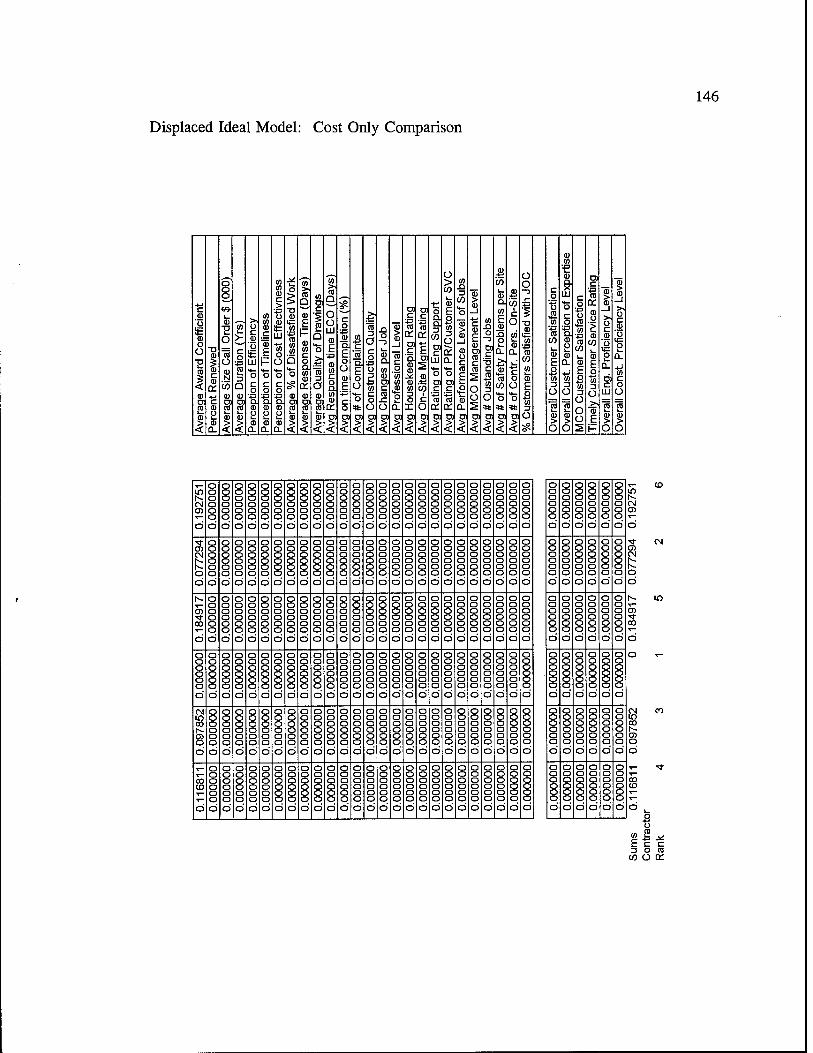
146
Displaced Ideal Model: Cost Only Comparison
w 3 Q
C Ql-S
Ü o (A
0}0)D)aiD5Cn0101D3ö)ö)P501CTOlO
QJ.2
(A
O Ü
IE S3 05
Ö
o o o o o o d
o o o o o a d
o o o o o o d
o o o o o o d
o o o o o o d
o o o o o o a
o o o o o o d
o o o o o o d
o o o o o o d
o o o o o o d
o o o o o o d
o o o o o o d
o o o o o o d
o o o o o o d
o o o o o o d
o o o o o o d
o o o o o o d
o o o o o o d
o o o o o o d
o o o o o o d
o o o o o o d
o o o o o o d
o o o o o o d
o o o o o o d
o o o o o o d
0) CN
O d
o o o o o o d
o o o o o o d
o o o o o o d
o o o o o o d
o o o o o o d
o o o o o o d
o o o o o o d
o o o o o o d
o o o o o o d
o o o o o o d
o o o o o o d
o o o o o o d
o o o o o o d
o o o o o o d
o o o o o o d
o o o o o o d
o o a o o o d
o o o o o o d
o o o o o o d
o o o o o o d
o o o o o o d
o o o o o o d
o o o o o o d
o o o o o o d
o o o o o o d
5 00
d
o o o o o o d
o o o o o o d
o o o o o o d
o o o o o o d
o o o o o o d
o o o o o o d
o o o o o o d
o o o o o o d
o o o o o o d
o o o o o o d
o a o o o o d
o o o a o o d
o o o o o o d
o o o o o o d
o o o o o o d
o o o o o o d
o o o o o o d
o o o o o o d
o o o o o o d
o o o o o o d
o o o o o o d
o o o o o o d
o o o o o o d
o o o o o o d
o o o o o o d
o o o o o o d
o o o o o o d
o o o o o o d
o o o o o o d
o o o o o o d
o o o o o o d
o o o o o o d
o o o o o o d
o o o o o o d
o o o o o o d
o o o o o o d
o o o o o o d
o o o o o o d
o o o o o o d
o o o o o o d
o o o o o o d
o o o o o o d
o o o o o o d
o o o o o o d
o o o o o o d
o o o o o o d
o o o o o o d
o o o o o o d
o o o o o o d
o o o o o o d
o o o o o o d
ID CO r^ o d
o o o o o o d
o o o o o o d
o o o o o o d
o o o o o o d
o o o o o o d
o o o o o o d
o o o o o o d
o o o o o o d
o o o o o o d
o o o o o o d
o o o o o o d
o o o o o o d
o o o o o o d
o o o o o o d
o o o o o o d
o o o o o o d
o o o o o o d
o o o o o o d
o o o o o o d
o o o o o o d
o o o o o o d
o o o o o o d
o o o o o o d
o o o o o o d
o o o o o o d
ro CO
d
o o o o o o d
o o o o o o d
o o o o o o d
o o o o o o d
o o o o o o d
o o o o o o d
o o o o o o d
o o o o o o d
o o o o o o d
o o o o o o d
o o o o o o d
o o o o o o d
o o o o o o d
o o o o o o d
o o o o o o d
o o o o o o d
o o o o o o d
o o o o o o d
o o o o o o d
o o o o o o d
o o o o o o d
a o o o o o d
o o o o o o d
o o o o o o d
o o o o o o d
o o o o o o o o o o o o o o o o o o o o o o o o o o o o o o o o o o o o d d d d d d
ÖÖÖÖÖÖ o o o o o o o o o o o o o o o o o o o o o o o o o o o o o o d d d d d d
ÖÖÖÖÖÖ o a a o o o o o o o o o o o o o o o o o o o o o o o o o o o d d d d d d ÖÖÖÖÖÖ o o o o o o o o o o o o o o o o o o o o o o o o o o o o o o d d d d d d OÖÖÖÖÖ o o o o o o o o o o o o o o o o o o o o o o o o o o o o o o d d d d d d
ÖÖÖÖÖÖ o o o o o o o o o o o o o o o o o o o o o o o o o o o o o o d d d d d d
en to T- T—
o o
■4-' O
F r r -i o ra w O a:

APPENDIX F
DISPLACED IDEAL MODEL RESULTS
FOR ALL VERSIONS COMPARING LARGE AND SMALL CONTRACTORS

148
Displaced Ideal Model: Initial Analysis (all weighting = 1)
o 0) Ü c ro E
ID Q.
73
I <D C <D
0) 3^ c D) D! Q.
O c o
. *= (D aj Qj en
u
c
3
O) O) D) D) CJ) D)
El C
c - en
O Dl CO P3 Ui U)
o
aoU ^
in cd c
CO
E w
D) in
,_ n n m on D (N n o o r>- m Is- -r- m on 01 CM in Is- on o CM ,_ in t^ o CM o CO in on K w CM r- n o h- h- o in o n o fN co on n Is- -* •* 0» in co h- o CO to CO CM U) cu o T CO ou CO (0 n o rn h- n ■*r n o n (0 o m Is- n ■3- T— (N 00 T— o 0) ■<r ■* CM O) "3- u U) U) Is- m CM o n CO m o TT o n o CO -3- ai -r n e> IN v" -=r •<t o T- CM •t— CO ■* CO o T— r- CJ CM n o n o o n n o o o n n (N o o n n o n o n o o o (N CJ o T- o T"~ <_> X— in o o o o o o o o o o o o o o o o u o o o o o o o o o o o o u o o *~ O o o o o o o o o o o o o o o o o o o o o o o o o o o o o o o o o
Is- CO o ro ro o n m o <o r- in o n n o o o o n o n o (N o o o o o o CM o o o ^- o n o o ro o m TT in o n ei o f i (> t) t) o o o O o o o o o o ■* CJ o o co o TT o o o "tf K o n o o o O n o n n o •* o o o o o o T o o o co o ro in o n o o fN CO CM f) C) o o r> n o n () (> o T~ O CJ o o o <_> CJ o CJ <_> CO o o o o n n o o o o o o o n o o n o n o o O o o o C_) <_) CJ u o (_> CM o O o o o o o o o o o ü o o o o ü ü o o o o o o o o CJ <_> CJ (_) o u o o o o o o o o o o o o o o o o o o o o o o o o o o o o o o o o o o
it* Z2 o ra woo:

149
Displaced Ideal Model: Information Maximum Comparison
o m o c
Q.
> in
t-
Ü2
'ro a
ra u>
Ü > w
S E a o
a)
W
co ._ Q 03
D) CD Ü
LU
O a ""to _ w (D 0-
en o o in ■q- n ■* n o r> en T_ ,_ (0 fN CO r— (N CO h- on o CO o on v- CO CN o in Ti- T- CO W CN r*. o n m <0 o CN o n o <o CO m (<) (N on T (0 C) f> T— o in h- ou U) f) o u 1<J ll) u ^" o o o o (0 o n n on (0 r- n n n o n r- T— o o C3 K o u t\l l_) Is- l<) T- CO
£££ o o o o n o fN o o o on o O) O o n o o n o n o o o o C3 T ou o IM -a- Ü) T^
o o n n n o o o n o n t-- o f) o o o o n r> o o o CO C3 T- o o C) u a) 03 fc o o o o o o O o o o o o o o ü o o o o o o o o o o o o o o o o o CN
< o o o o o o O o o o O o o o o o o o o o o o o o o o o o o o o o o
CN CD. o m ro o o •5T O r~- en on o o o o o o n o n o n o o o o o o o ■3- o o o T~
o (T) in o n O O in ro r- o n o o n o n o c i o n -3- o C3 o o o o UJ <_) u u Is- o o o o o O in o n o o c> () n o n o n f 5 c > o o C3 o O o u IN o o o CN o n n o n r> o T o n n n o n C) o o n n o c > o o o C3 o o o T- o o o CD o o o o n n o m o o n n n n c > t) c> o n o o o o o o O o u o o o o to
□) o o o o o o o o o o o o o ü o o o o o o o o o o o o o o o o u o o m <
o o o o o o o o o o o o o o o o o o o o o o o o o o o o o o o o a
E c c u o ra COüC

150
Displaced Ideal Model: Cost Only Comparison
o U c
Q. >
O
E co
ö) in
CD CO co in co o Ö
o o o o o o d
o o o o o o d
o o o o o o d
o o o o o o d
o o o o o o d
o o o o o o d
o o o o o o d
o o o o o o d
o o o o o o d
o o o o o o d
o o o o o o d
o o o o o o d
o o o o o o d
o o o o o o d
o o o o o o d
o o o o o o d
o o o o o o d
o o o o o o d
o o o o o o d
o o o o o o d
o o o o o o d
o o o o o o d
o o o o o o d
o o o o o o d
o o o o o o d
o o o o o o d
o o o o o o d
o o o o o o d
o o o o o o d
o o o o o o d
o o o o o o d
o o o o o o d
o o o o o o d
o o o o o o d
o o o o o o d
o o o o o o d
o o o o o o d
o o o o o o d
o o o o o o d
o o o o o o d
o o o o o o d
o o o o o o d
o o o o o o d
o o o o o o d
o o o o o o d
o o o o o o d
o o o o o o d
o o o o o o d
o o o o o o d
o o o o o o d
o o o o o o d
o o o o o o d
o o o o o o d
o o o o o o d
o o o o o o d
o o o o o o d
o o o o o o d
o o o o o o d
o o o o o o d
o o o o o o d
o o o o o o d
o o o o o o d
o o o o o o d
CO C/3 CN CO CO in co o
o m o o o o o
E c c 3 O CO woo:

APPENDIX G
POTENTIAL JOC PERFORMANCE SURVEY

152
Questionnaire for General Contractors as
Job Order, Delivery Order or SABER Contracts
Dear Patron,
You have been referenced by a construction contractor as a previous or current client. In an attempt to award a maintenance contract for a government agency to the best performing, best price contractor (and reduce costly repair work from low-bid construction), we are surveying past and present clients to evaluate contractor performance. Please keep in mind that all information will remain completely confidential - only calculated percentages will be used and that your contractor is fully aware of this survey. This information will be used to better spend your tax dollars.
Thank you for your time and cooperation.
Please respond to the following questions as accurately as possible (estimate where needed) and return this questionnaire to:
Dean T. Kashiwagi PE, PhD Crinley Scott Hoover, Capt, USAF, Del E. Webb School of Construction
Arizona State University Tempe, Az 85287-0204
Tel: (602) 965-4273 Fax: (602 965-1769
Please call with any questions you may have at the above phone numbers.
I. Customer Information:
A. Name
B. Address
C. City
D. Tel( )
State Zip
E. Fax ( ) (if available)
All information will remain confidential!

153
II. Contractor Information:
A. Name
B. Month , Year , Duration of project
III. Project Information:
A. How many projects and what was the estimated value of each project this contractor completed for you?
Example: _3_ (1) Less than $25,000
(1) Less than $25,000
(2) Between $25,000 & $50,000
(3) Between $50,000 & $75,000
(4) Between $75,000 & $100,000
(5) Between $100,000 & $500,000
(6) More than $500,000
B. What type(s) of construction has this contractor and/or his/her subcontractors done for you? Circle applicable answers.
(1) Residential (2) Commercial (3) Industrial
(4) Other (please specify)
C. What kinds (trades) of work has this contractor and/or his/her subcontractors done for you? Check applicable answers.
Rough site work
Landscaping
Underground work
Masonry
Tile work
Framing Carpentry
Finish Carpentry
Electrical
Plumbing
Mechanical (heating, air conditioning,etc)
Interior finishing
Carpeting
Exterior Painting
Exterior Siding
Windows & Doors
Roof, shingled
Roof, metal
Roof, other
Other (please specify)
All Information will remain confidential!
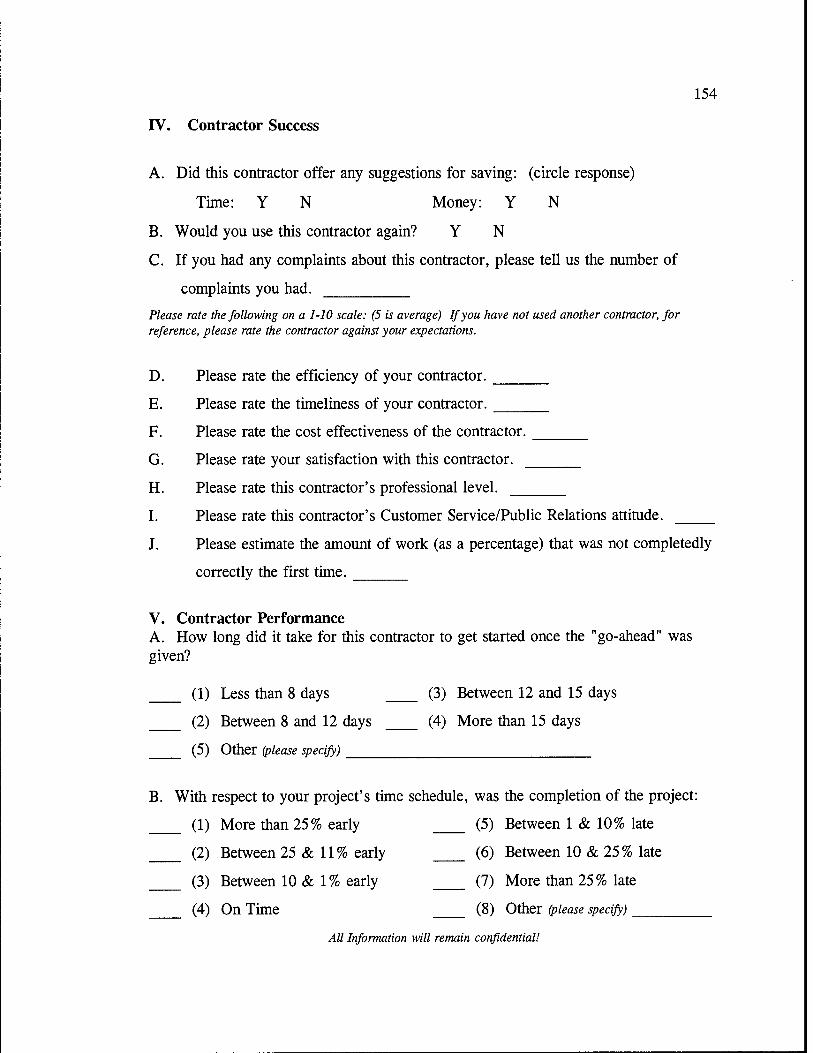
154
IV. Contractor Success
A. Did this contractor offer any suggestions for saving: (circle response)
Time: Y N Money: Y N
B. Would you use this contractor again? Y N
C. If you had any complaints about this contractor, please tell us the number of
complaints you had.
Please rate the following on a 1-10 scale: (5 is average) If you have not used another contractor, for reference, please rate the contractor against your expectations.
D. Please rate the efficiency of your contractor.
E. Please rate the timeliness of your contractor.
F. Please rate the cost effectiveness of the contractor.
G. Please rate your satisfaction with this contractor.
H. Please rate this contractor's professional level.
I. Please rate this contractor's Customer Service/Public Relations attitude.
J. Please estimate the amount of work (as a percentage) that was not completedly
correctly the first time.
V. Contractor Performance A. How long did it take for this contractor to get started once the "go-ahead" was given?
(1) Less than 8 days (3) Between 12 and 15 days
(2) Between 8 and 12 days (4) More than 15 days
(5) Other (please specify)
B. With respect to your project's time schedule, was the completion of the project:
(1) More than 25% early (5) Between 1 & 10% late
(2) Between 25 & 11% early (6) Between 10 & 25% late
(3) Between 10 & 1% early (7) More than 25% late
(4) On Time (8) Other (please specify)
All Information will remain confidential!

155
C. With respect to your project's budget, was it:
(1) More than 25% under (5) Between 1 & 10% over
(2) Between 25 & 11% under (6) Between 10 & 25% over
(3) Between 10 & 1% under (7) More than 25% over
(4) On Budget (8) Others/ease specify)
D. How many changes did you make to this project from the time construction
started?
E. How many changes did the contractor make to the project from the time
construction started?
F. How many people did the contractor keep (average) on your project?
Please rate the following on a 1-10 scale: (5 is average) If you have not used another contractor, for reference, please rate the contractor against your expectations.
G. Quality of Construction.
H. Housekeeping Level of the Contractor.
I. Contractor's management of his on-site staff.
J. Performance level of the subcontractor's.
K. Contractor's management of the subcontractors.
L. Contractor's ability to manage multiple phases of construction.
M. Quality of drawings -if the contractor provided any.
N. Quality of any engineering work the contractor may have provided for you.
O. Contractor's ability to handle emergency situations.
VI. Contractor's Safety Record
A. Number of accidents that occurred on your project. _
B. Number of accidents that resulted in lost time on you project.
All Information will remain confidential!

156
C. Number of accidents that resulted in a permanent disability or a death on your
project.
Please rate the following on a 1-10 scale: (5 is average) If you have not used another contractor, for reference, please rate the contractor against your expectations.
D. The overall safety of the contractor's procedures.
E. The overall safety of the subcontractor's procedures.
Once again, we thank you for your time and cooperation. Your ratings will contribute to the results of a performance-based evaluation of this contractor. This information will be included in the procurement of a maintenance contractor for a government agency and to hopefully spend your tax dollars more efficiently.
We sincerely thank you!
All Information will remain confidential!

BIOGRAPHICAL SKETCH
Scott Hoover was born 25 November 1964, in Wooster, Ohio. He graduated from West Branch High School, Beloit, Ohio in 1983 and from Miami University, Oxford, Ohio with a Bachelor of Environmental Design in 1987. From February 1987 until October 1988, he was a concept to 35 % design architect for Lawrence, Dykes, Bower & Clancy, Canton Ohio. In this role, he was responsible for nearly $11 million worth of design. From October 1988 until August 1991, Scott served as design architect, Shaw Air Force Base, South Carolina. In this role, he designed the Shaw Family Support Center. This project was nominated for an Air Force Design Award. During this time period, he deployed to the Persian Gulf for nearly ten months in support of Operations Desert Shield/Storm. From August 1991 until July 1993, he served as Chief of Programming and Rapid Runway Repair (RRR) Officer in Charge, Bitburg Air Base, Germany. His team's project programming efforts led to over $11 million worth of funded Military Family Housing projects. Scott's 40-man RRR team set new European records, two years running, in the Supreme Headquarters Allied Powers Europe RRR certification. During his service in Germany, Scott married the former Laura Suzanne Avery of Denver, Colorado. They were then awarded an 18 month Air Force Institute of Technology Scholarship to attend Arizona State University from August 1993 through December 1994. They have subsequently selected to join the Headquarters Air Mobility Command's Engineering staff, Scott Air Force Base, Illinois.