Embed Size (px)
Citation preview

ISSN 0254-380 X
No. 91
iARINE FISHERIES INFORMATION SERVICE
JANUARY 1989
•^Z:^ TECHNICAL AND •fe^Tin: v3ra9T^rc^ EXTENSION SERIES
W ^ 5 t TTTfR:cr^ CENTRAL MARINE FISHERIES ar^HQw TT^zn^ RESEARCH INSTITUTE
^5rtxr;T, ^ira" COCHIN, INDIA
INDIAN COUNCIL OF AGRICULTURAL RESEARCH
CORE Metadata, citation and similar papers at core.ac.uk
Provided by CMFRI Digital Repository

^igsfr irrf^Fi^r I ararr d ^ ? ^ i n f ? ^ T?: anHnftcr S I^STR "Tft>imTf # a n q ^ , HCF? ? ^ ^ 1c¥I "TI^ % ==r SRIR ^^ afk cT^oT^lt ^ Eiq OT TI ^ WUTI^ ^Hi •MJclRcT ^ ^ I a^cT
THE MARINE FISHERIES INFORMATION SERVICE : Technical and Extension Series envisages dissemination of information on marine fishery resources based on research results to the planners, Industry and fish farmers and transfer of technology from laboratory to field.
Abbreviation - A/ar. Fish. In/or. Serv., T&E Ser., No. 91: 1989
I am glad to inform all our readers that the MFIS has been recognised as a standard international publication and consequently it has been allotted the INTERNATIONAL STANDARD SERIAL NUMBER (ISSN) 0254-380 X. From this issue onwards the serial will carry this number on the right hand top corner of the front cover.
Director
3 f r T ^ / CONTENTS
Marine fish production in India — 1985-'86
>TR ^ ^(^ MW^ Scqi^ — 1985-'86
t . ^ . 3TI . 1^-22 Ht. triT. trtfi. SIR. 3Tr|. % ^ I ^ ^ if yi^Jlftcf ^Ri :^ ^ 3TOTHPT I
Front cover photo: ECIL-22 Computer with other accessories installed in the computer centre of CMFRI.
' f fs^i ^ i fir% TIT *iil«M*t "reR I
Back cover photo: The newly constructed fisheries harbour at Neendakara.
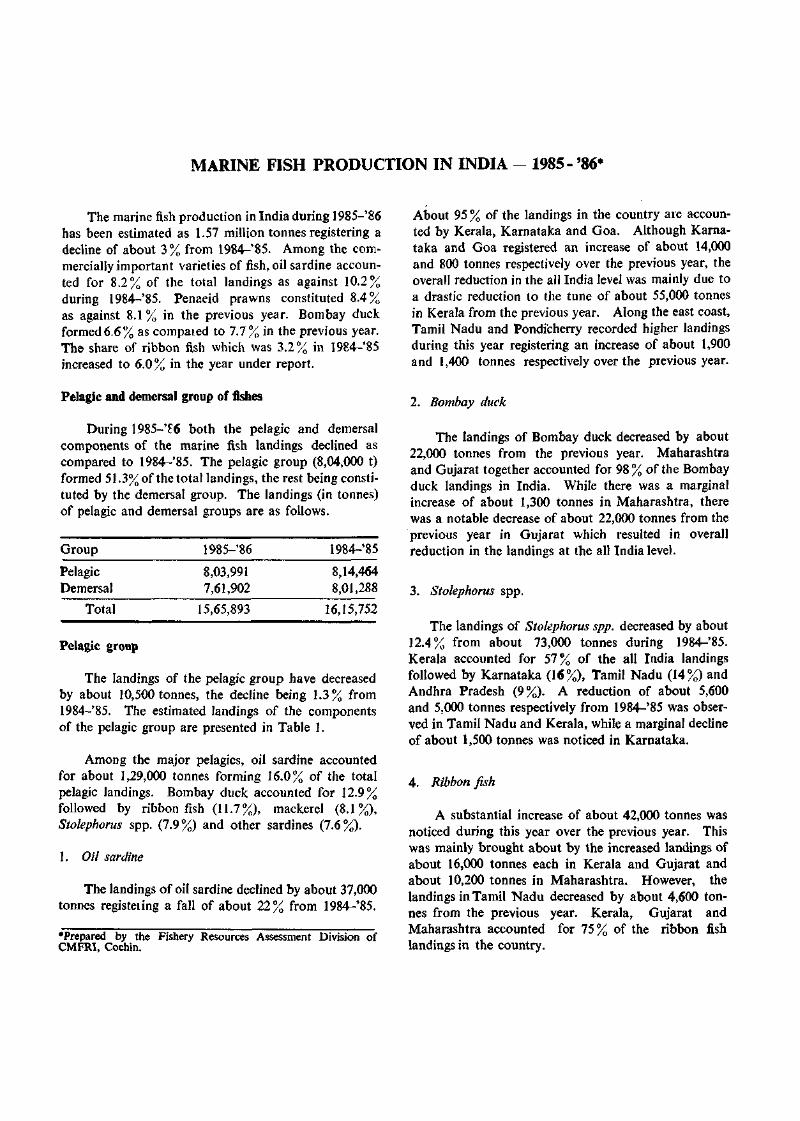
MARINE FISH PRODUCTION IN INDIA - 1985-'86*
The marine fish production in India during 1985-'86 has been estimated as 1.57 million tonnes registering a decline of about 3% from 1984-'85. Among the commercially important varieties of fish, oil sardine accounted for 8.2% of the total landings as against 10.2% during 1984-'85. Penaeid prawns constituted 8.4% as against 8.1 % in the previous year. Bombay duck formed 6.6% as compated to 7.7% in the previous year. The share of ribbon fish which was 3.2% in I984-'85 increased to 6.0% in the year under report.
About 95 % of the landings in the country are accounted by Kerala, Karnataka and Goa. Although Karna-taka and Goa registered an increase of about 14,000 and 800 tonnes respectively over the previous year, the overall reduction in the ail India level was mainly due to a drastic reduction to the tune of about 55,000 tonnes in Kerala from the previous year. Along the east coast, Tamil Nadu and Pondicherry recorded higher landings during this year registering an increase of about 1,900 and 1,400 tonnes respectively over the previous year.
Pelagic and demersal group of fishes
During 1985-'£6 both the pelagic and demersal components of the marine fish landings declined as compared to 1984-'85. The pelagic group (8,04,000 t) formed 51.3% of the total landings, the rest being constituted by the demersal group. The landings (in tonnes) of pelagic and demersal groups are as follows.
Group
Pelagic Demersal
Total
1985-'86
8,03,991 7,61,902
15,65,893
1984-'85
8,14,464 8,01,288
16,15,752
Pelagic group
The landings of the pelagic group have decreased by about 10,500 tonnes, the decline being 1.3% from 1984-'85. The estimated landings of the components of the pelagic group are presented in Table 1.
Among the major pelagics, oil sardine accounted for about 1,29,000 tonnes forming 16.0% of the total pelagic landings. Bombay duck accounted for 12.9% followed by ribbon fish (11.7%), mackerel (8.1%), Stolephorus spp. (7.9%) and other sardines (7.6%).
1. Oil sardine
The landings of oil sardine declined by about 37,000 tonnes registeiing a fall of about 22% from 1984-'85.
•Prepared by the Fishery Resources Assessment Division of CMFRI, Cochin.
2. Bombay duck
The landings of Bombay duck decreased by about 22,000 tonnes from the previous year. Maharashtra and Gujarat together accounted for 98 % of the Bombay duck landings in India. While there was a marginal increase of about 1,300 tonnes in Maharashtra, there was a notable decrease of about 22,000 tonnes from the previous year in Gujarat which resulted in overall reduction in the landings at the all India level.
3. Stolephorus spp.
The landings of Stolephorus spp. decreased by about 12.4% from about 73,000 tonnes during 1984-'85. Kerala accounted for 57% of the all India landings followed by Karnataka (16%), Tamil Nadu (14%) and Andhra Pradesh (9%). A reduction of about 5,600 and 5,000 tonnes respectively from 1984-'85 was observed in Tamil Nadu and Kerala, while a marginal decline of about 1,500 tonnes was noticed in Karnataka.
4. Ribbon fish
A substantial increase of about 42,000 tonnes was noticed during this year over the previous year. This was mainly brought about by the increased landings of about 16,000 tonnes each in Kerala and Gujarat and about 10,200 tonnes in Maharashtra. However, the landings in Tamil Nadu decreased by about 4,600 tonnes from the previous year. Kerala, Gujarat and Maharashtra accounted for 75% of the ribbon fish landings in the country.

5. Mackerel 3. Non-penaeid prawns
The landings of mackerel (65,000 t) was about 15,000 tonnes more than that during 1984-'85. Karna-taka accounted for 38% of the landings followed by Kerala (31 %). The landings in Kerala and Karnataka have increased by about 7,500 and 11,800 tonnes respectively from the previous year. The landings in Goa were about 5,700 tonnes during 1985-'86 which was about double the landings in the previous year.
Demersal group
The estimated landings of various demersal species are presented in Table 2.
In the demersal group, penaeid prawns ranked first accounting for 17.4% of the total demersal landings followed by croakers (13.5%), perches (9.5%), non-penaeid prawns (8.5%), silver bellies (7.2%), elasmo-branchs (6.7%), cat fish (6.0%) and pomfrets (3.8%).
1. Penaeid prawns
The estimated non-penaeid prawn landings during 19S5-'86 was about 64,500 tonnes which was about 9,400 tonnes less than in 1984-'85. Maharashtra, Gujarat and West Bengal together accounted for about 97% of the landings in the country, the share of Maharashtra alone being 78.5%. These three states recorded lower landings as compared to the previous year, with reduction of about 4,400 tonnes in West Bengal followed by Gujarat (2,400 t) and Maharashtra (1,200 t).
4. Silver bellies
An increase of 5.3% was noticed in the landings from about 52,900 tonnes in 1984-'85. About 71% of the country's landings was accounted by Tamil Nadu and the landings in this state increased by about 3,300 tonnes from the previous year landings of about 35,800 tonnes. Among the other important contributors to the country's landings, Andhra Pradesh and Karnataka registered an increase of about 1,200 and 700 tonnes respectively from the previous year while a marginal reduction of about 400 tonnes was observed in Kerala.
A marginal increase of about 1.3% was observed in the landings (1,32,200 t) during 1985-'86 as compared to 1984-'85. Maharashtra (55,600 t), Kerala (28,000 t), Gujarat (14,000 t), Tamil Nadu (12,200 t) and Andhra Pradesh (9,300 t) were the major contributors accounting for 90% of the all India penaeid prawn landings. While the landings in Maharashtra and Andhra Pradesh increased by 10,200 and 2,000 tonnes respectively from the previous year, the landings in Kerala recorded a fall of about 9,200 tonnes. During 1984-'85 and 1985-'86, the landings in Gujarat and Tamil Nadu respectively were more or less of the same magnitude.
2. Croakers
The landings of croakers were estimated at 1,02,600 tonnes which was about 5.6% less than the previous year. About 72.5% of the total croaker landings in India was accounted by Gujarat (32,400 t), Maharashtra (24,900 t) and Orissa (17,200 t). While the landings in Gujarat and Orissa recorded a decline by about 4,200 and 1,200 tonnes respectively the landings in Maharashtra increased by about 4,700 tonnes from the previous year. Kerala and Tamil Nadu recorded a decrease of about 2,200 and 2,000 tonnes respectively from the previous year.
5. Perches
The landings of perches during 1985-'86 was the same as in 1984-'85 and was estimated at 72,400 tonnes. Threadfin bream accounted for 55.6% of the perch landings in the country which was about 5 % more than during the previous year. Kerala, Tamil Nadu, Maharashtra and Andhra Pradesh were the major contributors; these states together accounting for about 82%of the country's landings. Kerala led with 41.1 % followed by Tamil Nadu (17.4%), Maharashtra (13.8%) and Andhra Pradesh (9.9%). Kerala accounted for 59% of the threadfin bream landings in the country followed by Gujarat (9.5 %), Maharashtra (8.1 %) and Tamil Nadu (7.4?^,).
6. Elasmobranchs
A decrease of about 4,000 tonnes was recorded as compared to 1984-'85, the landings during 1985-'86 being 51,000 tonnes. Sharks constituted 62% of the elasmobranchs while rays and skates formed 32 and 6 % respectively. Gujarat, Maharashtra, Tamil Nadu, Andhra Pradesh and Kerala together accounted for 87 % of the country's elasmobranch landings. Gujarat, Maharashtra, Andhra Pradesh and Kerala together accounted for 80% of the all India landings of the

sharks. Tamil Nadu ranked first (41 %) in respect of the landings of the rays followed by Gujarat (17%), Maharashtra (16.5%), Andhra Pradesh (8.2%) and Kerala (7.4%). While in Gujarat, Orissa, Karnataka and Pondicherry the landings of sharks have increased, in the remaining states the landings were less when compared to the previous year. The landings of rays decreased in Gujarat, Andhra Pradesh and Goa, whereas in the other states the landings have increased over the previous year.
A marginal increase of 2 % over 1984~'85 was noticed in the landings by the mechanised craft while a 16% decrease was noticed in the case of non-mechanised craft. In 1985-86 ,74.9% of the all India landings was accounted by the mechanised craft as against 70.9% in 1984-'85.
Landiags in diSerent regions
Northeast region
7. Catfish
The landings of cat fish during 1985-'86 have been estimated at 45,400 tonnes showing a decline of about 13.1% from 1984-'85. Gujarat and Maharashtra together accounted for 54 % of the country's cat fish landings, the landings in these states being 12,600 and 11,900 tonnes respectively. The other states which made significant contribution in the order of magnitude were Kerala (4,700 t), Orissa (4,700 t), Andhra Pradesh (4,600 t) and Karnataka (2,400 t). While the landings in Gujarat and Maharashtra registered an increase, that in Kerala recorded a fall of about 55 % from the previous year. Orissa, Andhra Pradesh and Karnataka too registered a decline of about 21,16 and 12% respectively.
8. Pomfrets
A notable decrease of about 18,000 tonnes from 46,600 tonnes in 1984-'85 was observed during this year. This was mainly brought about by the decreased landings of silver pomfrets from 34,600 tonnes in 1984-'85 to 19,100 tonnes in 1985-'86. The black pomfret also registered a decline by 2,000 tonnes. Silver pomfret formed 66.5 % of the total pomfret landings. The black pomfret accounted for 32.9 %, the rest being the Chinese pomfret. Maharashtra and Gujarat together accounted for 77 % of the country's pomfret landings. Both these states recorded a fall to the tune of 7,900 and 4,000 tonnes respectively.
Landings by mechanised and non-mechanised craft
The estimated landings (in tonnes) by mechanised and non-mechanised craft aie presented below:
Craft
Mechanised Non-mechanised
Total
1985-'86
1,173,160 392,733
1,565,893
1984-'85
1,149,694 466,058
1,615,752
The northeast region comprising West Bengal and Orissa recorded 78,100 tonnes of marine fish landings accounting for 5 % of the all India landings. The landings during this year decreased by about 7 % from the previous year. Among the commercially important varieties, non-penaeid prawns suffered a decHne of 51% from the previous year followed by cat fish (19%), penaeid prawns (29%) and croakers (6.5%). About a quarter of the total marine fish landings in this region was accounted by the croakers, the other major contributor being the cat fish with 19%.
Southeast region
This region consisting of Andhra Pradesh, Tamil Nadu and Pondicherry registered a decline in the landings from 3,80,400 tonnes in 1984-'85 to 3,33,000 tonnes in 1985-'86, the decrease being 12.5%. The landings in this region constituted about 21.3% of the all India landings. Silver bellies, other sardines, perches, elasmobranchs, croakers, ribbon fish, Stolephorus spp. and penaeid prawns are the major components of the marine fish landings in this region. Silver bellies and penaeid prawns registered an increase of about 5,000 and 1,200 tonnes respectively, whereas, the other important contributors mentioned above recorded decreased landings as compared to the previous year; notable among them being elasmobranchs (-6,600 t), ribbon fish (-6,100 t) and other sardines (-5,000 t).
Southwest region
The southwest region comprising Kerala, Karnataka and Goa which accounted for 33.8 % of the country's marine fish landings registered a marginal decline of 2% from 1984-'85; the landings during 1985-'86 being to the tune of 5,28,500 tonnes. Oil sardine, mackerel, Stolephorus spp., penaeid prawns, perches, ribbon fish and cat fish are the important components of the landings. Oil sardine showed a substantial reduction of about 40,500 tonnes from 1984~'85 while the landings of mackerel and ribbon fish increased by 22,000 and 20,000

tonnes respectively. A decrease of about 9,600 tonnes was noticed in the penaeid prawn landings. The landings of cat fish and Stolephorus spp. also registered a decline to the tune of 7,000 and 6,500 tonnes respectively.
Northwest region
The region comprising of Maharashtra and Gujarat accounted for 39.2% of the country's landings. The landings during 1985-'86 were estimated at 6,15,100 tonnes which was 2.6% less than in 1984-'85. Bombay duck, non-penaeid prawns, penaeid prawns, ribbon fish, croakers and pomfrets are the major components of the fish landings. The landings of Bombay duck and pomfrets registered a notable decline to the tune of 20,300 and 12,600 tonnes respectively. A substantial increase of about 26,000 tonnes was noticed in the ribbon fish landings, the landings during 1984-'85 being 19,600 tonnes. A notable increase of about 10,400 tonnes was observed in the penaeid prawn landings, the landings during the year being to the tune of 69,600 tonnes.
Landings by mechanised and non-mechanised craft in different states
The marine fish landings in different maritime states are given in Tables 3-12. The salient features of the landings during 1985-'86 are summarised below.
West Bengal
The landings by mechanised craft during 1985-'86 amounted to about 17,000 tonnes showing a decline of about 17.5% from 1984-'85. The landings by bag nets, accounting for 57.1% of the total landings, dominated the mechanised landings followed by the drift/gill nets (39.7%), hooks and line (2.6%) and trawl net (0.6%). Ribbon fish, non-penaeid prawns, bombay duck and croakers were the major components of the bag net catch accounting for 42.9, 25.2, 8.9 and 5.1 % respectively. In the drift/gill net landings, hilsa shad, pomfrets and cat fish were the major components forming 47.6, 15.8 and 13.1 % respectively. About 98.2% of the hooks and line catch was of cat fi3h and elasmobranchs, the share of the former being 72.5 %. A decline of about 4,800 tonnes was observed in the non-mechanised landings from the landings of the previous year which was about 12,300 tonnes. Ribbon fish (28.5%), non-penaeid prawns (15.7%), croakers (9.4%) and penaeid prawns (4.7%) were the major components of the non-mechanised landings.
Orissa
An increase of about 3,800 tonnes from the previous year was noticed in the mechanised landings, the quantity landed during this year being about 36,100 tonnes. The landings by the trawl net which accounted for 90.3% of the mechanised landings registered an increase of about 1,500 tonnes from the previous year and the gill net landings forming 9.7 % of the mechanised landings also increased by about 2,300 tonnes from the previous year. The croakers dominated the trawl net catches accounting 48.1 %. The other important contributors were catfish (7.4 %) and penaeid prawns (6.4%). In the gill net landings pomfrets (35.4%) dominated the catch followed by cat fish (20.2%) and croakers (9.7%). A decline of about 1,300 tonnes was noticed in the non-mechanised landings from the previous year landings of about 18,800 tonnes. The important contributors were the other sardines (15.1 %), cat fish (8.8%), croakers (6.8%), pomfrets (4.7%) and penaeid prawns (3.0%).
Andhra Pradesh
The mechanised landings in Andhra Pradesh during 1985-'86 were estimated at about 36,400 tonnes registering an increase of about 17 % over 1984-'85. Almost the entire landings by the mechanised craft in the state (99.8%) was accounted by the trawlers the rest being from the gill nets. The important components of the trawl net catch were penaeid prawns (16.6%), perches (12.5%). c'roakers (10.9%) and silver bellies (9.2%). A notable decrease of about 22,900 tonnes was observed in the non-mechanised landings, the landings in the previous year being 1,01,700 tonnes. Among the commercially important varieties, the major components of the landings were mackerel (15.5%), penaeid prawns (4.2 %), croakers (3.6 %), perches (3.3 %) and silver bellies (3.2%).
Tamil Nadu
In this state the mechanised landings during 1985-'86 were estimated at about 1,03,800 tonnes showing an increase of about 1,900 tonnes from the previous year. The landings by trawl nets (91.7%) dominated the mechanised landings followed by gill net (5.9 %) and the rest from the others which include hooks and line. Silver bellies and penaeid prawns accounted for almost half of the trawl net catches, the former's share being 39.5%. The other important contributors were perches (5.7 %), croakers (5.1 %) and Stolephorus spp.(2.6 %). In the gill net landings about 26 % of the catch consisted

of the other sardines, the other major component being elasmobranchs (7.2%). A substantial reduction of about 32,600 tonnes was noticed in the non-mechanised landings, the quantity landed during this year bsing to the tune of 98,100 tonnes. The major contributors were the other sardines (17.0 %) followed by ribbon fish (7.2%),Stolephorus spp. (6.7%), perches (5.9%), seer fish (3.5%), oil sardine (3.2%), croakers (3.2%) and elasmobranchs (2.8%).
Pondfcherry
The estimated mechanised landings to the tune of 5,800 tonnes during this year were about 1.500 tonnes more than in the previous year. The landings by trawl net (94.7%) dominated the mechanised landings the rest being from the gill nets. The silver bellies, perches and penaeid prawns accounted for more than 50% of the landings by trawl net, the individual share being 24.4, 21.9 and 8.6% respectively. In the gill net landings about 53.2 % of the catch was accounted by the elasmobranchs. A reduction of about 700 tonnes was observed in the non-mechanised landings from the previous year landings of about 10,600 tonnes. Other sardines (18.9%), oil sardine (17.9%) and mackerel (15.6%) were the major contributors.
Kerala
The landings by the mechanised craft during 1985-'86 were estimated to be 2,72,700 tonnes forming about 73.7 % of the total landings. The mechanised landings showed a decline to the tune of about 36,500 tonnes from 1984-'85. Landings by trawlers contributed 40.6% followed by gill netters (4.4%) and purse-seiners (3.2%). About 51.7% of the mechanised landings was accounted by the other types of craft mainly, the country craft fitted with outboard motor. Penaeid prawns and perches made equal contribution to the trawl net landings; these two together accounting for 50% of the trawl landings. In the purse-seine landings, mackerel dominated forming 61.5% followed by oil sardine (26.7%), Tunnies (23.1%), elasmobranchs (21.7%) and cat fish (16.7%) were the major components of drift/gill net landings. In the other categories, the major contributors were oil sardine (40.7 %),Stolephorus spp. (21.5 %), mackerel (8.6 %) and tunnies (4.5 %). The landings by the non-mechanised craft also suffered a decline from about 1,04,800 tonnes in 1984-'§5 to about 84,200 tonnes in 1985-'86. The major portion of the catch was constituted by ribbon fish (26 2 %), oil sardine (25 4%), Stolephorus spp. (10 3%) and mackerel (5.7%).
Karnataka
An estimated 1,40,500 tonnes were landed by the mechanised ciaft during 1985-'86, which was about 32,200 tonnes more than in 1984- '85. The mechanised landings accounted for 91.1% of the total landings in the state. Purse-seiners and trawlers were the major conti ibutors together accounting for 9 7.6 % of the mechanised landings, the former's share alone being 70.3%. The important contributors in the puise-seine landings weie oil sardine (44.9%), mackerel (21.5%) and tunnies (2.5%). Stomatopods (36.7%) dominated the trawler landings followed by penaeid prawns (12.9%), perches (7.8 %),ribbon fish (3.9%), croakers (2.8%) and silver bellies (2.8%), An increase of about 2,300 tonnes was noticed in the landings by the non-mechanised craft from the previous year landings of about 11,400 tonnes. Among the commercially important varieties, mackerel dominated forming 23.5% of the landings followed by oil sardine (9.1 %) and croakers (4.6%).
Goa
The landings by the mechanised craft during 1985-'86 were estimated as 46,000 tonnes which is about 8,000 tonnes more than in 1984-'85. The mechanised landings formed about 86.3% of the total landings. The landings by trawlers accounted for about 62.4% of the mechanised landings, the other major contributor being the purse-seiners with 31 %. Among the commercially important varieties, penaeid prawns formed 12.4 % of the trawl landings followed by croakers (5.8 %) and perches (4.0%). In the purse-seine landings mackerel had a major share (35.9%) followed by oil sardine (18.2 %) and the other sardines (10%). During this year, an increase of about 3,500 tonnes was noticed in the landings by the non-mechanised craft from the previous year landings of about 3,700 tonnes. Among the commercially important varieties, croakers formed 7.0% of the catch followed by the other sardines (6.1 %), mackerel (5.0%), oil sardine (3.5 %) and silver bellies (3.0%).
Maharashtra
An estimated 3,30,300 tonnes were landed by the mechanised craft which accounted for 97.2% of the total landings in the state. Dol netters accounted for 52.2 % of the mecham'sed landings followed by trawlers (39.9%) and gill netters (7.3%). Among the commercially important varieties, the share of Bombay duck was the highest (35.5%) in the dol netters followed by non-penaeid prawns (26.4%), penaeid prawns (11.0%)

and ribbon fish (6.0 %). In the trawl landings, penaeid prawns (27.6%) dominated the landings followed by croakers (11.3%), ribbon fish (7.0%) and elasmobranchs (5.7%). In the gill net landings pomfrets ranked first in magnitude forming 19.2% of the catch followed by cat fish (11.7%), elasmobianchs (8.9%) and tunnies (4.5 %). During this year a decline of about 2,700 tonnes was noticed in the non-mechanised landings from the previous year landings of about 11,800 tonnes.
Gujarat
The landings by mechanised craft during 1985-'86 were about 2,19,800 tonnes showing a decline of about 6.8% from 1984-'85. The mechanised landings accounted for 79.8 % of the total landings in the state. Among the mechanised crafts;the trawl netters accounted for 60.4% followed by gill netters (22.1 %),dol netters(17.1 %) and the rest from others including hooks and line. Among the commercially important varieties, croakers dominated the trawler landings forming 17.5% of the catch followed by ribbon fish (14.2%), big-jawed jumper (10.7 %), penaeid prawns (6.7 %) and perches (5.9 %). In the drift/gill net tunnies were more, forming 16.0% of the catch followed by pomfrets (14.6%), elasmobranchs (13.5%), catfish (9.1%) and croakers (5.6%). Bombay duck accounted for 58.7% of the dol net landings followed by ribbon fish (8.4%), non-penaeid prawns (7.0%) and croakers (6.8%). The non-mechanised landings showed an increase of about 2,500 tonnes from 55,400 tonnes in 1984-'85. Bombay duck accounted for 30 % of the landings followed by croakers (6.8 %), penaeid prawns (6.7%) and non-penaeid prawns (4.3%).
Landings of mechanised boats at major centres
The estimated marine fish landings at major centres in the country are presented in Tables Nos. 13-31. A brief description of landings at these centres is given below.
Visakhapatnam Outer Harbour
The landings by trawlers in 1985--'86 showed an increase of about 180 tonnes from about 6,340 tonnes of the previous year. The number of operations registered a reduction of about 5,000 while the catch per unit operation increased to 248 kg from 203 kg of previous year. Among the commercially important varieties, the threadfin breams, other perches, cephalopods and silver bellies registered an increase of about 330,66,73 and 34 tonnes respectively. The landings of penaeid
prawns and ribbon fish declined by about 300 and 130 tonnes respectively from the previous year.
Kakinada Fisheries Harbour
The landings by the trawlers during 1985-'86 increased by about 4,100 tonnes from the previous year (14,139 t). However, there was only an increase of about 1,000 unit operations from the previous year, the number of unit operations during this year being about 37,600. The catch per unit operation increased from 385 kg in the previous year to 484 kg during this year. The increase in the total landings was mainly brought about by higher landings of other sardines, other perches, ribbon fish, silver bellies and penaeid prawns, the increase from the previous year .being 890, 640, 300, 250 and 1,000 tonnes respectively.
Pudumanaikuppam
A decrease of about 2,200 tonnes from the previous year landings of about 8,900 tonnes was observed during this year. There was also a reduction of about 2,000 in the number of unit operations from the previous year and also in the catch rate from 241 kg per unit operation in the previous year to 192 kg duiing this year. The decline in the total landings was mainly due to the reduction in the landings of lizard fish, threadfin breams, ribbon fish, and silver bellies, the decline being, 260, 300, 270 and 470 tonnes respectively.
Cuddalore Fisheries Harbour
The mechanised boats operating with trawl ntts and gill nets land their catches, at this centre. The landings by trawlers during this year were more than double that during the previous year catch of about 2,630 tonnes, followed by doubling the effort in respect of unit operations from about 9,200 unit operations during the pre vious year. This resulted in the increase of catch rate from 285 kg from the previous year to 324 kg during this year. The increase in the trawler landings during this year was due to increase in the landings of lizard fish, threadfin breams, croakers, silver bellies and penaeid prawns, the increase being to the tune of about 350, 420, 200, 1,100 and 300 tonnes from the previous year. The gill net landings during this year were estimated at 222 tonnes which was 124 tonnes less than in the previous year. The unit operations of gill nets also declined from 1,196 in the previous year to 548 in this year. However, the catch rate increased from 288 kg in the previous year to 405 kg during this year. Elasmobranchs, seer fish and tunnies are the main

components of the gill net landings; these three together accounted for about 79 % of the total gill net catch.
Nagapattinam
The landings by the trawlers at this centre during this year were estimated at 10,699 tonnes which was about 1,600 tonnes more than during the previous year. White baits, threadfin breams,croakers,silver bellies andpenaeid prawns were the major contributors to the total landings, the respective catches being, 1,551,1,028, 868, 2,018 and 990 tonnes. The number of unit operations during this year was 36,535 as compared to 41,029 in the previous year and the respective catch per unit operation being 293 kg and 216 kg.
Mandapam Camp
A marginal increase of about 300 tonnes was observed in the trawler landings at this centre during this year as compared to the previous year landings of about 7,300 tonnes. Silver bellies, penaeid prawns, croakers and elasmobranchs are major components of the catch, the landings being 2.390, 946, 358 and 356 tonnes respectively. Although a reduction of about 4,900 was observed in the unit operations from the previous year (59,600), the catch rate during this year was 139 kg as against a catch rate of 123 kg in the previous year.
Rameswaram Verkottil
The trawler landings at this centre dunng this year was estimated at 20,039 to nnesfrom 66,948 operations of units with a catch rate of 299 kg. The total landings reduced by about 1,400 tonnes from the previous year and the unit operations also declined by 8,400. However, the catch rate during this year was about 14 kg more than the previous year. Silver bellies (11,253 t), penaeid prawns (2,163 t), elasmobranchs (1,8271) and croakers (918 t) were the major components of the landings.
Tuticorin Fisheries Harbour
The trawler landings (15,488 t) during this year were more or less of the same magnitude as in the previous year (15,491 t). However, a reduction of 4,000 was observed in the number of operations of units during this year from the previous year (51,850), resulting in higher catch rate during this year with 324 kg per unit operation as against 299 kg in the previous year. Silver bellies (6,7271), Thryssaspp. (2,2\2i), penaeid prawns
(1,8441), carangids (1,231 t) and croakers (744 t) were the important components of the landings.
Sakth ik uhngara
At this centre, trawlers and gill netters land their catches. The estimated trawler landings during this year was 56,205 tonnes as against 58,673 tonnes in the previous year. The landings by the gill netters also declined from 3,792 tonnes in the previous year to 2,195 tonnes in this year. Threadfin breams, penaeid prawns, lizard fish, cephalopods, soles and cioakers are the major components of the trawler landings. Among these, threadfin breams, soles and cephalopods registered an increase of 4,310,318 and 840 tonnes respectively and the rest recorded lesser landings, prominent being a reduction of about 4,500 tonnes in the landings of penaeid prawns and 1,200 tonnes of lizard fish. Tuna, cat fish, elasmobranchs and seer fish are the major contributors of the gill net landings. During this yeai all thtse recorded a decline, the reduction being 215, 266, 279 and 587 tonnes respectively.
Cochin Fisheries Harbour
Trawlers, purse-seiners, other mechanised boats operating with drift gill nets, hooks & lines and outboard engined craft (with Thanguvala) land their catches here. The bulk of the landings are accounted by purse-seineis, trawlers and gill netters, these three accountingfor 98.3% of the total landings at this centre. The estimated trawler landings during this year (6,779 t) was 4,251 tonnes less than in the previous year. The reduction was mainly brought out by decline in the landings of threadfin breams (-3,2281) and penaeid prawns (-912 t). A decline of 9,261 tonnes was recorded in the purse-seine landings in this year from 16,826 tonnes in the previous year. This was mainly due to reduction of about 10,000 tonnes in the oil sardine landings, its landings during this year being 2,023 tonnes. The mackerel landings increased from 2,825 tonnes in the previous year to 4,649 tonnes during this year. The tuna landings which was estimated at 5 tonnes in the previous year has increased to 602 tonnes in this year. A decline of 138 tonnes was noticed in the drift gill net landings, the landings this year being 2,623 tonnes. Tuna, seer fish cat fish and elasmobranchs were the major contributois to the gill net landings. While the landings of tuna and cat fish registered an increase, seer fish and elasmobranchs recorded a decline.

Mangalore
The purse-seiners, trawlers and gill netters land their catch at this centre, the former two together accounted for about 98 % of the total landings. The landings by purse-seiners increased from 27,0S6 tonnes in the previous year to 29,322 tonnes during this year. Oil sardine, mackerel, white baits and other sardines are the major components of the landings by the purse-seiners. The landings of oil sardine increased from 8,673 tonnes in the previous year to 13,954 tonnes in this year and that of mackerel from 3,933 tonnes to 10,024 tonnes. However, the landings of white baits and other sardines have declined by about 2,800 and 900 tonnes respectively from the previous year. The landings of trawlers registered an increase from 5,364 tonnes in the previous year to 11,821 tonnes in the current year. Threadfin breams, penaeid prawns, ribbon fish and soles are the major components of the trawler landings. The landings by gill netters estimated at 384 tonnes were about 130 tonnes more than in the previous year. Elasmobranchs, tunas and cat fish are the major contributors to the gill net landings.
New Ferry Wharf
The trawlers, dol netters and gill netters land their catches at this centre. The landings of trawlers increased from 38,655 tonnes in the previous year to 45,985 tonnes and the unit operations have increased from 23,321 to 24,309. Penaeid prawns (9,352 t), cephalopods (6,136t), croakers (5,3981) and elasmobranchs (5,191 t) are the major components of the trawler landings. The total landings of dol netters and gill netters were 531 and 96 tonnes respectively during this year.
Sassoori Dock
A decline of about 2.000 tonnes was observed in ths trawler landings compared to the previous year landings of 35,800 tonnes and the number of operations of units declined from 22,753 to 21,278. Penaeid prawns(13,4161), cephalopods (5,281 t), croakers (2,904 t), ribbon fish (1,6311), elasmobranchs (1,555 t) and cat fish (1429 t) were the major components of the trawler landings. The landings of dol nets increased from 2,004 tonnes in the previous year to 2,964 tonnes in the present year. Non-penaeid prawns (1,282 t) and Bombay duck (728 t) were the important contributors to the dol net landings. The gill net landings of 2,709 tonnes during this year was about 700 tonnes more than in the previous year. Elasmobranchs (424 t), seer fish (387 t), tuna (293 t) and catfish (1841) were the major components of the
gill net landings. The landings by hooks and lines (465 t) during this year mainly consisted of cat fish (198 t), elasmobranchs (88 t), eels (Sit) and croaker (48 t).
Veraval
The trawlers and gill netters land their catches here and during this year the landings by both these have increased as compared to the previous year, from 45,317 to 49,909 tonnes for trawlers and 4,240 to 5,425 tonnes for the gill netters. In the trawler landings the major contributors were croakers (8,6731), ribbon fish (7,546 t), Thryssa (5,217 t), big-jawed jumper (5,129 t), penaeid prawns (3,625 t), cephalopods (2,580 t), eels (1,784 t) and elasmobranchs (1,701 t). Seer fish (9511), elasmobranchs (827 t) and tuna (255 t) dominated the gill net landings.
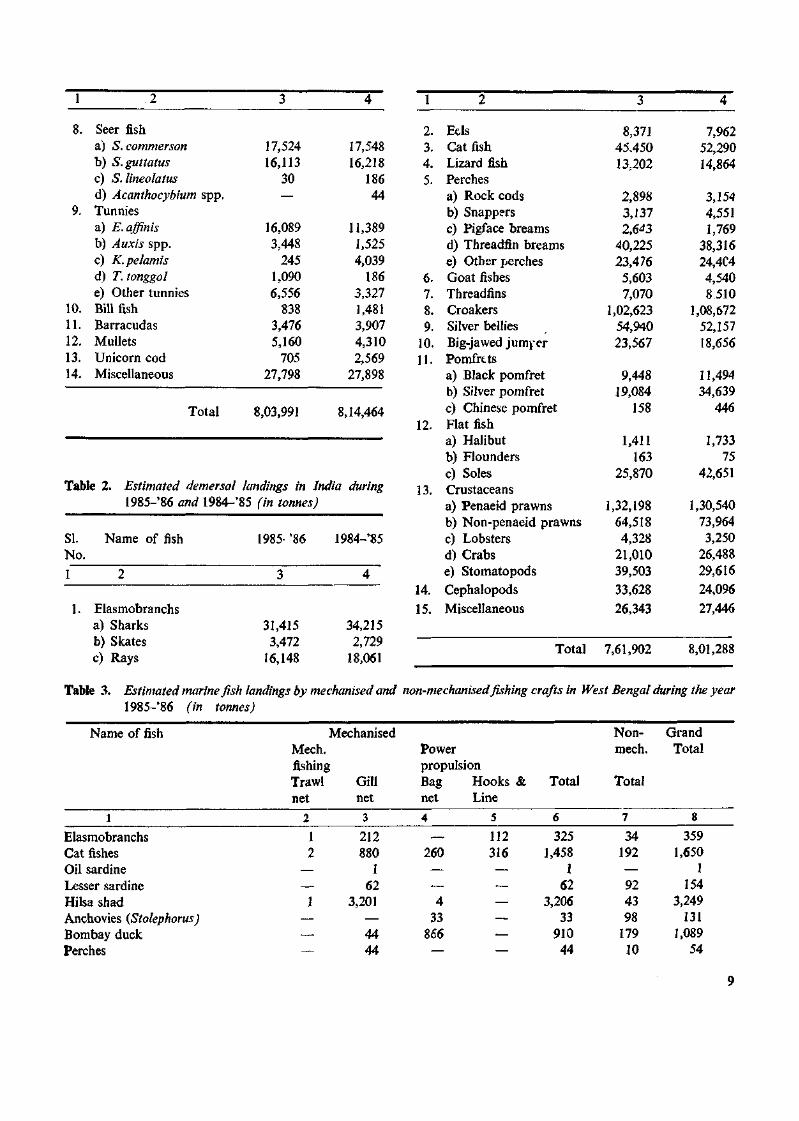
Table 1. Estimated pelagic landings in India during 1985-'86 and 1984-'85 (in tonnes)
SI. No. 1
1.
2. 3.
4. 5.
6.
7.
Name of fish
2
Clupeids a) Wolf herring b) Oil sardines c) Other sardines d) Hilsa shad e) Other shads f) Anchovies
Coilia Setipinna Stolephorus Thryssa
g) Other clupeids
Bombay duck Half beaks & Full beaks
Flying fish
Ribbon fish Carangids
a) Horse mackerel b) Scads c) Leather-jackets d) Other carangids
Mackerel a) Indian mackerel b) Other mackerel
1985-'86
3
17,006 1,28,724
60,828 5,543
11,981
28,043 3,504
63,692 27,372 32,945
1,03,419 2,637
669
94,305
3,534 8,840 6,042
36,763
65,152 87
1984-'85
4
18,424 1,65,537
68,314 9,609
14,962
24,272 3,229
72692 20,180 43,024
1,24,947 1,725
2,699
52,318
4,316 11,534 13,515 28,025
40,411 104
8
1
8.
9.
10. 11. 12. 13. 14.
.2
Seer fish a) S.commerson b) S.guttatus c) 5. lineolatus d) Acanthocybium spp. Tunnies a) E.affinis b) Auxis spp. c) K.pelamis d) r . tonggol e) Other tunnies Bill fish Barracudas Mullets Unicorn cod Miscellaneous
Total
Table 2. Estimated demersal
SI. No.
1
1.
3
17,524 16,113
30 —
16,089 3,448
245 1,090 6,556
838 3,476 5,160
705 27,798
8,03,991
4
17,548 16,218
186 44
11,389 1,525 4,039
186 3,327 1,481 3,907 4,310 2,569
27,898
8,14,464
landings in India during 1985-'86 flwrf 1984-'85 fm fOHw ;
Name of fish
2
Elasmobranchs a) Sharks b) Skates
c) Rays
1985- '86
3
31,415 3,472
16,148
1984-'85
4
34,215 2,729
18,061
1
2. 3. 4. 5.
6. 7. 8. 9.
10. 11.
12.
13.
14.
15.
2
Eels Cat fish Lizard fish Perches a) Rock cods b) Snappers c) Pigface breams d) Threadfin breams e) Other perches Goat fishes Threadfins Croakers Silver bellies Big-jawed jumj.er Pomfrtts a) Black pomfret
b) Silver pomfret c) Chinese pomfret Flat fish
a) Halibut b) Flounders c) Soles Crustaceans a) Penaeid prawns b) Non-penaeld prawns c) Lobsters d) Crabs e) Stomatopods Cephalopods
Miscellaneous
Total
3
8,371 45.450 13,202
2,898 3,137 2,6-^3
40,225 23,476 5,603 7,070
1,02,623 54,940 23,567
9,448 19,084
158
1,411 163
25,870
1,32,198 64,518 4,328
21,010 39,503 33,628
26,343
7,61,902
4
7,962 52,290 14,864
3,154 4,551 1,769
38,316 24,4C4 4,540 8.510
1,08,672 52,157 18,656
11,494
34,639 446
1,733 75
42,651
1,30,540 73,964 3,250
26,488
29,616 24,096
27,446
8,01,288
Table 3. Estimated marine fish landings by mechanised and non-mechanised fishing crafts in West Bengal during the year 1985-'86 (in tonnes)
Name of fish Mechanised Mech. fishing Trawl Gill net net
Power propulsion Bag Hooks net Line
& Total
Non-mech.
Total
Grand Total
1 8
Elasmobranchs Cat fishes Oil sardine Lesser sardine Hilsa shad Anchovies (Stolephorus) Bombay duck Perches
212 880
1 62
3,201
44 44
260
4 33
866
112 316
325 1,458
1 62
3,206 33
910 44
34 192
92 43 98
179 10
359 1,650
1 154
3,249 131
1,089 54

Croackers Ribbon fish Silver bellies Pomfrets Mackerel Tunnies Penaeid prawns Non-penaeid prawns Others
19 — 38 —
3 — 48
210 132
6 1,065
16 —
857
490 4,151
31 6
191 2,436 1,211
— 719 — 4,283 — 75 — 1,071
— 210 — 2,436
8 2,124
714 2,148
325 35 1
355 1,181 2,126
1,433 6,431
400 1,106
1
565 3,617 4,250
Total 112 6,730 9,679 436 16,957 7,533 24,490
Tabk 4. Estimated marine fish landings by mechanised and non-mechanised fishing crafts in Orissa during 1985-'86 (in tonnes)
Table 5. Estimated marine fish landings by mechanised and non-mechanised fishing crafts in Andhra-Pradesh during 1985-'86 (in tonnes)
Name of fish
Oil sardine Other sardines Cat fishes Mackerel Bombay duck Croakers Perches Pomfrets Tunnies
Mechanised
Mech. Power fishing propul-
Trawl net
— 2,421
4 192
15,673 633 43
5 Penaeid prawns 2,103 Non-penaeid
prawns Others
Total
265 11,275
32,614
sion Gill net
— 708 —
2 339 123
1,240 2
15
— 1,069
3,498
— 3,129
4 194
16,012 756
1,283 7
2,118
265 12,344
36,112
Non-mech.
Total
101 2,641 1,538
688 66
1,185 308 826 360 510
8 9,238
17,469
Grand Total
Total
101 2,641 4,667
692 260
17,197 1,064 2,109
367 2,628
273 21,582
53,581
Name of fish
Oil sardine Mackerel Bombay duck Croakers Perches Silver bellies Pomfrets Tunnies Penaeid prawn; Non-penaeid
prawns Others
Total
Mechanised
Mech. fishing
Trawl net
12 191 220
3,951 4,527 3,326
154 36
5 6.044
629 17,241
36,331
Power propulsion Gill net
— • —
— 5
— 2 5
—
— 58
70
Total
12 191 220
3,951 4,532 3,326
156 41
6,044
629 17,299
36,401
Non-mech.
Total
88 4,355
448 2,812 2,584 2,488 1,713 1,267 3,296
537 59,261
78,849
Grand Total
100 4,546
668 6,763 7,116 5,814 1,869 1,308 9,340
1,166 76,560
1,15,250
10

Table 6. Estimated marine fish landings by mechanised and non-mechanised fishing craft in Tamil Nadu during the year 1985-'86 (in tonnes)
Name of fish
Oil sardine Mackerel Bombay duck Croakers Perches Pomfrets Tunnies Penaeid prawns Non-penaeid prawns Others
Total
Mech. Trawl net
18 164 —
4,873 5,449
119 288
10,240 90
73,906
95,147
Mechanised fishing
Gill net
6 40 — 49 70 74
456 1
— 5,383
6,079
Power propulsion Hooks & Others Line
— — — 79 — 23 — —
211
313
1 — 13 11 — 89 — —
2,102
2,216 :
Total
24 205
— 4,935 5,609
193 856
10,241 90
81,602
1,03,755
Non-mech. Total
3,172 5,391
— 3,115 5,771
141 994
1,942 110
77,432
98,068
Grand Total
3,196 5,596
— 8,050
11,380 334
1,850 12,183
200 1,59,034
2,01,823
Table 7. Estimated marine fish landings by mechanised and non-mechanised fishing crafts in Pondicherry during the year 1985-'86 (in tonnes)
Name of fish Mechanised Non-Mech. fishing Power mech.
propulsion Trawl Gill Hooks & Total Total net net Lines
Grand Total
Oil sardine Mackerel Bombay duck Croakers Perches Pomfrets Tunnies Penaeid prawns Non-penaeid prawns Others
5 5
— 214
1,210 — —
475 20
3,588
36
274
5 5
214 1,210
— 36
475 20
3,862
1,769 1,542
173 334 29 —
168 3
5,884
1,774 1,547
387 1,544
29 36
643 23
9,746
Total 5,517 310 5,827 9.902 15,729
11

Table 8. Estimated marine fish landings by mechanised and non-mechanised fishing crafts in Kerala during the year 1985-'86 (in tonnes)
Name of fish
Oil sardine Mackerel Bombay duck Croakers Perches Pomfrets Tunnies Penaeid prawns Non-penaeid prawns Others
Total
Mech. fishing Trawl net
58 61 —
5,177 24,425
18 3
24,073 —
42,002
95,817
Purse-Seine
2,026 4,676
—. 3 1
17 607
2 —
266
7,598
Mechanisec 1 Power propulsi
Gill net
321 —
135 11
180 2,393
— —
7,337
10,377
Hooks Line
— — —
162 — 19 — — 24
205
ion & Others
49,735 10,558
— 1,335 2,282
506 5,553 2,926
— 49,304
1,22,199
Total
51,819 15,616
— 6,650
26,881 721
8,575 27,001
— 98,933
2,36,196
Non-mech.
Total
21,355 4.788
— 912
2,804 72
1,624 999 248
51,382
84,184
Grand Total
73,174 20,404
— 7,562
29,685 793
10,199 28,000
248 1,50,315
3,20,380
Table 9. Estimated marine fish landings by mechanised and non-mechanised fishing crafts in Karnataka during the year 1985-'86 (in tonnes)
Name offish
Oil sardine Mackerel Bombay duck Croakers Perches Silver bellies Pomfrets Tunnies Penaeid prawns Non-penaeid prawns Others
Total
Mech. Trawl net
1 6
— 1,068 3,001 1,058
69 3
4,941 84
28,168
38,399
fishing Purse-seine
44,391 21,228
— 7
209 1,283
889 2,486
113 16
28,129
98,751
Mechanised
Power Drift/ Gill net
123 —
9 1
— 382 282
2 —
2,548
3,347
Propulsion Others
—
— — — — — — — — —
3
3
Total
44,392 21,357
— 1,084 3,211 2,341 1,340 2,771 5,056
100 58,848
1,40,500
Non-mech.
Total
1,250 3,213
— 624 172 313 542 175 60 —
7,528
13,877
Grand Total
45,642 24,570
— 1,708 3,383 2,654 1,882 2,946 5,116
100 66,376
1,54,377
12

Table 10. Estimated marine fish landings by mechanised and non-mechanised fishing crafts in Goa during the year 1985-'86 (in tonnes)
Name of fish Mech.
Trawl net
8
1,658 1,134
108 121
3,534
12,000
Mechanised
fishing Purse-seine
2,585 5,097
18 2
396 209 288
5,616
Power Drift/ Gill net
15 189
69 18
125 29
7
2,500
propulsion Hooks & Line
—
— 48 — — —
16
Total
2,600 5,294
1,745 1,202
629 359
3,829
30,132
Non-mech.
Total
257 359
506 205
74 • —
44
5,795
Grand Total
2,857 5,653
2,251 1,407
703 359
3,873
35,927
Oil sardine Mackerel Bombay duck Croakers Perches Pomfrets Tunnies Penaeid prawns Non-penaeid prawns Others
Total 28,563 14,211 2,952 64 45,790 7,024 53,030
Table 11. Estimated marine fish landings by mechanised and non-mechanised fishing crafts in Maharashtra during the year 1985-'86 (in tonnes)
Name of fish
Oil sardine Mackerel Bombay duck Croakeis Perches Pomfrets Tunnies Penaeid prawns Non-penaeid prawns Others
Total
Mech. Trawl net
46 596
1,022 14,957 3,863 1,333
756 36,425 4,687
68,193
1,31,878
fishing Purse-seine
369 190 —
546 — 39 — — — 60
1,204
Mechanised
Del net
54 —
61,225 8,204
287 3,830
— 18,909 45,475 34,505
1,72,489
Power propulsion Gill net
15 441
9 534 108
4,616 1,088
8 185
17,076
24,080
Hooks & Total Line
— — 48 12 2
— — —
581
643
484 1,227
62,256 24,289 4,270 9,820 1,844
55,342 50,347
1,20,415
3,30,294
Non-mech.
Total
1.375 366 329 ^97 172 328 274 282 305
5,380
9,308
Grand Total
1,859 1,593
62,585 24,786 4,442
10,148 2,118
55,624 50,652
1,25,795
3,39,602
13

TaWe 12. Estimated marine fish landings by mechanised and non-mechanised fishing crafts in Gujarat during the year
1985-'86 (in tonnes)
Name of fish
Oil sardine Mackerel Bombay duck Croakers Perches Pomfrets Tunnies Penaeid prawns Non-penaeid prawns
Others
Mech. fishing
trawl net
7 61
23,226 7,806
717 159
8,944 3,106
88,828
Dol net
—
22,108 2,572
— 269
— 1,109 2,657 8,966
Mechanised Power propulsion
Drift/
gill net
5 33
2,709 627
7,071 7,750
118 5
30,203
Hooks & line
—
—
64 — — —
80 —
251
Stake net
—
15 —
36 — — 38
86 109
Others
—
15 — —
14 —
8 — 13
Total
12 22,232 28,571 8,469 8,071 7,909
10,297 5,854
1,28,370
Non mech. Total
—
16.585 3.769 1.473 1.588
2 3,723 2,383
25,914
Grand Total
12 38,817 32,340 9,942 9,659 7,911
14,020 8,237
1,54,284
Total 1,32,854 37,681 48,521 395 284 50 2,19,785 55,437 2,75,222
Table 13. Composition of marine fish landings from mechanised boats at Visakhapatnamu Outer Harbour during 1985-'86
SI. No.
1
(figures in t
Name of fish
2
onnes)
Apr.-Jun. 1985 3
Jul.-Sep. 1985 4
Oct.-Dec. 1985 5
Jan.-Mar. 1986 6
Total
7
5. 6. 7.
8. 9.
10. 11. 12. 13. 14.
g)
Elasmobranchs Sharks i 3 _ i 5 Skates 2 3 7 6 18 Rays 15 21 14 16 66 Eels 12 18 29 29 88 Cat fish 5 24 16 21 66 Clupeids Wolf herring — 3 8 1 12 Oil sardine 1 11 — — 12 Other sardines 4 — — 76 80 Hilsa shad — — — — — Other shads — — — — — Anchovies Coilia — — — — — Setipinna — — — — — Stolephorus 4 27 35 13 79 Thrissina — — — — — Thryssa 14 32 8 2 56 Other clupeids 13 7 2 75 97 Bombay duck — — — — — Lizard fishes 59 151 178 105 493 Half beaks &
Full beaks — — — — — Flying fishes — — — — — Perches Rock cods — 1 — 1 2 Snappers — — — —• — Pig-face breams — — — — — Threadfin breams 257 69 106 434 866 Other perches 100 169 146 314 729 Goat fishes 113 182 192 175 662 Threadfins 4 19 28 17 68 Croakers 78 96 267 63 504 Ribbon fishes 24 141 242 23 430 Carangids Horse mackerel — — — — — Scads 9 _ _ 188 197
J 2 3 4 5 6 7 c) Leather-jackets — — — — — d) Other carangids 2 9 11 6 28
15. Silver bellies 80 90 97 87 354 16. Big-jawed jumper 1 15 16 3 35 17. Pomfrets
a) Black pomfret — 3 9 1 1 3 b) Silver pomfret 1 3 29 3 36 c) Chinese pomfret — — — — —
18. Mackerels a) Indian mackerel 1 — 2 29 32 b) Other mackerels — — — — —
19. Seer fishes a) S.commerson — — — — — b) S.guttatus — — 3 — 3 c) S.lineolatus — — — — — d) Acanthocybium sp. — — — — —
20. Tunnies a) E.affinis — — — — — b) Auxis spp. — — — — — c) K.pelamis — — — — — d) T.tonggol — — —• — — e) Other tunnies — — —• — —
21. Bill fishes _ _ _ _ _ _ 22. Barracudas 3 10 4 10 27 23. Mullets _ _ _ _ _ 24. Unicorn cod — — — — — 25. Flat fishes
a) Halibut 2 3 5 9 19 b) Flounders — — — — — c) Soles 20 19 8 12 59
26. Crustaceans a) Penaeid prawns 70 143 235 140 588 b) Non-penaeid prawns 4 12 2 — 18 c) Lobsters — — — — — d) Crabs 121 132 55 100 408 e) Stomatopods 20 29 19 25 93
27. Cephalopods 39 60 63 51 213 28. Miscellaneous II 13 15 21 60
Total 1,090 1,518 1,851 2,057 6,516
No. of operations of fishing units 7,142 8,110 5,662 5,305 26,219
14

Table 14. Composition of marine fish landings from mechanised boats at Kakinada Fisheries Harbour during 1985-'86 (figures in tonnes)
SI. No.
10. 11. 12. 13. 14.
15. 16. 17.
18.
19.
20.
21. 22. 23. 24. 25.
Name of fish Apr.-Jun. 1985
Jul.-Sept. 1985
Oct.-Dec. 1985
Jan.- Total Mar. 1986
Elasmobranchs a) Sharks — 1 8 9 18 b) Skates 3 10 15 26 54 c) Rays 26 96 68 91 281
Eels 23 39 17 47 126 Cat fishes 25 50 58 151 284 Clupeids
a) Wolf herring — 1 — — 1 b) Oil sardine — — — — — c) Other sardines 378 304 20 205 907 d) Hilsa shad — — — — — e) Other shads 8 8 — 7 23 f) Anchovies
Coilia — — 6 1 7 Setipinna — — — — — Stolephorus 178 232 173 313 896 Thrissina — — — — — Thryssa 68 139 78 144 429
g) Other clupeids 17 80 45 153 295 Bombay duck 2 104 18 — 124 Lizard fishes 44 212 187 187 630 Half beaks &
Full beaks — — — — — Flying fishes — — — — — Perches
a) Rock cods 1 5 1 1 8 b) Snappers 4 7 1 7 19 c) Pig-face breams — — — — — d) Threadfin breams 12 66 154 285 517 e) Other perches 330 314 203 697 1,544
Goat fishes 26 160 76 121 383 Threadfins 17 36 13 42 108 Croakers 203 292 220 378 1,093 Ribbon fishes 184 630 291 311 1,416 Carangids
a) Horse mackerel — — — — — b) Scads 117 7 26 724 874 c) Leather-jackets •— — — — — d) Other carangids 32 75 42 82 231
Silver bellies 617 356 217 476 1,666 Big-jawed jumper 4 14 4 2 24 Pomfrets
a) Black pomfret 11 4 — 1 16 b) Silver pomfret 1 1 1 3 6 21 c) Chinese pomfret — — — — —
Mackerels a) Indian mackerel 5 16 8 47 76 b) Other mackerels — — — — —
Seer fishes a) S.commerson 5 — — — 5 b) S. gut tat us _ ! _ — 1 c) S.lineolatus •— — — •— — d) Acanthocyhium spp. — — — — —
Tunnies a) E. affinis 24 — — — 24 b) Auxis spp. — — — — — c) K.pelamis — — — — — d) T.tonggol _ _ _ _ _ _ e) Other tunnies —- — — — —
Bill fishes _ _ _ _ — Barracudas 11 55 17 70 153 Mullets 12 1 — 1 14 Unicorn cod — — — — — Flat fishes
a) Halibut 5 7 7 8 27 b) Flounders 19 34 6 68 127 c) Soles 52 83 41 102 278
26.
27. 28.
Crustaceans a) Penaeid prawns b) Non-penaeid
prawns c) Lobsters d) Crabs e) Stomatopods
Cephalopods Miscellaneous
519 937 706 1,218 3,380
64
181 65 64 58
345 1
227 90 80 94
102
96 46 59 63
65 3
189 74 70 80
576 4
693 275 273 295
Total 3,415 5,224 3,095 6,462 18,196
No. of operations of fishing units 8,138 13,973 6,851 8,608 37,570
Table 15. Composition of marine Jish landings from mechanised boats at Pudumanikuppam during 1985-'86 (figures in tonnes)
SI. No.
1
Name of fish
2
Apr.-Jun. 1985
3
Jul.-Sep. 1985
4
Oct.-Dec. 1985
5
Jan.-Mar. 1986
6
Total
7
10. 11. 12. 13. 14.
15. 16. 17.
18.
Elasmobranchs a) Sharks 56 128 21 51 256 b) Skates 30 32 18 30 110 c) Rays 14 61 56 85 216
Eels 3 6 — 5 14 Cat fishes 29 37 — 55 121 Clupeids
a) Wolf herring 4 3 5 1 13 b) Oil sardine — — — — — c) Other sardines — — — — — d) Hilsa shad — — — — — e) Other shads — — — — — f) Anchovies
Coilia — — 1 — 1 Setipinna — — — — — Stolephorus 13 24 102 3 142 Thrissina — — —• — — Thryssa — — — — —
g) Other clupeids _ _ _ — — Bombav duck — •— — — — Lizard fishes 95 133 311 122 661 Half beaks &
Full beaks — _ ^ — — Flying fishes — — — — — Perches
a) Rock cods 20 21 23 29 93 b) Snappers 16 53 46 32 147 c) Pig-face breams 15 2 — 15 32 d) Threadfin breams 64 88 158 73 383 e) Other perches 70 78 91 91 330
Goat fishes 14 34 44 18 110 Threadfins 19 16 24 H 73 Croakers 14 22 83 11 130 Ribbon fishes 9 10 213 101 333 Carangids
a) Horse mackerel — — — — — b) Scads 38 28 — 40 106 c) Leather-jackets 3 — — 3 6 d) Other carangids 50 46 151 30 277
Silver bellies 124 190 276 157 747 Big-jawed jumper 2 14 — 4 20 Pomfrets
a) Black pomfret 7 9 30 3 49 b) Silver pomfret 2 3 1 3 9 c) Chinese pomfret — — — — —
Mackerels a) Indian mackerel — — — — — b) Other mackerels — — — — —
15

19.
20.
21. 22. 23. 24. 25.
26.
27. 28.
a) b) 0 d)
a) b) c) d) e)
a) b) c)
a) b)
0 d) e)
Seer fishes S.commerson 26 — 18 74 118 S.guttatus 64 113 247 54 487 S.Hneolatus — — — — — Acanthocybiwn sp. — — — — — Tunnies E.affinis 5 14 87 24 130 Auxis spp. — — — — — K.pelamis 9 — — — 9 T.tonggol — — — — — Other tunnies 8 40 47 54 149 Bill fishes 2 4 — 3 9 Barracudas 9 29 71 5 114 Mullets — — — — — Unicorn cod — — — — — Flat fishes Halibut — 1 28 2 31 Flounders 1 2 — — 3 Soles _ _ 9 _ 9 Crustaceans Penaeid prawns 71 153 105 105 434 Non-penaeid
prawns — — — — — Lobsters 4 3 9 3 19 Crabs 2 — 47 — 49 Stomatopods — — — — — Cephalopods 34 63 56 61 214 Miscellaneous 93 136 159 141 529
Total 1,039 1,596 2,537 1,502 6.674
No. of operations of fishing units 7,625 8,427 10,146 8,586 34,784
Table 16. Composition of marine fish landings from mechanised boats at Cuddalore Fisheries Harbour during 1985-'86 (figures in tonnes)
SI. No.
1
Name of fish
2
Apr.-Jun. 1985
3
July-Sep. 1985
4
Oct.-Dec. 1985
5
Jan.-Mar. 1986
6
Total
7
2. 3. 4.
g)
9.
10. 11. 12. 13.
a) b) c) d) e)
Elasmobranchs Sharks 27 8 — 48 83 Skates — — — — — Rays — — — — Eels _ _ _ _ _ Cat fishes — — — — Clupeids Wolf herring — — — — — Oil sardine — — — — — Other sardines — — — — — Hilsa shad — — — — — Other shads — — — — — Anchovies Coilia — — — — — Setipinna — — — — — Stokphorus — 71 _ 86 157 Thrissina — — — — — Thryssa — 18 23 2 43 Other clupeids 15 15 75 80 185 Bombay duck — — — — — Lizard fishes 245 227 67 138 677 Half beaks &
Full beaks — — — — — Flying fishes — — — — — Perches Rock cods — — — — — Snappers — — — — — Pig-face breams — — — — — Threadfin breams 226 256 37 52 571 Other perches 97 35 _ 58 190 Goat fishes 33 93 1 13 140 Threadfins — — — — — Croakers 61 75 217 118 471 Ribbon fishes 6 — 15 8 29
14.
15. 16. 17.
18.
19.
20.
21. 22. 23. 24. 25.
26,
Carangids a) Horse mackerel — — — — — b) Scads _ _ _ _ _ c) Leather-jackets 4 5 — — 9 d) Other carangids 21 5 1 — 27
Silver bellies 481 516 450 458 1,905 Big-jawed jumper — — — — — Pomfrets
a) Black pomfret — — — — — b) Silver pomfret — — — — — c) Chinese pomfret — — — — —
Mackerels a) Indian mackerel 1 — 1 — 2 b) Other mackerels — — — — —
Seer fishes a) S.commerson 21 25 5 3 54 b) S.guttatus — — — — — c) S.Hneolatus — — — — — d) Acanthocybium sp. — — — — —
Tunnies a) E.affinis 9 6 1 23 39 b) Auxis spp. — — — — — c) K.pelamis — — — — — d) T.tonggol — — — — — e) Other tunnies — — — — —
Bill fishes _ _ 2 4 6 Barracudas 13 — — 28 41 Mullets — — — — — Unicorn cod — — — — — Flat fishes
a) Halibut _ _ _ _ _ b) Flounders — — — — — c) Soles 1 16 20 9 46
a) Penaeid prawns 105 166 194 188 653 b) Non-penaeid prawns — — — — — c) Lobsters — — — — — d) Crabs 12 190 530 172 904 e) Stomatopods — 12 — — 12
27. 28.
Cephalopods Miscellaneous
Total
No. of operations of fishing units
26 10
1,414
4,041
20 9
1,768
4,952
3 4
1.646
5,638
16 1
1,505
4,798
65 24
6,333
19,429
Table 17. Composition of marine fish landings from mechanised boats at Nagapattinam during 19i5-'B6 (figures in tonnes)
Name of fish Apr.- Jul.- Oct.- Jan.- Total Jun. Sep. Dec. Mar. 1985 1985 1985 1986
Elasmobranchs a) Sharks b) Skates c) Rays
Eels Cat fishes Clupeids
a) Wolf herring b) Oil sardine c) Other sardines d) Hilsa shad e) Other shads f) Anchovies
Coilia Setipinna Stolephorus Thrissina Thryssa
g) Other clupeids Bombay duck Lizard fishes
1 10 — 16
141 26 16
91 179 3 5 3 49
1 — 1 22
70 481 6 40 6 74
— 4 — 1 — 24
47
550
72 27
4
447
25 80
130
87
99 44
28
467
37 48
209
1,551
233 199
75 139 59 48 321
16

7. Half beaks & Full beaks — — — — —
8. Flying fishes — — — — — 9. Perches — — — —
a) Rock cods — — — 20 20 b) Snappers — — — 5 5 c) Pig-face breams — — — — — d) Threadfin breams 479 159 303 87 1,028 e) Other perches 246 134 127 32 539
10. Goat fishes 27 12 6 18 63 U. Threadfins _ i _ _ i 12. Croakers 342 76 384 66 868 13. Ribbon fishes 17 — 29 12 58 14. Carangids
a) Horse mackerel — 1 — 1 2 b) Scads _ _ _ _ _ _ c) Leather-jackets — — — — — d) Other carangids 101 45 87 14 247
15. Silver bellies 532 317 593 576 2,018 16. Big-jawed jumper — — — — — 17. Pomfrets
a) Black pomfret — — -— 10 10 b) Silver pomfret — 1 4 — 5 c) Chinese pomfret — — — — —
18. Mackerels a) Indian mackerel 5 19 2 1 27 b) Other mackerels — — — — —
19. Seer fishes a) S.commerson 4 — 4 7 15 b) S. gut tat us — — — — — c) S. lineolatus — — — — — d) Acanthocybium sp. — — — — —
20. Tunnies a) E.affinis — — — — — b) Auxis spp. — — — — — c) K.pelamis — — — — — d) T.tonggol — — — — — e) Other tunnies — — — — —
21. Bill fishes _ _ _ i i 22. Barracudas 47 4 23 5 79 23. Mullets _ _ _ _ _ 24. Unicorn cod — — — — — 25. Flat fishes
a) Halibut 75 — 43 _ 118 b) Flounders — — — — — c) Soles 59 43 71 11 184
26. Crustaceans a) Penaeid prawns 375 181 293 141 990 b) Non-penaeid prawns 12 — — 78 90 c) Lobsters 3 19 5 12 39 d) Crabs 172 14 321 7 514 e) Stomatopods 33 — — — 33
27. Cephalopods 29 33 9 20 91 28. Miscellaneous 141 227 104 111 583
Total 3,659 2,090 3,082 1,950 10,781
No. of operations of fishing units 8,087 11,094 8,327 9,417 36,925
Table 18. Composition of marine fish landings from mechanised boats at Mandapam during 1985-'86 (figures in tonnes)
SI. No.
1
Name of fish
2
Apr.-Jun. 1985
3
Jul.-Sep. 1985
4
Oct.-Dec. 1985
5
Jan.-Mar. 1986
6
Total
7
1.
2. 3.
Elasmobrs a) Sharks b) Skates c) Rays
Eels Cat fishes
53
9
6 — 151 100
17
46
2
6 350
4. Clupeids a) Wolf herring — — — — — b) Oil sardine — — — — — c) Other sardines 40 21 25 36 122 d) Hilsa shad — — — — — e) Other shads 10 — — — 10 f) Anchovies
Coilia — — — — — Setipinna — — — — — Stolephorus — — — — — Thrissina — — — — — Thryssa 1 3 2 12 18
g) Other clupeids 5 5 8 16 34 5. Bombay duck — — — — — 6. Lizard fishes — 2 5 — 7 7. Half beaks &
Full beaks — — — — — 8. Flying fishes — — — — — 9. Perches
a) Rock cods — — — — — b) Snappers — — — — — c) Pig-face breams — — 2 2 4 d Threadfin breams — — — — — e) Other perches 52 75 47 33 207
10. Goat fishes 66 75 34 11 186 11. Threadfins — 4 1 — 5 12. Croackers 91 120 86 61 358 13. Ribbon fishes — — — — — 14. Carangids
a) Horse mackerel — — — — — b) Scads — — — — — c) Leather-jackets — — — 4 4 d) Other carangids 18 36 14 8 76
15. Silver bellies 747 683 453 507 2,390 16. Big-jawed jumper — — _ _ _ 17. Pomfrets
a) Black pomfret 1 — — — 1 b) Silver pomfret 1 — 1 — 2 c) Chinese pomfret — — — — —
18. Mackerels a) Indian mackerel — — — — — b) Other mackerels — — — — —
19. Seer fishes a) S.commerson — — — — — b) S. gut tat us — — _ _ — c) S. lineolatus — — — — — d) Acanthocybium sp. — — — — —
20. Tunnies a) E.affinis — — — — — b) Auxis spp. — — — — — c) K.pelamis — — — — — d) T.tonggol _ _ _ _ — e) Other tunnies — — — — —
21. Bill fishes _ _ _ _ — 22. Barracudas — — — — — 23. Mullets _ _ — — — 24. Unicorn cod — — — — — 25. Flat fishes
a) Halibut _ _ _ _ — b) Flounders — — — — ~ c) Soles 8 10 13 16 47
26. Crustaceans „ , , a) Penaeid prawns 200 294 282 170 946 b) Non-penaeid prawns — — — — — c) Lobsters — — — — „rr d) Crabs 57 54 60 29 200 e) Stomatopods 4 — — ZZ ~A
27. Cephalopods 104 75 36 13 228 28. Miscellaneous 902 675 504 287 2,368
Total 2,369 2,306 1,674 1,253 7,602
29
No.of operations „ _ ,^ ,„_ of fishing units 14,790 16,176 13.184 10,537 54,687
17

Table 19. Composition of marine fish landings from mechanised boats at Rameswaram Verkottil during 1985-'86 (figures in tonnes)
SI. No.
1
Name of fish
2
Apr.-Jun. 1985
3
Jul.-Sep. 1985
4
Oct.-Dec. 1985
5
Jan.-Mar. 1986
6
Total
7
10. 11. 12. 13. 14.
15. 16. 17.
18.
19,
20.
21. 22. 23. 24. 25.
Elasmobranchs a) Sharks — — — —• — b) Skates c) Rays 417 367 517 526 1,827
Eels _ _ _ _ _ Cat fishes 50 16 45 55 166 Clupeids
a) Wolf herring — — — — — b) Oil sardine — — — — — c) Other sardines 224 143 103 91 561 d) Hilsa shad — — — — e) Other shads 32 30 14 5 81 f) Anchovies
Coilia — — — — — Setipinna — — — — — Stolephorus — — — — — Thrissina — — — — — Thryssa — 2 — — 2
g) Other clupeids 13 — — 123 136 Bombay duck — — — — Lizard fishes 6 24 57 24 111 Half beaks &
Full beaks — — — — — Flying fishes — — — — — Perches
a) Rock cods — — — 1 1 b) Snappers — — — — — c) Pig-face breams — — — — — d) Threadfin breams — — — — — e) Other perches 159 161 202 82 604
Goat fishes 103 115 111 50 379 Threadfins — 4 5 — 9 Croakers 236 192 309 181 918 Ribbon fishes — — — -— — Carangids
a) Horse mackerel — — — — — b) Scads — — — — — c) Leather-jackets — — — — — d) Other carangids 41 20 59 45 165
Silver bellies 4,694 2,005 2,686 1,868 11,253 Big-jawed jumper — — — — — Pomfrets
a) Black pomfret — — — — — b) Silver pomfret 1 — — 17 18 c) Chinese pomfret — — — — —
Mackerels a) Indian mackerel 4 3 7 — 14 b) Other mackerels — — — — —
Seer fiishes a) S.commerson — — 1 3 4 b) S.guttatus — — — — — c) S.lineolatus — — — — — d) Acanthocybium sp. — — — — —
Tunnies a) E.affnis — — — — — b) Auxis spp. — — — — — c) K.pelamis — — — — — d) T.tonggol _ _ _ _ _ e) Other tunnies — — — — —
Bill fishes — — — — — Barracudas — — — — — Mullets — — — — — Unicorn cod — — — — — Flat fishes
a) Halibut _ _ _ _ _ b) Flounders — — — — — c) Soles 26 22 44 28 120
26.
27. 28.
Crustaceans a) Penaeid prawns b) Non-pcnaeid prawns c) Lobsters d) Crabs e) Stomatopods
Cephalopods Miscellaneous
411
112 36 81
138
500
92 36 54
169
735
93 50 79
303
517
48 28 40
148
2,163
345 150 254 758
Total 6.784 3,956 5,422 3,877 20,039 No. of operations of fishing units 18,547 17,852 19,461 11,088 66,948
Table 20. Composition of marine fish landings from mechanised boats at Tuticorin Fisheries Harbour during 1985-'86 (figures in tonnes)
SI. No.
1
Name of fish
2
Apr.-Jun. 1985
3
Jul.-Sep. 1985
4
Oct. Dec. 1985
5
Jan.- Total Mar. 1986
6 7
1. Elasmobranchs a) Sharks b) Skates c) Rays
2. Eels 3. Cat fishes 4. Clupeids
a) Wolf herring b) Oil sardine c) Other sardines d) Hilsa shad e) Other shads f) Anchovies
Coilia Setipinna Stolephorus Thrissina Thryssa
g) Other clupeids 5. Bombay duck 6. Lizard fishes 7. Half beaks &
Full beaks 8. Flying fishes 9. Perches
a) Rock cods b) Snappers c) Pig-face breams d) Threadfin breams e) Other perches
10. Goat fishes 11. Threadfins 12. Croakers 13. Ribbon fishes 14. Carangids
a) Horse mackerel b) Scads c) Leather-jackets d) Other carangids
15. Silver bellies 16. Big-jawed jumper 17. Pomfrets
a) Black pomfret b) Silver pomfret c) Chinese pomfret
18. Mackerels a) Indian mackerel b) Other mackerels
19. Seer fishes a) S.commerson
— — —
—
—
4
20
645 75
11
— — 6
24 21 26 —
259
8 75
1,385
—
— .—
1
—
—-
—
430
613 —
49
— 47 31
321 11 43 — 249
— 319
3,202
7
1 — 2
3
2
—
.—
752 12
27
— — —
100 — 78 2
160
— 561 623
8
— — 2
5
—
—
10
202 8
—
32 —
144 81 3
29 — 76
— 268
1,517
—
1 —
5
8
2
4
460
2,212 95
87
32 47
181 526 35
176 2
744
8 1,223 6,727
15
18

20.
21. 22. 23. 24. 25.
b) 0 d)
a) b) 0 d) e)
26.
27. 28. 29.
a) b) c)
a) b) 0 d) e)
S. gut tat us — — — — — S.lineolatus — — — — — Acanthocybium sp. — — — — — Tunnies E.affinis — — — — — Auxis spp. — — — — — K.pelamis — — — — — T.tonggol — — — — — Other tunnies — — — — — Bill fishes — — — — — Barracudas 10 50 1 37 98 Mullets — — — — — Unicorn cod — — — — — Flat fishes Halibut 4 14 _ _ 18 Flounders — — — — — Soles — 4 4 1 9
Penaeid prawns 622 708 326 188 1,844 Non-penaeid prawns — — — — — Lobsters — — — — — Crabs 6 27 — — 33 Stomatopods — — — — — Cephalopods 8 130 15 4 157 Marine turtles Miscellaneous 304 — 449 — 753
Total 3,513 6,256 3,126 2,607 15,502
No. of operations of fishing units 12,899 16,792 9,898 8,412 48,000
Table 21. Composition of marine fish landings from mechanised boats at Sakthikulangara during 1985- '86 (figures in tonnes)
SI. No.
1
Name of fish
2
Apr.-Jun. 1985
3
Jul.-Sep. 1985
4
Oct.-Nov. 1985
5
Jan.-Mar. 1986
6
Total
7
1. Elasmohrarch a) Sharks 109 251 35 29 424 b) Skates _ _ _ _ _ _ c) Rays HI 12 37 203 363
2. Eels _ __ ^. Cat fishes 266 524 193 4 987 4. Clupeids
a) Wolf herring _ i _ _ 1 b) Oil sardine 55 — — — 55 c) Other sardines — — — — — d) Hilsa shad — — — — — e) Other shads — — — — — f) Anchovies
Coilia — — — — — Setipinna — — — — — Stolephorus 135 7 463 170 775 Thrissina — — — — — Thryssa — — — — —
g) Other clupeids — — 7 — 7 5. Bombay duck — — — — — 6. Lizard fishes 1,992 2,120 754 344 5,210 7. Half beaks &
Full beaks — — — — — 8. Flying fishes — — — — — 9. Perches
a) Rock cods — — 1 — 1 b) Snappers — — — — — c) Pig-face breams — — — — — d) Threadfin breams 1,535 16,853 622 926 19,936 e) Other perches 33 118 7 621 779
10. 11. 12. 13. 14.
15. 16. 17.
18.
19.
20.
21. 22. 23. 24. 25.
26.
27. 28.
Goat fishes — — — — — Threadfins — — — — — Croakers 1,361 1,088 277 234 2,960 Ribbon fishes — 171 164 46 381 Carangids
a) Horse mackerel — — — — — b) Scads 331 198 298 — 827 c) Leather-jackets 12 — 5 1 18 d) Other carangids 53 109 215 1 378
Silver bellies 497 41 242 202 982 Big-jawed jumper — 25 4 — 29 Pomfrets
a) Black pomfret 12 19 10 — 41 b) Silver pomfret — 2 — — 2 c) Chinese pomfret — — — — —
Mackerels a) Indian mackerel 34 63 32 — 129 b) Other mackerels — — — — —
Seer fishes a) S.commerson 54 109 66 4 233 b) S.guttatus — — — — — c) S.lineolatus — — — — — d) Acanthocybium sp. — — — — —
Tunnies a) E.affinis 259 197 118 2 576 b) Auxis spp. — 3 — — 3 c) K.pelamis — — — — — d) T.tonggol _ _ _ _ _ e) Other tunnies — 1 — — 1
Bill fishes 8 23 6 — 37 Barracudas 20 72 104 — 196 Mullets — — — — — Unicorn cod — — — — — Flat fishes
a) Halibut — 7 — — 7 b) Flounders — 1 — — 1 c) Soles 1,315 2,433 171 173 4,092
a) Penaeid prawns 4,060 4,990 437 583 10,070 0) iNon-penaeia pra c) Lobsters d) Crabs e) Stomatopods
Cephalopods Miscellaneous
wns — 1 6
250 947
1,261
15 7
74 1,510
332
3 25
601 1.704
849
1 53
429 193 638
20 91
1,354 4,354 3,080
Total 14,717 31,376 7,450 4,857 58,400
No. of operations of fishing units 38,129 48,956 30,502 18,517 1,36,104
Table 22. Composition of marine fish landings from mechanised boats at Cochin Fisheries Harbour during 1985-'86 (figures in tonnes)
SI. Name of fish No.
1 2
1. Elasmobranchs a) Sharks b) Skates c) Rays
2. Eels 3. Cat fishes 4. Clupeids
a) Wolf herring b) Oil sardine c) Other sardines d) Hilsa shad e) Other shads f) Anchovies
Apr.-Jun. 1985
3
76
3 1
420
— 878 —
—
Jul.-Sep. 1985
4
140
23 — 398
1 —
1
—
Oct.-Dec. 1985
5
41
14 — 89
4 1,023
199
—
Jan.-Mar. 1986
6
24
32 1
10
5 147 —
—
Total
7
281
72 2
917
10 2,048
200
—
19

Coilia — — — — — Setipinna — — — — — Stolephoriis 64 1 84 98 247 Thrissina — — — — — Thryssa 8 2 50 119 179
g) Other clupeids — 5 3 3 11 Bombay duck — — — — — Lizard fishes 120 72 2 35 229 Half beaks &
Full beaks 3 2 4 1 10 Flying fishes — — — — — Perches
a) Rock cods — 1 6 109 116 b) Snappers — — 2 22 24 c) Pig-face breams — — — — — d) Threadfin breams 877 854 — 329 2,060 e) Other perches 149 3 1 108 261
Goat fishes 2 19 — 10 31 Threadfins — — — — — Croakers 244 45 142 205 636 Ribbon fishes 18 4 21 — 43 Carangids
a) Horse mackerel — — 2 — 2 b) Scads 30 i _ _ 31 c) Leather-jackets 11 33 1 1 46 d) Other carangids 128 55 69 65 317
Silver bellies 26 — 4 41 71 Big-jawed jumper 26 — 9 2 37 Pomfrets
a) Black pomfret 11 64 20 6 101 b) Silver pomfret — — — — — c) Chinese pomfret — — — — —
NlQckcrcIs a) Indian mackerel 276 2,647 1,774 26 4,723 b) Other mackerels — — — —
Seer fishes a) S.commerson 66 209 241 25 541 b) S.guttatus — 6 — — 6 c) S.lineolatus — — — — — d) Acanthocybium sp. — — — — —
Tunnies a) E.affinis 476 27 381 31 915 b) Auxis spp. 97 396 92 17 602 c) K.pelamis •—• — — — — d) T.tonggol 29 n I 2 49 e) Other tunnies 2 1 — 1 4
Bill fishes 6 5 3 — 14 Barracudas 16 7 8 65 96 Mullets — — — — — Unicorn cod — — — — — Flat fishes
a) Halibut 5 _ _ _ 5 b) Flounders — — — — — c) Soles 96 56 8 28 188
Crustaceans a) Penaeid prawns 580 68 201 599 1,448 b) Non-penaeid prawns — — — — — c) Lobsters 1 1 — — 2 d) Crabs 12 1 7 72 92 e) Stomatopods 83 1 71 158 313
Cephalopods 88 19 13 94 214 Miscellaneous 29 2 11 23 65
Table 23, Composition of marine fish landings from mechanised boats at Mangalore during 1985-'86 (figures in tonnes)
10. 11. 12. 13. 14.
15. 16. 17,
18.
19.
20.
21. 22. 23. 24. 25,
26,
27, 28,
SI. No.
1
Name of fish
2
Apr.-Jun. 1985
3
Jul.-Sep. 1985
4
Oct.-Dec. 1985
5
Jan.-Mar. 1986
6
Total
7
Total 4,957 5,187 4,601 2,514 17,259
No. of operations of fishing units 18,100 10,309 9,478 15,195 53,082
1. Elasmobranchs a) Sharks 10 2 57 40 109 b) Skates _ _ _ _ _ _ c) Rays — — 39 52 91
2. Eels _ _ _ 6 6 3. Cat fishes 17 282 69 711 1,079 4. Clupeids
a) Wolf herring — — 8 10 18 b) Oil sardine 346 1,660 7,909 4,039 13,954 c) Other sardines 6 — 834 169 1,009 d) Hilsa shad — — — — — e) Other shads — — — — — f) Anchovies
Coilia — — — — — Setipinna — — — — Stolephorus 2 — 1,044 428 1,474 Thrissina — — •— — — Thryssa 15 100 10 4 129
g) Other clupeids _ _ _ 3 3 5. Bombay duck •— — — — — 6. Lizard fishes 7 9 — 2 252 333 7. Half beaks &
Full beaks — — — — — 8. Flying fishes — — — — — 9. Perches
a) Rock cods — — 8 — 8 b) Snappers — — 33 — 33 c) Pig-face breams — — — — —
. d) Threadfin breams 176 — 87 1,028 1,291 e) Other perches 83 — 68 545 696
10. Goat fishes — — — — — 11. Threadfins — — — 2 2 12. Croakers 110 — 95 215 420 13. Ribbon fishes 161 3 444 331 939 14. Carangids — — — — —
a) Horse mackerel — 3 199 1 203 b) Scads _ _ 205 1 206 c) Leather-jackets — — 13 — 13 d) Other carangids 8 16 516 136 676
15. Silver bellies 6 32 — 11 49 16. Big-jawed jumper 1 — 141 240 382 17. Pomfrets
a) Black pomfret 1 — 20 26 47 b) Silver pomfret — — 2 6 8 c) Chinese pomfret — — — •— —
18 I^Qclccrcls ' a) Indian mackerel 27 3,932 5,928 152 10,039
b) Other mackerels — — — — — 19. Seer fishes
a) S.commerson 3 1 103 21 128 b) S.guttatus — — — — .— c) S.lineolatus — — — — — d) Acanthocybium sp. — — — — —
20. Tunnies a) E.affinis — — 27 — 27 b) Auxis spp. — — — — — c) K.pelamis — — — — — d) T.tonggol _ _ 641 2 643 e) Other tunnies — — — — —
21. Bill fishes _ _ 7 _ 7 22. Barracudas — — 11 29 40 23. Mullets — — — 1 1 24. Unicorn cod — — — — — 25. Flat fishes
a) Halibut 15 _ 3 4 22 b) Flounders — — — — — c) Soles 164 — 132 524 820
20

1
26. Crustaceans a) Penaeid prawns 283 b) Non-penaeid prawns — c) Lobsters — d) Crabs 32 e) Stomatopods 166
27. Cephalopods 32 28. Miscellaneous 98
19. 116 941 1,340 84 — 84
79 546 657 416 2,410 2,992 78 620 730 176 545 819
Total 1,841 6,031 19,604 14,051 41,527
No. of operations of fishing units 7,532 880 11,936 29,31149,659
Table 24. Composition of marine fish landings from mechanised boats at New Ferry Wharf Bombay during 1985-'86 (figures in tonnes)
SI. No.
1
Name of fish
2
Apr.-Jun. 1985
3
Jul.-Sep. 1985
4
Oct.-Dec. 1985
5
Jan.- Total Mar. 1986
6 7
1. Elasmobranchs a) Sharks b) Skates c) Rays
2. Eels 3. Cat fishes 4. Clupeids
a) Wolf herring b) Oil sardine c) Other sardines d) Hilsa shad e) Other shads f) Anchovies
Coilia Setipinna Stofephorus Thrissina Thryssa
g) Other clupeids 5. Bombay duck 6. Lizard fishes 7. Half beaks &
Full beaks Flying fishes Perches
a) Rock cods b) Snappers c) Pig-face breams d) Threadfin breams e) Other perches
Goat fishes Threadfins Croakers Ribbon fishes Carangids
a) Horse mackerel b) Scads c) Leather-jackets d) Other carangids
Silver bellies Big-jawed jumper Pomfrets
a) Black pomfret b) Silver pomfret c) Chinese pomfret
Mackerels a) Indian mackerel b) Other mackerels
128 144 216 232 145
161 304 342
417 860 870
804 1,510 325 1,633 636 2,064
133 1,013 1,404 2,782 182 490 851 1,668
64
7 230
9
54
1 5
105
—
73
21 840
—
193
1 8
1,101
—
384
2 41
2,276
9
9.
10. 11. 12. 13. 14.
15. 16. 17.
18.
4 22
121 118
8 — 50 175
160 320 53 143
130 142 258 505 357 958 166 480
—
31 19
—
—
—
35 84
3
6
3
72 103
273 38 26 14
693 236
5 21
48 3
150 220
88 155 38 309
586 2,007 272 527
15 21
21
6 197
176 44
408 242
2,114 1,036
22 387
647 305 677 603
5,400 2,071
30
48 626
20.
21. 22. 23. 24. 25.
a) b) c) d)
a) b) 0 d) e)
26.
27. 28.
a) b) c)
a) b) c) d) e)
Seer fishes S.commerson 21 104 92 — 217 S.guttatiis 6 — — 103 109 S.lineolatiis — — — — — Acanthocybium sp. — — — — — Tunnies E.affinis 15 150 411 78 654 Auxis spp. — — — — — K.pelamis — — — — — T.tonggol — — — — — Other tunnies — — — — — Bill fishes 9 — 3 10 22 Barracudas — — — 14 14 Mullets — — — — — Unicorn cod — — 2 1 3 Flat fishes Halibut 15 7 154 88 264 Flounders — — — — — Soles 60 68 131 357 616
Penaeid prawns 1,177 2,246 2,826 3,155 9,404 Non-penaeid prawns 195 122 261 938 1,516 Lobsters 38 34 208 100 380 Crabs 26 17 37 21 101 Stomatopods — — — — — Cephalopods 285 159 4,763 929 6,136 Miscellaneous 167 269 512 287 1,235
Total 4,885 5,882 18,539 17,306 46,612
No. of operations of fishing units 4,248 4,766 9,691 8,958 27,663
Table 25. Composition of marine fish landings from mechanised boats at Sassoon Dock, Bombay during 1985-'86 (figures in tonnes)
SI. No.
1
Name of fish
2
Apr.-Jun. 1985
3
Jul.-Sep. 1985
4
Oct.-Dec. 1985
5
Jan.- Total Mar. 1986
6 7
1.
2. 3. 4.
5. 6.
g)
19
11 42
1
—
61
4 5
7
164
2 23
17
366
76 104
—
610
93 174
1
24
1.
8. 9.
Elasmobranchs Sharks Skates Rays Eels Cat fishes Clupeids Wolf herring Oil sardine Other sardines Hilsa shad Other shads Anchovies Coilia Setipinna Stolephorus Thrissina Thryssa Other clupeids Bombay duck Lizard fishes Half beaks &
Full beaks Flying fishes Perches Rock cods Snappers Pig-face breams Threadfin breams Other perches
211 31 51 57
255
443 70
118
385
477 68
128 35
451
408 1.539 60 229 90 387 26 118
724 1,815
74
—
12
111
—
102
—
24
160
—
163
1
31
118
1
137
3
45
117
13
476
4
112
506
14
102 69
213 142
136 115 464 160
83 113 60
265
51 372 102 399 26 763
156 723
22 5
— 75 — 14
35 25
132 44
468 37
283 60
392 7
521 1.664 113 217
21

10. 11. 12. 13. 14.
15. 16. 17.
18.
19.
20.
21. 22. 23. 24. 25.
26.
27. 28.
Goat fishes 146 7 136 29 318 Threadfins 28 60 37 95 220 Croalcers 516 683 1,018 857 3,074 Ribbon fishes 336 438 585 433 1,792 Carangids
a) Horse maclterel 3 42 40 61 146 b) Scads _ _ _ _ _ c) Leather-jaclcets — 27 43 11 81 d) Other carangids 45 31 48 112 236
Silver bellies — — — — Big-jawed jumper 44 58 52 71 225 Ponifrets
a) Black pomfret 54 51 65 35 205 b) Silver pomfret 70 125 174 170 539 c) Chinese pomfret — — — — —
Mackerels a) Indian mackerel — — 8 — 8 b) Other mackerels — — — — —
Seer fishes a) S.commerson 9 112 236 36 393 b) S.guttatus 61 120 205 127 513 c) S.lineolatus — — — — — d) Acanthocybium sp. — — — — —
Tunnies a) E.affinis 36 97 79 81 293 b) Auxis spp. — — — •— — c) K.pelamis — — — — — d) T.tonggol — — — — — c) Other tunnies — — — — —
Bill fishes 55 10 31 67 163 Barracudas — — 9 6 15 Mullets — •— — — — Unicorn cod — — — 3 3 Flat fishes
a) Halibut 13 — 79 17 109 b) Flounders — — — — — c) Soles 102 173 46 89 410
a) Penaeid prawns 1,444 5,499 3,853 2,839 13,635 b) Non-penaeid prawns 549 288 281 309 1,427 c) Lobsters 52 82 90 117 341 d) Crabs 13 26 14 47 100 e) Stomatopods — — — — —
Cephalopods 419 56 3,597 1,209 5,281 Miscellaneous 134 184 361 169 848
Total
No. of operations of fishing units
5,989 10,689 13,569 9,642 39,889
9,737 13,045 11,574 10,461 44,817
Table 26. Composition of marine fish landings from mechanised boats at Veraval during 1985-'86 (figures in tonnes)
SI. No.
1
Name of fish
2
Apr.-Jun. 1985
3
Jul.-Sep. 1985
4
Oct.-Dec. 1985
5
Jan.-Mar. 1986
6
Total
7
Elasmobranchs a) Sharks b) Skates c) Rays
Eels Cat fishes Clupeids
a) Wolf herring b) Oil sardine c) Other sardines d) Hilsa shad
231 4
26 31
103
102
27
12
15
51
686 212
70 1,209
582
332 1,276 143 359 795 903 544 1,784 373 1,073
456 272 881
10. 11. 12. 13. 14.
15. 16. 17.
18,
19.
20.
21. 22. 23. 24. 25.
26.
27 28
e) Other shads 118 44 444 193 799 f) Anchovies
Coilia 12 — 78 350 440 Setipinna — — — — — Stolephorus — — — — •— Thrissina — — — — — Thryssa 23 1 4,763 431 5,218
g) Other clupeids 149 14 1,158 147 1,468 Bombay duck 2 — 5 31 38 Lizard fishes 36 — 190 98 324 Half beaks &
Full beaks 2 — 6 5 13 Flying fishes — — — — — Perches
a) Rock cods 26 — 88 32 146 b) Snappers 8 — 425 32 465 c) Pig-face breams — •— 9 18 27 d) Threadfin breams 124 — 756 850 1,730 e) Other perches 56 — 599 354 1,009
Goat fishes 1 — 197 1 199 Threadfins 33 — 295 101 429 Croakers 765 1 4,519 3,551 8,836 Ribbon fishes 1,252 9 2,900 3,648 7,809 Carangids
a) Horse mackerel 15 97 99 79 290 b) Scads 5 — 3 15 23 c) Leather-jackets 5 2 15 75 97 d) Other carangids 33 2 421 57 513
Silver bellies 12 — 39 625 676 Big-jawed jumper 40 — 5,089 — 5,129 Pomfrets
a) Black pomfret 9 45 39 69 162 b) Silver pomfret 66 234 120 42 462 c) Chinese pomfret — — —• — —
Mackerels a) Indian mackerel 1 — 6 — 7 b) Other mackerels — — — —
Seer fishes a) S.commerson 44 103 731 208 1,086 b) S.guttatus — — — — — c) S.lineolatus — — — — — d) Acanthocybium sp. — — — — —
Tunnies a) E.affinis 81 23 92 — 196 b) Auxis spp. — — — — c) K.pelamis — — — — — d) T. tonggol — — — — — e) Other tunnies 24 1 34 — 59
Bill fishes _ _ _ _ _ Barracudas — — 30 8 38 Mullets — — — — — Unicorn cod — — — — — Flat fishes
a) Halibut 16 — 140 44 200 b) Flounders — — — — — c) Soles 137 — 198 299 634
Crustaceans a) Penaeid prawns 261 b) Non-penaeid prawns 372 c) Lobsters 6 d) Crabs 289 e) Stomatopods 88
Cephalopods 144 Miscellaneous 267
1,687 48
225 105 21
1,561 1,386
1,677 410 53
441 132 875 474
3,625 830 284 835 241
2,850 2.127
Total 5,026 688 31,736 17,884 55,334
No. of operations, of fishing units 12,482 3,821 21,070 24,708 62,081
7 — — 14
22

Table 27. Composition of marine fish landings from mechanised boats at Visakhapatnam Outer Harbour and Kakinada Fisheries Harbour during 1985-'86 (figures in tonnes)
SI. No.
1
1.
2. 3. 4.
5. 6. 7.
8. 9.
10. 11. 12. 13. 14.
15. 16.
Name of fish
2
Elasmobranchs a) Sharks b) Skates c) Rays
Eels Cat fishes Clupeids
a) Wolf herring b) Oil sardine c) Other sardines d) Hilsa shad e) Other shads f) Anchovies
Coilia Setipinna Stolephorus Thrissina Thryssa
g) Other clupeids Bombay duck Lizard fishes Half beaks &
Full beaks Flying fishes Perches
a) Rock cods b) Snappers c) Pig-face breams d) Threadfin breams e) Other perches
Goat fishes Threadfins Croakers Ribbon fishes Carangids
a) Horse mackerel b) Scads c) Leather-jackets d) Other carangids
Silver bellies Big-jawed jumper
Visakhapatnam Outer Harbour
3
5 18 66 88 66
12 12 80
—•
—
79
56 97
• — •
493
— —
2 — —
866 729 662 68
504 430
— 197 — 28
354 35
Kakinada Fisheries Harbour
4
18 54
281 126 284
1 —
907
23
7
896
429 295 124 630
— —
8 19 —
517 1,544
383 108
1,093 1,416
— 874 —
231 1,666
24
21. 22. 23. 24. 25.
26.
13 36
32
17. Pomfrets a) Black pomfret b) Silver pomfret c) Chinese pomfret
18. Mackerels a) Indian mackerel b) Other mackerels
19. Seer fishes a) S. commerson b) S.guttatus c) S. lineolatus d) Acanthocybium spp.
20. Tunnies a) E. affiinis b) Auxis spp. c) K.pelamis d) T.tonggol e) Other tunnies
Bill fishes Barracudas Mullets Unicorn cod Flat fishes
a) Halibut b) Flounders c) Soles
Crustaceans a) Penaeid prawns b) Non-penaeid prawns c) Lobsters d) Crabs e) Stomatopods
27. c) Cephalopods 28. Miscellaneous
27
19
59
588 18
408 93
213 60
Total 6,516 No. of operations of fishing units 26,219
16 21
76
24
153 14
27 127 278
3,380 576
4 693 275 273 295
18,196
37,570
Table 28. Composition of marine fish landings from mechanised boats at Pudumanikuppam, Mandapam and Rameswaram Verkottil during 1985-'86 (Figures in tonnes)
SI. Name of fish Pudu- Manda- Rames-No. mani- pam waram
kuppam Trawl Trawl Trawl net net net
1 2 3 4 5~ 1. Elasmobranchs
a) Sharks 256 b) Skates 110
23

2. 3. 4.
5. 6. 7.
8. 9.
10. 11. 12. 13. 14.
c)
a) b) c) d) e) f)
g)
a) b) c) d) e)
a) b) c) d)
15. 16.
Rays Eels Cat fishes Clupeids Wolf herring Oil sardine Other sardines Hilsa shad Other shads Anchovies Coilia Setipinna Stolephoms Thrissina Thryssa Other clupeids Bombay duck Lizard fishes Half beaks &
Full beaks Flying fishes Perches Rock cods Snappers Pig-face breams Threadfin breams Other perches Goat fishes Threadfins Croakers Ribbon fishes Carangids Horse mackerel Scads
Leather-jackets Other carangids Silver belHes Big-jawed jumper
216 14
121
13
1
142
661
93 147 32
383 330 110 73
130 333
106 6
277 747
20
350
29
122
10
18 34
207 186
5 358
4 76
2,390
1,827
166
561
81
2 136
111
604 379
9 918
165 11,253
1
17.
18.
19.
20.
21. 22. 23. 24. 25.
26.
27. 28.
2
Pomfrets a) Black pomfret b) Silver pomfret c) Chinese pomfret
Mackerels a) Indian mackerel b) Other mackerels
Seer fishes a) 5". commerson b) S.guttatus c) 5'. lineolatus d) Acanthocyhium sp.
Tunnies a) E.affinis b) Auxis spp. c) K.pelamis d) T.tonggol e) Other tunnies
Bill fishes Barracudas Mullets Unicorn cod Flat fishes
a) Halibut b) Flounders c) Soles
Crustaceans a) Penaeid prawns
3
49 9
—
— — •
118 478
—
130
9 —
149 9
114 — —
31 3 9
434 b) Non-penaeid prawns — c) Lobsters d) Crabs e) Stomatopods
Cephalopods Miscellaneous
Total
No. of operations of fishing units
19 49 —
214 529
6,674
34,784
4
1 2
—
— —
— —
—
— — — — — — —
— — 47
946 — —
200 4
228 2,368
7,602
54,687
5
— 18 —
14 —
4
—
— — — — — — —
— —
120
2,163 — —
345 150 254 758
20,039
66,948
Table 29. Composition of marine fish landings from mechanised boats at Cuddalore Fisheries Harbour, Nagapattinam and Tuticorin Fisheries Harbour during 1985-'86 (figures in tonnes)
SI. No.
1 1.
Name of fish
2 Elasmobranchs
Cuddalore Fisheries Harbour Trawl Gill Total
net net 3 4 5
Trawl net
6
Nagapattinam Gill Hooks net & line 7 8
Total
9
Tuticorin Fisheries Harbour Trawl Gill Shore Total
net net seine 10 11 12 13
a) Sharks b) Skates c) Rays
Eels Cat fishes Clupeids
a) Wolf herring b) Oil sardine
83 83 11
478 40 68
4 1
1
— — — —
4
3 —
6
— —
16
481 40 74
4 1
— 1
— 2
3 —
24

1 2
c) Other sardines d) Hilsa shad e) Other shads f) Anchovies
Coilia Setipinna Stolephorus Thrissina Thryssa
g) Other clupeids 5. Bombay duck 6. Lizard fishes
3
— —
— —
157 — 43
185 —
677 7. Half beaks & Full beaks — 8. Flying fishes 9. Perches
a) Rock cods b) Snappers c) Pig-face breams d) Threadfin breams e) Other perches
10. Goat fishes 11. Threadfins 12. Croakers 13. Ribbon fishes 14. Carangids
a) Horse mackerel b) Scads c) Leather-jackets d) Other carangids
15. Silver bellies 16. Big-jawed jumper 17. Pomfrets
a) Black pomfret b) Silver pomfret c) Chinese pomfret
18. Mackerels a) Indian mackerel b) Other mackerels
19. Seer fishes a) S.commerson b) S.guttatus c) S.llneolatus d) Acanthocybium sp.
20. Tunnies a) E.affinis b) Auxis spp. c) K.pelamis d) T.tonggol e) Other tunnies
21. Bill fishes 22. Barracudas 23. Mullets 24. Unicorn cod 25. Flat fishes
a) Halibut b) Flounders c) Soles
26. Crustaceans a) Penaeid prawns b) Non-penaeid prawns c) Lobsters d) Crabs e) Stomatopods
27. Cephalopods 28. Miscellaneous
Total
No. of operations of fishing units
—
— — —
571 190 140 —
471 29
— — — 26
1,905 —
— — —
— —
— — — —
— — __ — —
13 — —
— — 46
653 — —
904 12 65 24
6,111
18,881
4
— —
— — — — — — — — — —
— — — — — — — — —
— — 9 1
— —
— — —
2 —
54 —• — —
39 — — — — 6
28 — —
— — —
— — — — — —
222
548
5
— —
— —
157 — 43
185 —
677 — —
— — —.
571 190 140 —
471 29
— — 9
27 1,905
—
— — —
2 —
54 — — —
39 — — __ — 6
41 — —
— — 46
653 — —.
904 12 65 24
6,333
19,429
6
24 — —
209 —
1,551 —
233 199 —
321 — —
— — —
1,028 515 63 1
868 58
2 — —
243 2,018
—
10 5
—
27 —
6 — — —
— — — — — — 79 — —
118 —
183
990 90 39
514 33 91
579
10,699
36,535
7
— —
— — — — — — — __ —
— 1
— — 6
— — — —
— — — 3
— —
— — —
— —
5 — — —
— — — — — — — — —
— —
1
— — — — — —
1
18
151
8
— —
— — — — — — — — —
20 4
— — 18 — — — —
— — — 1
— —
— — —
— —
4 — — —
— — — — —
1 — — —
— — —
— — — — — —
3
64
239
9
24 — —
209 —
1,551 —
233 199 —
321 — —
20 5
— 1,028
539 63
1 868 58
2 — —
247 2,018
—
10 5
—
27 —
15 — — —
— — — — —
1 79 — —
118 —
184
990 90 39
514 33 91
583
10,781
36,925
10
2 — 4
—, —
460 —
2,212 95 — 87
—
32 47
181 526
35 176
2 744 —
— — 8
1,223 6,727
—
— — —
— —
7 — — —
— — — — — — 98 — —
18 —
9
1,844 — — 33 —
157 753
15,488
47,853
11
— —
— — — — — — — — — —
— — — — — — — — .—
— — — — — —
— — —
— —
1 — — —
— — — — — — — — —
— — —
— — — — — —
4
107
12
— —
— — — — — — — — — —
— — — — — — — — —
— — — — — —
— — —
— —
7 — — —
— — — — — — — — —
— — —
— — — — — —
10
40
13
2 — 4
— —
460 —
2,212 95 — 87 — —
32 47
181 526 35
176 2
744 —
— — 8
1,223 6,727
—
— — —
— —
15 — — —•
— — — — — — 98 — —
18 — 9
1,844 — — 33 —
157 753
15,502
48,000
25
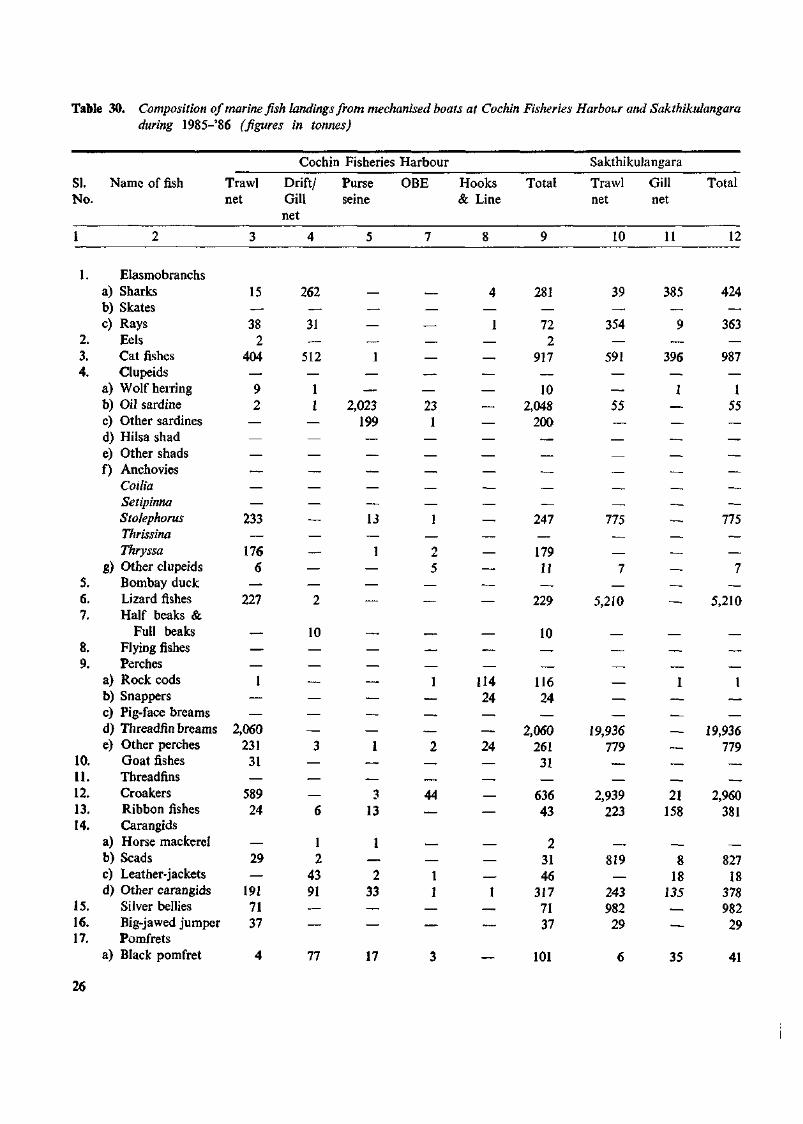
Table 30. Composition of marine fish landings from mechanised boats at Cochin Fisheries Harbour and Sakthikulangara during 1985-'86 (figures in tonnes)
SI. No.
1
1.
2. 3. 4.
5. 6. 7.
8. 9.
10. 11. 12. 13. 14.
15. 16. 17.
Name of fish
2
Elasmobranchs a) Sharks b) Skates c) Rays
Eels Cat fishes Clupeids
a) Wolf herring b) Oil sardine c) Other sardines d) Hilsa shad e) Other shads f) Anchovies
Coilia Setipinna Stolephorus Thrissina Thryssa
g) Other clupeids Bombay duck Lizard fishes Half beaks &
Full beaks Flying fishes Perches
a) Rock cods b) Snappers c) Pig-face breams d) Threadfin breams e) Other perches
Goat fishes Threadfins Croakers Ribbon fishes Carangids
a) Horse mackerel b) Scads c) Leather-jackets d) Other carangids
Silver bellies Big-jawed jumper Pomfrets
a) Black pomfret
Trawl net
3
15 — 38
2 404 — 9 2
• — •
— — .— — —
233 —
176 6
— 227
— —
1 — —
2,060 231
31 —
589 24
— 29 —
191 71 37
4
Cochin Fisheries Harbour
Drift/ Gill net
4
262 — 31 —
512 — 1 1
— — — — — — — — — -— — 2
10 — — — — — —
3 — — —
6
1 2
43 91 — —
77
Purse seine
5
— — — —
1 — —
2,023 199 — — — — — 13 —
1 — — —
— — — — — —
1 — —
3 13
1 — 2
33 — —
17
OBE
7
— — -— .— — — — 23
1 — — — — —
1 —
2 5
• —
—
—
1 •— — — 2
—
44 —
— 1 1
— —
3
Hooks & Line
8
4 —
1 — — — — — — — — — — — — — — — — —
— —
114 24 — — 24 — — — —
— —
1 — —
—
Total
9
281 — •
72 2
917 — 10
2,048 200
— —
247 —
179 11 —
229
10
116 24 —
2,060 261
31
636 43
2 31 46
317 71 37
101
Sakthikulangara
Trawl net
10
39 —•
354 —
591 — — 55 — — —. — — —
775
7 —
5,210
—
— — —
19,936 779
,
2,939 223
819 —
243 982 29
6
Gill net
11
385 —
9 —
396 —
1 — — -^
— — —
— — — —
—
1 — — — — —.
21 158
8 18
135 — —
35
Total
12
424 —
363 —
987 —
1 55 — — — — — —
775 — —
7 —
5,210
1 — —
19,936 779
-
2,960 381
827 18
378 982 29
41
26

10 11
18.
19.
20.
21. 22. 23. 24. 25.
26.
27.
28. 29.
30. 31.
b) Silver pomfret c) Chinese pomfret
Mackerels a) Indian mackerel b) Other mackerels
Seer fishes a) S. commerson b) S.guttatus c) S. lineolatus d) Acanthocybium sp.
Tunnies a) E.affinis b) Auxis spp. c) K.pelamis d) T. tonggol e) Other tunnies
Bill fishes Barracudas Mullets Unicorn cod Flat fishes
a) Halibut b) Flounders c) Soles
Ciustaceans a) Penaeid prawns
• —
29 —
— — — —
— 3
— — — — 54 — —
5
188
1,445 b) Non-penaeid prawns — c) Lobsters d) Crabs e) Stomatopods
Molluscs a) Bivalves b) Gastropods c) Cephalopods
Marine turtles Marine mammals
a) Dolphin & Porpoise
b) Seacow c) Whale
Seaweeds Miscellaneous
2 91
313
— —
214 —
—
— 55
—
45 —
541 6
— —
690 201
— 48
2 14 22 — —
• — •
—
— — —
1 —
— — — — •
—
— 10
—
4,649 —
— — — —
216 390
— —
1 — — — —
—
— •
2 — — — —
— •
— — —
— —
4,723 30 99 129
541 — 233 233 6 _ — __
576 576 3 3
— 1 1 — 37 36 186 10 197
9 8
1 1 — 8
915 602
49 4
14 96
7 1
4,092
— 7 — 1 — 4,092 188
1,448 10,070 — 10,070
2 92
313
20 91
1,354
— 20 — 91 — 1,354
214 4,354 - 4,354
65 3,013 67 3,080
Total 6,779
No. of operations
of fishing units 30,266
2,623
18,607
7,565
2,918
87
100
205
1,191
17,259
53,082
56,205
1,23,06
2,195
13,043
58,400
1,36,104
27

K ) OO
Table 31. Composition of marine fish landings from mechanised boats at Mangalore, New Ferry Wharf, Sassoon Dock and Veraval during 1985'-86 (figures in tonnes)
SI. No.
1
Name of fish
2
Mangalore Trawl Gill Purse net net seine
3 4 5
Total
6
New Ferry Wharf Trawl Del Gill net net net
7 8
Total
9
Trawl net
10
Sassoon Dol net
11
Dock Gill net
12
Hooks &line
13
Total
14
Trawl net
15
Veraval Gill Total net
16 17
1.
2. 3. 4.
5. 6. 7.
8. 9.
10. 11. 12. 13. 14.
15. 16. 17.
18.
19.
a) b) 0
a) b) c) d) e) f)
R)
a) b) 0 d) e)
a) b) 0 d)
a) b) 0
a) W
a) b) c) d)
Elasmobranchs Sharks Skates Rays Eels Cat fishes Clupeids Wolf herring Oil sardine Other sardines Hilsa shad Other shads Anchovies Coilia Setipinna Stolephorus Thrissina Thryssa Other clupeids Bombay duck Lizard fishes Half beaks &
Full beaks Flying fishes Perches Rock cods Snappers Pig-face breams Threadfin breams Other perches Goat fishes Threadfins Croakers Ribbon fishes Carangids Horse mackerel Scads Leather-jackets Other carangids Silver bellies Big-jawed jumper Porafrets Black pomfret Silver pomfret Chinese pomfret Mackerels Indian mackerel Other mackerels Seer fishes S. commerson S.guttatus S. lineolatus Acanthocybium sp,
41 66 2 109 1,494 5 11 1,510 1,067 3 381 88 1,539 498 778 1,276 — — —- — 1,633 — — 1,633 186 _ 43 — 229 359 — 359 53 38 — 91 2,064 — — 2,064 302 — 58 27 387 854 49 903 6 — — 6 2,782 — — 2,782 31 — 6 81 118 1,784 — 1,784
44 41 994 1,079 1,644 11 13 1,668 1,429 4 184 198 1,815 785 288 1,073
13 5 — 18 383 1 — 384 312 33 131 — 476 287 594 881 — — 13,954 13,954 _ _ _ _ _ _ _ _ _ _ _ _ — — 1,009 1,009 _ _ _ _ 2 2 — — 4 _ _ _ _ _ _ _ _ _ _ _ _ _ _ _ _ — 1 4 14
— — — — _ _ 2 2 8 — 1 0 4 — 1 1 2 — 799 799
— — — — 2,229 47 — 2,276 425 81 — — 506 4 4 0 — 4 4 0
20 — 1,454 1,474 _ 9 _ 9 _ 1 4 _ _ 1 4 _ _ _ 22 — 107 129 142 — — 142 339 33 — — 372 5,217 1 5,218 3 — — 3 478 27 — 505 284 43 72 — 399 995 473 1,468
— — — — 905 53 — 958 35 728 — — 763 36 2 38 333 — — 333 480 — — 480 723 — — — 723 324 — 324
13 13
—
1,227 695 —
420 916
1 1
146 49
382
27 7
5
12
—
— 1
—
— 11
1
6 10 — — 20 1
10
116
8 33
64 — — 2
— 12
201 205
7 520 — — _^ —
10,024
8 33
1,291 696 — 2
420 939
203 206
13 676 49
382
47 8
10,039
128
72 103
647 301 677 603
5,398 2,055
30
40 621 —
610
87 173
1
24
200 105
— —
— 4
—
2 16
— 1
— — _^ —
—
— —
— — —
— —
8 4
— — 6 1
—
10 3
72 103
647 305 677 603
5,400 2,071
30
48 626 —
610
93 174
1
24
210 108
103 32
1,663 191 318 220
2,904 1,631
207 —
225
20 289
5
197 322
—
— —
47 124
11 —. — „
57
—
=
29 12
— 15 — — 75 37
146
81 18 — —
183 193
3
196 191
— —
1 11 — — 48 —
—
— — 2
—
—
132 44
1,664 217 318 220
3,074 1,792
146
81 236
• —
225
205 539
8
393 513
146 456 24
1,730 1,003
199 428
8,673 7,546
70 23 78
445 676
5,129
36 145
7
135
— 9 3
— 6
— 1
163 263
220 — 19 68 — —
126 317
—
951
146 465 27
1,730 1,009
199 429
8,836 7,809
290 23 97
513 676
5,129
162 462
7
1,086

10 11 12 13 14 15 16 17 18
20.
21. 22. 23. 24. 25.
a) b) c) d) e)
26.
27.
28.
a) b) c)
a) b) c) d) e)
a) b) c)
Tunnies E. affims Aitxis spp. K.pelamis T. tonggol Other tunnies Bill fishes Barracudas Mullets Unicorn cod Flat fishes Halibut Flounders Soles Crustaceans Penaeid prawns Non-penaeid prawns Lobsters Crabs Stomatopods Molluscs Bivalves Gastropods Cephalopods Miscellaneous
— 27 — 27 631 — 23 654 — — 293 — 293 — 196 196
— 19 624 643 _ _ _ _ _ _ _ _ _ _ _ Z _ _ _ _ _ _ _ _ _ _ _ _ _ _ 5 9 59
5 2 — 7 9 — 13 22 — 1 162 — 163 _ _ _ 31 9 — 40 14 — — 14 15 — — — 15 38 _ 38 _ _ 1 1 _ _ _ _ _ _ _ _ _ _ _ _
22 — — 22 264 — — 264 75 — 34 — 109 196 4 200
820 — — 820 616 — — 616 410 _ — _ 410 631 3 634
1,273 — 67 1,340 9,352 52 — 9,404 13,416 219 — — 13,635 3,625 _ 3,625 84 — — 84 1,313 203 — 1,516 145 1,282 — — 1,427 830 _ 830 — — — — 380 — — 380 341 _ _ _ 341 281 3 284
657 — — 657 100 1 — 101 100 — — — 100 835 — 835 2,992 — — 2,992 _ _ _ _ _ _ _ _ _ 241 — 241
730 — 784 1
— 730 34 819
6,136 1,178 55
6,136 1,235
5,281 498
— 279
— 62
— 9
5,281 848
2,580 2,124
— 3
2,580 2,127
Total 11,821 384 29,322 41,527 45,985 531 96 46,612 33,751 2,964 2,709 465 39,889 49,909 5,425 55,334
No. of operations of fishingunits 36,323 4,127 9,209 49,659 24,309 3,144 210 27,663 21,278 16,965 4,833 1,741 44,817 36,810 25,271 62,081
Table 32. Estimated marine fish landings (in tonnes) in India during 1985-'86
so
SI. No.
1. a) b> c)
2. 3. 4.
a) b) 0 d) e) f)
Name of fish
Elasmobranchs Sharks Skates Rays Eels Cat fishes Clupeids Wolf herring Oil sardine Other sardines Hilsa shad Other shads Anchovies Coilia Setipinna Stolephorus
West Bengal
82 18
260 9
1,650
331 1
154 3,249
50
645 1,439
123
Orissa
1,735 71
613 537
4,667
594 101
2,641 608 111
1,981 1,951 1,280
Andhra Pradesh
4,992 288
1,332 409
4,625
1,785 100
20,532 161
2,216
45 43
5,678
Tamil Nadu
1,471 178
6,584 156
1,750
2.690 3,196
21,532 219
2,467
473 25
9,051
Pondi-cherry
176 13
233 — 37
41 1,774 1,877
— 20
25 39
570
Kerala
4,628 3
1,195 2
4,730
518 73,194 3,436
10 2
— —
36,394
Kama-taka
2,150 10
288 7
2,425
863 45,642
6,900 275 —
5 7
10,238
Goa
287 — 150 —
869
682 2,857 2,061
— —
— —
183
Maharashtra
5,927 1,880 2,672 3,365
11,954
3,962 1,859
393 642
1.236
13,257 — 55
Gujarat
9,508 973
2,719 3,886
12,618
5,467 — 77
271 5,879
11,612 — —
Anda-mans
302 38 31 —
125
73 —
1,225 108
—
— — 120
Laksha-dweep
157 — 71 — —
— — — — —
— — —
Total
31,415 3,472
16,148 8,371
45,450
17,006 1,28,724
60,828 5,543
11,981
28,043 3,504
63,692

OJ 1 ^J .
g) 5. 6. 7_
8. 9.
a) b) 0 d) e)
10. 11. 12. 13. 14.
a) b) c) d)
15. 16. 17.
a) b) 0
18. a) b)
19. a) b) c) d)
20. a) b) c) d) e)
21. 22. 23. 24. 25.
a) b) 0
26. a) b) c) d) e)
27. 28.
2 Tkrissina Thryssa Other clupeids Bombay duck Lizard fishes Half beaks &
Full beaks Flying fishes Perches Rock cods Snappers Pig-face breams Threadfin breams Other perches Goat fishes Threadfins Croakers Ribbon fishes Carangids Horse mackerel Scads Leather-jackets Other carangids Silver bellies Big-jawed jumper Pomfrets Black pomfret Silver pomfret Chinese pwrnfret Mackerels Indian mackerel Other mackerel Seer fishes S. commerson S.guttatus S.lineolatiis Acanthocybium spp. Tunnies E.affinis Auxis spp. K.pelamis T. tonggol Other tunnies Bill fishes Barracudas Mullets Unicom cod Flat fishes Halibut Flounders Soles Crustaceans Penaeid prawns Non-penaeid prawns Lobsters Crabs Stomatopods Cephalopods Miscellaneous
Total
3
292 471
1,089 —
—
— — — — 54 —
9 1,435 6,431
— — 38 8
400 —
188 907
11
1
55 150 — —
— — — — — — — 35 —
— —
142
565 3,617
— 240
5 8
335 24,497
4 ___ 182
5,478 260 188
4 — 17 24 5
425 593 270
35 17,197 1,933
240 193 39
228 431
3
288 1,821
— 697
__ 281 570 — —
323 32 6 1 5 1
19 16 —
— —
762
2,628 273
2 125 292 107 697
53,581
5
3,842 5,461
668 1,417
17 80
25 874 —
1,685 4,557 1,737 1,175 6,772 4,584
331 1,859
447 2,412 5,820
392
804 1,060
9
4,549
2,425 2,226
6 —
1,277 31 — —
229 92
308 211 — 85
149 673
9,340 1,166
10 1,739
405 619
1,621 1,15,395
6
5,750 4,632
— 2,091
665 564
1,825 919
2,214 2,995 4,626 2,047
427 8,050 7,517
99 281 528
9,497 39,092
584
175 157
2
5,597
2,188 783 20 —
1,125 202
9 —
514 57
1,453 356 —
310 10
1,338
12,183 200 428
6,598 273
4,490 19,299
2,01,892
7
567 613 —
189
538
3 31 46
909 555 194 22
387 48
309 18
774 1,446
4
29 — —
1,547
107 15 — — 8
— 13 — 15 33 75 39 — 34 —
184
643 23 16
401 1
39 1,049
15,729
8
1,963 4,803
— 5,202
723
460 100 337
23,718 5,148
128 7
7,573 25,330
95 4,262
279 7,602 3,385 1,273
642 156
5
20,443 —
4,373 3,538
— —
6,078 2,962
45 390 732 194 988 708 — 19 4
10,102
28,000 248
44 1,344 9,459 7,252 6,770
3,20,996
9
973 1,577
— 668
144 16
24 35 —
2,316 1,008
— 6
1,708 1,953
605 693
1,296 7,770 2,654 1,168
1,740 142 —
24,570
2,688 465
4 —
2,050 172 —
643 81 21
134 6
— 34 —
3,996
5,116 100 23
1,354 14,094 1,077 2,443
1,54,377
10
2,947 1,144
— 379
90 1
1 78 —
1,106 229 —
5 2,252
949
204 1,210
46 3,193 1,161 3,138
508 197 —
5,653
13 1,114
— —
189 49 — — — — 62 48 —
— —
2,661
3,873 —
9 1,765 7,908
625 3,213
53,109
11
2,488 2,841
62,585 2,364
282 2
214 225
14 3,253
709 995
1,778 24,855 20,710
1,299 10
1,412 3,836
36 2,610
2,777 7,350
21
1,593
3,359 3,017
— —
2,118 — — — —
210 127 401 705
432 —
4,442
55,624 50,652
2,945 320
2,778 12,684 8,432
3,39,734
12
8,269 5,925
38,817 704
33 —
302 806 27
3,818 5,008
204 3,564
32,364 24,850
661 23
1,939 863 90
14,395
2,290 7,262
110
12
1,865 4,075
— —
2,921 — — 56
4,934 — 86
3,079 —
497 —
1,570
14,020 8,237
842 7,094 4,288 6,716 9,741
2,75,367
13
99 — — —
102 —
— — — —
919 — 42 30 — — — —
530 425 — 7 32 —
490 87
170 160 — —
— —
172 — 46
156 216 261 —
— — —
206 2 9
30 — —
374 6,587
14
— — — — 39 6
— 45 — — 70 28 — — — — — — 50 — — — — — — — 25 33 — — 39 —
2,945 —
791 74 8
— —
— — — — — — — — 11
237 4,629
15
27,372 32,945
1,03,419 13,202
2,637 669
2,898 3,137 2,643
40,225 23,476 5,603 7,070
1,02,623 94,305
3,534 8,840 6,042
36,763 54,940 23,567
9,448 19,084
158
65,152 87
17,549 16,146
30 —
16,128 3,448 3,190 1,090 7,347
838 3,476 5,160
705
1,411 163
25,870
1,32,198 64,518 4,328
21,010 39,503 33,628 54,141
15,65,893

Table 33. Estimated marine fish landings (in tonnes) in India during 1985
SI. No.
1
Name of fish
2
West Bengal
3
Orissa
4
Andhra Pradesh
5
Tamil Nadu
6
Pondi-cherry
7
Kerala
8
Karna-taka
9
Goa
10
Maharashtra
11
Gujarat
12
Anda-mans
13
Laksha-dweep
14
Total
15
1. a) b) 0
2. 3. 4.
a) b) c) d) e) 0
g) 5. 6. 7.
8. 9.
a) b) c) d) e)
10. 11. 12. 13. 14.
a) b) c) d)
15. 16. 17.
a) b) c)
18. a) b)
19. a) b)
Elasmobranchs Sharks Skates Rays Eels Cat fishes Clupeids Wolf herring Oil sardine Other sardine Hilsa shad Other shads Anchovies Coilia Setipinna Stolephorus Thrissina Thryssa Other clupeids Bombay duck Lizard fishes Half beaks &
Full beaks Flying fishes Perches Rock cods Snappers Pig-face breams Ttaeadfin breams Other perches Goat fishes Threadfins Croakers Ribbon fishes Carangids Horse mackerel Scads Leather jackets Other carangids Silver bellies Big-jawed jumper Pomfrets Black pomfret Silver pomfret Chinese pomfret Mackerels Indian mackerel Other mackerel Seer fishes S. commerson S.guttatiis
97 138
229 3
1,504
283 1
43 7,201
49
465 471 120
297 622
1,131 — — —
— — — — 67 —
5 872
4,409
— — 22
2 399 —
304 940
10
7 — 37 89
1,364 62
490 511
5,351
481 96
3.905 581
68
881 958 786
185 3,186
224 231
— 1
17 22 61
338 494 424
84 15,176 1,866
268 66 79
264 708
20
193 1,554
— 581 —
224 427
6,239 256
1,589 577
5,230
1.614 263
22,816 174
2.480
45 39
2,621
4,059 8,191
579 1,252
38 78
21 1,715
— 1,426 4,908 1,374 1,840 6,753 4,480
535 1,113
811 2,050 5,348
499
1.477 1,385
6
3,683 —
2,290 2,326
1,661 174
6,789 151
2,056
2,019 2,896
20,945 248
2.352
382 37
8,233
6.738 5,029
— 1,964
711 605
1,787 938
1,952 2,800 4,643 2,171
397 7,840 7,892
99 248
2,798 10,197 37,410
611
185 151
2
6,081 —
2,528 759
191 13
225 — 39
56 1,374 3.179
— 95
23 39
434
651 765 —
164
1 538
3 14 35
806 570 145 22
463 38
— 309 19
791 1,359
4
31 1
— 1,249
— 118
16
4.953 13
1,047 3
5,184
617 79,237 2,473
20 32
— —
36,235
1,810 4,278
— 5,695
664 —
481 137 202
24,196 5,694
100 156
8,630 25,146
91 4,236
259 8,313 3,419 1,041
695 185
12
18,115 —
4,491 3.968
1,424 11
214 1
1,415
784 30,812 4,325
3 6
5 3
5,731
1,019 1,044
— 426
133 10
69 34 —
1,277 485 —
4 1,389 1,429
566 701
1,293 7,079 2,518
837
1,745 162 —
25,029 —
2,696 486
209 —
129 4
1,715
431 4,068
930 —
2
— — 156
2,851 758 —
450
122 1
205 78
1 751 315 —
5 2,288 1,417
145 1,210
52 1,516
764 2.145
526 213
12
5,625 — 15
917
6,479 1.927
2.592 3.518
11,009
4,010 1,840
337 445
1,295
13,195 — 73
2,500 2,844
69,689 1,855
277 2
275 229
14 2,654
698 636
1.527 21.842 19.054
1,167 10
1,383 2.926
62 1.985
2,702 8,040
3
884 —
2,590 3,049
10.523 894
2,305 3,534
10,876
7,351 —
481 376
5,448
11,000 — —
8,202 7,566
40,831 1,263
31 —
406 886 46
4,492 4,592
497 4,978
35,795 18,672
615 8
1,950 957 357
18,195
2,312 10,037
54
41 -:-
1,424 5,210
274 35 30 — 121
67 —
1,122 106 —
— —
116
92 — —-— 96 —
— — — —
864 — 41 30 —
— — —
505 381 —
7 30 —
480 85
165 155
157 — 71 — —
— — — — —
— — —
— — — 39
6
— 45 — — 70 28 — — —
— — — 50 — — — — —
— 25 33
33,571 3.523
15,710 8,302
44.500
17.713 1.20.587
60,556 9,154
11,827
25.996 1.547
54.505
28,404 34.283
1,12,454 13,332
2,112 1,241
3,264 4,098 2,311
38,740 23,400
5,375 9,059
1.01.078 84,403
3,486 7,901 8.666
34.650 52,725 25,337
10.177 22,698
99
61,775 85
16,603 17,435

Table 33 (Contd.)
1
c) d)
20. a) b) c) d) e)
21. 22. 23. 24. 25.
a) b) c)
26. a) b) 0 d) e)
27. 28.
2
S. lineolatus Acanthocybium spp. Tunnies E. affinis Auxis spp. K.pelamis T. tonggol Other tunnies Bill fishes Barracudas Mullets Unicom cod Flat fishes Halibut Flounders Soles Crustaceans Penaeid prawns Non-penaeid prawns Lobsters Crabs Stomatopods Cephalopods Miscellaneous
Total
3
—
— — — — — — — 34 —
— — 57
246 2,860
— 210
5 7
316
23,553
4
—
55 5 5
— — — 37
6 —
— —
683
2,598 274
2 127 173 107 618
46,919
5
14 —
1,404 24 — —
349 198 439 342 —
73 90
621
7,681 1,161
9 1,587
399 553
1,643
1,18,767
6
22 —
783 47 13 —
493 261
1,309 429
—
296 21
1,219
11,306 165 442
6,575 287
4,442 18,048
2,00,637
7
—
9 — 23 — 15 33 79
7 —
32 —
208
754 8
12 430 — 43
1.047
16,480
8
—
5,941 2,782
45 389 700 152 921 716 —
19 4
11,309
26,685 202
93 974
7,817 8,308 7,112
3,25,997
9
4 —
2,069 172 —
642 81 20 96
6 —
29 —
3,882
4,484 100
22 596
9,428 246
1,802
1,18,844
10
—
189 41 — — — — 28
107 —
85 —
2,965
3,496 — 23
1,789 6,554
308 3.316
48,927
11
—
1,823 — — — 50
176 146 184 734
400 —
3,772
51,793 55,180
2,504 494
2,759 13,066
7,305
3,36,033
12
—
4,313 5
— 56
4,748 34 96
3,261 —
894 —
2,953
12,716 7,132
966 9,452 3,769 4,551
10,564
2,87,715
13
—
— —
170 — 45
154 213 244 —
— — —
199 2 9
30 — —
358
6,226
14
—
39 —
2,945 —
791 74
8 — —
— — —
— — — — — 11
237
4,629
15
40 —
16,625 3,076 3,201 1,087 7,272 1,102 3,372 5,336
734
1,828 115
27,669
1,21,958 67,084
4,082 22,264 31,191 31,642 52,366
1,534,726
*rRcT f( ^(^ ^S^^ 3??!^ - 1 9 8 5 - ' 8 6 '
>TRcT it 1985-86 ^ ^ ? : R ^f^ ?n#PJ^ ^ 3?TT^ HW5nT
^ 3 i g ^ 1.57 asr «n I JJi: 1984-85 ^ STRf 3cqi^ ^ 5 ^ 1
^ 3.1 % ^ qr I srrfoTHra ?PS ^ ^ ^ ^ JT 'ff ^ cTR lt
(Oil Sardine) gwsPW arnTT ^ 55i^5=R 5BI 8.2% «TTl
^#(31^ 5!fTt (Penaeid prawns), jfefcl (Bombay duck)
3d^ ^ ?«r5R 2i«n5OT 8.4% ^ 6.6% sn I ftqfjfEft^ ^
^ <#cIT if^T W ft^ fqS^ SR % 3.2% % 6.0% cTB s^T
«n I
(Pelagic and demersal group of fishes)
1985-86 % ^ H %5nWf t^ cTSTiRjft TSSft IT ^ l ^
'Rfl !ft I 5^-ft^ epff IT ^ 5 R (CT ^) #1% ^ S^R: 11
^
5T
1985-'86
8,03,991
7,61,902
15,65,893
1984-'85
8,14,464
8,01,288
16,15,752
^VdlMMdi ^ (Pelagic group)
1984-85 ^^ ^ 55RI ^ ^g' ?n5i SE?r ^ ^ IRW
'?T5w ^ ^ > r 10,500 CT ^ am% 1.3% ^ laeft f ^arat
q ") 1 S'ST %5rRWf J l S f ^ it q ^ »T aff»T ^ cfRcft (oil sardine), ^ Q T (bombay duck), «ill^"*l^« qg' ift ift {Stolephorus spp.), qJlaT jft^ (ribbon fish), srl Tt (mackerel) arrf i
1. cTFi^ (Oil Sardine)
crn:# SBT ^5W 1984-85 % 22% ^ m I 5?!^ 95%
^ 5 R ^?T, Wfe^ ^ 'fffr % SM 1^ ^ I fqs^ fi| ^
35RI ^ cTR ft ^ 55,000 3^ ^t cft Wf q ^ ^ ?n^ HKCT
it 55T ^ ^t iTif^ ^ m\ m ^^'^ ^ ^m \ "j f 5TI "R 5Tpr$imf ^ qt(o =5 <t ^ ^ 5 R if ^ 3jf>T^fer I w TTT I
2. ^ ^ ^ ^ (Bombay duck)
itfera ^ W5PT fqe^ ^ # g5RT it ^ > r 22,000 CT
W «n I >TRcT % ^51 srjwrST ^ 5 R % 98% JTfRI CT ^
*?fr. JPT. t^B. 3in:. an? % » n f ? ^ # 1 ^ i%j|n:<^ SPTFT g[nci
!PR:RT % ft-% ^ I 5W H^Rl^ it 1,300 ST ^ #Hr ^5ft
?l^ 35I RT % «T5R ^ 22,000 ST «Bt ' t f ^gwt q^t cflt «TR?r
i t ^ ^ ^ ^ ^ <«R:<T ^ Tqr I
3. Wl$l<^<'y I W T T 'fi' (Stolephcrons spp.)
5g%W5R ^ 1984-85 * pHT ^ 12.4% ^ ^ f i3Fft
q^7 1 ^ ?«r5R % 57% %5r5T % aiRT |tC ^ f l ^ ^Tfe^, cTPrsRif ^ anj^Tsi^ ^ ft?rar sdrror ^wmw 16, 14
3 ^ 9 TT I
4. <|frrn" J^H (Ribbon fish)
^ ^ ^ fqs^ spf ^ 3 T ^ 42,000 ST "skTWlT arfi^
q^3T «n I f ^ 75% ^5T, JTfRMT ^ !pR:Ter ^ HM ^
^ I cTJif ITTf it 5?!% ?THT it ^ ^W q ^ I
5. ^IW^ (Mackcral)
# T t ^ ^«raT f^^ ^ % ?«raT % ^fO^ 15,000 s r
arfsra «n I % 5r ^ ^rfe^tq^iTOT 7,500 ^ I I , 8 0 0 3:T
?flT BTfst q ^ 1^ I 5 ^ JWR: »ft^ ^ JIRT ^ 5 R fe^
^ % ^ 5 R ^ 53TT 'TI I
?raw«ft ^ (Demersal group)
c r^m^ ^ it snw ?«raT ^vftaj^ sffrt w m ^
5T cRWsaft ^5Fr % 17.4% «n I f?i% a JJf SI^ ^ Jl1?rW
q ^ Tt^ 't SWH; 11 sFt^^ (croakers) 13.5 %, T I (perches)
9.5%, TiT ^'flar^ SflFlI (non-penaeid prawns) 8.5%,
g?5W (silver bellies) 7.2%, gqife^#T (elasmobranchs)
6.1 %, f?Prsr (catfish) 6.0% ^ <flta 3 (pomfrets) 3.8%.
!• ^ H i ^ t ^ l^f't (Penacfd prawns)
1984-85 * 3 ^ 1 ^ 1985-86 % W5R ^ 1.3% # arscft
| t l ^ »TR:CT % ^5IT it 90% HfRFsr, ^cT, JpRIcT,
d TSiHTi ^ BiFvrra^ it f t 1 *i Ki«*ii ^ arF srailsr %
^5lT ^ ^cft | t ^ 'C T it ^Isr 9,200 ST "l IScft ^
q^ I !pR:icT ^ crfirsRTf it warn fts^ ^ % 'EWR «n 1
2- b h l ^ (Croakers)
^t%i % ^51T it iqjjt ST? 5B1- 3 1 ^ 5.6% ^ Wl' ^ q^ I ?n^ vTKcr % ^ ^ S T T ^ 72.5 % gsf RT, WfKi^ ^
33

^im ^ 1^ I 5T5r g5R:TcT ^ ^m ^m^n 4,200 ^ 1,200
S5ff ^ ^ift 3Tfif%feT ^ cT? ^IV^-A ^ 4,700 CT ^t ^ c f l
3. S T N r 3 T C ¥ ^ I r f (Non-Penaeid prawns)
1985-86 % ^t^T ^ ^ ^ ^ sflFt ^ sn^fecT ^5!W
64,500 aST sn ^ 1984-85 % ^ m % Wid^ 9,400 3 ^ ^
«TT I JTIKI^, ?I5n;icT ^ qf^H ^ 5 r ^ 9 7 % ?ST5R JIM
1^ I 5^^ IT5RW m f f ^ 78.5 % «n I ^ cT ff V^ ^
4. *i«r<!J'«f (Silver bellies)
^H ^ ^ R % 71 % crfffSRif ^ 5n><T larr i ^ a ^ % atszr
5. q ' ^ ^ (Perches)
1985-86 T} qpl ^ ^ 5 H 1984-85 % ^«r5R % ?mR Ct «n ^ Hmi5PT % 3TggK 72,400 Z^ «n I HRcT t ^ 3 q= ^5W % 55.6 % srsfwr 3liff ^Threadfin bream) ^ «TI 1
^cT w5Fr % 82 % %?;5T, cTFTcRif, i T ^ M ^ 31 ?: 3n?¥nsi(5r %
5n><T 1^ % I f e ^ ^^ m a f j r ^ 4i.1 % «TI i
6- ^3^!^%nfl<T (Elasmobranchs)
1985-86 if ^qri^snft^ ^i ^ 5 W 51,000 s^ «n ^
1984-85 % ^ 5 R % 4,000 CT sfifT «IT 1 OTlf^^Iift^ % 6 2 %
g^ (sharks) % Mk 5mT (rays) ^ ?%ajT (skates) m\^Pfi
32 ^ 6 5f%5RT ^ 1 ^ % OT#fJTt?T ^ ^ % 87 %
Tf KMi, crfir^pni, 3TP aii:3T ^ %?;5r % a r a | q ^ i g ^ i w ,
Tfi^rsff, 3nf^ra^?r 3 ^ %^cr % 80 % g^ sni r |t^ 1 ^ %
3 1 ^ ^ ?mT ?«r5W clfilgmj ^ |3Tr I fe^ ^ ^ 3T^W
S5RRT, 3ft^T, wfe^B ^ "Ttfos^^t ^ S^ % ^ 5 R ^ sf cft
f t 1 S^Rier, 3TFtpr5i%?T ^ »ftm ^ s ro i l % ^ 5 R $} ^m\
7. i V r s t (Cat fish)
1985-86 % ^ R fwrct % ^ 5 R ^ 13.1% ^ m^
^ ^ \ gi^ ^ % f TT t ^«f^^ % 54 % JpRilcT ^
55 % ^ sn I ^ ' t e r , 3{PVTa ?r ^ w f e ^ >ft ^J^TTOT 21 ,
16 afk 12 afcmcT# ^Bcft f Janift 1
8- ITPR^^ (Pomfrets)
1984-85 % 46,000 CT % 18,000 OT ^ qScf)- 5^ ^TI %
# ^ 5 W5R ^ tWtIcTT «ft I ^Sm ^^ ^fXVt \ ^ "fi'Bfi'5 ^
^ 2T5R «n I %m ^ ^ ^ Tl'^S ^ ^ 2000 CT ^ I3cft
2I«fT5W 66.5 % ^ 32.9 % % I HT ^ % if^Z ^ ^ %
77 % iTfT?:i«5i ^ 35R;icr % a w p ^ 1 ^ ^ ^ P ^ ^w^iw
7,900 ^ 4^000 CT * gisft 3#%f»icT # ^ 7 I
m^ 1985-86 1984-85
3T?rH5R)
1,173,160
392.733
1,149,694
466.058
1985-86 ^ qff5f zTRf m ! 3 ^ T ^ % tR q ^ it 2 %
sfit ^5cft \ ^ cT I% 3PTff5[ JTR! 16 % "t 13cft I
^ccT?:-'i5 ^ f5r?r ^ "Tf? m ^ r a ^ sfl^iT OTfiigr | , 78,100
z^ # ?i^1' ^m ?«f5iT 3ri^%fer fen T^n # ? w ^ HRCT
% ^ ^ ^ 5 % 3 i g i n l ^ f%fiT Mr 1 1 fe^ q^ ^'t a i ^ ^
^ ^ ^ 2T5R ^ 7% ^1 ^z^ ^^ q ^ I mf^rj2ra ^ ( ^ %
Tri^<^ a ^ l ^ ^ ^^an^s iftJt (51%), {^itist (19%),
^"ts^ ^ (29%), ^t%^ (6.5%) 3ni^ ^ jpjRtq ^ ^ q#t I
?^ ^51 % ^5T ?I5^ JR 2T ^ 5 R ^ =^«iTt >nn 5Bt%e ^
3pq' g ^ 3T?ic[Tcn Rma «n i
3TPvrai 5T, crfir^Rif ^ Trf^s^^t ^ 5 ^ ^ ^ % ^m^
^ 1984-85 ^ 31%T ? g ^ 12% ^ t ^?3^t ^ ^ c l ^t I ?n^
HRcT %?2f5W ^ 21 .3% ^ ^ t ar<T |3n «n: I ^ i i f ^ i B ^
T c ^ ^ 5 R if g5=5R ap^r m^f%^ q=q jqri'^fft'T ^r%^, "film
I T X ^ ^ ^ ? r ^ ^ q t . 3TTf g ^ 1 1 g5=5R sft^ ^^ftsr^^
# f f % 5 H it qnrair 5,000 ^ 1,200 CT sfif ^ ^ ^ ^ ^
5Bt »nff I 3 ? ^ ^^ *i^ 3P^ a ^ % ^ c R it fe^ ^^ ^
3lVf tScft 3TiiT%fj3?r ^ TJft I ^ if OTTft«I#T (-6,600 CT),
'BimHi'T (-6,100 CT) ^5C 3i;s!T cTKfeJlT (-5,000 5^) | 1
^K^, ^ar^ ^ 'ftm 1 3 ^ a^icT ^ , s t ^ % ?n^ ^
^ ?igj(tiT?^ ?«ra^ % 33.8% ftToTen I , 1985-86 ^ 1984-85
% ?5!r5R % 2 % ^ f iiTJft 1 cTRsfr, s ik^, ^ i r ^ ' B ! ^ t ^ l q i . ,
^ 3 ! T ? ^ ^ , <R, ' ^cn^T , ftiTTE anf^ ^ ^ ^ g ^ # T ^ I
I I cTR5ft «f5R ^ 1984-85 % q ^ % 40,500 Z^ ^ ^
34

fw^f t "Tst eft # T t 5nT Jt 20,000 CT r srs 't M l * q ^ i ^"^an^ ITA % ^ ^ ^ 9,600 CT ^ ^3cft | t I f w : ^
^^tB%r trgtflTt ^ »ft z p n ^ 7,000 afk 6,500 CT ^ 'qsd^
? n ^ ^ % ^^r^ % 39.2% q f R i ^ ^ ^ g s R i c T ^ g w ^
^ ^ 1^ ^ I 1985-86 % ai r RT ^ 5 R 6,16,000 S^ STT ^
1984-85 % ^gpT ^ 2.6% ^ m 1 ^ 1 * ^ , 'fi^ ^^ ik l^ ^ ,
^Htm^ ^ , "slrn #T, 5Rf% afk ^^T»s snf ?:?r ^ ^ g ^ f3? ^ I «rfi?r5T i ^ "TtRfTs ^ ^ ^ w Jf ^m^w 20,300 OT ^ 12,600 3^ * sfi ft | t I 'Blcn Jfk % ^ it 12,600 ST
* ^cft i t I ^ T a n ^ §f!5l ^ ?n5PT ^ »ft 10,400 a r ^7
?TH5ra q n ^ ffti^ 1985-86 ^ a m ^5PT 1984-85 %
?«raH % 17.5 % ^ «ri I q j ^ ^ 5 H ^ ^ J (bag net) ^
g ^ ^ R «n i%?i% 57.1% ^ ^ R am p n i ^ aram ^ ^ J T
5n5T (gill nets) (39.7%), q#ir ^^1 (hooks and lines)
(2.6%) ^ Jrgr ^ (trawl net) (0.6%) arrf ^ Ht OT^I^
1^ ^ 1 ^ % 5if<i ai>^ g ^ sfs^ <iftm tftf, ^ J ^ ^ , ^ t M
arri^ % I s f ^ ^^ % f^^ l«r (hilsa shad) "T^^S ^
frr^ anf jpmw 47.6%, 15.8% ; ^ 13.1% ^ ai'<T |t^
^1 5 1 ^ ^5 i#?TfRcn^ a m Tc# it 98.2% fjiFist^
^Tif^snik ^ I arJitf^ ^ % q ^ MB^ fqs t ^^ % 12,300
5T ^ ^T^ 4,800 CT ^ m I -iJfcn ifW (28.5%), ^
^^m^ ^ (15.7%) ^ t ^ (9.4%) alk ^^tsn^ IT!^
(4.7%) 3ir|^ ^ ^ g ^ ^ I
^ r r ^ ?«r5R ^ 36,ooo sq- am ^ % fts^ ^ % 3,800
5T ^ srscff =ElcT ^ I 5Ti^ ^ 5 R if 5T5r 5n5T % 90.3%
^ 5 R 3lfn%f^ f w TJIT ^ fej^ «r? % 1,500 OT arTi^
«rrI e f ^ 5tT5T !• J r t ^ ^ s p T % 9.7% a m |3n I sra" srr r ^ q^^ ^ 5 ^ ^t%^ «IT I ftFTjt (7.4%), ^m^ Sft (6.4 %)
3ni5[ 3Rr iTEjfefi «ft I siq^ft i5n5i ^ a m ^ ^ ^ iT' fB'
(48.1%) gJST «ir 4 k 3FT r?I»T3t (20.2%), 5Rt% (9.7%)
arrf % 1 3i3nf5t ?T5R fqB% ^rl % 18,8C0 CT ^ 1,300
CT * ^ f ? p ^ 1 r^r^sr rlRf?!^ (15.1 %) ftrif (8.8 %),
'Bt%| (6.8%) <^«r> (4.7%) 4 k ^131T^ iffJ (3.0%)3Trl^
aM5R % 3T3?n 1985-86 ^ 3IP?ra ?T ^ zrif W ?5T R
36,400 5^ «n ^ 1984-85 % 17% arfe^ sn I ^ 5 R %
99.8% s r in % ¥^^ ^ srrat ^ ^ 5iT5f % a m ^ ^ \
3T5f sn r ^ a m g ^ ^rs^ ^^an?^ nlFt (16.6%), q^
(l2.5%), f%ff (10.9%) 4 k g?5W (9.2%) ^ I m ^
^ 5 R ^ 22,900 CT # iml^T ^ t fW^'t q ' I ^ ^ i^5it 3!KT g ^ JTBfeqf # r i (15.5%), ^ a n ^ ^ afit (4.2%),
^f%^(3.6%), q^ (3.3%) 4 k g ? ^ (3.2%) anl^ «lt I
1985-86 % ^ R ^ akr ^ 1^ irti Ri ^ I ^ R 1,03,800
CT «rr ^ fe^ srI % ^ 5 H % i,900 s^ arfg^ SIT 1 Jrtfsi
^ 5 R if JT5r 5rr5T ^ 5 R w g ^ ^ R «II I ^ ^^rw snsr
4 k ^5kr ?:5^ ^ e^Rftr ^ am | t 1 JI^T 5ti5T q ^ ^ ansn
TR g ? ^ ^ ^^ftan^^ iff?t ^, ^ra^ 39.9% ifwi g5=^
W «fT 1 apzr g ^ ; i 5 # q^ (5.7%), sfit ' (5.1%) ^
<rf1 H^ ^ i ?iqlFfr (2.6%) «it 1 arq^STRT ^ 5 R ^ 2 6 %
3T?jr cTRfM ^ 4 k at r g ^ >a 3q#wlR (7.2%)«ni
3T2Trf5r ^ 5 R if 32,600 s^ Ci wT' r « [ ' ^ q 't I ??iit ap r crRf5!€ (17.0%j t j i l^t^ (7.2%), > ^ % ^ ^ q^qt(6.7%),
q^ (5.9%), s^iTt (3.5%), ^ ^ (3.2%) gqrr^w't'T anf g sJT %i
lifsf^ ^ 5 R 1q5% qii ^t a i ^ r 1,500 CT arfsn «n 1
JT5f W^ % 1f{?:tr sn^ ciVT ^ 5 0 % g^^R, q^ a ^ ^"fan^
^ anf % I arq^l' SITCT % siftt a m ' ^ ^ R it ^ t ^ 53.2 %
OTif^lT 'ill I a i q t ^ ^5i?T fqs% ^^ ^ ai sin 700 CT ^
«rT I aiHT cTRfM, (17.9%), cn fcRIT (17.9%), # T t
(15.6%) ani^ apJT g^^r aTRI RTR ^ I
ai^^R % 3rg?rR ^ ^ ^TR # #tm 1985-86 it a m
?«r5R 2,72,700 3R m 5^ ^51 ?« I^ # 73.7 % «rT 1 1984-85
% 5«r5R ^ 36,500 z ^ ^ ^ rifsra ?«T5R ^ f 'SRt qs^ I
arr^ # ?^X 40.6%, s p ^ STRT ^ 4.4% ^ #«r nqm
(purse-seiners) % i;n:T 3.2% f«l5R a m I'? 1 ^ ^
^'{^ TT5R % 51.7% tffe^ % 3i;*(i <w ?«rR>T qtcff ^ a m
^ ^ \ arraSIM % a m *«r5R u 50% ^^rtan^ §ff5 ^
•r^ % I ^ ?iqT3ff # 51 1 a m f«I5R it # T t ^ g ^ ?«rR
«in ^ qfd 26.7 % ^m^ mK^ an^n «n i afim^t sira
^ a m ?!TcR ^ Eft (23.1%), ?qt^«T#T (21.7%) ^ f w t
(16.7%) arrfsc g ^ % 1 1985-86 % ai^rii^ W5R ^
35

1984-85 # 1,04,800 CT % 84,200 2^ ^^ «J3cft f ^^
q^t I apnf5R5 5i5T ?r JiT><r g ^ ws? "Rtcrr # T (26.2%) ?rR5it
(25.4%) ^sr^-st^ q g M (10.3%) ^ # T i (5.7%) ^ I
1985-86 ^ qfi R) 5fkR % #1:^ 1,40,500 2^ ^ 5 R
JTRT 1^ ^ 1984-85 # ^ 5 R ^ 32,200 CT ^ran^ «n 1 |5T
5«r5R ?t 91 % qjf^ wcw ^ a m |3iT ^ qti^i^ ^ 5 R ^
97.6% #isr #TT?ft tr^ ST# ^ 5|fti SFcf |i^ ^ 1 # f H<Tr?ft
^ lTitt
^ ^ ^ ^ # 5 % 20,039 OT T zW. ^«T^ frr rr i
^ p R T ^ 5ff , ^TT^ 'iTfft , ^ ^ i arrf g's^r " T ^ «ft i
3f?r?Rl^ irrB^^r M<M\^
v^ 5RT5R d'iJrr ^ 4,000 ^ ^ q^'t «ft, fsra^ "H T 5 ^ ^ §H ^ 3^5^ 1 ^ ^ ElM H^ ^ I g?5R, ftW (thryssa),
M a n ^ ^ \ ^ ^ ^ (carangids), af?: ^ ^ anf^ g ^
q^i5«ft I
^ f t W , ^5T (soles) 3nf?[ p J f ^ I ^im\t sn ff % sif^tr
^ 5 R ! , # f ^Twf # arfcrftw w^ ^M, ^^ i^
?«T5R ^ 98 .3% ^ groff, S J^R! ^ aiq^ft an T ?r
^ ^ 3T^^I ^W «ft 1 # T i , ^ J ^ anf^ # ^ 5 R H ^'Sf ^fe
| | I a m i ^ 5iT^ % a m ^ 5 R ff m\ ^^ '^ 1 z^,
5T?i % ^^ ^nm ^ 98 % #sr gcn ff ^ sm^ ^ ^ i Jim 1^ ^ I ^ ari5TRn a r i ^ 5 n ^ ^ >ft ^ # T I 5 T ^ ^ 1 %^ gqm! # sifttr jn'<T ^^n r fqs^ ^ ^ ^ 5 R % sRtqj't
srX ^^m^ ^ , 'skrw^r ^ # 5 T arrt^ sn r ^ 5 R q:
2iff ^ g ^ JT'rf f sn ff, ^5r STTCT afk ^ ^ STT I ^ 1
ST5R ?«I5R q sfs^t f^ "Tit I M a n ^ if^, ?ft "TI , ^ t ^
OTTr?«T#r 3Tlf5[ STcR ^5PT ^ gls3T 1535 ^ I ^^T sn^ l ^
^^JT sn^t ^ ^mi PT 531 5^ s ^ 96 3R ^ 5 R a m p ^ I
f5FTst arri^ 5I5R fST5R- ^ gJEq- ^ I ^ ^ s n ^ t ^ a r r ^
^ ^ HcWT ^ a m J T ^ q' 2'*^ ftrrjl, s^rftawl^ mffR
^ 3l%r ^^Jf 5qT^ «n 1 5I5R ^ 5 R fl' ^ t%| , >stm#T,
fe^, f^ # 5IPR (big jawed jumper), ^ lan^S ' gffrt,
? f t ^ , t ^ (eels) anf^ ^JSJT ^ ^ 31TWr|f snsff i ^ 5 R
% a m w^ '^tm "Trf «ffft?r ^ ^ n arrfe ^ i
GUIDE TO CONTRIBUTORS
The articles intended for publication in the MFIS should be based on actual research findings on long-term or short-term projects of the CMFRI and should be in a language comprehensible to the layman. Elaborate perspectives, material and methods, taxonomy, keys to species and genera, statistical methods and models, elaborate tables, references and such, being only useful to specialists, are to be avoided. Field keys that may be of help to fishermen or industry are acceptable. Self-speaking photographs may be profusely included, but histograms should be carefully selected for easy understanding to the non-technical eye. The write-up should not be in the format of a scientific paper. Unlike in journals, suggestions and advices based on tested research results intended for fishing industry, fishery managers and planners can be given in definitive terms. Whereas only cost benefit ratios and indices worked out based on observed costs and values are acceptable in a journal, the observed costs and values, inspite of their transitionality, are more appropriate for MFIS. Any article intended for MFIS should not exceed 15 pages typed in double space on foolscap paper.
Edited by Dr. K. J. Mathew, Mr. I. David Raj and Mr. G. S. D. Selvaraj. Published by Dr. K. J. Mathew on behalf of the Director, Central Marine Fisheries Research Institute, Cochin-682 031. Printed at PAICO, Cochin-31.


![NATIONAL MARINE FISHERIES SERVICE INSTRUCTIONS 01-101 … · NATIONAL MARINE FISHERIES SERVICE INSTRUCTIONS 01-101-03 [9/30/2015] Fisheries Management ... NMFSPD -01-101 OPERATIONAL](https://img.dokumen.tips/doc/110x75/5f0d46657e708231d4398971/national-marine-fisheries-service-instructions-01-101-national-marine-fisheries.jpg)


![NATIONAL MARINE FISHERIES SERVICE …...NATIONAL MARINE FISHERIES SERVICE INSTRUCTIONS 01-101-03 [9/30/2015] Fisheries Management Fisheries Management Actions, NMFSPD -01-101 OPERATIONAL](https://img.dokumen.tips/doc/110x75/5f0d46657e708231d4398972/national-marine-fisheries-service-national-marine-fisheries-service-instructions.jpg)