Embed Size (px)
Citation preview

An Industry Survey conducted by EY
Sponsored by the Interactive Advertising Bureau of
Canada
Published: December 10, 2018
IAB Canada 2017 Actual + 2018
Estimated Canadian Internet
Advertising Revenue Survey
DETAILED REPORT

IAB Canada 111 Peter Street, Suite 406B, Toronto, Ontario M5V 2H1
Phone 416.598.3400 • iabcanada.com
2
A. EXECUTIVE SUMMARY ................................................................................................................. 4
B. INTERNET ADVERTISING REVENUE FINDINGS - DETAILED .................................................... 6
Canadian Advertising Revenues of Top-4 Channels: Ten-year Trend 2008-17 ......................................... 6
2017 Canadian Internet Advertising Revenue, Mobile’s Contribution ..................................................... 7
2018 Canadian Internet Revenue Forecast ............................................................................................ 9
Total and French Language Advertising Revenues: Ten Year Trend 2008-2017 ................................. 10
Concentration of Internet Advertising Revenues & Growth ............................................................... 12
Revenue and Growth Trends by Advertising Vehicle/Format ............................................................. 13
Revenue Growth by Internet Ad Vehicle/Format: Past Five Years 2013-17 ........................................ 14
Share of Total & French Revenue by Vehicle/Format: Past Five Years 2013-17 .................................. 15
Mobile (+Tablet) Ad Revenues by Format ........................................................................................... 16
Percent of Internet Revenue by Advertising Category: Total Canada 2016-17 .............................. 18
C. APPENDIX: Background, Survey Scope and Methodology ............................................................ 19
D. APPENDIX: Detailed Definitions .................................................................................................. 24
ABOUT IAB CANADA ............................................................................................................... 34

IAB Canada 111 Peter Street, Suite 406B, Toronto, Ontario M5V 2H1
Phone 416.598.3400 • iabcanada.com
3
2017 represented a critical global turning point in the online advertising industry. The world’s largest
advertisers took note of the implications of digital expenditures exceeding those of any other media. As
a result, the industry was challenged to double down on practices designed to improve transparency,
eliminate fraud and drive greater value in a brand safe environment.
The industry stepped up by introducing effective tools like IAB Ads.txt to help eliminate fraud, the Open
Measurement SDK Kit to help drive consistent measurement and verification across mobile along with
several best practice tool kits developed by the IAB Canada Councils.
2017 also saw major developments in the area of Policy and Regulatory Affairs. Health Canada’s
proposed ban on marketing certain food and beverages to kids led to several presentations on the
unintended consequences of such regulation. The IAB also continued to testify to regulators on the
strength of our current Privacy legislation indicating that PIPEDA is uniquely built to support industry
innovation while respecting the privacy of Canadians through our Opt-Out regime. IAB Canada spent a
lot of time with our IAB Europe office to help provide our members with on the ground developments
regarding the GDPR.
Amidst all these challenges, we are truly pleased to see continued growth in our industry. This growth is
a testament to the power of digital media to connect brands with consumers through powerful creative
and innovative technologies. IAB Canada is proud of its active community of over 270 members who
are leaning in, with passion and commitment, to drive responsible growth of this dynamic industry.
We look forward to helping drive the Canadian Digital Media industry forward through our continued
focus on solutions-based thought leadership.
Sincerely,
Sonia Carreno
President, IAB Canada

IAB Canada 111 Peter Street, Suite 406B, Toronto, Ontario M5V 2H1
Phone 416.598.3400 • iabcanada.com
4
A. EXECUTIVE SUMMARY
2017 Full-Year Highlights and 2018 Forecast
Canadian Internet Ad Revenue continued its remarkable, double-digit growth in 2017, rising
sharply by 1.3 billion or +23% to $6.8 billion, 9% over forecast.
For the first time ever, Canadian Digital revenues now exceed the next three measured media
combined.
“While Canada’s Internet Ad Revenue maintains its rapid year-over-year growth trend, IAB Canada
continues to deliver on its commitment to provide the industry with actionable solutions designed to
establish and promote a secure supply chain. In 2018, while we continue to drive adoption of industry
leading tools to secure the supply chain, we have begun to re-focus our efforts on showcasing the
tremendous value digital advertising has to offer.”
- Sonia Carreno, President, IAB Canada
The shift to Mobile continues. Mobile, driving the Internet’s expansion on an ongoing basis,
surged 37% to $3.5 billion this year, up from $2.5 billion in 2016, accounting for almost three-
quarters of new Internet revenue in 2017.
“With Canadians spending more and more time with digital media, marketers across all industries have
come to appreciate that digital media, in all its various forms, is the most effective and cost-efficient way
to build brands and achieve direct response goals.”
- Jay Aber, President & Founder of The Aber Group Inc.
Video led overall Internet growth in 2017, rising by an unprecedented 93% (+$447 million) up
to $928 million. 2017 is the first year Video contributed a dollar volume increase as large as
either Search or Display.
Up to 2016, the two top formats of Search & Display - due to their sheer historic size, 88% last year -
consistently accounted for most of the Internet’s absolute dollar volume expansion. In 2017 however,
the contributions to dollar revenue growth, were evenly distributed among three formats: Video +$447
mil; Search +$444 mil; Display +$411 mil. Search and Display – up 34% and 10% respectively -
collectively represented 84% of total Internet revenue in 2017, down from 88% in 2016 due to Video’s
steep surge.
“Video is an incredible resource for advertisers in today’s digital age. The unprecedented growth in ad

IAB Canada 111 Peter Street, Suite 406B, Toronto, Ontario M5V 2H1
Phone 416.598.3400 • iabcanada.com
5
spend demonstrates just how effective it is in reaching and engaging consumers. Year over year we see
Canadians appetite for online video grow, and there are no signs of it slowing.”
- Eric Morris, Director, Retail, Google
French language Internet revenue jumped by +27% - much faster than total Canada – more than
surpassing the forecasted $1 billion dollar mark, reaching $1.147 billion in 2017.
As a result, French language share of Total Canada revenue edged up from 16% to 17% this year, as
forecasted. French Language percent revenue growth for Video (+94%) paralleled Video’s overall
growth in 2017. Similarly, this impacted French language Search and Display, which despite
+34%/+10% growth respectively, saw their combined share of total French revenue erode from 90% to
85% in 2017, due to Video’s surge.
Revenue share concentration among the Top-10 / Top-20 survey respondents, has been
gradually edging-up, on average over the past five years.
Top 10/20 concentration sits now at 88% / 92% respectively of all Canadian Internet Ad Revenues in
2017, versus 87%/91% last year. The 5 largest reporting revenue earners generated almost all of the
Internet growth in 2017, similar to previous years, demonstrating that the greatest gains are accruing
to the largest digital ad sellers.
Total Internet Ad Revenue Projected to rise by over $945 million to $7.7 Billion in 2018, up by
14%, with French Canada approaching $1.3 Billion (+10%).
Cautionary note: This forecast is an aggregate of projections submitted by survey respondents in the
1st and 2nd quarters of 2017. As such, it may be superseded by later marketplace developments.
Of 15 Advertiser Categories reported annually, the top-3 reported industries, consistently in the
lead since 2015, are Automotive – 18%, Retail - 16%, and Financial - 14%.
Note that share size sequence among these categories varies by year.
“Continued industry efforts to secure the supply chain and develop a transparent marketplace are critical
to the financial services category in order to continue its investment in this dynamic channel. Great
progress has been made and we are starting to see the benefits. We look forward to increased activity on
this front through IAB Canada and the industry as we look to leverage the tremendous value this channel
has to offer.”
- Monika Federau, SVP & Chief Strategy Officer, Intact Financial Corporation

IAB Canada 111 Peter Street, Suite 406B, Toronto, Ontario M5V 2H1
Phone 416.598.3400 • iabcanada.com
6
B. INTERNET ADVERTISING REVENUE FINDINGS - DETAILED
CANADIAN ADVERTISING REVENUES OF TOP-4 CHANNELS: TEN-YEAR TREND 2008-17
Internet continues dramatic double-digit annual growth (+23%),
Digital revenues now exceed the next three measured media combined.
“Digital continues to impact the way all forms of media are consumed. While expenditures indicate a
widening gap between traditional mediums, we are confident that the incredible influence of new
technologies will begin to reveal itself across all channels in the coming years as audio, and video begin
to show some stability. 2017 drove significant advancements in the area of cross-device and cross-screen
measurement. These efforts continue well into 2018 and beyond.”
- Sonia Carreno, President, IAB Canada
$1,609
$5,484
$6,771
$3,393$3,192 $3,037
$1,558
$1,525 $1,495
$3,115
$1,265$924
$0
$1,400
$2,800
$4,200
$5,600
$7,000
2008 2009 2010 2011 2012 2013 2014 2015 2016 2017
Internet
TV
Radio
Print(Np+Mg)
$ Millions
Year:
Advertising Growth Trend - Internet vs TV, Print, Radio: 2008-17Sources: IAB Canada, thinktv
restated
IAB Canada 111 Peter Street, Suite 406B, Toronto, Ontario M5V 2H1
Phone 416.598.3400 • iabcanada.com
7
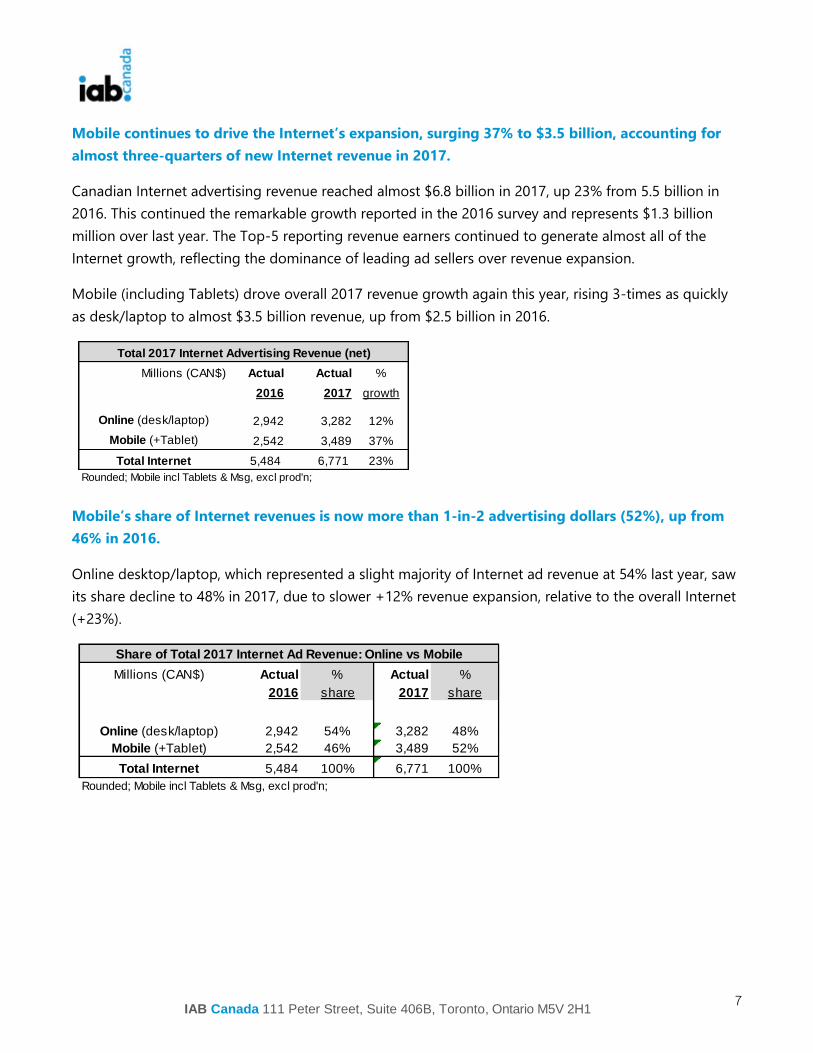
Mobile continues to drive the Internet’s expansion, surging 37% to $3.5 billion, accounting for
almost three-quarters of new Internet revenue in 2017.
Canadian Internet advertising revenue reached almost $6.8 billion in 2017, up 23% from 5.5 billion in
2016. This continued the remarkable growth reported in the 2016 survey and represents $1.3 billion
million over last year. The Top-5 reporting revenue earners continued to generate almost all of the
Internet growth, reflecting the dominance of leading ad sellers over revenue expansion.
Mobile (including Tablets) drove overall 2017 revenue growth again this year, rising 3-times as quickly
as desk/laptop to almost $3.5 billion revenue, up from $2.5 billion in 2016.
Mobile’s share of Internet revenues is now more than 1-in-2 advertising dollars (52%), up from
46% in 2016.
Online desktop/laptop, which represented a slight majority of Internet ad revenue at 54% last year, saw
its share decline to 48% in 2017, due to slower +12% revenue expansion, relative to the overall Internet
(+23%).
Millions (CAN$) Actual Actual %
2016 2017 growth
Online (desk/laptop) 2,942 3,282 12%
Mobile (+Tablet) 2,542 3,489 37%
Total Internet 5,484 6,771 23%
Rounded; Mobile incl Tablets & Msg, excl prod'n;
Total 2017 Internet Advertising Revenue (net)
Millions (CAN$) Actual % Actual %
2016 share 2017 share
Online (desk/laptop) 2,942 54% 3,282 48%
Mobile (+Tablet) 2,542 46% 3,489 52%
Total Internet 5,484 100% 6,771 100%
Rounded; Mobile incl Tablets & Msg, excl prod'n;
Share of Total 2017 Internet Ad Revenue: Online vs Mobile

IAB Canada 111 Peter Street, Suite 406B, Toronto, Ontario M5V 2H1
Phone 416.598.3400 • iabcanada.com
8
French language Internet revenue surged by +27% - much faster than total Canada - more than
surpassing the forecasted $1 billion dollar mark, reaching $1.147 billion in 2017. As a result,
share of Total Canada revenue edged up from 16% to 17% this year, also as forecasted.
Fluctuations year-to-year in French language share of Internet advertising in Canada may be an artifact
of the difficulty some major survey participants have tracking French language ad revenues.
Millions (CAN$) Actual Actual %
2016 2017 growth
Total Internet: French $900 $1,147 27%
Share (Fre/Total) 16% 17%
Rounded; excl agency com'n; Mobile incl Tablets & Msg, excl prod'n
French PC/Mobile split na (some major earners don't track it).
French Canada: 2017 Internet Advertising Revenue

IAB Canada 111 Peter Street, Suite 406B, Toronto, Ontario M5V 2H1
Phone 416.598.3400 • iabcanada.com
9
2018 CANADIAN INTERNET REVENUE FORECAST
Total Internet Ad Revenue Projected to rise by over $945 million to $7.7 billion in 2018, up by
14%, with French Canada approaching $1.3 billion (+10%).
Respondents to IAB Canada’s 2017-18 Survey have forecasted that Internet Ad Revenues will grow 14%
by the end of 2018, rising to $7.717 billion in Total Canada. This forecast includes a return to slower
growth in French language ad revenues of 10%, projected to increase to $1.262 Billion, edging its share
of Total Canada revenue down 1 point to 16%.
Cautionary note: This forecast is an aggregate of projections submitted by survey respondents in the 1st
and 2nd quarters of 2017. As such, it may be superseded by later marketplace developments, that make
it more or less certain of being achieved, or surpassed. See previous notation regarding fluctuations in
French language share.
‘’As digital devices and platforms become central to almost every dimension of everyday life for both
consumers and businesses, compounded by the technological enhancements within areas like artificial
intelligence, market research, ad tech, audio and much more we expect the Canadian industry to
continue with positive growth throughout 2018.”
- Andrew Saunders, Chief Revenue Officer Globe and Mail, Chairman, IAB Canada
Millions (CAN$) Actual Forecast %
2017 2018 growth
Total Canada $6,771 $7,717 14%
French Canada $1,147 $1,262 10%
Share (Fre/Total) 0.17 0.16
INTERNET=Online+Mobile; Mobile incl. Tablet+Messaging. Rounded.
Forecasted 2017 Total INTERNET Ad Revenue (net)

IAB Canada 111 Peter Street, Suite 406B, Toronto, Ontario M5V 2H1
Phone 416.598.3400 • iabcanada.com
10
TOTAL AND FRENCH LANGUAGE ADVERTISING REVENUES: TEN YEAR TREND 2008-2017
Canadian Internet Advertising Revenues have continued growing at double-digit rates each year
over the past decade, despite surpassing a series of revenue milestones like the $4 billion mark in
2015, the $5 billion threshold in 2016 and then accelerating as it passed the 6 billion level in
2017.
Online (desk/laptop-only) now accounts for a slight minority of Total Internet ad revenue (48% share),
as Mobile (+Tablets) continues its upward momentum (+37% growth). French language revenue has
grown at similar rates to Total Canada in past years, but was outpaced between 2014 and 2016, per
trending below, then surged ahead of Total Canada in 2017. Note: the latter may be an artifact of the
increasing difficulty some major survey participants have tracking French language ad revenues.
2008 2009 2010 2011 2012 2013* 2014 2015 2016 2017
TOTAL INTERNET restated
Total Canada:Millions ($) $1,609 $1,845 $2,279 $2,674 $3,085 $3,418 $3,793 $4,604 $5,484 $6,771
% growth/yr 29% 15% 24% 17% 15% 11% 11% 21% 19% 23%
French Cda:Millions ($) -- -- -- -- -- 650 $679 $794 $900 $1,147
% growth/yr -- -- -- -- -- -- 4% 17% 13% 27%
DESK/LAPTOP
Total Canada:Millions ($) $1,602 $1,822 $2,232 $2,593 $2,925 $2,991 $2,890 $2,984 $2,942 $3,282
% growth/yr 29% 14% 23% 16% 13% 2% -3% 3% -1% 12%
French Cda:Millions ($) $317 $352 $428 $490 $559 $578 $526 na na na
% growth/yr 22% 11% 22% 14% 14% 3% -9% na na na
MOBILE
Total Canada:Millions ($) $7 $23 $47 $81 $160 $427 $903 $1,620 $2,542 $3,489
% growth/yr 182% 248% 105% 74% 97% 167% 111% 79% 57% 37%
French Cda:Millions ($) -- -- -- -- -- 72 $153 na na na
% growth/yr -- -- -- -- -- -- 113% na na na
INTERNET = Online + Mobile; Mobile includes Tablets. Revenues exclude agency commission.
French Online/Mobile not reported separately from 2015 on, as some major earners do not track this data/unable to respond.
* 2013 restated to reflect 107 million reduction per retroactive advice by a major survey participant.
TEN YEAR GROWTH Trend of Actual INTERNET Ad Revenues: Online + Mobile 2008-2017 (net)

IAB Canada 111 Peter Street, Suite 406B, Toronto, Ontario M5V 2H1
Phone 416.598.3400 • iabcanada.com
11
Growing 3X as fast as desktop/laptop in 2017, Mobile continues to drive the expansion of
Canada’s Internet advertising revenues.
Ongoing rapid Mobile ad revenue growth is driven by the integral role of smartphones (especially) and
less so by tablets in consumers’ lives. This is exemplified by the predominance of mobile devices in
social media consumption and the migration by users from one screen to another and/or simultaneous
multi-screen use, at different times of the day.
The impact of this high annual growth rate is behind Mobile’s dramatically rising share of total
Canadian Internet ad revenue, as shown below:
427
903
1620
2542
3489
$0
$500
$1,000
$1,500
$2,000
$2,500
$3,000
$3,500
2013
restated
2014 2015 2016 2017
5-Yr Trend 2013-17: MOBILE Revenue GROWTH (+Tablet)
$ net rev -millions
Year:
% Growth: 167% 111% 79% 57% 37%
12% 24% 35% 46% 52%
0%
20%
40%
60%
80%
100%
2013
restated
2014 2015 2016 2017
5-Yr Trend 2013-17: % SHARE PC/Mobile MOBILE (+tablets)
PCpercentshare
Year:

IAB Canada 111 Peter Street, Suite 406B, Toronto, Ontario M5V 2H1
Phone 416.598.3400 • iabcanada.com
12
CONCENTRATION OF INTERNET ADVERTISING REVENUES AND REVENUE GROWTH BY SIZE OF
SURVEY RESPONDENT - REFLECTS DOMINANCE OF LEADING AD SELLERS.
Revenue share concentration has been very gradually edging up over the years, among the Top-
10 / Top-20 survey respondents.
The Top 10 Internet Advertising Earners in this survey brought in 88% of all Canadian Internet Ad
Revenues in 2017, up 1 point over 2016. The Top 20 Earners now represent 92% of total Internet
revenues in 2017, also 1 point up from last year.
The 5 largest responses to this survey generate almost all of the growth in Canadian Internet Ad
Revenues.
The 5 largest responses to this survey generated 25% annual growth in 2017 Canadian Internet Ad
Revenues, compared to 3% growth by the next 15 largest survey participants. A similar pattern is
evident in the five-year trending below, 2013-2017.
year… 2013 2014 2015 2016 2017
Internet Internet Internet Internet Internet
Top 10 Responses 82% 83% 86% 87% 88%
Top 20 Responses 89% 90% 90% 91% 92%
Total Actual Annual Internet Revenues 2013-17 (2013 restated)
Percent Total Revenue - Top 10 / 20 Responses: 2013-17
2013/12 2014/13 2015/14 2016/15 2017/16
Top 20 Survey Responses % change % change % change % change % change
- Largest 5 Responses 21% 11% 26% 22% 25%
- Next 15 Largest #6-20 7% -3% -2% 1% 3%
Total Actual Annual Internet Revenues 2013-17 versus prior year (2013 restated)
Annual Percent Revenue Change - 2013-17: Top 5 / Next-15 Responses

IAB Canada 111 Peter Street, Suite 406B, Toronto, Ontario M5V 2H1
Phone 416.598.3400 • iabcanada.com
13
REVENUE AND GROWTH TRENDS BY ADVERTISING VEHICLE/FORMAT
Video led overall Internet growth in 2017, rising by an unprecedented 93% (+$447 million) up to
$928 million. 2017 is the first year Video contributed a dollar volume increase as large as either
Search or Display did.
Up to 2016, Search & Display - due to their sheer historic size - consistently accounted for most of the
Internet’s absolute dollar volume expansion. In 2017 however, the contributions to dollar revenue
growth were evenly distributed among the three formats due to the unmatched +93% growth of Video:
Contributions to the 2017 increase were as follows: Video +$447 mil; Search +$444 mil; Display +$411
mil.
The two largest Internet formats of Search and Display collectively represented $5.686 billion in 2017 -
84% of total Internet revenue - up from 4.831 billion in 2016 (88% of total).
French Language percent revenue growth for Video (+94%) paralleled Video’s overall growth for total
Canada in 2017.
Ad Vehicles: (CAN$) 2016 2017 % 2016 2017 %
(incl Desk/laptop + Mobile) $ (millions) $ (millions) change $ (millions) $ (millions) change
Search 2,920 3,364 15% 482 531 10%
Display 1,911 2,322 22% 309 414 34%
Classified/Directories 167 145 -13% 17 25 42%
Video* 481 928 93% 91 177 94%
Email 6 12 111% 1 2 72%
Total INTERNET 5,484 6,771 23% 900 1,147 27%
* Video = Pre, Mid, Post-Roll in Videoplayer environment (excludes companion ads or In-Banner);
Videogaming merged Video/Advergaming inside Display (Sponsorship)
Native Content is reported under display
Total Canada French Canada
Total INTERNET Revenue & Percent Growth by Ad Vehicle: 2016-2017 (net)

IAB Canada 111 Peter Street, Suite 406B, Toronto, Ontario M5V 2H1
Phone 416.598.3400 • iabcanada.com
14
REVENUE GROWTH BY INTERNET AD VEHICLE/FORMAT: PAST FIVE YEARS 2013-17
For the past five years, Video has grown faster annually than the other formats.
The changes in actual dollars earned by Publishers, Ad Networks and Exchanges/SSPs for Search,
Display, Video and other Internet ad formats over time, are shown in the table below.
The changes in ad revenue by Ad Vehicle over the past five years can also be expressed as a columnar
chart, as seen below:
- ALL DEVICES - 2013* 2014 % 2015 % 2016 % 2017 %
Ad Vehicles: (CAN$) $ (millions) $ (millions) change $ (millions) change $ (millions) change $ (millions) change
Search 1802 2052 14% 2512 22% 2920 16% 3364 15%
Display 1091 1274 17% 1554 22% 1911 23% 2322 22%
Classif/Directories** 289 171 -41% 162 -5% 167 3% 145 -13%
Video 208 266 28% 358 35% 481 34% 928 93%
Email 18 19 8% 13 -32% 6 -55% 12 111%
VideoGaming*** 11 11 8% 5 -55%
INTERNET (incl Mobile) 3418 3793 11% 4604 21% 5484 19% 6771 23%
* 2013 Internet total restated by $107 mil. to reflect retroactive survey respondent change (was $3,525)
* 2013 standard format revenues projected up from Online-only base (PC) to reflect Internet base (including Mobile + Tablets)
** Class/Dir. decline in 2014 caused by significant $100million+ reduction in reported revenues by one survey participant
*** NEW for 2017: - Videogaming no longer reported separately, merged into Video+Advergaming within Display (Sponsorship)
merged in Displayinsuff icient reportable
Five Year Trend of INTERNET Ad Revenue Growth by Ad Vehicle: 2013-2017
1802
2052
2512
2920
3364
10911274
1554
1911
2322
289 171 162167 145
208
266358 481
928
18 19 13 6 12$0
$700
$1,400
$2,100
$2,800
$3,500
2013 restated 2014 2015 2016 2017
Search Display Classified/ Directory Video Email$ net rev -millions
Year:
5-Year Trend 2013-17: Total INTERNET Ad Revenue Growth By Type of Vehicle
NOTES: Class/Directories: decline in 2014 caused by significant $100million+ reduction in reported revenues by one survey participant. As of 2017: Videogaming no longer reported separately, merged into Video+Advergaming within Display (Sponsorship);

IAB Canada 111 Peter Street, Suite 406B, Toronto, Ontario M5V 2H1
Phone 416.598.3400 • iabcanada.com
15
SHARE OF TOTAL & FRENCH REVENUE BY VEHICLE/FORMAT: PAST FIVE YEARS 2013-17
Search & Display shares combined dominated 84% of Total 2017 Internet ad revenue; this
combined share was eroded down from 88% in 2016, due to Video’s steep 93% growth in 2017.
The changes in percent shares of Total Internet ad revenues earned by Search, Display, and the other
Ad Vehicles (formats) over time are shown below for Total and French Canada.
The change in share of total Internet ad revenue by Ad Vehicle over the past five years can also be
expressed as a chart – see below:
- ALL DEVICES - 2013*
Ad Vehicles: (CAN$) % TOTAL
revenue
% TOTAL
revenue
FRENCH
% Total rev
% TOTAL
revenue
FRENCH
% Total rev
% TOTAL
revenue
FRENCH
% Total rev
% TOTAL
revenue
FRENCH
% Total rev
Search 53% 54% 11% 55% 9% 53% 9% 50% 8%
Display 32% 34% 5% 34% 6% 35% 6% 34% 6%
Classifieds/ Directories** 8% 5% 1% 4% 0% 3% 0% 2% 0%
Video 6% 7% 1% 8% 1% 9% 2% 14% 3%
Email 1% 1% 0% 0% 0% 0% 0% 0% 0%
VideoGaming*** 0% 0% 0% 0% 0%
INTERNET (incl Mobile) 100% 100% 18% 100% 17% 100% 16% 100% 17%
* 2013 Internet total restated to reflect retroactive survey respondent change Note: percentages rounded
* 2013 standard format revenues projected up from Online-only base (PC) to reflect Internet base (including Mobile + Tablets)
** Class/Dir. decline in 2014 caused by significant $100million+ reduction in reported revenues by one survey participant
*** NEW for 2017: - Videogaming no longer reported separately, merged into Video+Advergaming within Display (Sponsorship)
merged in Displayinsuff icient reportable
2014 2015 20172016
Share of Total INTERNET Revenue By Advertising Vehicle: 5-year Trend 2013-17
53%54% 55% 53%
50%
32%34% 34% 35%
34%
8%5% 4% 3% 2%
6% 7%8%
9%
14%
05.% 0.5%
0%
15%
30%
45%
60%
2013 restated 2014 2015 2016 2017
Search Display Classified/Directory Video Email
Percent Share of Total Canadian INTERNET Ad Revenue By Ad Vehicle: 2013-17
% share
Year...
0.3% 0.1% 0.0%
NOTES: Class/Directories:decline in 2014 caused by significant $100million+ reduction in reported revenues by one survey participant. As of 2017: Videogaming no longer reported separately, merged into Video+Advergaming within Display (Sponsorship);

IAB Canada 111 Peter Street, Suite 406B, Toronto, Ontario M5V 2H1
Phone 416.598.3400 • iabcanada.com
16
MOBILE (+TABLET) AD REVENUES BY FORMAT
A similar pattern is at work in Mobile. Search and Display represented 90% of Mobile revenues in
2016, but Video’s steep 123% growth built its share from 9% to 15%, eroding the former’s
combined share to 85% in 2017.
The change in share of total Mobile ad revenue by Ad Vehicle over the past two years can also be
shown as a pie chart:
Revenue
Mobile (+Tablet) Total Canada % Chge
Ad Vehicles (CAN$) 2015 % Total Mbl 2016 % Total Mbl 2017% Total Mbl 2017/16
$ (millions) revenue $ (millions) revenue $ (millions) revenue
Mobile Search 873 54% 1,230 48% 1,770 51% 44%
Mobile Display 631 39% 1065 42% 1175 34% 10%
Mobile Video 106 7% 227 9% 507 15% 123%
Mobile - Other* 10 1% 20 1% 37 1% 84%
Total MOBILE 1,620 100% 2,542 100% 3,489 100% 37%
*Mobile-Other = Performance + Messaging; Rounded to nearest integer.
MOBILE Advertising Revenue by Ad Vehicle: 2015-17 (net)
48%
42%
9%
1%
Mobile Percent Share by Format: 2016
MobileSearch
MobileDisplay
MobileVideo
MobileOther
51%
34%
15%
1%
Mobile Percent Share by Format: 2017

IAB Canada 111 Peter Street, Suite 406B, Toronto, Ontario M5V 2H1
Phone 416.598.3400 • iabcanada.com
17
The Ratio of Mobile to Online (desk/laptop) revenues varies only slightly by Ad Vehicle/Format.
Just as Mobile has grown overall to 52% of Total Internet revenue - relative to Online’s 48% - the Ratio
of Mobile revenues to Online within the individual formats ranges only 1-3 percentage points above or
below the average, with Video on the “high side” at 55% and Display below the average at 51%.
45%
49%
47%
48%
55%
51%
53%
52%
Video 2017
Display 2017
Search 2017
INTERNET '17
Percent Online/Mobile RATIO by Format:Total Canada - 2017
Online Mobile

IAB Canada 111 Peter Street, Suite 406B, Toronto, Ontario M5V 2H1
Phone 416.598.3400 • iabcanada.com
18
PERCENT OF INTERNET REVENUE BY ADVERTISING CATEGORY: TOTAL CANADA 2016-17
Of 15 Advertiser Categories reported annually, the top-3 reported industries, consistently in the
lead since 2015, are Retail, Automotive and Financial (the order varies by year)
In 2017, Automotive leads at 18% of total Internet ad revenue, followed by Retail (14%) and then by
Financial (12%). In combination they accounted for almost 45% of Internet ad revenue, based on
reporting revenue earners. The percent distribution of total Canadian Internet Advertising Revenue by
major product/service category for 2017 is graphically expressed in the following pie chart:
Automotive, 18%
Financial, 12%
Pharma, 4%
Leisure Travel
6%
Entertain-ment,
6%
Media, 2%
Packaged Goods,
7%
Retail, 14%
Technology, 2%
Telecom, 7%
Bevg Alcohol,
1%
Govt, 3%
Other, 8%
RealEstate,
3%
Business Travel, 1%
Bus./ Industrial,
5%
% Canadian INTERNET Ad Revenues by Major Product Category: 2017
Total Canada; Based on companies answering this question.
IAB Canada 111 Peter Street, Suite 406B, Toronto, Ontario M5V 2H1
Phone 416.598.3400 • iabcanada.com
19
C. APPENDIX: BACKGROUND, SURVEY SCOPE AND METHODOLOGY
Background: About IAB Canada’s 2017-18 Canadian Internet Advertising Revenue Report
First commissioned in 1998 by the Interactive Advertising Bureau of Canada (IAB), this marks the 20th
consecutive year that Canadian Internet Advertising Revenues are being reported.
The results of IAB Canada’s Annual Canadian Internet (Online & Mobile) Advertising Revenue Surveys
are widely considered the most accurate measurement of Interactive advertising revenues for Canada.
The data is compiled directly from information supplied by Publishers who sell advertising on Canadian
Websites. Also polled are search, social and video sharing Content Platforms plus Online / Mobile Ad
Networks and Exchanges/SSPs that sell advertising on both the Canadian and U.S./other foreign
Websites they represent to reach Canadians.
IAB Canada retains EY LLP to oversee the revenue studies. Results of individual respondent submissions
are held in strict confidence under EY oversight and are released in aggregate form only.
It should be noted that EY LLP does not formally audit the information supplied by participants in their
Survey responses, and provides no opinion with respect to the information submitted.
The technical summary that follows in this appendix contains basic Survey Methodology and the
Definitions of the various Online/Mobile Advertising Vehicles (ad formats, programmatic transaction
types), and Advertiser product/service categories reported on.
Martin Lundie
Canadian Media and Technology Leader
Ernst & Young LLP
IAB Canada 111 Peter Street, Suite 406B, Toronto, Ontario M5V 2H1
Phone 416.598.3400 • iabcanada.com
20
Survey Scope & Methodology
The Canadian Internet Advertising Revenue Report is a big part of IAB Canada’s ongoing mission to
provide an accurate barometer of Digital advertising growth in Canada.
IAB Canada has retained EY LLP to jointly establish, maintain and continuously update comprehensive
Survey standards for measuring the growth of Online and Mobile advertising revenues in Canada.
To achieve and sustain industry-wide acceptance, key aspects of IAB Canada’s Annual Canadian Internet
Advertising Revenue Surveys include:
• Making the Survey as inclusive as possible, encompassing direct data results from companies
engaged in digital media ad sales on the supply-side of the business. These include Canadian
Internet Publishers who sell advertising on Canadian Websites. Also included are search, social
and video sharing Content Platforms as well as Ad Networks and Exchanges/SSPs who sell
advertising on both Canadian and U.S./other foreign websites to reach Canadians. Mobile
Aggregators, Mobile Marketing companies and Platforms offering Mobile advertising solutions
are also polled.
o Agencies, Trading Desks and DSPs with no supply-side involvement do NOT participate
in this survey. Vendors engaged in both SSP and DSP transactions must only report their
SSP-related revenues, NOT their DSP-related revenues.
• Ensuring and maintaining a confidential process, both in terms of methodology, and in terms of
releasing only aggregate data; and analyzing historical data from within the Survey, to identify
broader trends over time.
Survey Methodology
EY LLP and IAB Canada work jointly, with input from the IAB Revenue Committee to:
• Compile a database of potential revenue earners to survey annually, in relation to Online and
Mobile advertising revenues, in both the Total and French Canada markets;
• Conduct an annual quantitative, web-served Survey with the above industry players; note that
Publisher surveys previous to 2013 were conducted through the mail (Canada Post)
• Acquire supplemental data through the use of publicly-disclosed information.
• Request and compile several specific data items from digital media vendors
• These include total annual Gross Advertising Revenue (excluding agency commission) and total
annual Net Advertising Revenue.
IAB Canada 111 Peter Street, Suite 406B, Toronto, Ontario M5V 2H1
Phone 416.598.3400 • iabcanada.com
21
• The Netting-down procedure: Net Revenue is calculated by subtracting the following from the
Gross figure: (a) Publisher Revenues derived from Ad Networks and Exchanges/SSPs (b) Ad
Network/ Exchange/SSP Revenues derived from other Ad Networks and Exchanges/SSPs, (c) Mobile
Carrier fees (as applicable). In other words, media advertising sellers are requested to report net
revenues earned only from direct sales transactions between themselves and the advertisers and/or
the advertisers’ media agencies and/or the latters’ Trading desks/DSPs. This is to help ensure no
double-counting of ad revenues occurs.
• Annual Net Internet Revenues are requested to be broken down by Advertising Vehicle (i.e. Display,
Search, Classified, Video etc) along with a percentage breakdown for each Vehicle based on English
and French Canada. Annual Net Mobile (+Tablet) Revenues are also requested separately, to be
broken down by Advertising Vehicle and by programmatic transactions. Acceptability for reporting
determined by EY.
• Percentage breakdown of Annual Net Revenues is also requested across sixteen (16) different
Advertiser product/service categories that sum back to 100% of the Net Revenue reported by
respondents answering this question; examples include Automotive, Financial, Technology, etc.
• Identify incomplete responses from actual respondent returns and apply a conservative revenue
estimate for missing answers.
• Identify non-participating revenue earners, and apply a conservative revenue estimate for these
companies, based on available public sources.
• Report the aggregate findings of the Survey, and report key trends within the Survey responses.
Confidentiality Procedure
All the information submitted by respondents within IAB Canada’s annual Canadian Internet
Advertising Revenue Surveys is completely confidential, due to the “double-blind” data collection
methodology that is rigorously employed by IAB Canada and EY LLP.
IAB Canada’s role:
• Identify industry participants who sell Internet advertising;
• Assign a unique, non-identifying, anonymous, alpha-numeric code to potential Survey
participants;
• Send out Survey invitations by email to these potential participants, including (i) a non-

IAB Canada 111 Peter Street, Suite 406B, Toronto, Ontario M5V 2H1
Phone 416.598.3400 • iabcanada.com
22
traceable generic link to access the survey and (ii) a confidential anonymous code that is
unique to each media seller, in order to log-in to the survey.
• Report on the results of the Survey, as tabulated and reported in aggregate by EY LLP or
external financial accounting resources under its direction.
Double-Blind Methodology
• Internet Publishers/Ad Networks/Exchanges-SSPs/Mobile aggregators etc to be surveyed are
derived from IAB Canada Member lists, from comScore’’s AdFocus list (a list of Web properties
selling digital advertising in Canada) and from members of the IAB Revenue Methodology
Committee.
• Each Internet Publisher/Ad Network/Exchange-SSP/Mobile aggregator etc selected for
surveying is assigned a unique alpha- numeric code that only the IAB Canada President and
Research Director are aware of, and sent a Survey invitation by email, containing a non-
traceable generic link to the survey and unique alpha-numeric codes for each participant to
log-in.
• Once completed by a respondent, the secure online survey platform automatically sends
notification of this to EY LLP and IAB Canada (no data). The data from each completed survey is
aggregated in the online survey system database, with access restricted to Martin Lundie of EY
or an external financial accounting resource under his direction.
• Once all the Surveys are in, the responses are averaged and extrapolated by segment to the
total Canadian Internet advertising market. NOTE: Respondent data cannot be traced back to
its origin within the survey platform.
• Aggregated Canadian market totals are sent to the IAB Canada President and Research Director
for verification, and then presented to the IAB Canada Board for final approval. The IAB Board
confirms that the Survey methodology is sound and the tabulations are correct, and votes to
approve the publication of the Revenue Survey numbers.
• Report detailing final Survey actuals and respondents’ estimated next year’s Canadian Internet
Advertising Revenues (for both English and French markets) is created. The Report also includes
estimates of percent revenues by Advertising Vehicle (i.e. Display, Search, Mobile, Video,
Classifieds, etc.), device (Online vs Mobile) and by Advertiser Category (Automotive, Financial,
Technology, etc.).

IAB Canada 111 Peter Street, Suite 406B, Toronto, Ontario M5V 2H1
Phone 416.598.3400 • iabcanada.com
23
Industry Survey and Report Guidance Provided to IAB Canada
Internet Revenue Methodology Committee
This specially-convened annual member committee, representing a cross-section of Canada’s leading
Internet ad revenue earners (as defined earlier in this document), as well as selected ad agencies with
trading desks, was created to recommend and oversee updates to IAB Canada’s Annual Canadian
Internet Advertising Revenue Survey distribution lists and questionnaire design, when/as needed, in
response to changing conditions within the Canadian Internet advertising marketplace.
Contents of following Section: Detailed Definitions of Advertising Vehicles (Formats) and
Advertiser Categories: 2017-18
Section A: 2017-18 Definitions of Internet Advertising Vehicles (Formats)
Section B: 2017-18 Definitions of Mobile (+Tablet) Advertising Vehicles (Formats)
Section C: 2017-18 Definitions of Leading Industry Categories
IAB Canada 111 Peter Street, Suite 406B, Toronto, Ontario M5V 2H1
Phone 416.598.3400 • iabcanada.com
24
D. APPENDIX: DETAILED DEFINITIONS
SECTION A – Definitions of INTERNET Advertising Vehicles/Formats: 2017-18
Includes revenue from ALL Devices: i.e. Desktop/laptop Computer, Mobile, Tablets & Other
Connected Devices - EXCLUDES Production, eCommerce
Introduction:
This survey is meant only for companies involved in the SELLING/supply-side of the Internet media
advertising space business. For details refer to page 1.
What We Mean By “NET Revenue”:
To ensure there is NO duplication of reported ad revenues between Publishers, Ad Networks or
Exchanges/SSPs (SSP = supply-side platforms), ONLY report revenues that you earned from DIRECT
SALES of your own advertising inventory or inventory you sold on behalf of a 3rd party. These consist of
DIRECT TRANSACTIONS between your company and the ADVERTISERS themselves and/or their Media
AGENCIES and/or their TRADING DESKS/DSPs. REPORT 100% of any DIRECT SALES revenue you earn.
Do NOT subtract the cost-of-sale; i.e. revenues you paid back to an original (3rd party) vendor for
selling their inventory”. (Contact Steve Rosenblum, Research, with questions:
The INTERNET Advertising Formats:
Standard/Rich Media Display Advertising (CPM, CPE* only) –
Advertiser pays an Internet Publisher or Ad Network/Exchange for space to display the following:
(a) STANDARD - hyper linked text, banner, big‐box, skyscraper, button, or other basic unit (can
animate, contain Flash or utilize HTML5), on one or more of the Publishers’ Web pages.
(b) Revised!! RICH MEDIA - hyper linked banner, bigbox, skyscraper, expanding or floating ad, etc., that
contains user interaction functionality of various types allowing interaction with products or services
(including the ability to fill out forms, play games, expandable mouse-over areas for more info, clicking
within the ad for a “virtual test-drive” etc.) and/or Video or XML ad content (e.g. In-Banner Video
executions), as opposed to solely animation. All IAB Rising Stars ad formats are considered Rich Media;
so are Interstitials (i.e. full/partial-page server-push ads appearing in the transition between two pages
of content) or overlays (appearing over top of the page). Digital audio ads that appear before, during
or after streaming audio content, as well as video ads unaccompanied by other video content (i.e. Out-
stream – in the page feed, not in videoplayer) are also considered rich media.

IAB Canada 111 Peter Street, Suite 406B, Toronto, Ontario M5V 2H1
Phone 416.598.3400 • iabcanada.com
25
* Note: CPE = Cost per Engagement
Not included: Video Pre, Mid, Post-roll etc (i.e. In-Stream Video) in a Video-player environment should
be entered in the Digital In-Stream Video section - NOT Rich Media.
Revised Sponsorship / Contest / Advertorial / Advergaming Advertising (Flat Fee) –
An Advertiser sponsors part or all of a targeted Internet Publisher Website, usually existing content
(e.g., entire Website, site area, an event, etc.). Sponsorships may contain a Display advertising
component (e.g. banners, pre-roll, etc), but are usually negotiated on a flat fee basis.
Contests/Advertorials are custom branded sponsorships created for the Advertiser, and often contain
listing fees, as well as net contest/microsite creation revenue. Advergaming can range from an
advertiser buying all the ad units around a game or a “sponsored by” link, to creating a custom
branded game experience.
Direct Response / Lead Generation Performance Advertising (CPC, CPA*, CPLead only) –
Fees Advertisers pay to Internet Publishers that refer qualified purchase inquiries/potential customers
(e.g., auto dealers which pay a fee in exchange for receiving a qualified purchase inquiry over the
Internet) or provide consumer information (demographic, contact, behavioral), where the consumer
opts into being contacted by a marketer (email, postal, telephone, fax). These processes are priced on
a performance basis (e.g., cost-per-action, cost-per-lead or cost-per-inquiry), and can include user
applications for service (e.g., applying for credit card, mortgage or insurance), surveys, contests or
registrations.
* Note: CPA = Cost per action/acquisition
NOTE - In final report: Display = Standard/Rich Media Display, Sponsorship + Direct Response
(sum of all the above).
Digital In-Stream Video Advertising (CPM, CPV, CPCV* only) –
Pre-, Mid-, Post-Roll TV-like advertisements that may appear as Video commercials or before, during,
and/or after a variety of streaming video content or on a Standalone basis, in an actual Video-player
environment ONLY, including but not limited to streaming Video, animation, gaming, and music Video
content. Video overlays contained within the video-player are also categorized as digital video ads.
This definition includes Digital INstream Video commercials that appear in live, archived and
downloadable / streaming content.
Video overlays include small ads that appear on top of digital video content. They can appear to be
display, video, rich media, text or another ad format but are contained within the video player.

IAB Canada 111 Peter Street, Suite 406B, Toronto, Ontario M5V 2H1
Phone 416.598.3400 • iabcanada.com
26
NOTE: DO NOT include companion ad revenue or In-Banner ad revenue, unless your Digital Video
package is sold in such a way that you cannot separate the revenue (i.e. please DO NOT record
companion ad revenue in both Video & Display). DO NOT include revenue from Video within in-
banner executions (i.e. not in a player) in this category, as it is covered in the Standard/Rich Media
Display Advertising section above.
* Note: CPV = Cost per View / CPCV = Cost per Completed View
New Streaming Digital AUDIO Advertising – expanded description, see Rich Media inclusions.
Refers to partially or entirely advertising-supported audio programming available to consumers on a
streaming basis, delivered via the wired and mobile Internet. This includes advertising served in a wide
range of services, such as the following:
• Online audio streams of terrestrial radio stations;
• Purely online radio stations, with either professional or amateur DJs;
• Personalized (i.e., without human editors/DJs) and on-demand, streamed audio services that
create playlists based on user preferences of artists, tracks, or genres;
• Music or spoken word audio content delivered within a different website or application, e.g., in-
game music services, podcast.
Search Advertising
Fees advertisers pay Internet Publishers to list and/or link their company site/domain name to a
specific search word or phrase via paid listings or contextual search.
Search categories include:
• Paid listings – Text links appear at the top, bottom or side of search engine’s results for specific
keywords. The more a marketer pays, the higher the position it gets. Marketers only pay when a
user clicks on the text link.
• Contextual search – Text and image ads appear in an article on a Publisher’s site, based on the
context of the content. Marketers only pay when the link is clicked.
Note: EXCLUDES SEO (search engine optimization) techniques, that can be used to make a website
‘search engine friendly’, in order to improve the site’s ranking in search engine results pages (SERPs).
Banner ads, links or advertiser sponsorships that appear in Internet Publisher’s e-mail newsletters, e-

IAB Canada 111 Peter Street, Suite 406B, Toronto, Ontario M5V 2H1
Phone 416.598.3400 • iabcanada.com
27
mail marketing campaigns and other commercial e-mail communications. Includes all types of
electronic mail (e.g., basic text or HTML-enabled).
Classifieds / Auctions
Revenues that Internet Publishers receive to list specific advertiser products or services (e.g. Internet
job boards and employment listings, real estate listings, automotive listings, personals listings,
business to business, auction-based listings and merchandise). NOTE: please DO NOT include e-
commerce revenue.
Directories
Revenues that Internet Publishers receive to list specific advertiser products or services on city sites,
yellow or white pages, etc.
NOTE - In final report: Classifieds / Directories = Classifieds / Auctions + Directories (summe

IAB Canada 2 St. Clair Avenue West, Suite 602, Toronto, Ontario M4V 1L5
Phone 416.598.3400 • iabcanada.com
28
SECTION B - Definitions of MOBILE Platform Ad Vehicles/Formats: 2017-18
NOTE – INCLUDES Mobile + Tablets; EXCLUDES Computers (desk/laptop) or Other
Connected Devices - EXCLUDES any Production or eCommerce
Introduction: This survey is meant only for companies involved in the SELLING/supply-side of
the Internet media advertising space business. For details refer to page 1.
Definition of Mobile:
Advertising tailored to and delivered through wireless mobile devices such as smartphones
(e.g. iPhone, Android, Blackberry), feature phones (i.e.. lower-end mobile phones capable of
accessing mobile content), and tablets (e.g. iPad, Samsung Galaxy Tab). Typically taking the
form of static or rich media display ads, text messaging ads, search ads, or audio/video spots,
such advertising generally appears within mobile websites (i.e. websites optimized for viewing
on mobile devices), adaptive or responsive sites (i.e. which adjust correctly to fit the screen of the
device it's being served on), mobile apps (i.e. applications for Smartphones or Tablet devices
running iOS, Android, Windows Mobile or other operating systems), text messaging services
(i.e. SMS, MMS) or within mobile search results (i.e., 416 listings, directories, mobile-optimized
search engines).
What we mean by “NET’ Revenues”:
To ensure there is NO duplication of reported revenues, ONLY report Mobile (+Tablet) ad
revenues that you earned from DIRECT SALES of your own advertising inventory or inventory
you sold on behalf of a 3rd party; i.e. ACTUAL Insertion Orders issued DIRECTLY to your
company by the ADVERTISERS themselves and/or their Media AGENCIES, and/or their Trading
Desks / DSPs. Report 100% of any DIRECT SALES revenue you earn. Do NOT subtract the cost-
of-sale; i.e. revenues you paid back to an original (3rd party) vendor for selling their inventory”.
(Contact Steve Rosenblum, Research Director with any questions,
The 4 FORMATS that make-up the Mobile (+Tablet) Advertising Platform:
Mobile Platform Spend By Format = Mobile Display/Sponsorship + Mobile Search + Mobile Video
+ Mobile Other (i.e. Mobile Messaging + Mobile Performance)
Mobile advertising formats include: ‘Display/Sponsorship’ (banner ads, digital audio,

IAB Canada 2 St. Clair Avenue West, Suite 602, Toronto, Ontario M4V 1L5
Phone 416.598.3400 • iabcanada.com
29
sponsorships, and rich media), ‘Search’, ‘Video’ and ‘Other’ advertising served to mobile and
tablet devices. Mobile revenues include Tablets; Tablet revenues include all advertising served
on Tablet devices, including Apps & Websites. Production excluded.
1) Mobile DISPLAY/SPONSORSHIP Advertising Revenue (Standard/Rich Media;
Sponsored App, Game, "Push" e.g. location-based etc) – CPM/Flat fee only
Mobile Display/Sponsorship advertising consists of advertising served specifically to mobile
devices on Mobile Optimized sites (e.g. m., .mobi, /mobile), Responsive sites or within Mobile
Applications (such as on News and Weather or within Mobile Games). Please EXCLUDE
Production Revenues for the development of Mobile Content or Mobile-only/Tablet-only
Applications, if any.
Here we include all revenues received for:
• Standard Display ads (Banners; Interstitial or Full-page ads; Mobile Flyers; etc.);
• Sponsorship ads (this includes Sponsored “push” notifications e.g. date, contextual or
location-based notifications; Sponsored Apps, Games, etc. “brought to you by…”).
• Revised - Rich-media ads (i.e. expandables, take-overs etc., and/or in-banner video
executions, as opposed to solely animation). Display-related ads on a page (that are not
in a player) which contain video are considered Rich Media Ads. Digital audio is also
included.
For a full description of Standard Display, Rich Media, Sponsorship and Audio, see Section A.
Included in Mobile Display/Sponsorship Revenue: CPM/Flat Fee revenues only
Not Included: In-Stream Video Advertising in a video-player environment (pre, mid, post-roll,
which are considered Digital Video Ads, NOT Rich Media. Mark-up by ad Agencies (gross); Ad
creation/production revenues; End-user data charges.
2) Mobile SEARCH Advertising Revenue
In this category, include all revenues received for Paid Search advertising directed specifically at
Mobile devices. See Section A for details.
Not Included: Mark-up by ad Agencies (gross); Search Ad creation/production revenues; Search

IAB Canada 2 St. Clair Avenue West, Suite 602, Toronto, Ontario M4V 1L5
Phone 416.598.3400 • iabcanada.com
30
Engine Optimization (SEO) revenues.
3) Mobile IN-STREAM VIDEO Advertising Revenue (Pre/Mid/Post-roll etc) –
CPM/CPV/CPCV-only
Mobile Video advertising consists of Video Pre/Mid/Post-roll and Standalone video
commercials in a video-player environment, served specifically to mobile devices on Mobile
Optimized sites, Responsive sites or within Mobile Applications.
Video Overlays are also categorized as Digital Video Ads. Video overlays include small ads that
appear on top of digital video content. They can appear to be display, video, rich media, text or
another ad format but are contained within the video player.
Not Included: Mark-up by ad Agencies (gross); Video creation/production revenues; End-user
data charges; Companion ad revenue or In-Banner ad revenue, unless your Digital Video
package is sold in such a way that you cannot separate the revenue (i.e. please DO NOT record
companion ad revenue in both Video & Display); Video revenue from within in-banner
executions (i.e. not in a player), which are considered Rich Media.
4) Mobile OTHER Advertising Revenue: Messaging, Performance
A. Mobile MESSAGING (SMS, MMS, Bluetooth, IVR) Advertising Revenue
Revenue generated from Mobile advertising/marketing campaigns that promote a product or
service via Messaging delivered to and from short-codes/long-codes. This encompasses
standard, zero-rated and premium-rated Messaging. When counting revenue for Mobile
Messaging campaigns, the goal is to calculate the total amount of money that the brand is
spending on the Mobile Messaging campaign, which could include premium Messaging
revenue from consumers that is used to offset these costs.
Included in Mobile Messaging Revenue: Campaign set-up and operating fees; Short code fees;
Transactional fees charged to the brand (Message, hosting and maintenance) or to consumers
(premium end-user Message fees).
Not Included: Mark-up by ad Agencies (gross); Mobile Messaging production revenues; Contest
prizing or redemption charges; Mobile Content (e.g. Ringtones, Wallpapers, etc.).
Note: For Carriers completing the Survey: Please do not count any revenue generated on cross-
IAB Canada 2 St. Clair Avenue West, Suite 602, Toronto, Ontario M4V 1L5
Phone 416.598.3400 • iabcanada.com
31
Carrier Short-code/long-code programs, as this will be captured by the Mobile marketing
providers
B. Mobile PERFORMANCE Advertising Revenue – (e.g. QR codes) – CPC, CPA, CPLead only
Fees Advertisers pay to Digital or Mobile Publishers that are priced on a Mobile performance
basis (e.g. cost-per-click, cost-per-action, cost-per-download, cost-per-lead or cost-per-
inquiry), and can include user applications for service (e.g., applying for credit card, mortgage
or insurance), surveys or registrations. They can also refer to qualified purchase inquiries (e.g.
auto dealers which pay a fee in exchange for receiving a qualified purchase inquiry via Mobile)
or provide consumer information (demographic, contact, behavioral), where the consumer opts
into being contacted by a marketer (alerts, SMS, email, postal, telephone, fax).
Included In Mobile Performance Revenue: CPC, CPA, CPLead only;
Not Included: Mark-up by ad Agencies (gross); Production revenues;

IAB Canada 2 St. Clair Avenue West, Suite 602, Toronto, Ontario M4V 1L5
Phone 416.598.3400 • iabcanada.com
32
SECTION C - Definitions of Leading Industry Advertiser Categories: 2017-18
The product and service categories in IAB Canada’s Internet Advertising Revenue Surveys are
consistent with those used by the U.S. IAB for its Internet Revenue Study. The categories were
drawn from the North American Industry Classification
System (NAICS), which is an index of types of business establishments with corresponding
descriptions, developed jointly by the U.S, Statistics Canada and Mexico to allow comparability
in business statistics among the North American countries.*
Alcoholic Beverages – includes fermented and distilled alcoholic beverages; i.e. Beer/Ale, Wine
and Liquor.
Automotive – includes all automotive-related categories including sale/purchase of vehicles
and parts and maintenance.
Business & Industrial – products and services, this also includes manufacturing *
Consumer Packaged Goods – includes packaged goods, food products, household products,
toiletries and tobacco.
Entertainment – includes film, music, TV, box office, video games and amusement & recreation.
Financial Services – includes commercial banks, credit agencies, personal credit institutions,
consumer finance companies, loan companies, business credit institutions and credit card
agencies. Also includes companies engaged in the underwriting, purchase, sale or brokerage of
securities and other financial contracts.
Government, Social, Political Organizations – includes federal, provincial, and local government
departments/agencies that administer, oversee and manage public programs; social and
political organisations including unions and political parties, charities, educational institutions
and services.*
Leisure Travel – includes travel, hotel, airlines and resorts.
Business Travel – includes travel, hotel, airlines and resorts.
Media – includes establishments primarily engaged in radio and television broadcasting
(network and station) including commercial, religious, educational and other radio or television
IAB Canada 2 St. Clair Avenue West, Suite 602, Toronto, Ontario M4V 1L5
Phone 416.598.3400 • iabcanada.com
33
stations. Also includes establishments primarily engaged in publishing newspapers, periodicals
and books.
Pharma & Healthcare – includes pharmaceutical and medicine manufacturing of prescription
and non-prescription/ generic and brand drugs/remedies; healthcare and social assistance
including offices of health practitioners, home health care services/other ambulatory services,
medical/diagnostic laboratories, nursing/residential care facilities, community care facilities for
the elderly. Also includes personal care, toiletries and cosmetic products.
Real Estate – includes establishments primarily engaged in managing real estate for others;
selling, renting and/or buying of real estate for others; and appraising real estate.
Retail – includes mail order/catalog and stores for apparel, restaurants/fast food, home
furnishings/textiles, toys/ games, pet food/supplies, appliances, jewelry, drug / cosmetics
stores, sporting / athletics goods retailers.
Consumer Electronics & Computers – includes hardware (computers, computer storage devices,
and computer peripheral equipment), consumer electronics, prepackaged software (operating,
utility and applications programs), local area network systems and network systems integration,
computer processing and data preparation and data processing services.
Telecommunications – includes point-to-point communications services, including telephone
voice and data communications, two-way mobile/cellular communications services and other
non-vocal message communications services (e.g., cablegram, electronic mail and facsimile);
includes multi-channel video providers on a subscription fee basis (e.g., cable television,
wireless cable television and direct broadcast satellite services) including ISPs.
Exceptions: The 2 classifications “Government, Social, Political Organizations” and “Business &
Industrial” are consistent with the definitions used by the IAB/PWC UK revenue surveys. Also -
Other NAICS definitions above are augmented by IAB/PWC revenue surveys in the US/UK.

IAB Canada 2 St. Clair Avenue West, Suite 602, Toronto, Ontario M4V 1L5
Phone 416.598.3400 • iabcanada.com
34
ABOUT IAB CANADA
Who We Are
The Interactive Advertising Bureau of Canada (IAB Canada) is the national voice and thought
leader of the Canadian interactive marketing and advertising industry. We are the only trade
association exclusively dedicated to the development and promotion of the digital marketing
and advertising sector in Canada.
As a not-for-profit association, IAB Canada represents over 250 of Canada’s most well-known
and respected advertisers, ad agencies, media companies, service providers, educational
institutions and government bodies. Our members represent a diverse range of stakeholders in
the rapidly growing Canadian digital marketing and advertising sector, and include numerous
small and medium sized enterprises.
What We Do
As the only organization fully-dedicated to the development and promotion of
digital/interactive advertising in Canada, IAB Canada works with its members to:
• Conduct original, Canadian digital/interactive research;
• Establish and promote digital/interactive advertising standards & best practices;
• Build human capital, through educational courses, certification, our job board, and other
initiatives that assist the industry in attracting, training and motivating human
resources;
• Act as an advocate for the Canadian digital/interactive advertising industry to the
Canadian government; and,
• Organize networking events that enhance communication between members.
IAB Canada & IAB Worldwide
IAB Canada is an independently-organized and operated organization, and is neither owned,
controlled nor operated by any other Interactive Advertising Bureau, Inc. and all trademarks and
names are used under license.

IAB Canada 2 St. Clair Avenue West, Suite 602, Toronto, Ontario M4V 1L5
Phone 416.598.3400 • iabcanada.com
35
IAB Canada and global IABs work together closely on major projects and endeavours, but each
country requires individual memberships. Click here for more about IAB Canada and about IAB
Globally that IAB Canada fully endorses.
For Any Inquiries about the report, please contact:
Sonia Carreno, President, IAB Canada
416-598-3400, x206, [email protected]
Steve Rosenblum, Director of Research, IAB Canada
416-598-3400, x203, [email protected]