Embed Size (px)
DESCRIPTION
I st Latin America and the Caribbean Regional Workshop San José Costa Rica Mayo 2003. LA-06. Climate change Water resources Extreme events. Assessment of some GCM’s features and Applications of Downscaling in the Central American Region. Eric J. Alfaro and Jorge A. Amador - PowerPoint PPT Presentation
Citation preview

Ist Latin America and the Caribbean Regional Workshop
San José Costa Rica Mayo 2003
LA-06Climate changeWater resourcesExtreme events

Assessment of some GCM’s features and Applications Assessment of some GCM’s features and Applications of Downscaling in the Central American Regionof Downscaling in the Central American Region
Eric J. Alfaro and Jorge A. Amador
Center for Geophysical Research (CIGEFI), Department of Atmospheric, Oceanic and Planetary Physics, (LIAP, School of Physics),
Collaborators:Werner Stolz, IMN and CIGEFI-UCR
Erick Rivera, CIGEFI-UCRMauricio Blanco, CIGEFI-UCR
University of Costa Rica27-30, May 2003

Downscaling, Why?• It is justified whenever GCM (or RCM) simulations of
variable(s) used for impacts modelling are unrealistic at the temporal and spatial scales of interest, either because the impact scales are below the climate model’s resolution, or because of model deficiencies. At the same time the GCM must have demonstrable skill for large-scale variables that are strongly correlated with local processes. (Wilby & Dawson, 2001).
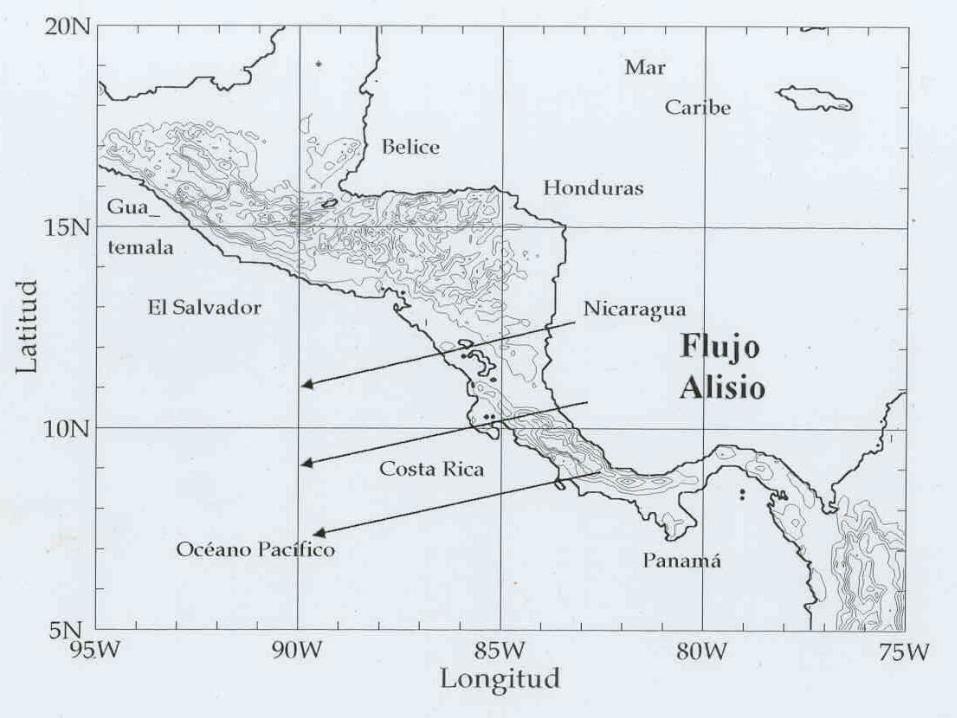

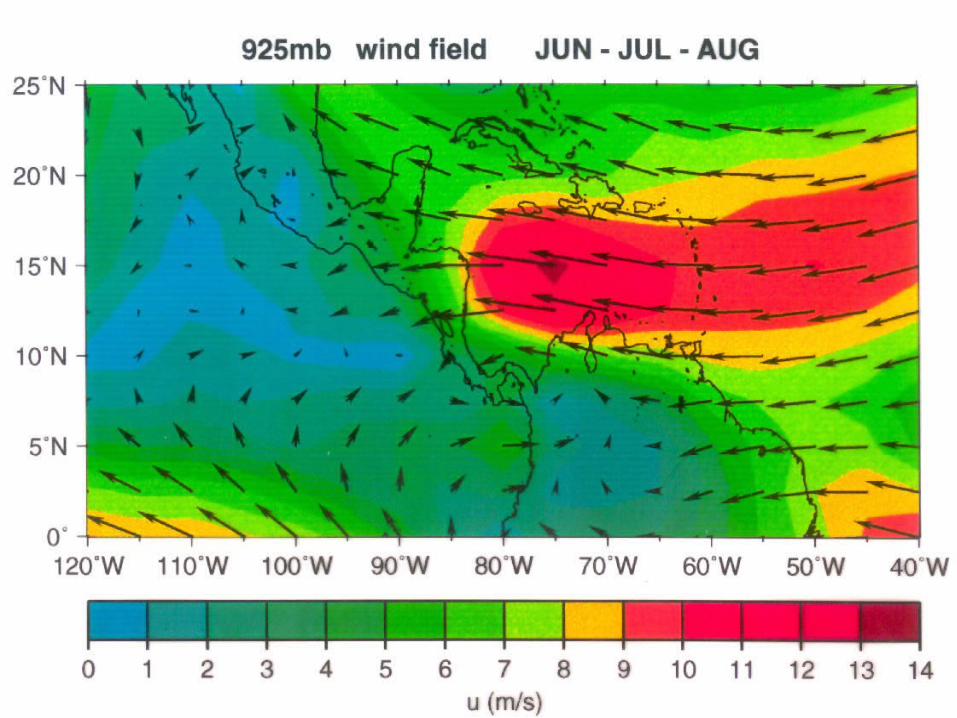
Zonal Wind, u, Est. Juan Santamaría


Some GCM’s Used
• CSIRO (Australia)
• CCCma (Canadá)
• HadCM3 (Inglaterra)
• NCAR-PCM (USA):
• ECHAM4.5 (EC)

GCM’s Grid Points, Wind Magnitude
15°N
NCAR-vientos
CSIRO-vientos
CCCma-vientos
HadCM3-vientos
19°N

CSIRO vrs. REANÁLISIS 15.11°N 81.56°O
2
4
6
8
10
12
1 2 3 4 5 6 7 8 9 10 11 12
mes
m/s
reanálisis csiro
CSIRO vrs. REANÁLISIS 18.26°N 81.56°O
2
4
6
8
10
12
1 2 3 4 5 6 7 8 9 10 11 12
mes
m/s
reanálisis csiro
CSIRO vrs. REANÁLISIS11.95°N 81.56°O
2
4
6
8
10
12
1 2 3 4 5 6 7 8 9 10 11 12
mes
m/s
reanálisis csiro
Wind

Wind
HadCM3 vrs. REANÁLISIS15°N, 78.75°O
4
9
14
1 2 3 4 5 6 7 8 9 10 11 12
mes
m/s
Reanálisis HadCM3
HadCM3 vrs. REANÁLISIS 17.5°N, 78.75°O
4
6
8
10
12
14
16
1 2 3 4 5 6 7 8 9 10 11 12
mes
m/s
REANÁLISIS HadCM3
HadCM3 vrs. REANÁLISIS 12.5°N, 78.75°O
4
6
8
10
12
14
16
1 2 3 4 5 6 7 8 9 10 11 12
mes
m/s
REANÁLISIS HadCM3

ECHAM4.5 Member 09 Wind Magnitude(Caribbean)
0
2
4
6
8
10
12
1 2 3 4 5 6 7 8 9 10 11 12
MonthsW
ind
mag
nit
ud
e (m
/s)
(10ºN - 20ºN, 70ºW - 85ºW) (9ºN - 15ºN, 77ºW - 83ºW)
ECHAM4.5 Member 09 Wind Magnitude(Eastern Pacific Warm Pool)
0
2
4
6
8
10
12
1 2 3 4 5 6 7 8 9 10 11 12
Months
Win
d m
agn
itu
de
(m/s
)
(5ºN - 15ºN, 85ºW - 110ºW)
ECHAM4.5. Monthly means for 1990 - 1999. Run stars: January 3, 1950, 00Z.

ECHAM4.5 Member 09 Precipitation(Caribbean)
0
4
8
12
16
20
1 2 3 4 5 6 7 8 9 10 11 12
MonthsP
reci
pit
atio
n
(mm
/day
)
(10ºN - 20ºN, 70ºW - 85ºW) (9ºN - 15ºN, 77ºW - 83ºW)
ECHAM4.5 Member 09 Precipitation(Eastern Pacific Warm Pool)
0
4
8
12
16
20
1 2 3 4 5 6 7 8 9 10 11 12
Months
Pre
cip
itat
ion
(m
m/d
ay)
(5ºN - 15ºN, 85ºW - 110ºW)
ECHAM4.5. Monthly means for 1990 - 1999. Run stars: January 3, 1950, 00Z.
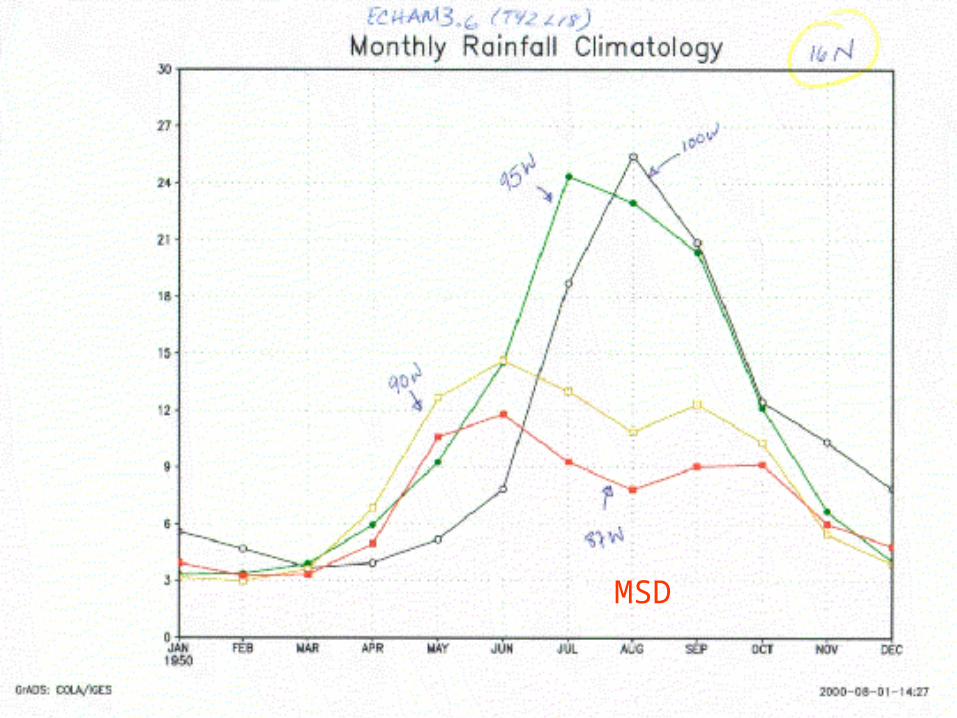
MSD

CCM3
Tair
Precip
OBS
MSD

ITCZ
observed
CCM3
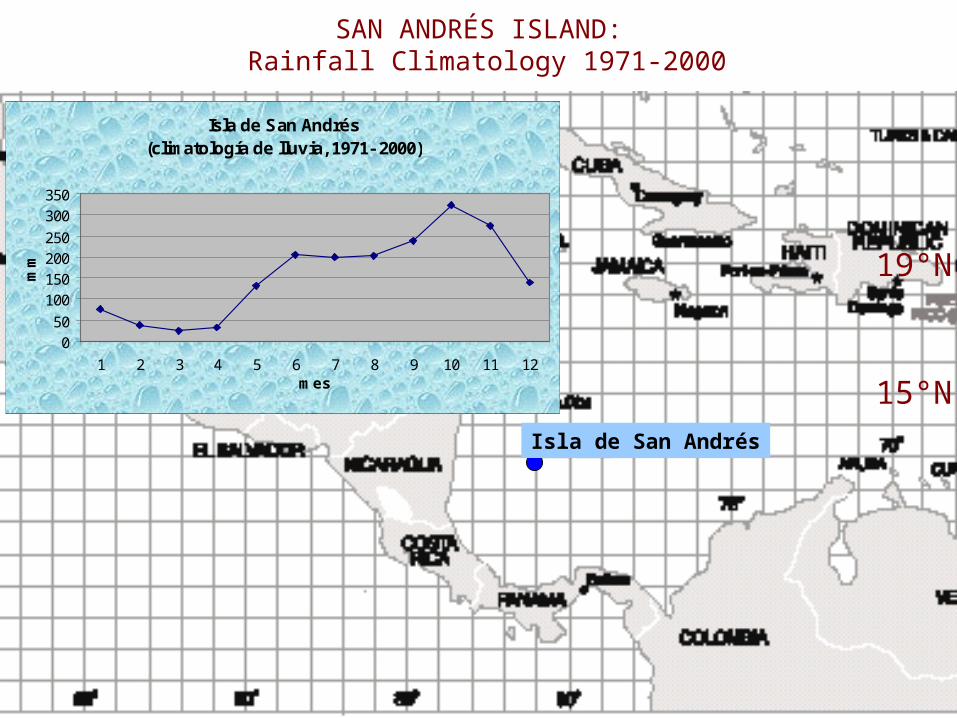
SAN ANDRÉS ISLAND: Rainfall Climatology 1971-2000
15°N
19°N
Isla de San Andrés
Isla de San Andrés (climatología de lluvia, 1971- 2000)
050
100150200250
300350
1 2 3 4 5 6 7 8 9 10 11 12mes
mm

GCM’s Grid Points, Rainfall
15°N
NCAR-lluvia
CSIRO-lluvia
CCCma-lluvia
HadCM3-lluvia
17°N
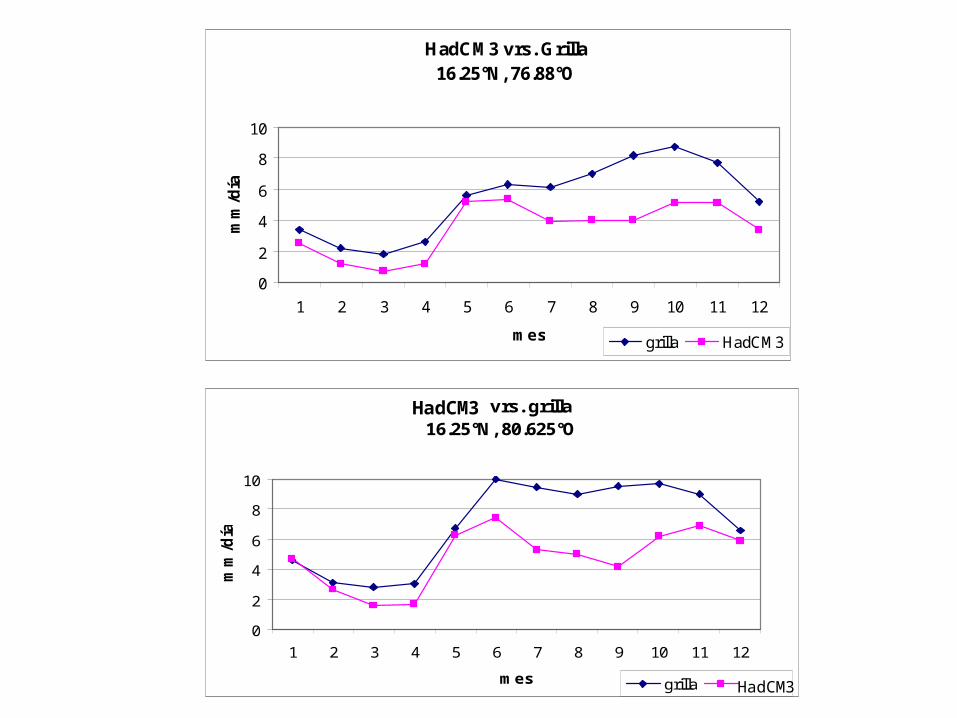
HadCM3 vrs. Grilla16.25°N, 76.88°O
0
2
4
6
8
10
1 2 3 4 5 6 7 8 9 10 11 12
mes
mm
/día
grilla HadCM3
NCAR vrs. grilla 16.25°N, 80.625°O
0
2
4
6
8
10
1 2 3 4 5 6 7 8 9 10 11 12
mes
mm
/día
grilla NCAR
HadCM3
HadCM3

Col. Dra. Xian Fu, UEA

MAD, IPCC Data Temp(°C) Prec(mm)
DJF JJA DJF JJACGCM2 2.18 1.79 171.36 310.24CSIROmk2 2.14 1.86 165.84 239.86CSM1.3 2.23 2.13 197.72 382.55 ECHam4 3.09 1.76 181.91 227.83GFDLR15b 1.98 1.87 153.90 272.06MRI2 2.73 2.65 201.23 455.85 CCSRNIES2 2.13 2.32 181.82 317.30 DOEPCM 2.49 2.29 172.40 441.73 HadCM3 2.33 2.46 166.87 355.21


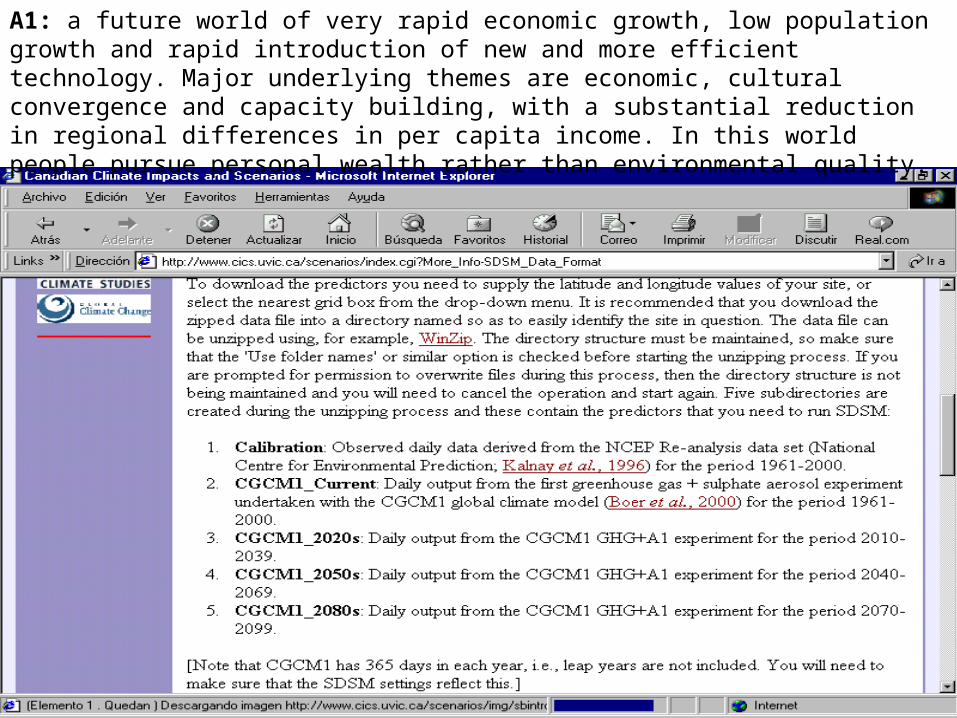
A1: a future world of very rapid economic growth, low population growth and rapid introduction of new and more efficient technology. Major underlying themes are economic, cultural convergence and capacity building, with a substantial reduction in regional differences in per capita income. In this world people pursue personal wealth rather than environmental quality.
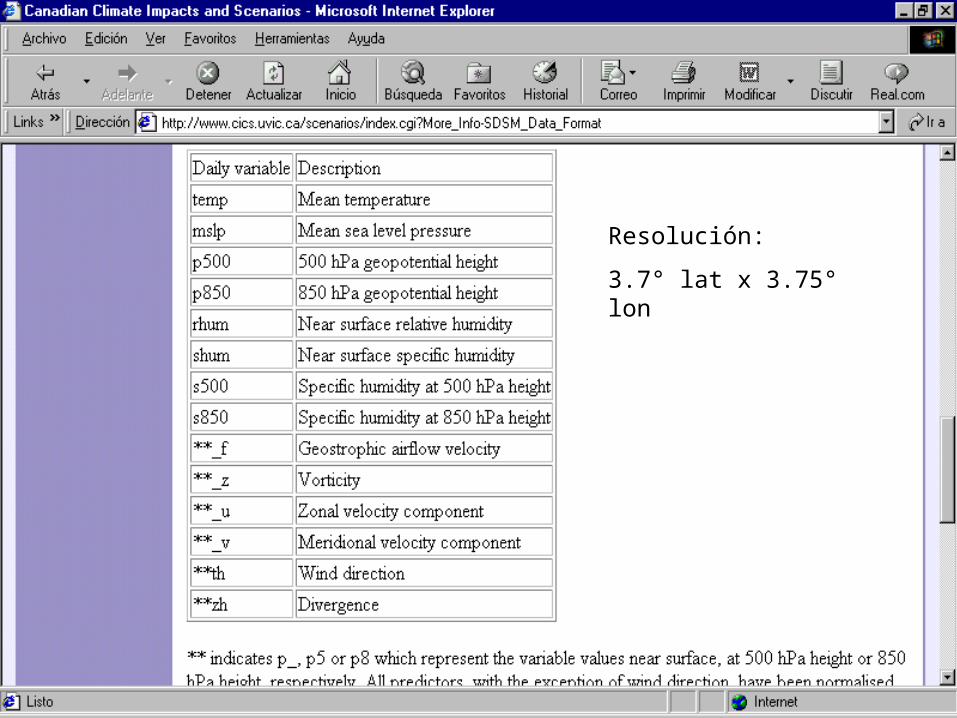
Resolución:
3.7° lat x 3.75° lon
-100 -95 -90 -85 -80 -75 -706
8
10
12
14
16
18
20
22
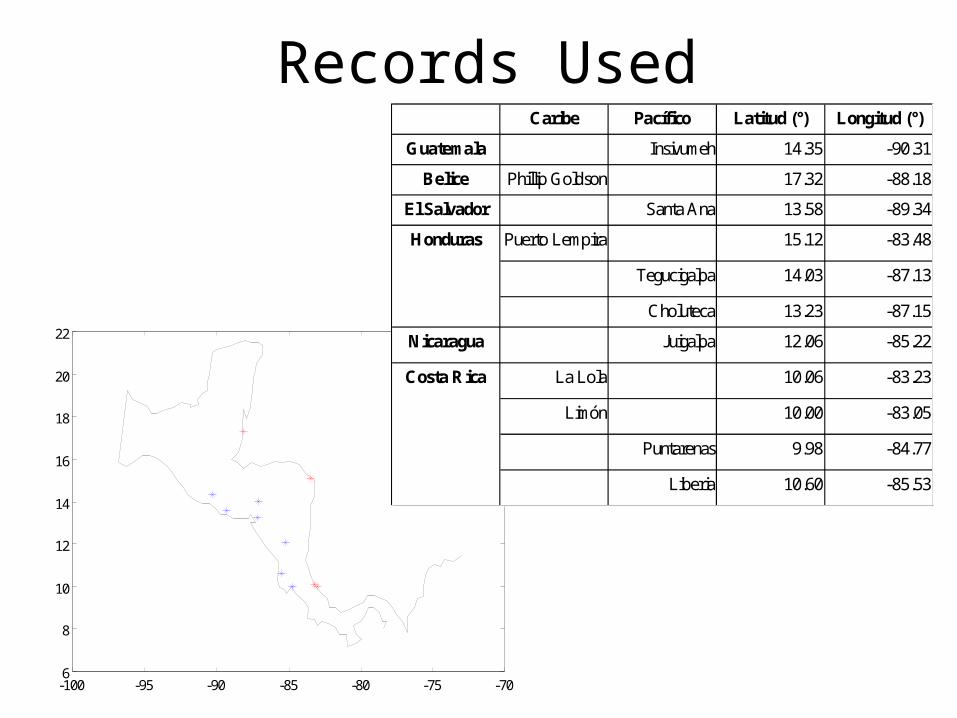
Records UsedCaribe Pacífico Latitud (°) Longitud (°)
Guatemala Insivumeh 14.35 -90.31
Belice Phillip Goldson 17.32 -88.18
El Salvador Santa Ana 13.58 -89.34
Puerto Lempira 15.12 -83.48
Tegucigalpa 14.03 -87.13
Choluteca 13.23 -87.15
Nicaragua Juigalpa 12.06 -85.22
La Lola 10.06 -83.23
Limón 10.00 -83.05
Puntarenas 9.98 -84.77
Liberia 10.60 -85.53
Honduras
Costa Rica
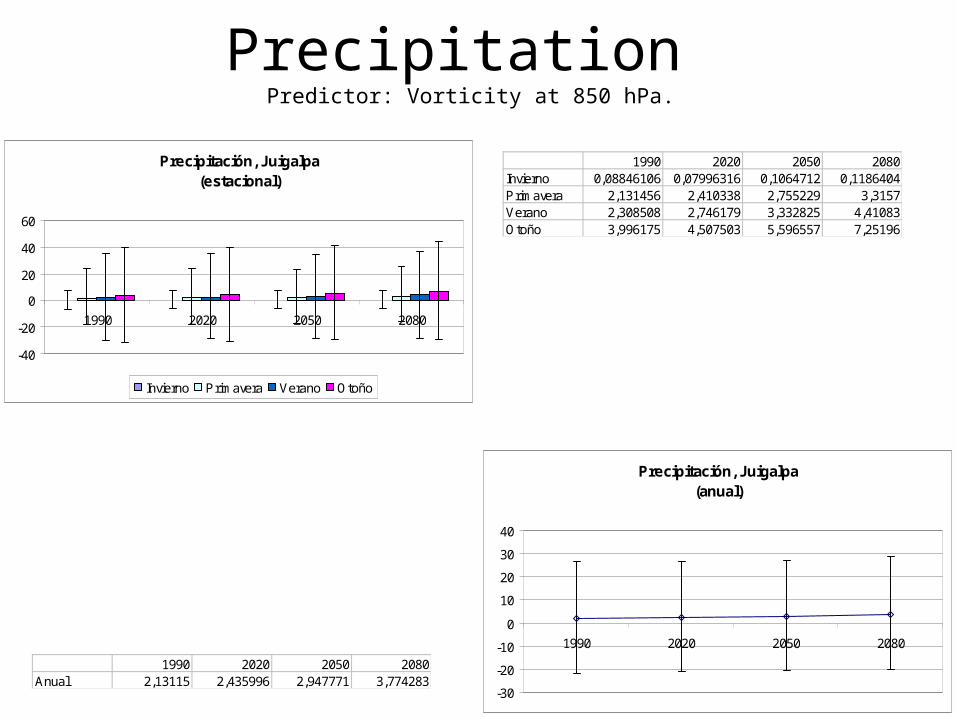
Precipitation Predictor: Vorticity at 850 hPa.
Precipitación, Juigalpa(anual)
-30
-20
-10
0
10
20
30
40
1990 2020 2050 2080
Precipitación, Juigalpa(estacional)
-40
-20
0
20
40
60
1990 2020 2050 2080
Invierno Primavera Verano Otoño
1990 2020 2050 2080Invierno 0,08846106 0,07996316 0,1064712 0,1186404Primavera 2,131456 2,410338 2,755229 3,3157Verano 2,308508 2,746179 3,332825 4,41083Otoño 3,996175 4,507503 5,596557 7,25196
1990 2020 2050 2080Anual 2,13115 2,435996 2,947771 3,774283

PrecipitationPredictor: Specific Humidity at 500 hPa.
Precipitación, Phillip Goldson(estacional)
-60
-40
-20
0
20
40
60
80
1990 2020 2050 2080
Invierno Primavera Verano Otoño
Precipitación, Phillip Goldson(anual)
-60
-40
-20
0
20
40
60
1990 2020 2050 2080
1990 2020 2050 2080Invierno 4,231517 4,811519 5,134129 5,967389Primavera 3,357935 3,775469 4,08587 5,013614Verano 4,192366 4,932047 5,808024 7,202672Otoño 7,160653 7,99516 9,215504 11,25206
1990 2020 2050 2080Anual 4,735618 5,37855 6,060882 7,358934

PrecipitationPredictor: Specific Humidity at 500 hPa.
Precipitación, Choluteca(estacional)
-60
-40
-20
0
20
40
60
80
1990 2020 2050 2080
Invierno Primavera Verano Otoño
Precipitación, Choluteca(anual)
-40
-20
0
20
40
60
1990 2020 2050 2080
1990 2020 2050 2080Invierno 0.329 0.587 0.587 0.727Primavera 3.929 7.263 7.226 8.441Verano 11.452 11.308 11.174 11.945Otoño 13.195 15.158 15.124 18.039
1990 2020 2050 2080Anual 7.226 8.579 8.528 9.788

PrecipitationPredictor: Wind Magnitude at 850 hPa.
Precipitación, Limón(estacional)
-100
-50
0
50
100
150
1990 2020 2050 2080
Invierno Primavera Verano Otoño
Precipitación, Limón(anual)
-80-60-40-20
020406080
100
1990 2020 2050 2080
1990 2020 2050 2080Invierno 22.678 19.806 18.889 18.832Primavera 21.450 21.148 20.240 20.324Verano 21.632 26.050 25.745 26.181Otoño 20.325 22.017 21.532 22.125
1990 2020 2050 2080Anual 21.521 22.255 21.602 21.866

Temp. minPredictor: Near Surface Specific Humidity.
Temperatura Mínima, Limón(estacional)
15
20
25
30
35
1990 2020 2050 2080
Invierno Primavera Verano Otoño
Temperatura Mínima, Limón(anual)
15
20
25
30
1990 2020 2050 2080
1990 2020 2050 2080Invierno 20.720 21.234 22.141 23.537Primavera 21.862 22.693 23.767 25.438Verano 22.493 23.203 24.146 25.596Otoño 22.059 22.487 23.218 24.171
1990 2020 2050 2080Anual 21.784 22.404 23.318 24.685

Temp. maxPredictor: Near surface Divergence.
Temperatura Máxima, Limón(estacional)
20
25
30
35
40
1990 2020 2050 2080
Invierno Primavera Verano Otoño
Temperatura Máxima, Limón(anual)
15
20
25
30
35
40
1990 2020 2050 2080
1990 2020 2050 2080Invierno 29.311 29.292 29.283 29.990Primavera 30.355 30.242 30.228 30.245Verano 30.047 30.098 30.088 30.105Otoño 30.254 30.306 30.321 30.307
1990 2020 2050 2080Anual 29.992 29.984 29.980 29.990
Acknowledgements
AIACC
University of Costa Rica
NOAA/OGP