Embed Size (px)
Citation preview

PROGRAMME FOR RESEARCH AND ACTIONS ON THE DEVELOPMENT OF THE LABOUR MARKET
NEW FORMS AND NEW AREAS OF EMPLOYMENT GROWTH FINAL REPORT FOR GERMANY
I?~ L -------~-~-:------~ COMMISSION OF THE EUROPEAN COMMUNITIES
I, -. .

This document has been prepared for use within the Commi-ssion. It does not necessarily represent the Commission's official position.
Cataloguing data can be found at the end of this publication.
Luxembourg: Office for Official Publications of the European Communities, 1987
ISBN 92-825-7 545-4
Catalogue number: CB-49-87-494-EN-C
© ECSC-EEC-EAEC, Brussels • Luxembourg, 1 987 Reproduction is authorized, except for commercial purposes, provided the source is acknowledged.
Printed in Belgium

Commission of the European Communities
Programme for Research and Actions on the Development
of the Labour Market
NEW FORMS AND NEW AREAS OF EMPLOYMENT GROWTH
Final report for Germany
By
Kurt VOGLER-LUDWIG
Document

This document has been prepared for use within the Commission. It does not necessarily represent the Commission's official position.
Copyright ECSC-EEC-EAEC, Brussels - Luxembourg, 1987 Reproduction is authorized, except for commercial purposes, provided the source is acknowledged.

The research (study 85/8/B > on which these reports were based was financed by the Commission of the European Communities as part of its programme of Research and Actions on the Development of the Labour Market.
The analysis and conclusions are the responsibilities of the authors. They do not necessarily reflect any views held within the Commission of the European Communities nor do they commit it to a particular view of the Labour market or any other policy matters.


Index
Abstract
1. Summary
2. Recent developments in work patterns
2.2
2.3
Actual trends 2.1.1 Labour supply 2.1.2 Labour demand 2.1.3 Working time
Forecasts 2.2.1 2.2.2
Global developments Structural change
In search of new areas and new forms of employment growth
3. New forms of employment growth
3.1 Main activity
3.2 Case studies
3.3 Rationalisation in the light of vocational structural changes
3.4 Technical change and qualification
4. Contractual arrangements
4.1 Self-employment 4.1.1 Foundation of businesses 4.1.2 Professions of the self-employed 4.1.3 The informal economy
4.2 Short-term. and casual employment 4.2.1 Fluctuation of labour 4.2.2 Short-term employment 4.2.3 Fixed-term labour contracts 4.2.4 Contract work 4.2.5 Casual employment
page
1
7
7
9 11 19
24 24 26
31
33
34
37
43
47
51
52 53 54 57
59
59 61 64 66 68

page
4.3 Working time flexibility 68 4.3.1 Part-time work and variable working times 70 4.3.2 Shift-work 71
5. New areas of employment growth 75
5.1 The service industry
5.2 Small firms
5.3 Regional disparities
6. Conclusions
Annex
1. Statistical sources and classifications
7.1 Statistical sources
1.2 Classifications 1.2.1 Sector of activity 1.2.2 Occupations
8. References
9. Bibliography
9.1 Employment statistics
9.2 Global trends in labour market developments
9.3 Job content
9.4 Contractual arrangements
15
79
80
83
87
89
89
92 92 97
99
105
105
106
115
121

Tab.-No.
2.1
2.2
2.3
2.4
2.5
2.6
2.7
2.8
2.9
2.10
3.1
3.2
3.3
4.1
4.2
4.3
4.4
4.5
4.6
4.7
4.8
5.1
5.2
List of Tables and Charts
Balance of labour market
Employment
Employment by occupations
Shift share analysis of employment by industry and occupation 1970 to 1982
Occupational status
Employers and self-employed persons
Annual working time of full-time workers
Part-time work 1984
Labour market projections by the year 2000
Employment 1960 to 2000
Main activities within occupations
Employment by occupation and industry 1961 to 1982
Vocational training
Foundation of businesses 1981/83
Vocations of the self-employed
Fluctuation rates 1982
Short-term employment
Fixed-term labour contracts 1984
Contract workers
Casual employment
Special forms of employment
Net change in employment
Growing service industries
page
8
12
14
16
17
18
20
23
27
28
36
44
48
54
55
60
62
65
67
69
73
76
77
I

Tab.-No. page
5.3 Employment by size of firm 80
7.1 Main data sources 90
7.2 Basic variables of employment statistics 91
7.3 Industrial classification (Version for the Labour Force Survey) 94
7.4 Industrial classification (Version for the National Account) 95
7.5 Classification of occupations 98
Chart-No. page
2.1 Participation rates 10
2.2 Labour market projections 1982-2000 25
2.3 Employment by sectors 30
3.1 Employment by occupation and industry 1970-82 45
5.1 Employment by labour office districts 81
\

Abstract
Ten years of high unemployment and the prospect of continuing labour surpluses have changed the questions which are discussed in the field of labour market policy in the Federal Republic of Germany. The hope for a solution of the unemployment problem by increased growth has disappeared. Even optimistic forecasts see no chance of full employment until the end of the century. The new questions and new hopes therefore concentrate on the labour market itself:
- Had the continuing pressure of high unemployment any consequences for the behaviour of the suppliers and employers of labour, or does labour market rigidity remain untouched in the disequilibrium?
- Is there a new flexibility of labour to be discerned, in which the job-seekers make better use of their opportunities, or is flexibility only expected of those who have in any event no possibility of choice?
- Were new forms of employment developed in the continuing disequilibrium which also create access to the labour market for those who were formerly excluded from it?
This study, which is in search of new forms and new areas of employment growth, was able to show a lot of changes in employment structures. It was able to identify the occupations, branches and social groups which were - positively and negatively - affected by structural change in the economy. It could describe the effects of technical change on job content. But the hopes for a new flexibility were disappointed.
It was found that flexible forms of employment (part-time work, fixed-term contracts, flexible working time schedules etc.) are introduced very hesitatingly. This results necessarily in squeezing those workers out of the labour market, whose competitive chances are comparatively poor. They were forced into unemployment or early retirement, and for the young people further training has accquired further importance. The households, on the other hand, which were able to offer better qualified and competitive workers, have expanded their labour supply. The price for this was an increasing burden placed on the income from economic activity by social expenditure.


1
1. Summary
Since the middle of the seventies, the labour market in the Federal Republic of Germany has been out of balance. The falling demand for labour was faced with a growing supply. The gap between the demand for labour and the supply has opened so wide that even optimistic forecasts do not see any chance of full employment until the turn of the century.
The decrease in employment took place substantially in the goods producing industry and in agriculture and forestry. This trend did not remain without consequences for trade and transportation, the functions of which are closely connected with the production of goods. The strength of employment expansion in the sector of private and public services was not sufficient to compensate for the release of labour in the goods-producing and distributing fields. The expansion of employment in the service sector was predominantly supported by the public services, the nonprofit making organisations and the health and veterinary sector. The field of "miscellaneous services" profited from the displacement of service functions which previously had been provided within the enterprises of the other economic branches (cleaning of buildings, consultancy, software)
Parallel to structural change in employment by industry, alterations in the vocational structures have taken place (increase in service trade vocations, administrative vocations, technical professions, decrease in agricultural and mining vocations and in the manufacturing trades). The structural change in employment mainly affected the wage earners. The gainers were the salaried workers and the civil servants. Since the first half of the eighties the trend in self-employment has swung round into an increase. New entrepreneurial and selfemployed jobs have been founded predominantly in the service sector, which in the meantime has devel~ oped into the domain of self-employed activity. The proportion of women in total employment has risen. Their advance on the labour market was governed substantially by the changes in employment structures in the direction of administration and services.
Forecasts of labour market developments until the turn of the century, submitted by the Institut fUr Arbeitsmarkt- und Berufsforschung (lAB), show that labour supply reaches its peak at the beginning of the nineties. Afterwards a decrease is to be expected until 2000. Depending on the assumptions made for output growth, productivity and the reduction of working time the projections for labour demand range from a reduction of 3.5 million jobs to an increase of 1 million. With a long-term growth rate for gross domestic product of 2.5 % per annum until the year 2000, there could be

2
approximately the same number of jobs as there were in 1984. In no case, however, the demand for labour will be adequate to fill the gaps in the labour market. Even in the most favourable case of high growth and slow increase of the labour supply, 800,000 registered unemployed must be expected by the end of the century.
Over the period of decades which is observed in this analyses new vocations appear, old vocations disappear and they alter their vocational content in the process of technical change. In the manufacturing vocations, in the course of automation of production the activities which are concerned with the production of goods have clearly lost weight in favour of the activities which are concerned with the operation, maintenance and repair of the production apparatus. The growing capital stock, moreover, required to an increasing extent technically qualified workers (engineers, technicians) in the functions of maintenance and repair. In the service trades, in contrast to the manufacturing trades, no tendency towards a shift in vocational· content can be discerned. It seems that specialisation on the functions which are typical of the vocation has taken place.
The spectrum of activities in the whole economy has been clearly displaced by the change in vocational content. Fewer people are employed in the production of goods, whereas administration, planing and management provide an increasing share of work. These trends are clearly confirmed by a range of case studies undertaken since 1970.
The changes in qualification profile are strongly dependent on the degrees of mechanization and automation. Until the middle of the seventies rationalisation took place in the historical forms, which can essentially be described by the concept of "Taylorisation". According to this concept, technical trends lead not only to a differentiation of the spectrum of qualifications of industrial labour, but also to its polarization. Together with high-. ly qualified activity, new simple and unskilled types of work are constantly arising. There can be no talk of a general increase in qualifications in the course of technical progress.
The seventies can be interpreted as a phase during which new organisational and commercial knowledge was maturing against the background of new technological concepts. However these concepts which result from the new factor of micro-electronics have changed meanwhile. The restrictive access to the labour force which dominated "tayloristic" concepts sacrifices important productivity potential. In a more integral division of the tasks, there are productive forces which can be realised, using the qualifications and specialist sovereignty of the workers. Therefore jobs will again

3
be more broadly interpreted as regards their spectrum of requirements, the competence of the workers will be comprehensively used, their interests will again be more greatly respected.
The question of the effect of technical change on qualification requirements can be relatively clearly answered: in the manufacturing sectors a clear increase in the significance of technical qualifications at the cost of manual or industrial production knowledge. Equally we find in the administrative sectors a more than proportional increase in management functions at the expense of routine administrative duties. Beyond this trend formal qualification of the employees has risen in general.
The deterioration of the labour market situation was particularly noticeable for those who had no job. To the extent that they could not withdraw from the labour market by having recourse to transfer incomes they were compelled to adaptations:
- The trend to self-employment has increased.
- The tendency to release less-qualified employees by means of rationalisation has aggravated the competition for qualifications.
- A part of the work force had to accept a deterioration in their employment conditions. Short-term employment, fixed-term contracts and contract labour have increased.
The rising trend in self-employment gave support to the hope that the deficit in foundation of businesses has been overcome. However, new investigations lead to a much more sceptical judgement. The sectoral pattern of new business activity has very conventional aspects. The trend to self-employment seems to be only characterized to a small extent by innovative aims and to represent the ''opening up of new markets". On the contrary, the uncer-. tain employment situation may have been an important cause.
Short-term employment has increased mainly in the manufacturing sector whereas the service sector traditionally is characterized by a high proportion of short-term work. Fixed-term labour contracts which are possible in the individual sectors in accordance with varying legal and collective agreement regulations were concluded in 1984 with 11.4 % of the dependent employees; the major proportion of them was in the field of vocational training (6.6 %). More recent surveys indicate that new legal possibilities to expand fixed-term contracting have been used to an increasing extent by the enterprises. The official statistics on contract work show an almost three-fold increase in the number of contract workers between 1974 and 1980. Moreover, there is a justifiable

4
assumption that the reporting obligation for contract work is evaded by unlawful contracting. Contract labour is primarily concerned with short term employment relationships between contract employees and contractors. The highest proportion is attained by it among ancillary workers. Casual employment did not increase during the seventies.
The progress made in the flexibility of working time has to be awaited. In the question of working time the enterprises are concerned with the utilisation of the human capital of their employees. Therefore part-time work is growing slowly and remains concentrated on the vocational groups with relatively low qualifications. Similar trends are to be found in the case of the variable forms of working time. Flexible time regulations are primarily practised in the administrative sectors of the enterprises. Neither the hopes of some of the employers' associations nor the fear of some trade unions that flexible working time would spread rapidly can be confirmed.
The diffusion of shift-work has increased in the past. At the beginning of the sixties, in manufacturing industry 14 % of the employees were acting as shiftworkers. This proportion increased steadily at the beginning of the seventies to 20 % and by 1984 it had reached 25 %.
The sectoral and vocational change in employment structures has clearly demonstrated the trend towards the service society. Strong impulses have been provided by the demand of the private households for educational services, leisure and sports, health and care services. Employment expanded less among the traditional suppliers of personal services but more in services which are publicly supplied or financed. The increase in employment in the miscellaneous service enterprises was decisively supported by business services.
The role of small and medium-sized enterprises in the development of employment cannot be qualified on the basis of the material which is presently available. It must be assumed that the employment fluctuations which can be found in the big enterprises is seen in the small enterprises in the form of fluctuations in the number of businesses.
In the past ten years, the disequilibrium in the labour market has led to clear disparities in the employment trend of individual regions in the Federal Republic of Germany. The trend in employment was better in the southern regions than in the northern districts. This has led to the slogan "North-South gradiant" in

5
economic trends. From the historical point of view, the economic dynamism has shifted from the old industrial centres of the North to the less industrialized South. The agricultural oriented regions had to accept fewer losses in employment than the urban centres.
The introduction of new technologies has sharpened the borderlines on the labour market: the enterprises have a strong interest in the optimal use of their human capital. In the same sense, the employees who belong to the permanent staff of the enterprises are interested in the advantages of long-term labour contracts. New forms of employment have therefore only penetrated very hesitatingly and only into the marginal sectors of the labour market. In the present constellation of interests, the result is necessarily the squeezing out of the labour market of those workers whose competitive chances are comparatively poor. The less competitive among them are forced into unemployment, the elderly into retirement, and for the young people further training has accquired growing importance. The households, on the other hand, which were able to offer qualified and competitive workers, have expanded their labour supply. The price for this squeezing out labour from the market is the increasing burden placed on the income from economic activity by social expenditure.
The forecasts for the trend in the labour market until the year 2000 do not show any basic change in the present constellation. In the light of this perspective, labour market policy can probably only mitigate the problems but cannot solve them. As regards the future dynamics of flexibility, the trend until now, however, provides more cause for scepticism than for euphoria. The introduction of more flexible rules, which always signify a new sharing of risks relating to employment or income, is encountering great resistance and will therefore require very long periods of time. But possibly the pressure of increasing unemployment will compel! the introduction of more flexible forms of employment.


7
2. Recent developments in work patterns
2.1 Actual trends
Since the middle of the seventies, the labour market in the Federal Republic of Germany has been out of balance. The number of persons employed reached its peak in the last year of full employment in 1973, and since then has never attained that level. Even in 1980, the last cyclical peak in employment (26 .3 million), there were 600,000 persons fewer in work than there were in 1973. By 1985 this difference had increased to the level of 1.4 million (Table 2.1).
The falling demand for labour was faced with a growing supply. In the period from 1970 to 1985 an additional 150,000 persons came onto the labour market each year. The demographic development and the changing attitude to work on the part of women were the decisive driving forces underlying this trend. With every cyclical recession, therefore, unemployment reached a higher level, which in principle was not abandoned during the subsequent upswing. A similar development can also be observed in the current cyclical boom, caused by the phenomenon that with a growing demand for labour, the supply increases faster.
As time went by, the lack of equilibrium in the labour market has got a structural character. By the term "structural" we mean that this is a long-term state, which does not disappear again, quasi-automatically, in the cyclical upswings. The gap between the demand for labour and the supply has opened so wide that even optimistic forecasts see no chance of full employment until the turn of the century. The over-supply of labour has facilitated the process of selection in the labour market. As in the past, the efficient workers still had good opportunities, whereas the fate of unemployment was concentrated on workers with lower skills, beginners in a trade and on older workers with health restrictions on their efficiency and on foreigners. In the predominant number of cases, unemployment for these groups of employees meant long-term unemployment.
As the disequilibrium in the labour market continued, the focal points of the debate on the political aspects of unemployment have shifted. In the middle of the seventies the debate concerning the range of problems caused by employment was still characterized by the hope that unemployment would disappear again during the next cyclical uptrend. Today unemployment is seen primarily as a long-term and structural phenomenon. Thus questions on the flexibility of the labour market, the adaptability and mobility of

Tab
le 2
.1
Bal
ance
of
lab
ou
r m
ark
et
(100
0)
1970
19
73
1975
19
80
1985
Lab
our
SUJ!
J!ll
To
tal a
) 26
70
9 27
21
2 27
24
5 27
78
9 28
97
0 G
erm
ans
24
889
24
689
24
905
25
489
26
815
Fo
reig
ner
s 1
820
2 52
3 2
340
2 30
0 2
155
Mal
e 17
09
9 17
13
8 16
921
17
17
0 17
67
0 F
emal
e 9
610
10 0
74
10 3
24
10 6
19
11
300
Lab
our
dem
and
To
tal
empl
oym
ent
26
560
26
849
25
746
26
278
25
470
Em
ploy
ees
22
138
22
833
21
950
22 9
59
22
177
CD
Fo
reig
ner
s 1
815
2 50
3 2
139
2 01
8 1
570
Sel
f-em
plo
yed
and
fa
mil
y w
ork
ers
4 42
2 4
016
3 79
6 3
319
3 29
3 M
ale
17
006
16
960
16
155
16
447
15
737
Fem
ale
9 55
4 9
889
9 59
1 9
831
9 73
3
Su
r2lu
s o
f la
bo
ur
To
tal
149
363
1 49
9 1
511
3 50
0 R
egis
tere
d u
nem
ploy
men
t 14
9 27
3 1
074
889
2 30
4 U
nem
ploy
men
t ra
te i
n %
b)
0.7
1
.2
4.7
3
.7
9.4
N
on
-reg
iste
red
une
mpl
oym
ent
0 90
42
5 62
2 1
196
a)
Est
imat
ed l
abo
ur
forc
e (t
ota
l em
ploy
men
t p
lus
reg
iste
red
and
no
n-r
egis
tere
d u
nem
ploy
men
t).
-b
) R
egis
tere
d u
nem
ploy
men
t as
sh
are
of
empl
oyee
s p
lus
reg
iste
red
une
mpl
oym
ent.
So
urc
e: In
stit
ut
fUr
Arb
eits
mar
kt-
und
Ber
ufs
fors
chu
ng
.

9
the participants in the labour market have been moved into the foreground, as well as questions concerning new potential for employment on the margins of, or even outside, the previous employment system. The search for new forms and areas of employment, such as will be attempted in this research project, became relevant.
2.1.1 Labour supply
The growth of labour supply was accompanied by clear alterations in its composition. The essential tendencies in the period· from 1973 to 1984 (Chart 2.1) were:
- growing participation rates for women, above all for married women,
- falling participation rates for young people up to the age of 25,
- falling participation rates for the older age groups, as from 60 upwards.
Employment participation for men was decreasing in all the age groups, most strongly in the age groups below 30 and over 55. On the other hand, women, especially in the middle age groups, have increased their participation rates. The difference between employment behaviour of men and single women has become smaller and there was also an approximation in participation rates of foreigners to German levels. The formerly very high participation rates for foreigners are certainly still above the German level, but the distance has been reduced.
The most important factors for these changes are to be found. in the prolonged educational periods for young people, in the earlier commencement of pensionable age, in the impulses for female of employment coming from a growing service sector, in the restrictive policies towards foreigners since the second half of the seventies and in changed attitudes to employment among women.
The increase. in the employment of women is not solely to be traced back to altered individual and social attitudes. It is true that various results of surveys have shown that the vocational and labour orientation of women has increased, but the major! ty of women participate in employment less because of their work satis-

Par
tici
pat
ion
rat
es
(Lab
our f
orce
* in
% o
f the
pop
ulat
ion)
I M
ale
I
• •
• •
• •
• •
• •
!I
!I
• •
• --·
1!13
• •
--•
• •
• I
IHI
&W
...
., !H
t li
and
old
er
.. .. ...
,.. ..
• P
erso
ns w
ith
mai
n o
ccu
pa
tion
and
une
mpl
oyed
pe
rso
ns
Sou
rce:
Sta
tistls
ches
Bun
desa
mt.
lfO
. IN
STIT
UT
fur W
irtsc
hofts
fonc
hung
MO
nche
n
Ch
art
2.1
Fem
ale
(mar
ried)
I
Fem
ale
(unm
arrie
d)
• • • • • !I • • • • •
t5iiD
&
ll .. 6-
!t
!HI
lian
d o
lder
ts
-iJ
&-l
l ...
&!I
..
I& a
nd
old
er
3);
!5
.!i
e-.e
,.
... -~
.!i
.. ,. ..
rt21
86~

11
faction than because of financffl reasons. This has been confirmed by more recent investigations.
The growth of female participation in employment has therefore not taken place solely in part-time employment. Full-time employment too has substantially expanded. Thus in 1984 91 % of single women were in fulltime employment. However, among married women, this percentage was only 27 %.
2.1.2 Labour demand
On the average of the years 1973 to 1985, the demand for labour decreased annually by 0.4 %, when total employment is selected as the yardstick. If the demand is measured by the number of hours worked, the decrease amounted to as much as 1.2 % annually.
The decrease in employment took place prior to 1980 substantially in the goods producing industry and in agriculture and forestry. The subsequent recession, which affected primarily goodsproducing industries, accelerated it still further. This trend did not remain without consequences for trade and transportation, the functions of which are closely connected with the production of goods. The strength of employment expansion in the sector of private and public services was not sufficient to compensate for the release of labour in the goods-producing and distributing fields. It is true that employment by the state, as well as by the private organisations of non-profit making character, and by the service enterprises increased between 1973 and 1983 by 1.4 million persons, but in agriculture and forestry, the goods-producing industry as well as in trade and transportation it decreased altogether by 3.0 million persons. This gap in employment was also contributed to by the fact that the expansion of employment by the state and parts of the private service sector had slowed down in the course of the seventies (Table 2.2 and Table 5.1).
In the sectoral development of the demand for labour, the dominant influence of the altered conditions for growth after 1973 is always visible - irrespective of the measurement variables which are used (total employment/hours worked). In the fields in which production growth was negatively affected to an above-average extent, the demand for labour also shows the clearest trend breaks. In the manufacturing industry this led to a position in
1) See Hofbauer (1979), Klauder, lUhlewind (1981), Vogler-Ludwig (1983).

12
.,.,._._......-.-.--.-....___._.._..... . .......,_,_. _____ ..... ~---- .... ----.---------.-.-----·---·----.-.--..... ---. taau a.t IIIPLDYIIlNT
·-- ___ ___.._,_. ............... _. .. _______ _....__..__.___.._____.__.~------...--·-... A1"-WT1 WAU.£.5 I l*llf Ut • AVUA"l ANNI.IAL I
_,STU UDOOJ I I tMANCot lN I I ... 0 1971 19111 a .. o ltU ...... 1960/1 I'll/ I
I I 19111 at63 I .----~--------_,__.__..........,. ____ _,_.,_ _ _._,....,_.._, .............. ___________ ~ .......... ----------------·
... ICULTetFGRESTRYeFI~ 1511 ,.,. U9l 11.14 "·n 1.10 .... 1 •J.z ear>s NDDUf.IN• IIIIDUSTa. 11491 anu 10.41 41.95 41 ... 41.'Jl o.J ., .. INEAGYt RIMING I IUAIAING 'J41 IU 102 1.11 a.tz •••• ., .. -o.J ILltTlltiTYt .ASt MATil ... 156 nz ··'" o.t5 a.oe lel o.t COAL RJNJNG 491 Ill U4 a.ta o.u o.e~ •t.s •leO OTHER RlNlNG ., u 16 o.u o.oa De06 ... e •J.l
•NUFACTUillNG INDUStRY .. ,4 •••1 1141 ... 91 16.11 az.u o.z ·1·' CMlRJtAL INDUSTRY 114 .16 ... 1.os I ell z.ss • •• -o.'t ,_T.CLEUR REFJNElllS 41 N II o.a• 0.19 o.u a.s •1.1 PLASTIC PlDOutTJDN " 101 110 •••• o.·n Dell ••• 0.6 AUIIEA PROtESSING Ut Ut 101 0.46 o.sz 0.41 a.z .,.5 STONE AND DillS 119 190 109 a.u a.oa o.u -o.1 ... , FIN£ tllARI" 14 •• 51 o.az o.zs Dell ·1·• -z.s IU.SS AND IL&U NOD. •• .. 15 o ••• o.11 o.ao 0.4 -2.1 IRON AND STtlL PRQD. 411 150 160 a.u leiO 1.01 -c..• -.2.9 IIOfii..,.UlDUS RE1&L to tl 'JO O.IS o ••• D.21 o.z •2..1 FDUNDAJU 171 141 lOS 0.66 o.sJ Oe42 -1.1 •J.O ADLLIN& I DRAWING RILLS 116 104 262 a.u a.u 1.04 -o.J -a.s $Tit~1UlAI. REUL PROD. 140 102 UJ o.tz 0.15 0.64 -1.1 •Z·I RAt HINElY lOU uoo 1010 ... oo .... , 4.oe le1 •a.s OFFICE, tONPUTJNG MAtH. •z 106 "' 0.14 0.19 o.ao 4.2 •1.1 RD10R VlWitLES Ill ... til a.u • •• !» ••• 9 1.!1 "·4 SI'IJP IUILOING> tS n IS o ••• o.z. o.u -z.z ·z.s All ANti SPACE CRAFTS 1tJ .. o ~1 o.ol o.u o.za 6·1 ••• iLittRI~I. lGUIPRlNT 941 un aon I.M 4.51 4.02 z.o -1.9 PlltJSlO~ lQUJP.,DPTICS 114 116 IOJ 0.11 D.eo o.ao 1.1 -o •• JAIRltAllt Nt1AL PkO~. 405 402 105 1.55 a. so s.u -o.a -z.t RU!IC INSTAURtNTSt TOYS 104 tl: I !I 0.40 o.n 0.14 -o.s -a •• SA~~ILLSt WDDC RILLS M n •z O.Jll o.u O.il •1.1 -3.6 FURNITURE, WODD PRODUCTS soz 401 IU 1.9! 1.49 l.U •1o1 -2.1 PULP, PAPU I PAPtlltARD 11 6l 52 o.J! o.zs o.za -z.o -z.! PAPU PRODUCTS 14Z 159 uo o.~4 o.n 0.41 o.t -1.1 PAINTING 145 169 us 0.94 1.00 D.T7 o.1 -a.z LlA1N£l PlDDUtTS 161 UJ 102 s.oz 0.61 D.40 •1.1 •4.6 TllllLU 11.1 414 115 1.11 leiD le09 •J.O _,_, •Af ll NG APPAREL 141 444 Itt 1.10 ... ~ 1.02 -a •• -s.J FOOD RAN., IA¥£lAG£ ,..,. tOl 9Zl Ill 1.46 ..... a.zs o.J •lei TDIACCD 10 •• u o.n o.u o.o~ ••• 4 .....
IZU61RUCTIDN uu 1141 1191 .. ,. lel4 l.Sl o.e -z.a tOHSTftUtTIOH INDUSTAIU IUS l6U 1S.5 ••• 9 •• 04 .... , 0.4 •J.l FINISHING 591 726 1JI I ell 1.70 &.to '·' D. I
•.ct, TAANSP., IPVICU 'f11! lUI 1461 llell 10.11 11.46 a.o o •• aADE 1199 1692 uzz lle66 u.o1 Uel4 0.4 ·c.s .. HtUSALf TRADE 1U9 1415 1294 .. ,. s.u 5.12 o •• -o.• AETAJL TUDE 1960 lOll IOU t.w 1. 't4 -..cz o •• -o.z
ftANSPOill, tDfllfiiUNJ NtATJa.. 1460 nu 1419 t.60 ~.61 •• 69 o.:a •CI.t AAIL•AY TkANSP0~1 5lt Ul 114 .... ... , 1.J2 •1.3 -z.1 •ATilt TllA .. IPORT Ill to .. .... o.M O.i. ·1·' '•.J.l PDS1 AND CDRRUNltATJON .... 491 101 1.51 1.6! 1.01 1.1 o.l 0TH£l TRANSPORT .... 504 ~JZ 1e61 a.e& z.u lei o.s
FJ-.NtJNG, IN$UlANCE II! ..,, .... le41 z.u 1.oz •• s l.l JJNAHtlAL INSTITUTIONS IM 414 151 a.oz a.n a.zo 4.~ 1 •• ~~~ANtt CORPANlES an 104 10. De45 0.16 Dell •• 4 o.a
RlSCELLAMtDUS illlYltES I til 1445 IU1 t.60 •.n u •• z a.• 1.9 Al!lAURANTSt HOTELS ne •9o 114 z.u a •• , 1.06 1.4 l.i IDU~TIDNtllSlARtHtPUI. &04 119 ... 0.16 o.az o.n o.s 1el MIALTHt VEllll. SllYitlS IJO 152 .,. o ••• &.11 z.ot ..3 4.2 DTNP IERVJCU ... 1114 Ull 1.n 4.41 ..... 1·• ).6
IIUILIC SEAYICES &Dte 1161 40U a.os u.M lt.9l J.'t lei ~l.aLJt &DRlltll. I DIFIMtl ltiO ll•t 11U '··· 11.10 14.91
~·· a.e
IOCIAL HCURJTY 141 198 119 o.s1 0.14 o.ts 1·3 1.9
.aJVAtE HD~EH. & DlliAitll. 'r64 •• 1 an z.9:. !.60 I ell -o.1 z.o PAJVA1£ HOU~lHOLDS Ill 95 n 1.46 o.:u 0 • .29 •10.1 -z.• MQh-PAOFIT ORGANISe IU .02 no 1.41 1.24 1.09 .. , "·'
1Dt&L a•ou 16149 15HZ 100.00 100.00 aoo.oo o.z ·"·' ·------------------.,_,__. ______________ _.. _______________ .,. ____________ _,__ ___________________ ,. IDU.C.£1 iTA1JSTl.tHLS IUNOkSARl CNAT10NAL •ttOUN1S), IFO•INSTJ1u1

13
which after 1973, employment decreases in all branches with the exception of plastic goods production, automobile manufacture and the aviation and space industries. But even in these above-named branches, the expansions of employment remained clearly behind that of the sixties during this period.
The expansion of employment in the service sector was predominantly supported by the public services, the non-profit making organisations and the health and veterinary sector. The field of "miscellaneous services" profited from the displacement of service functions which previously had been provided within the enterprises of the other economic branches. The spectrum ranges from the cleaning of buildings (internally) to taxation, legal and economic consultancy (including advice). The increasing demand for services of the software offices also created new employment. The expansion in·property consultancy and the new leasing branch equally led to a rapid expansion of employment. The trends based on structural alterations in employment were in principle. reinforced by technical and organisational changes.
Parallel to the structural change in employment by industry, alterations in the vocational struct~)es have taken place, in the period from 1973 to 1982 (Table 2.3):
- The service trade vocations have increased strongly, especially the social and educational vocations, the health service vocations and the commercial services (banking, trades, insurance agents inter alia). In 1982 the share of the service trade vocations amounted to 55 % against 42 % in the year 1961;
- the growth of the administrative vocations had clearly slowed down in the course of the seventies. As in the past, the demand was primarily for office workers and, above all, for data processing specialists;
- the number of employed persons in the agricultural and mining vocations was strongly retrogressive;
1) More recent data on the vocational structures were not available when this report went to press. In the total level of employment, the sectoral employment data differ from the vocational data because of the different methods of computation which were used. It must be assumed that the calculations of the National Accounts correctly reflect the employment level. The level for the vocational employment data appears to be exaggerated by the estimation methods used in the labour force survey (Chapter 7).

14
Table 2.3
Absolute Values (1000 s) Slllre (I) Av. chlnge (I)
1961 1973 1t82 1961 1973 1182 1961/73 1973/82
Agricultural trades 3 626 1 967 1 386 13.8 7.3 5.2 - 5.0 - 3.1
Mining trades 371 156 127 1.4 0.6 0.5 - 7.0 - 1.9
Manufacturing trades 9 641 ' 717 8 731 36.7 35.9 32.6 + 0.1 - 1.0 Cfletnical workers, plastic processors 313 293 274 1.2 1.1 1.0 + o.s - 0.7 Stone, ceramics and glass workers 193 136 101 0.7 0.5 0.4 - 2.9 - 2.7 Metal producers and processors 1 176 971 176 4.5 3.6 2.9 - 1.5 - 2.0 Fitters, -.chanics 1 885 2013 2 057 7.2 7.4 7.7 + 0.6 + 0.2 Electricians, asselblers 623 769 746 2.4 2.8 2.8 + 1.8 - 0.3 Paper and printing trades 294 251 212 1.1 0.9 0.8 - 1.2 - 1.5 liloochlorlters 532 385 375 2.0 1.4 1.4 - 2.7 - 0.2 Textile and clothing trades 1 218 782 494 4.6 2.9 1.8 - 3.6 - 4.1 Food trades 628 556 605 2.4 2.1 2.3 - 1.0 + 0.8 Building tractesb) 983 983 143 3.7 3.6 3.5 o.o - 0.4 Dec ora tors. painters 383 397 369 1.5 1.5 1.4 + 0.3 - 0.7 Quality controllers, 1111 order workers 439 424 367 1.7 1.6 1.4 - 0.3 - 1.3 Ancillary workersC) 657 1 401 1 068 2.5 5.2 4.0 + 6.5 - 2.4 Machinists 317 3S6 344 1.2 1.3 1.3 + 1.0 - 0.3
Technical trades 845 1 399 1 559 3.2 5.2 5.8 + 4.3 + 1.0 Engineers 429 us 1.6 1.8 + l.l Chemists. physicists, llthellticians 45 51 0.2 0.2 + 1.1 Technicians 707 792 2.6 3.0 + 1.0 Technical special istsd) 218 231 0.8 0.9 + 0.5
Service trades 11 032 13 489 14 843 42.0 49.8 55.5 + 1.7 + 0.9 Sales staff 1 979 2 082 2 077 7.5 7.7 7.8 + 0.4 o.o Transport trades 1 881 1 723 1 590 7.2 6.4 5.9 - 0.7 - 0.7 Service trade .. rchants 385 637 771 1.5 2.4 2.9 + 4.3 + 1.8 Bodycare, hotel and cleaning trades 1 579 1 476 1 U4 6.0 5.5 5.5 - 0.6 - 0.1 Educational workers 482 809 1 210 1.8 3.0 4.5 + 4.4 + 3.7 Health service workers 457 767 1 089 1.7 2.8 4.1 + 4.4 + 3.2 AdministretitJt trades 2 691 3 916 4 237 10.3 14.5 15.8 + 3.2 + ~.7
Auditors. cashiers QO 420 364 1.8 1.6 1.4 - 1.1 - 1.3 Dlta processing specialists 34 73 131 0.1 0.3 o.s + 6.6 + s.s Office .,-kers. office helps
} 2 245 3 058 3 376 } 11.3 12.6 + 0.9
Stenographers, stenotypists. typists 365 366 8.6 1.3 1.4 o.o Or91nisation and .. nagement trades 703 858 1 060 2.7 3.2 4.0 + 1.7 + 1.9 Security and policing trades 731 1 033 1 125 2.8 3.8 4.2 + 2.9 + 0.8 Artistic professions 144 188 220 o.s 0.7 0.8 + 2.2 + 1.4
Miscellaneous workers 738 338 128 2.8 1.2 0.5 - 6.3 - 8.4
Total 26 253 27 066 26 774 100.0 100.0 100.0 + 0.3 - 0.1
a) Dcllestic •plo~nt accordinJ to national census results or to the labour force survey of 1982. • b) Without building ancillary workers. - c Including building ancillary workers. - d) Including stage. screen and sound technicians.
Source: Statistisches Burtdes•t (Census. Labour force survey).

15
- the rundown which began in the seventies in the manufacturing trades continued until 1982, reinforced by the cyclical downturn;
- this was contrasted with a further increase in the numbers employed in the technical professions.
The change in the occupational structure can be traced back to two components of employment variation: The first component results from changes in the sectoral composition of employment (industry effect), the second from variations in the occupational structure within specific industries (occupational effect). These components can be calculated artificially by using the shift share analysis, which varies one of the structural components isolated, while the other remains unchanged. The results are presented in Table 2 .4. Interpreting them one has to keep in mind, that the figures are derived from pure statistical calculation which does not allow any causal interpretation. Moreover the results lagely depend on the level of aggregation in both dimensions, the industrial as well as the occupational.
As is shown in Table 2.4 most of the manufacturing occupations were negatively affected by the change in industrial structures during the period 1970 to 1982, while service occupations, except sales and transport occupations were positively affected. The same is true for the occupational effect.
Thus, both, the industry effect as well as the occupational effect, have had a similar influence on the displacement of vocational structures in direction to service trade activities.
The structural change in employment and the alterations in the vocational structure mainly affected the wage earners who ar~
primarily employed in manufacturing industry and in the construction industry. Their number fell back in the period from 1970 to 1985 by approximately 2.4 million (Table 2.5). The gainers were the salaried workers and the civil servants who profited from the expansion of administrative staffs right across the economic branches and from the increase in employment by the state. Their number rose in the period named above by about 2.5 million. Since the beginning of the seventies there have been more employees and officials than workers in employment in the whole national economy.
Until the end of the seventies approached, the decrease in employment in agriculture and forestry and the continuing process of concentration in the sector of goods production and distribu-

16
Table 2.4
Schift ahare analyais of eaployment by industry and occupation 1970 to 1982
coaponentsb)
Occupation Ret cbaql)
indus-of abares occupa- joint (%-points) trial tional effect effect effect
Agricultural trades -2.7 -2.4 -o.3 o.o Mining trades -0.2 -o.1 -o.1 o.o Chemical workers, plastic processors -o.4 -o.1 -o.3 o.o
Stone, ceramics and glass workers -0.2 -0.1 -0.1 o.o
Metal producers and processors -1.4 -0.2 -1.3 0.1
Fitters, aechanics -o.s -o.3 -o.s 0.3 Electricians, assemblers -o.2 -o.3 0.2 -o.1 Paper and printing trades -o.4 -0.1 -0.3 0.1 Woodworkers -o.3 -o.2 -o.2 o.o Textile and clothing trades -1.7 -1.2 -o.7 0.2 Food trades -o.l o.o 0.2 o.o Building trades -o.s -o.4 -o.4 o.o Decorators, painters -o.2 0.3 -o.4 -o.2 Ancillary workers 0.6 -0.4 1.0 0.1 Machinists o.o -o.l 0.1 -o.l Technical trades 1.0 o.o 1.2 0.2 Sales staff -o.3 -0.3 0.1 o.o Transport trades -o.s -0.2 -o.6 o.o Service trade aerchants o.s 0.6 -o.1 -o.1 Bodycare, hotel and cleaning trades -0.1 0.7 -0.6 0.2
Educational workers 1.8 1.1 o.s 0.2 Health service workers 1.7 1.3 0.3 0.1 Administrative trades 2.0 0.9 1.2 -0.1 Organiaation and aanageaent trades 1.5 0.3 1.3 -0.1
Security and policing trades 0.6 0.9 -o.2 -0.1 Artistic professions o.o 0.2 -o.1 o.o
a) Total employment • 100. - b) The industrial effect is calculated with the assumption of aectoral employment changing alone while the occupation-al structures of the aecotrs raain unchaqed. The occupational effect varies the occupational structures of the aectors only while eaployment by aectora reaaina unchanged. The joint effect 1& the reault of the cc.bined variation of both dimension• and cannot be aeparated.
Source: Ifo-Institute.

17
Table 2.5
Occupational statusa)
1970 1975 1980 1985b)
Hale and female
(1000)
Employers, selfemployed 1 725 1 348 957 861
Family workers 2 679 2 439 2 356 2 425
Civil servants 1 937 2 196 2 324 2 406
Salaried workers 7 768 8 762 9 611 9 753
Wage earners 12 450 11 002 11 031 10 025
Total 26 560 25 746 26 278 25 470
I
Employers, selfemployed 10.1 9.5 9.0 9.5
Family workers 6.5 5.2 3.6 3.4
Civil servants 7.3 8.5 8.8 9.4
Salaried workers 29.2 34.0 36.6 38.3
Wage earners 46.9 42.7 42.0 39.4
Total 100.0 100.0 100.0 100.0
Share of woaen (%)
Employers, selfemployed 21.0 21.0 21.0 21.1
Family workers 84.4 85.3 86.1 86.8
Civil servants 11.6 16.1 19.1 20.6
Salaried workers 48.8 50.9 51.9 52.4
Wage earners 28.2 28.3 27.7 28.6
Total 35.9 37.2 37.3 38.2
a) Domestic employment. - b) Preliminary.
Source: Statistisches Bundesamt (National Accounts); Ifo-Institut.

18
tion reduced the number of the self-employed by 320,000 persons. But in the middle of the seventies this process had strongly decelerated, and in the first half of the eighties bas swung round into an increase in self-employment. This constitutes the alteration of the generally known trend which had continued since the beginning of the fifties.
New entrepreneurial and selfemployed jobs have been founded predominantly in the service sector, which in the meantime has developed into the domain of self-employed activity (Table 2.6). Restaurants, hotels, health and the huge sector of miscellaneous services are the fields of activity in which the number of the self-employed bas grown steadily. But simultaneously in the goods producing industry, in trade and even in agriculture and forestry the decrease in the number of the self-employed has slowed down. In view of the deteriorating position on the labour market, the self-employed were no loger offered· attractive employment alternatives in the sector of dependent employment to the same extent as in the past. In addition, and presumably for the same reason, a number of young people or of the unemployed moved into selfemployed activities.
Table 2.6
Employers and self-employed persons
(1000)
Industrya) 1970 1975 1980
Agriculture, forestry, fishing 765 621 512
Manufacturing 481 412 413 Construction 168 157 149 Trade 585 556 541 Transportation 78 76 83 Financial inst., insurance 31 37 43 Miscalleneous services 572 581 613
Total 2 679 2 439 2 356
Without agriculture, forestry, fishing 1 915 1 818 1 844
a) Classification: Systematik der Wirtschaftszweige fUr die Berufsz~hlung 1970). -b) Preliminary.
1985b)
502 403 140 561
83 45
690
2 425
1 923
(Fassung
Source: Statistisches Bundesamt (National Accounts); Ifo-Institut.

19
Since 1970, the number of family workers has approximately halved. But here too there is a clear deceleration of the process at a low level meanwhile.
The proportion of women in total employment has risen since 1970 from 36 % to 38 %. In particular among the civil servants and salaried workers there has been a clear increase in female employment whereas their share in wage earning vocations and in the self-employed remained unchanged (Table 2 .5). These changes are closely connected with the structural change in employment by industry and with the alteration of the vocational structures.
On the whole, negative effects on female employment resulted from sectoral structural change in the period from 1970 to 1985. This is connected primarily with a strong down-trend among women helping in agricultural enterprises, but it ist also to be traced back to the decrease in employment in the leather, textile and clothing sectors, as well as in electrical engineering, precision machinery and optics, metal goods and musical instruments, toys etc. The impulse for demand on the other hand, stemmed from the expansion of employment by the state, especially in education and the health service, as well as in the private non-profit organisations and in the miscellaneous services. But they alone were not adequate to compensate for the negative impulses from the other sectors.
The advance of women on the labour market is therefore governed substantially on the demand side by the changes in the branch-specific vocational structures in the direction of administration and services. But it is also connected with changes on the supply side. Women were able to increase their share of employment in a whole series of vocational fields. This applies particularly to those vocational fields which were previously the focal points for female employment, i.e. the trading and administrative vocations, and the educational and health services. In the sector of manufacturing trades, the female proportion has, on the other hand, decreased with the exception of the metal, textile and clothing trades.
2.1.3 Working time
In the second half of the seventies the disputes in collective bargaining between the trade unions and employers were concentrated increasingly on the question of reducing working hours, because, in the development. of the working week, stagnation had

20
practically been reached. The reduction in the annual working time of fully employed workers had clearly slowed down in the period from 1973 to 1985 when compared with 1963 to 1973, especially when the collectively agreed working time component is observed (Table 2. 7). In 1985 every full-time employee worki~ on average 1 804 hours a year against 1 979 hours in 1973. This decrease is mainly the result of the reduction in the contractual weekly working time, as well as of the extension of the contractual annual vacation. Solely because of these two factors there was an additional reduction of the annual working time by 108 hours in 1985 against 1973. Moreover, the decrease of overtime caused a further decrease amounting to 57 hours per year.
Table 2.7
Annual working time of full-time workers
(hours per year)
1960/73
Average working time (beginning of the period) 2 218
Components of working time changes:
- Weekly hours (collectively aggreed) - 193
- Annual vacation (collectively aggreed) - 62
- Public holidays - 15 - Shortfall hours (short time
work, strike, bad weather) - 5 - Overtime + 36
Total change - 239
Average working time (end of the period) 1 979
1973/85
1 979
- 59
- 49 - 7
- 3 - 57
- 175
1 804
Source: Institut fUr Arbeitsmarkt- und Berufsforschung; Ifo-Institut.
1) Loss of working time due to illness is not taken into account.

21
The breakthrough in the reduction of weekly working time was achieved in 1984, when a contractual weekly working time of 38.5 hours was agreed for the metals industry. At the end of 1985, contractual weekly working times of less than 40 hours were applicable to 27 % of the workers. For a further 12 %, agreements had already been concluded in accordance with which the working time will be reduced in the years 1986 or 1987. Almost all the other contractual agreement provide for a 40 hour week.
Apart from the dispute on collective bargaining policies, in the second half of the seventies an intensive discussion began concerning the flexibility of working time. By increasing parttime employment, job-sharing, sabbaticals, variable transition to retirement etc., it was hoped on the one hand that more freedom would be created for the realisation of individual preferences of the workers and that the number of the employed would be increased. On the other hand, greater flexibility in individual working times should open up the potential for prolonging the operating time of the production facilities. Thereby the capital costs per unit of output could be reduced, capital investment saved and additional employment could be created.
Among the employed persons, in the past between 15 and 50 % of those surveyed have advocated reducffons in working time, depending on the method of the survey. The number of those in favour was, above all, large at that time when the question was oriented towards the personal wishes of the worker. About one quarter of those surveyed was prepared to accept reductions in income in exchange for a decrease in working time. In the list of various possibilities for the reduction of working time the reduction of age limits for retirement ranked before the reduction in weekly working time and this in turn ranked before the prolongation of holidays. But all three forms find strong support. As regards weekly working time, it has been found that the unskilled and skilled workers vote more frequently for a constant or longer working week, while on the other hand the younger workers and single people without children are more frequently interested in a reduction than the average of those employed.
Most frequently it was the night workers, shift-workers and workers with a high proportion of overtime who advocated a shorter working week. Therefore the interest in working time reductions is not quite uniformly distributed among the workers and it is unmistakenly limited by the reductions in income which are associated with reductions in working time.
1) Landenberger (1983).

22
More recent results from the surveys indicate that the progress already achieved in the reduction of the weekly working time, on the one hand, and the weak income trends in the first half of the eighties, on the other hand, have reduced the degree of preference for further reductions in working time. As the results of the Employee Survey made by the European Community show, in 1977 55 % of workers still preferred shorter working times to an increase in income, whereas in 1985 the figure was only 30 %. In contrast, the proportion of those who prefer a highe
1)income to
shorter working times has increased form 35 to 56 %. Here the Federal Republik of Germany is not alone. With the exception of Italy, where previously a higher proportion of workers was interested in increasing income, the same shift can be found in all the European Community countries. The change in attitutde was strongest in Great Britain.
The actual implementation of more flexible forms of working time can only progress very slowly, in contrast to the existing intentions. This can be recognised in particular from the trend of part-time work. In 1984 its proportion amounted to 11.6 % on the average of the national economy (Table 2.8). But ten years ago it already amounted to 9 %. Little has changed in this period with respect to the sectoral concentration of part time working in trade, services and private non-profit organisations.
The share of women rose still futher in the past and amounts today to 92 %. Compared with other industrial nations, the parttime ratio in the Federal Republic of Germany is relatively low. In particular, the Scandinavian countries, i.e. Sweden, Norway, Denmark, but also Great Britain, The Net~rlands and the states of North America have higher proportions. Beyond that, part-time working has experienced clearly greater growth rates in these countries in the course of the seventies.
The slow expansion which was observed in part-time work is. surprising in view of the strong demand for part-time jobs. In particular, married women, women who are fully employed and older workers J~pressed a special interest in response to the available surveys. However, the supply of part-time jobs remained relatively small. According to a survey which was carried out by the Ifo-Institute in 1977, the enterprises of the manufacturing industry considered at that time that only an additional 5 % of jobs could be shared. In trade t~) figure was 10 % and in the construction industry it was 2 %. The slow growth of part-time work
1) Commission of the European Communities (1985). 2) OECD (1985), P• 26. 3) Landenberger (1983), PP• 81 et seq. 4) Friedrich, Spitznagel (1978), pp. 246 et seq.

23
Table 2.8
Part-time work 1984
(as % of employed persons)
Total Male Female
~: 15 - 25 4.6 2.5 7.2
25 - 35 11.3 1.8 26.0
35 - 45 15.0 o.a 40.5
45 - 55 14.3 0.7 40.5
55 and more 14.0 2.7 35.6
Sort of labour contract:
Unlimited 11.4 0.9 28.7
Fixed term 12.4 6.4 21.9
Sector:
Agriculture, forestry, fishing 11.0 4.4 27.2
Energy, mining and quarring 2.9 0.6 24.4
Manufacturing 6.7 1.1 21.5
Construction 3.9 1.1 33.7
Trade 21.1 1.7 34.9
Transportation, post and communication 8.o 1.1 31.5
Financial institutions, insurance 11.0 0.9 21.3
Miscellaneous services 20.0 4.7 28.1
Private services 8.6 0.9 27.0
Private households, non-profit organisations 30.3 6.0 43.1
Total 11.6 1.5 27.9
Source: Statistisches Bundesamt (Labour force survey).
24
which could be observed in the subsequent years has confirmed the low propensity of the enterprises to offer part-time jobs.
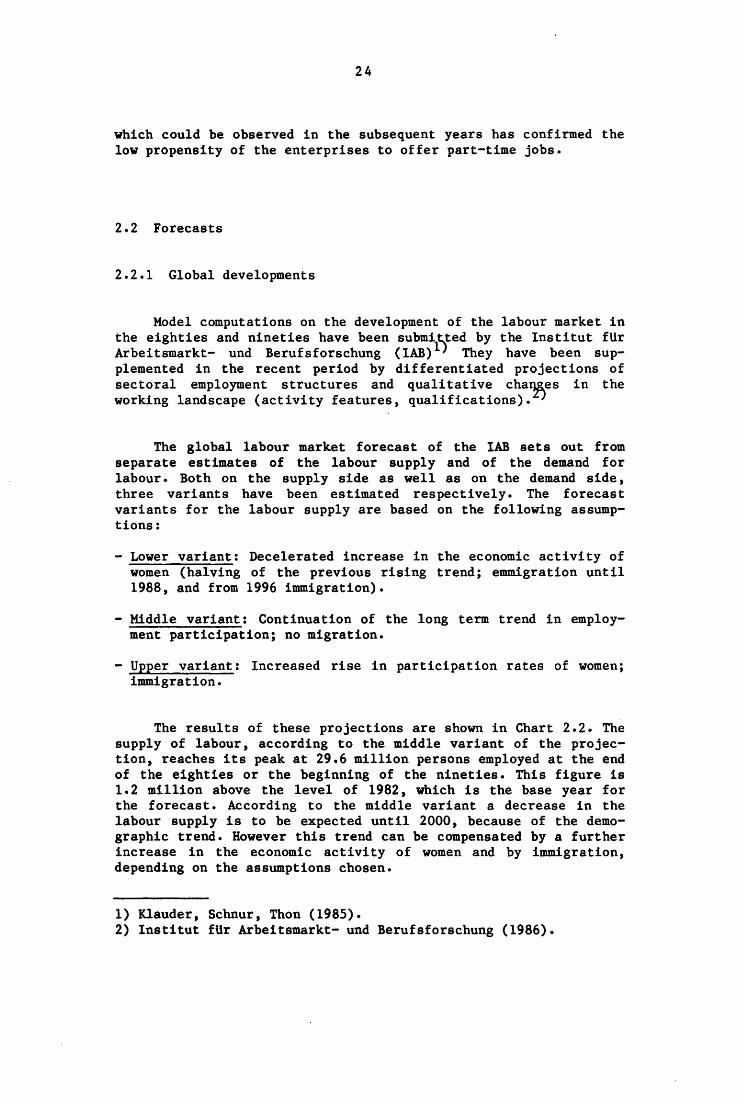
2.2 Forecasts
2.2.1 Global developments
Model computations on the development of the labour market in the eighties and nineties have been submi
1)ted by the Institut fUr
Arbeitsmarkt- und Berufsforschung (lAB) They have been supplemented in the recent period by differentiated projections of sectoral employment structures and qualitative cha~es in the working landscape (activity features, qualifications).
The global labour market forecast of the lAB sets out from separate estimates of the labour supply and of the demand for labour. Both on the supply side as well as on the demand side, three variants have been estimated respectively. The forecast variants for the labour supply are based on the following assumptions:
- Lower variant: Decelerated increase in the economic activity of women (halving of the previous rising trend; emmigration until 1988, and from 1996 immigration).
- Middle variant: Continuation of the long term trend in employment participation; no migration.
- Upper variant: Increased rise in participation rates of women; immigration.
The results of these projections are shown in Chart 2.2. The supply of labour, according to the middle variant of the projection, reaches its peak at 29.6 million persons employed at the end of the eighties or the beginning of the nineties. This figure is 1.2 million above the level of 1982, which is the base year for the forecast. According to the middle variant a decrease in the labour supply is to be expected until 2000, because of the demographic trend. However this trend can be compensated by a further increase in the economic activity of women and by immigration, depending on the assumptions chosen.
1) Klauder, Schnur, Thon (1985). 2) Institut fUr Arbeitsmarkt- und Berufsforschung (1986).

25
Labour market projections 1982-2000 Mio ., .,
•
22
~~ J
tiiO
~ """ ~ c: ~ ~
""' """'
supply ~"" v ~~~~ ~
~ ~
~ i'-,., ~ l demand
I\. J
1170
~ )..,.. ~
.,., IJ ~ I'"
J~ ~ . -r, .. •t-o
~ ilo
/ ~
~ ~ "' ~~ il 11
. I
~ reg•stered + non - registered unemplo (fl'lent
tl\"' \..
, ' II \ ~ ~ - ""'"
. --~ , ..
JJ ... i"""' ~ ~ ._ ~
~ .... ~
~ .. '~ '
1175 1110
Ctwt 2.2
IJJ.LL' -~ IIIII • ~
-~ . middle case
~~ ~~
1- ~ ~ ~ ~~ " ..
" .. 1'-
lower case I'
uppercase, -~~ l.,;ool
~ ~
I middle case
f" ~~ lower case ~
~~,
"~ I.
' ~
,. Source: lnstitut fur Arbeitsmarkt- und Berufsforschung, Klauder, Schnur, Thon (1985).
The estimate of labour demand is based on various assumptions concerning the long term growth of the economy, on working times and on productivity. It is assumed that productivity depends positively on the growth of value added (Table 2.9). The estimate of this relationship is made on the level of the individual economic sectors. As regards working times, it is assumed that after the slow down in the second half of the seventies the speed of working

26
time reduction will accelerate again in the future. On the average, a decrease of 1 % per year is expected.
According to these assumptions, a long-term growth of the economy of 2.5 % per annum until the year 2000 could approximately keep number of jobs at the same level as in 1984 (middle variant). In the case of 1 % of annual growth (lower variant), a reduction of about 3.5 million jobs should be expected by the year 2000. In the case of the upper variant (3% annual growth), about 1 million additional jobs could be created. The trend of labour demand, however, will in no case be adequate to fill the gaps in the labour market. Even in the most favourable case of high growth and slow increase of labour supply, 800,000 registered unemplot~d persons must be expected by the end of the century (Table 2.9).
However, this combination of assumption possesses only a limited degree of plausibility, because the rising demand for labour as well as the economic participation of women and immigration might well provide certain stimulants. Therefore the highest probability stems from the combination of the respectively upper, medium and lower variants for both supply and demand. In the case of the registered unemployed persons, this is shown in Table 2.9 by the diagonal line from the left at the top to the right downwards. None of this figures allow the assumption that by the year 2000, the number of registered unemployed persons will fall below the level of today.
2.2.2 Structural change
On the basis of the forecasts for the global labour market trend, structural change by industry until the turn of the century has f>een forecast in a joint study made by PROGNOS-AG and the· lAB. The three scenarios for growth mentioned in the chapter before were used as the points of departure for a demand-oriented structural model. Structural change in production is derived in this model from changes in the compos! tion of national economic demand {private consumption, public consumption, investments, exports and imports) and from the structural changes within these components. The integration of the production sectors was taken into consideration by input-output tables. Productivity growth was
1) The number of registered unemployed persons results from the difference between the labour supply and the demand for labour (1.2 million) and the assumption that 67 % of those unemployed are registered at the labour offices.
2) See Institut fUr Arbeitsmarkt- und Berufsforschung (1986).

27
Table 2.9
Labour market projections by the year 2000
(base year 1982)
Lower Middle variant variant
Change per year
Gross domestic product (real) + 1.2 + 2.5
Average working time per head - 1.3 - 1.0
Productivity per hour + 3.2 + 3.5
Labour demand - o. 7 - 0.1 (1982: 25.6 million) 22.6 25.3
Labour SUEElia) Million (1982: 28.4 million)
Lower variant - 27.5
Middle variant - 28.5
Upper variant - 30.1
Resistered unem2lo~ent (1982: 1.8 million)
Lower variantb) 3.0 1.4
Middle variantb) 3.6 2.0
Upper variantb) 4.6 3.0
Upper variant
in %
+ 3.0
- 1.2
+ 4.0
+ 0.2 26.3
---
0.8
1.4
2.3
a) Total employment plus registered and non-registered un-employment. - b) Variant for labour supply projection.
Source: Klauder, Schnur, Thon (1985).

28
forecasted on the sectoral level, with a differentiation being made between a trend component and an output dependent component.
The results of the sectoral forecasts confirm the secular trend to the service sectors. In the year 2000, the share of the service sectors of total employment might well amount to 58 % compared with 50 % in 1980 (Table 2.10). The service sector will remain on a growth track until 2000 a.d.: Using the assumptions of the middle variant from 1982 to 2000, a growth of employment amounting to 1.3 million persons can be expected (+1.7 million in the upper variant, -280,000 in the lower).
Table 2.10
Agriculture, for-estry, fishing
Goods producing industries
Trade, transporta-tion, services (incl. public services)
Total
Employment 1960 to 2000
(%)
Base 1960 1970 1980
13.7 8.5 5.5
47.9 48.9 44.2
38.4 42.5 50.4
100.0 100.0 100.0
a) Middle variants.
year 1982 1984 2000a)
5.4 5.5 4.3
42.7 41.5 38.0
51.8 53.1 57.6
100.0 100.0 100.0
Source: Institut fUr Arbeitsmarkt- und Berufsforschung (1986), P• 42.
Within the manufacturing industry the requirement for personnel increases in all three growth variants solely in the sectors of precision machinery, optics as well as aviation and space. Employment by the state will also rise, though by no means as strongly as in the past. Increases in employment are also to be anticipated, partly accelerating and partly decelerating, primari-
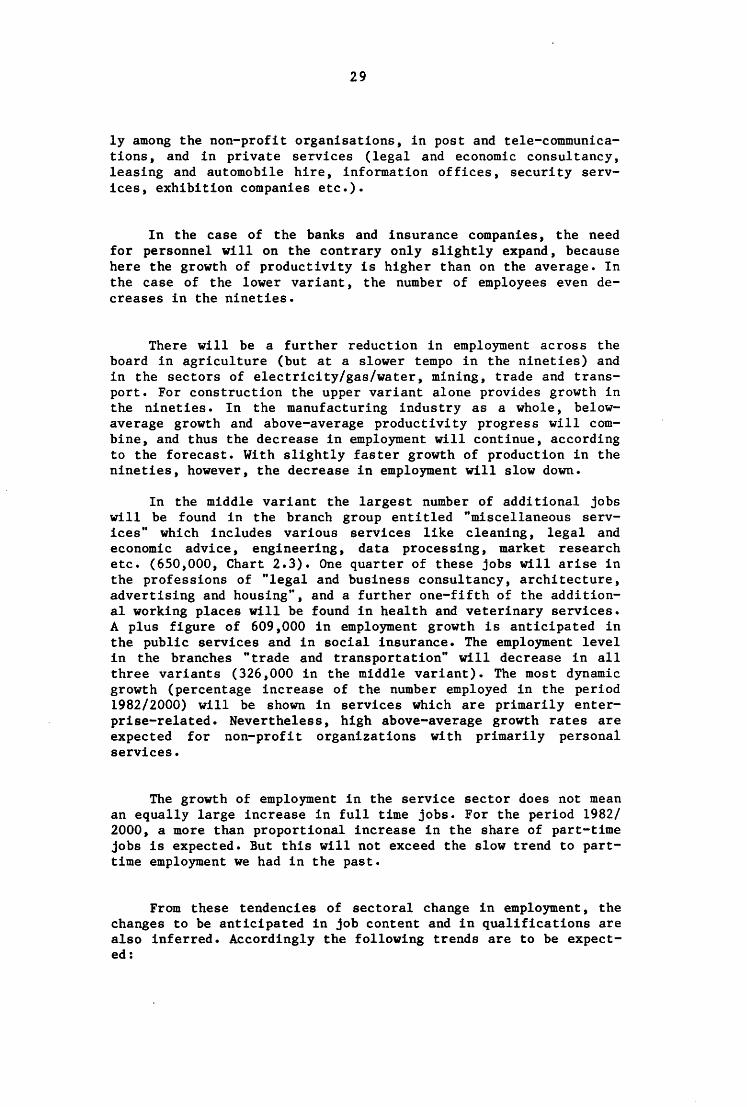
29
ly among the non-profit organisations, in post and tele-communications, and in private services (legal and economic consultancy, leasing and automobile hire, information offices, security services, exhibition companies etc.).
In the case of the banks and insurance companies, the need for personnel will on the contrary only slightly expand, because here the growth of productivity is higher than on the average. In the case of the lower variant, the number of employees even decreases in the nineties.
There will be a further reduction in employment across the board in agriculture (but at a slower tempo in the nineties) and in the sectors of electricity/gas/water, mining, trade and transport. For construction the upper variant alone provides growth in the nineties. In the manufacturing industry as a whole, belowaverage growth and above-average productivity progress will combine, and thus the decrease in employment will continue, according to the forecast. With slightly faster growth of production in the nineties, however, the decrease in employment will slow down.
In the middle variant the largest number of additional jobs will be found in the branch group entitled "miscellaneous services" which includes various services like cleaning, legal and economic advice, engineering, data processing, market research etc. (650,000, Chart 2.3). One quarter of these jobs will arise in the professions of "legal and business consultancy, architecture, advertising and housing'', and a further one-fifth of the additional working places will be found in health and veterinary services. A plus figure of 609,000 in employment growth is anticipated in the public services and in social insurance. The employment level in the branches "trade and transportation" will decrease in all three variants (326,000 in the middle variant). The most dynamic growth (percentage increase of the number employed in the period 1982/2000) will be shown in services which are primarily enterprise-related. Nevertheless, high above-average growth rates are expected for non-profit organizations with primarily personal services.
The growth of employment in the service sector does not mean an equally large increase in full time jobs. For the period 1982/ 2000, a more than proportional increase in the share of part-time jobs is expected. But this will not exceed the slow trend to parttime employment we had in the past.
From these tendencies of sectoral change in employment, the changes to be anticipated in job content and in qualifications are also inferred. Accordingly the following trends are to be expected:

30
Chart 2.3
~ployment by sectors
(net change 1982-2000; (1000); middle variant)
Miscellaneous services Public services Private households and organis. Conrnunicat ion t---....----' Financial Institutions Mechanical, optical instr. Air and space crafts Food, beverages, tobacco Insurance Rolling and drawing mills
1 2 3 6 1 8
10 10 10 11 16 22 25 21 21 29 30 3~ 51 64 64 68 S3
- 101 - 110 - 124 - 219 - 215 - 284 - 290
Office, computing machinery Glass and glass products Pottery, china and earthware Pulp, paper, paperboard Structural metal products Foundries Ship building Wood processing Petroleum refineries Music instruments, toys Rubber products Plastic products Electrical equipment Non-ferrous metal Leather products Fabricated metal products Machinery Paper products Furniture, wood products Jron and steel Printing Energy, gas, water
~--r Wearing apparel ,___..,.. Transportation
..------1 Textiles Chemical industry
r---"------t Wholesale trade. retan trade ....,.._------1 Motor vehicles, repair i--------1 Construction ------- Agriculture, forestry, fishing
Source: Institut fUr Arbeitsmarkt- und Berufsforschung; PROGNOS AG.
+ 650 + 609 + 208 + 95 + 60
-+ '1 + 2S + 23 + 10 + 10

31
-In the year 2000, there will be about 17.7 million in the labour force who carry out tasks in the infrastructure and in the service trades, but only 6.6 million who perform production work.
- In the sectors of goods production 54 % (in 1980 the figure was 58 %) of the labour force will carry out production work.
- In 1980 there were 59 % of total employment still engaged in fields of activity which will shrink in numbers by the year 2000, of the male workers in 1980 about 84 % were employed in these groups (of female workers this figure was only 64 %); for foreigners, the share in 1980 was 77 %.
- Activity in the sectors "research and development" and "management", will expand fastest according to the forecast (from 0.3 to 1.3 million). This growth is higher than that in the sevice t·rades in the narrower sense of the term (+0.2 up to 1.0 million).
This shift in the activity structures might well lead on its own to a higher requirement for workers with factory and school vocational training, and especially for university and high school graduates. If one already assumes a continuation of the trend towards higher qualifications, this tendency will clearly be reinforced. The requirement for labour without training will decline from about. 30 % at present to less than 20 %.
The share of jobs for the specialist school level will remain substantially unchanged at from 6 to 7 %, whereas for the qualification levels "factory training/vocational schools" the highest rates of growth are projected: for the first-named level 58 to 60 % of all jobs will be available (against 53 % in 1982) and for the second named level 13 to 15% (8.5% in 1982).
In particular, for the high school graduates a comparison with the corresponding estimates of supply shows that in the longterm view, there will be a requirement for academic graduates which could be approximately equal to the future supply.
2.3 In search of new areas and new forms of employment growth
Ten years of high unemployment on the one hand, and the prospect of continuing labour surpluses on the other have not left the debate on employment policy in the Federal Republic of Germany untouched. If in the first years after the recession in 1974/75 it
32
was still hoped that unemployment would disappear again in the next cyclical upturn, this optimism has today evaporated. In the present discussion unemployment is primarily seen as a long term and structural phenomenon. Consequently new questions have been thrust into the foreground of the debate on labour market policy:
- Had the continuing pressure of high unemployment and the change in employment policy outlook any consequences for the behaviour of the suppliers and employers of labour, or does labour market rigidity remain untouched in the disequilibrium?
- In the intensive discussion on labour market flexibility, is there a new mobility of labour to be discerned, in which the job-seekers make better use of their opportunities, or is flexibility only reasonally expected of those who have in any event no possibility of choice?
- Were new forms of employment developed in the continuing disequilibrium which also create access to the labour market for those who were formerly excluded from it?
- Lastly how have the politicians reacted to the rise of unemployment and what opportunities are offered by changed forms of employment as instruments of an active labour market policy?
The following observations are linked with these questions. The subject of observation, new forms of employment, necessarily leads the analysis into areas which have previously only been developed in first principles, and therefore are more on the margin than in the centre of the labour market development. Nevertheless, in these marginal phenomena possibly important changes in labour conditions are appearing, which for the years ahead of us provide some starting points for political action.

33
3. New forms of employment growth
The changes which have been illustrated above in the sectoral and vocational structures of employment constitute an important phase in the description of a changing labour landscape. But the description of such changes on the basis of alterations in the figures of the economically active persons must remain incomplete, since they only cover quantitative displacements between the fields of employment. Over the period of decades which is observed in such analyses, however, new vocations appear, old vocations disappear and above all they alter their vocational content in the process of technical change. Vocational definitions are redefined, fields of activity are altered, new work means are employed etc. Moreover the social position, with which the exercise of a vocation is connected, changes. All these modifications, however, are not detected when using fixed vocational classifications.
The inadequacy of vocational statistics led during the seventies in the Federal Reppflic of Germany to an intensive discussion of vocational content. The discussion showed that an adequate description of this change is not possible within the framework of static vocational classifications. The content of vocations extends to various dimensions and can scarcely be described in one word. For the specification of vocational content, information is important on the following:
- the object of the vocational activity, - the working means, - the place of work, -the functional area (department, organisational unit), - the necessary qual~fication and - the social status. )
In the light of this study, which is primarily concerned with functional changes in vocational content, the change in job duties and qualifications was placed in the foreground. These aspects were surveyed by the research in multiple ways:
- The vocational contents were made more precise by the use of additional indicators. The important aspect was primarily to detect the main activity of those working in the economy. Thereby the shifts of definitions of duties and vocational contents within individual trades could be described.
1) A summary of the discussion is to be found in BC:Shl, Stoo.B, Troll (1980).
2) Op.cit. p. 158.

34
- Further details were supplied by a large variety of case studies which were concerned with the effect of technological and of organisational changes on vocational contents.
- Finally, differentiated observations of changes in occupational structures can be used in order to demonstrate - at least on the level of individual branches - the changes in the spectrum of duties of production characterized by the division of labour.
3.1 Main activity
For the better characterization of vocational contents an outline of activity characteristics was developed in the Federal Republic of Germany which makes it possible to classify in affordance with their primary functions in the working process. The functional scheme which is used today covers ten characteristic features:
- production (extraction, production, processing, building, planting, installation, assembly)
- regulation of machinery, maintenance (regulation, adjustment, control, operation and maintenance)
- repairs (repairs, improvement, restoration, renovation)
- trade (purchasing, sales, cashiers, intermediaries, client con-sultancy, negotiation, advertising)
- office work (typing, calculating, bookkeeping, programming, screenwork)
- planning and research (analysis, research, testing, checking, planning, design, formation, drawing)
- management (management, coordination, organisation, leadership)
- general services (restaurants, hotels, cleaning, ironing, pack-ing, loading, transport, sorting)
1) The first attempt at a survey on main activity was undertaken by the Deutsches Institut fUr Wirtschaftsforschung, Berlin, at the end of the sixties. In 1969 the features developed by the DIW were accepted for the first time in the official statistics in the questionnaire for the labour force survey. Comparative data are available for the surveys of the years 1973, 1976, 1978 and 1980. In 1982 the classification catalogue was altered again.

35
- security (supervision, application of laws and regulations, interpretation thereof, certification)
- training, information (education, teaching, consultancy, care, medical treatment, publishing, entertainment, lectures)
It can be seen from the differentiation of the vocations in accordance with these characteristics what changes have taken place in the typical vocational functions during the period. This is shown in Table 3.1 for the major vocational sectors and for selected vocations in the period 1973 to 1982. The changes which can be seen in the table allow the discernment of two basic tendencies:
- In the manufacturing vocations, in the course of automation of production the activities which are concerned with the production of goods have clearly lost weight in favour of the activities which are concerned with the operation, maintenance and repair of the production apparatus. Between 1973 and 1982 the share of those employed in the manufacturing vocation, whose main activity was the production of goods, fell from 62 to 53 %. On the other hand, the activities concerned with machine operation and maintenance have increased together from 21 to 33 %. This change was less due to the shift in employment to vocations which typically carry out such activities (for example machine operators) but it was primarily caused by the change in vocational content. Characteristic of this process are the vocations for electricians and mechanics which are shown in Table 3 .1. However, in other vocations of the manufacturing sector as well, corresponding trends can be found (for example the textile and clothing trades, and the building trades). The growing capital stock, moreover, required to an increasing extent technically qualified workers (engineers, technicians) in the functions of maintenance and repair.
- In the service trades, in contrast to the manufacturing trades, no tendency towards a shift in vocational content can be discerned. On the contrary, it seems that specialisation on the functions which are typical of the vocation has taken place. This is recognized, for example, in the case of sales workers, where the trading activities have increased in weight, but ohter functions, such as consultancy, control, and transport, have decreased. This process can be seen to a still greater extent in the case of office workers. The specialisation of this vocational sector can be regarded as an expression of increasing rationalisation of the administrative and service activities, in which ancillary functions are either transferred to other specialists or cut down.

36
'fable 3.1
lqula-
'rotal U.oa of flao- Otbar Occupatioaal aroupa •plor Procluc- •chi a- lapaira trade Office aiq, .........
acu:~-aDd aelectacl tear ••t
Uoa ery, wrk reaearch ••t tie a occupatioaa •1a-teDaDCe
1000 I
Aarieultural tradea 1973 1 967 90.6 I I I I I 0.3 I 1982 1 386 93.4 1.0 I 1.5 o.s 0.4 o.s I
M1aera, quarr,aen, 1973 1.56 87.2 I I I I I I I aDd related vorkera 1982 127 80.4 9.9 I I I I I I
Haaufaeturina tradea 1973 9717 61.8 7.8 13.1 1.1 0.4 0.6 0.6 14.6 1982 8 731 52.9 14.5 18.4 1.3 1.4 2.5 0.9 8.1
- NeehaDica 1973 896 52.8 14.4 24.5 I I I I I 1982 858 45.3 18.5 32.0 I I I I I
- Eleetridana 1973 688 40.2 6.3 35.0 I I 2.0 1.2 I 1982 680 34.5 22.7 33.1 1.2 2.4 ).2 1.3 I
- 'leztile aa&)elotb- 1973 638 76.0 2.1 u.o I I I I I iD& traclea 1982 397 72.8 7.3 11.4 I I I I I
- luildia& trade• e)
1973 1 257 88.4 0.8 8.1 I I I o.8 I 1982 1 013 80.2 2.0 13.2 I I I 1.3 I
Technical tradea 1973 1 399 15.6 3.8 s.o 2.0 2.3 45.0 n.o 15.3 1982 1 559 8.1 10.4 4.3 2.7 15.7 41.7 12.6 4.5
- Eaaiaeera, cheaiata, 1973 474 10.6 1.9 2.1 2.5 1.1 53.6 17.0 11.2 phyaiaiata, .. th-. 1982 536 3.9 6.2 1.3 3.1 12.8 51.2 17.8 3.7
- Teebniciana, tech- 1973 925 18.2 4.8 6.5 1.8 3.0 40.5 7.8 17.5 Dical apecialiata 1982 1 023 10.4 12.6 5.9 2.5 17.2 )6.7 9.9 4.8
Service tradea 1973 13 489 2.6 1.1 1.2 17.6 22.2 2.6 6.9 45.8 1982 14 843 2.3 1.8 1.4 17.1 28.6 2.2 6.6 40.0
- Sal•• wrure 1973 2 082 2.2 I 1.5 76.2 3.2 0.6 s.o 1~.9
1982 2 077 2.2 0.4 2.2 79.6 5.9 0.4 4.5 4.8
- Entrepreaaura, 1973 574 u.o I 1.7 22.0 4.9 4.0 44.8 9.4 .. uaera 1982 750 6.7 1.6 2.6 20.3 12.9 3.1 46.5 6.3
- Office vorkera 1973 2 929 I I I 9.6 59.4 5.0 7.9 15.9 1982 3 262 I I I 9.0 74.9 2.1 5.8 5.7
- Bealth aenice 1973 767 I I I 2.5 3.5 I I 91.9 wrura 1982 1 089 I I I 3.2 4.4 ).2 I 86.9
All occupatioaa 1973 27 066 31.5 3.6 5.6 9.6 u.s 3.9 4.3 30.0 1982 26 774 24.2 6.5 7.1 10.3 17.4 4.5 4.7 25.3
a) Tranaportatioa, coatrollina, aeeurina, peraoaal aervicea, educatina aDd inforaina, ao reapoue. -b) bcludiD& leather aDd peltry aaura. - c) tne1ud1aa ancillary vorlten.
Sources ltatiatiacbea luDdea .. t (Labour force aurwey).
37
The spectrum of activities in the whole economy has been clearly displaced by the change in vocational content and the varying employment trends in individual vocational groups. Fewer people are employed in the production of goods, whereas administration, planing and management provide an increasing share of work. The production of goods takes place increasingly in automated production plants, which for their part require an increasing proportion of services and maintenance personnel. The decline in employment in goods production is thus not only due to the reduction of the number of production workers, but also in the functional sense to the decrease in production activities themselves.
3.2 Case studies
Aggregated data do not permit adequate recognition of the content changes in vocational tasks and the shift in qualification requirements, which result, in particular, from technological change. Case studies are therefore a necessary source of information in order to be able to cover qualitatively and quantitatively the effect of reorganisational processes during the introduction of technical innovations. However, they bring with them the danger that individual cases on the factory level may be generalized and new "revolutionary" effects are expected or feared from technical change. The actual trend contradicts these expectations. Case studies can therefore supply important details and improve reasons for the phenomena which are observed. However, their generalisation is only possible on the basis of representative computation processing.
The problem of the change in vocational qualification requirements has mainly been seen in the Federal Republic of Germany in connection with technological change. In the course of the seventies and eighties a series of studies was submitted which analysed on the level of individual plant the effects of new technologies on the labour market. The important works concerned with this group of problems were:
- the studies made by the Institut fUr Arbeitsmarkt- und Berufsforschung on the research problem "Effects of technical change on the labour force", in which the quantitative and qualitative effects of technical and organifftional changes in different economic branches were studied. These studies are distinguished by the fact that they include relatively high numbers of cases, and not only specific technology, but the entire spectrum
1) Cf. works by Lahner and Dostal.

38
of technical and organisational change. Thereby they provide an important precondition for generalisation;
- the sociological sffdies of industry, especially the wort,s by Kern and Schumann , but also by Mickler and Baethge in which the changes in the field of industrial production were studied;
- the later works on the effects of the use of micro-electronics particular in the 3~ield of information technology, administration and services;
In the comments below, it is only possible to summarize the results of these studies. Not all the studies have been concentrated on the aspect of qualitative effects which is important to this investigation. The summary of the individual results, however, provides a clear picture of the requirements for adaptation with which the labour force is confronted in the process of technical change.
The studies carried out by the Institut fUr Arbeitsmarkt- und Berufsforschung were done mainly during the seventies. They were concerned with the following economic sectors: commerce, metalprocessing industry, printing industry, food-stuffs industry, wood and plastic processing. For the years 1971 and 1979 a com~,rative study of the metal-processing industry was submitted. Even though the period, which was surveyed is relatively long ago, the results are nevertheless relevant.
With respect to the qualitative changes which result from the initiation of technical and orgagysational change, these studies came to the following conclusion:
- Labour requirements: here a clear decrease is found in burdensome environmental influences and physical stress. The intellec~ tual stress (increased attention), on the other hand, is increasing as well as the responsibility for men and machines. On the whole, increased demands on qualifications are clearly to be found.
1) Kern, Schumann {1970, 1984). 2) Mickler et al. (1978). 3) Institut fUr sozialwissenschaftliche Forschung (1980); Scholz
et al. (1980); Reinhard et al. (1983); Rohmert, Heider {1982); Troll {1982).
4) Lahner (1983). 5) Dostal (1982 a).

39
-Labour content: the clear decrease in manual labour and direct machine operations as well as the decrease in ancillary activities in the transport sector are compared to the clear increase of adjustment and supervising activities and by the increase in tertiary activity in offices and workshops.
- Labour conditions: in the course of the technical changes, a clear upgrading is found in wage structure, but also an increase in the compensation forms which come under the heading of bonus work and piecework. Equally there is an expansion of shift labour as well as of labour determined by timing.
However, the results on the quantitative effects appear to be interesting. In the areas which were studied in manufacturing industry, technical changes led on average (based on all persons employed in these branches) to:
- 3.6 % of calculated labour saving + 1.3 % the positive balance from hirings and job changes
=- 2.3 % global direct savings in the labour force p.a. 1>
This is approximately in conformity in magnitude with the annual increase in productivity, which emerges from the data in the National Accounts. The rate of savings in the labour force might remain relatively steady accordingly, and may not accelerate suddenly, as many authors have feared, in trend phases. This is indicated also by the composition of technical and organisational change which was found in the study by lAB: 68 % took place in the spheres of new construction, replacement, displacement or cessation of factories and plants. 24 % were concerned with changes in the operating process. The introduction of new technologies (new processes, new materials and other form of energies), on the other hand, were in the background with2~ proportion of 8 % of all tech-nical and organisational changes. .
In the field of industrial sociology, a number of studies was submitted during the seventies which were concerned with the consequences of technology with reference to labour organisation,' qualification requirements and the degree of division of labour. In the foreground, the changed part played by the skilled worker in the industrial process was observed. The important question was whether the function of the skilled worker which is highly esteemed by society is being subjected to an increasing underminig of its qualification by the mechanization and automation o.f the production process.
1) Dostal (1982 a), p. 124. 2) Dostal (1982 a), p. 121.

40
In 1970 Kern and Schumann came to the conclusion, on the basis of case studies in various industrial sectors, that technical trends lead not only to a differentiation of the spectrum of qualif~cations of industrial labour, but also to its polarization. Accordingly, on the higher levels of mechanization, together with highly qualified activity, new simple and unskilled types of work are constantly arising. There can be no talk of a general increase in qualifications in the course of technical progress.
It was feared that this would primarily affect skilled worker activities. In a study which was co~~eted by the Soziologisches Forschungsinstitut Gattingen (SOFI) 1 in 1977 and which was also concerned with changes in qualifications in the industrial sector, the conclusion was drawn that the traditional qualified skilled worker activities, which are typically distinguished by the unity of craftsman-like skill, the feel for materials, subjective intelligence and high quality consciousness, have been modified to a far reaching extent with partial maintenance of the old vocational designations:
- On the whole, more skilled activity sectors are disappearing than new ones created.
- Groups with new types of requirements, either in the direction of more developed social and communicative qualifications or in the direction of highly skilled technical qualifications are compared with the partial sectors which, by comparison with earlier periods, have reduced levels of specialists competence.
- With the exception of the maintenance sector, the dissolution of the traditionally skilled sectors of high qualification goes hand in hand with the expansion of numerous more restricted partial jobs in the sense of simple activity and ever-day jobs of an easy type.
The quantitative substitution of traditional skilled worker activities by ancillary labour, which led to the loss of opportunities for more skilled labour, was therefore seen as an empirical proof of a clear polarization tendency of thJ) requirements for qualification in the sector of industrial work.
1) Kern, Schumann (1970), p. 152. 2) Mickler et al. (1978). 3) Mickler et al. (1978), pp. 83 et sequ.

41
What remains disputed in these studies is the possibility of generalising from their findings. On the one hand, there was the danger that individual observations, without taking into consideration their diffusion in the industrial sector, were being adduced to characterize the trend. On the other hand, these studies came to the conclusion that the canges in qualification profile are strongly dependent on the degrees of mechanization and/or automation, i.e. on the state of the art. Thereby the results of the studies themselves were found to be momentary pictures which permit no statement concerning longterm trends.
The last named fact has recently led to a fundamental revision, which was triggered by the renewed study of the enterprises surveyed by Kern and Schumann at the end of the sixties. Their new report of the investigation, which was published in 1984 with the title "The end of labour division?", arrives at a very different evaluation of the qualitative consequences of technology on the basis of the degr1e of automation which had been attained in industry meanwhile: 1
Until the middle of the seventies rationalisation took place in the historical forms, which can essentially be described by the concept of "Taylorisation". This organisational form is traced back to the predominant philosophy of the enterprises and organisations, but also to the necessity to integrate unskilled workers (for example foreigners with no industrial experience) in the employment system. The seventies can be interpreted as a phase during which new organisational and commercial knowledge was maturing against the background of new technological concepts. However, according to the estimate made by Kern/Schumann, at present "the hour of a technological thrust", which results from the "new factor of micro-electronics" is now approaching, above all in the core sectors of industry and in the directly producing sectors. This technology thrust is distinguished by technical systems which have a clearly increased elasticity and a higher functional range. Thereby comprehensive access, systematic planning and more consequential execution in production is made possible.
But thereby the concepts of rationalisation and the division of duties between labour and capital are also changing: "Previously all the forms of capitalist rationalisation were based on a fundamental concept, which interpreted living labour as the barrier to production, which had to be overcome by the most farreaching possible technical autonomisation of the production process. In the residual factor of living labour, the primary potential obstacle was seen which had to be channelled and controlled as far as possible by the restrictive organisation of labour ••••
1) Kern, Schumann (1984).

42
The credo of the new production concept reads as follows: a) Autonomisation of the production process compared with living labour by technology has no value in itself. The maximal compression of living labour does not provide per se the economic optimum. b) The more restrictive access to the labour force sacrifices important productivity potential. In a more integral division of the tasks, there are no dangers but there are opportunities; the qualifications and specialist sovereignty of the workers rs well are productive forces which must be used increasingly."1
Therefore jobs will again be more broadly interpreted as regards their spectrum of requirements, the competence of the workers will be comprehensively used, their interests will again be more greatly respected. The gradual spread of this new concept has been followed by the segmentation and fixing of the borderlines within the labour force. Four groups should be differentiated:
- The gainers from rationalisation are the modern production and skilled workers and the repair specialists.
- The workers who do not possess "new" and altered qualifications (the elderly, women, foreigners and unskilled workers) are those who have to tolerate rationalisation. In the long term they are in danger of being filtered out.
- Workers in crisis-ridden branches.
- The unemployed who owing to the new production concepts have decreasing opportunities of returning to the production sector.
The radical nature of the theses ab~)e initiated a substantial discussion and provoked refutation. The important factor in this discussion is certainly the objection that these results are again only momentary pictures of a dynamic-trend, and therefore cannot be generalized, either as to their temporal validity or as to the diffusion in the industrial sector. However, without any doubt this study has shed light on a shift in rationalisation concepts, which is also reflected in other information. In addition, the change in the activity features has shown that industrial labour is departing from manual-mechanical production and has grown into new duties in the care and control of installations. But these are not yet the focal points of the tasks, they are only strong trends. In addition, despite the increased unemployment, there is still a lack of skilled labour. This indicates that the need for more skilled labour which is initiated by the new technologies was under-estimated both by labour market policy as well as by the enterprises themselves.
1) Kern, Schumann (1984), p. 19. 2) Schmidt (1985); Haug (1984); Sorge (1985); Malsch (1985).
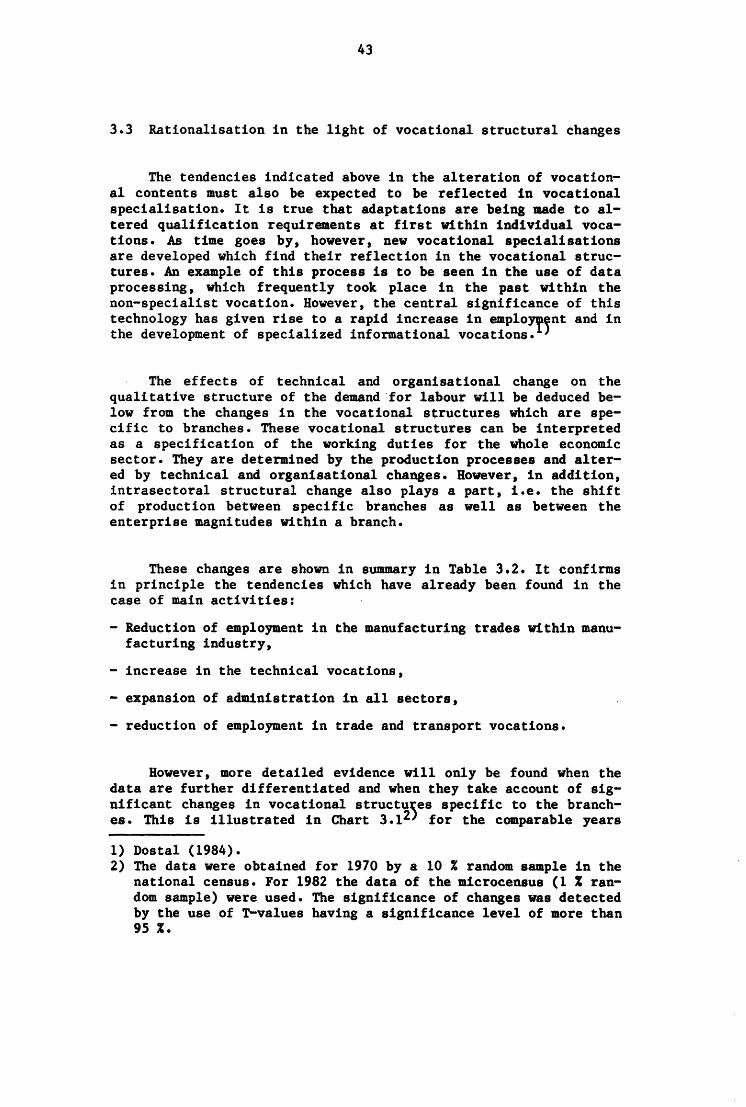
43
3.3 Rationalisation in the light of vocational structural changes
The tendencies indicated above in the alteration of vocational contents must also be expected to be reflected in vocational specialisation. It is true that adaptations are being made to altered qualification requirements at first within individual vocations. As time goes by, however, new vocational specialisations are developed which find their reflection in the vocational structures. An example of this process is to be seen in the use of data processing, which frequently took place in the past within the non-specialist vocation. However, the central significance of this technology has given rise to a rapid increase in emploYf~nt and in the development of specialized informational vocations.
The effects of technical and organisational change on the qualitative structure of the demand ·for labour will be deduced below from the changes in the vocational structures which are specific to branches. These vocational structures can be interpreted as a specification of the working duties for the whole economic sector. They are determined by the production processes and altered by technical and organisational changes. However, in addition, intrasectoral structural change also plays a part, i.e. the shift of production between specific branches as well as between the enterprise magnitudes within a branch.
These changes are shown in summary in Table 3.2. It confirms in principle the tendencies which have already been found in the case of main activities:
- Reduction of employment in the manufacturing trades within manu-facturing industry,
- increase in the technical vocations,
- expansion of administration in all sectors,
- reduction of employment in trade and transport vocations.
However, more detailed evidence will only be found when the data are further differentiated and when they take account of significant changes in vocational structu5es specific to the branches. This is illustrated in Chart 3.12 for the comparable years
1) Dostal (1984). 2) The data were obtained for 1970 by a 10 % random sample in the
national census. For 1982 the data of the microcensus (1 % random sample) were used. The significance of changes was detected by the use of T-values having a significance level of more than 95 %.

Tab
le 3
.2
Ind
ust
ry
Yea
r
Ag
ricu
ltu
re,
for-
1961
est
ry,
fish
ing
19
70
1982
Goo
d p
rod
uci
ng
19
61
ind
ust
ries
1970
19
82
Tra
de,
tr
an
spo
r-19
61
tati
on
, se
rvic
es
1970
(e
xcl.
c))
19
82
Pub
lic:
serv
ices,
19
61
no
n-p
rofi
t o
rgan
i-19
70
sati
on
s (i
ncl.
c))
19
82
To
tal
1961
19
70
1982
lap
loy
aen
t by
occ
up
atio
n a
nd i
nd
ust
ry 1
961
to 1
982
(as
% o
f to
tal
empl
oym
ent
wit
hin
a
secto
r)
Ag
ricu
l-M
anuf
ac-
Sal
es a
nd
Adm
inis
-tu
ral/
tu
rin
g
Tec
hn
ical
tr
an
spo
jt
trati
ve
min
ing
trad
es
trad
es
trad
es8
trad
es
trad
es
99
.2
0.2
o
.o
0.3
0
.2
97
.0
0.9
o
.1
1.0
0
.8
94
.8
0.8
0
.1
1.5
1
.4
3.1
6
8.1
4
.4
10
.1
10
.1
1.6
6
5.8
6
.5
10
.5
12
.4
1.2
59
.7
8.6
1
0.7
1
5.5
0.4
8
.3
2.4
4
8.2
~7.9
0.5
1
0.1
3
.1
45
.8
22
.5
0.4
9
.1
3.3
3
6.3
2
3.2
1.3
6
.5
3.6
5
.6
28
.0
1.4
7
.3
3.8
4
.2
25
.4
1.2
6
.7
4.5
4
.4
29.7
15
.2
35
.9
3.2
1
7.9
1
3.0
8
.5
36.4
4
.7
18
.3
16
.3
5.6
3
0.5
5
.7
17
.7
19
.8
Oth
er
Mis
cel-
serv
icg
) la
neo
us
To
tal
trad
es
trad
es
0.1
o
.o
10
0.0
0
.3
o.o
1
00
.0
0.3
1
.1
10
0.0
2.1
2
.0
10
0.0
2
.5
0.8
1
00
.0
2.3
2
.0
10
0.0
16
.2
6.5
1
00
.0
16
.3
1.8
1
00
.0
25
.9
1.7
1
00
.0
53
.8
1.2
1
00
.0
57
.4
0.4
1
00
.0
52
.3
1.2
1
00
.0
11
.8
3.1
1
00
.0
14
.9
0.9
1
00
.0
18
.9
1.7
1
00
.0
a)
Incl
ud
ing
bu
sin
ess
serv
ice
sale
smen
. -
b)
Med
ical
and
re
late
d o
ccu
pat
ion
, te
ach
ers
, p
rote
c:ti
v s
erv
ice
occ
up
a-ti
on
a,
auth
ors
and
art
ists
, p
erso
nal
ser
vic
e w
ork
ers.
-c)
Res
earc
h,
edu
cati
on
, m
ass
com
mun
icat
ion
med
ia.
So
urc
e:
Sta
tist
isch
es
Bun
desa
mt
(Cen
sus,
L
abou
r fo
rce
surv
ey).

45
Employment by occupation and industry 1970-82
lnduatry1)
Meehoner,. me\81 canstructoon. motor _,,c1es
IAMher prod .lellltlls. weiMQ CJC)are'
Restaurants. hOtels
TOI81
w (j
-~·
++ • + :+o~:
... l+++ ~: .;;..;: +
·~
+ .. + :~: ·~ + + ...
=~: :~ ~: + + + ~~= ++ ++
+ + ..... -~· :~: .. + :~:. ;;..· + + +
+ + + + .-.;· .. ·.' .. ·
+
lignlficant plus within the occupatiOnal structure of the branch21
Significant minus21
occupatron of priority (share of more than 20% in 1970)
.,;.. +
f++ +
:f.+
1) Classification: Systematik der Volkszlhlung 1970 2) At alignificance level > 95%
Source: &.tistisches Bunt:Jessmt (Census. lAbour force SUI'IIey}. lto-lnstitut fUr Wirtschllftsforschung
IFO-INSTITUT fGr Wiltld.aftsfonct.ung Mo6ftchen
Olel'l3.1
+
+ +
+ + + + • + + + + + + +
+ + + + +
+
+ + + + + +
+ + + :•·· ~·
+ + :~: ~·= + +
+ + +. + .~·= :~:-
+ ... :~: :~: :~:· + + + +
~B/8641:!>

46
1970 and 1982. Apart from the tendencies described above, which are clearly reflected, several other trends should be stressed:
- The vocational groups which are specific to economic branches were affected primarily by the reduction in employment. In the iron and steel industry and the associated branches they included for example metal producers and processors, in the manufacture of machinery, metal construction and automobiles they were the fitters and mechanics, and in the construction industry, the building trades and the ancillary building labour etc. Frequently this applied to those vocational groups which had the largest proportion of the vocational structures. They are indicated in the chart by a circle. This observation can be made for all the economic branches of manufacturing industry. In addition, however, it also concerned agriculture and forestry, trade and transport and the major part of the service trade branches.
- Specialized workers were on the one hand replaced by technically more qualified personnel, but on the other hand the share of unskilled labour also grew. Whereas the trend in the technical vocations has already been discussed in detail, the increase in unskilled labour remains disputed. On the one hand, it may b~ caused by inaccuracies in the vocational classification.l However, on the other hand it can be understood as a reflection of a polarisation of the qualification structure.
- In almost all the economic branches, the vocational structure has shifted from production activities to administrative functions. Despite the increased use of computers, employment in the administrative vocations has also risen in absolute terms in many areas. However, this applies only to the less administsration-intensive economic branches. In those cases were office activities had an important share, for example in the financial institutions an insurance companies, in the chemical industry or in energy and water supply, the administrative sectors have not grown any further in relation to total employment. In particular, those administrative areas were affected by the savings, the functions of which can increasingly be transferred to com-. puters, i.e. accounting, the processing of purchases and sales, storage handling and personnel management, but to a lesser extent qualified office work and the typing services.
In the less administration-intensive economic branches, two developments appear to be super-imposed. Without doubt productivity progress has also been achieved in office work. But at the same time the trend towards larger enterprise units in many sectors has increased employment in the offices, so that part of the rationalisation has again been compensated.
1) Deutsches Institut fUr Wirtschaftsforschung (1983).

47
- The management functions have increasingly became more independent. In almost all economic braches, the number of workers having organisational and management duties increased (businessmen, managers, senior executives etc.). This may well be seen in connection with the increase in the size of enterprises, which induced an increased need for management and coordination activities.
- By contrast with the economic branches discussed above, in the service sector, with the exception of the financial institutions and insurance companies, the specific production jobs, i.e. in this case the provision of services of various types, were not decreased. On the contrary, the ancillary functions were reduced. This points to an increasing specialisation of the service branches in their own production functions. Apart from the service enterprises, the enterprises in manufacturing industry, trade and transport have increasingly transferred ancillary functions and have thereby contributed to the growth of miscellaneous services. Especially in the case of smaller enterprises in which the owner himself works in "production", the transfer of bookkeeping, invoicing, cleaning etc. constitutes a substantial decrease in the work load.
3.4 Technical change and qualification
The question of the effect of technical change on qualification requirements can be relatively clearly answered in accordance with the results of the studies discussed above: we observed in the manufacturing sectors a clear increase in the significance of technical qualifications at the cost of manual or industrial production knowledge. In the administrative sectors we find a more than proportional increase in management functions at the expense of routine administrative duties. The trend to higher qualifications may be underrated by these shifts in the vocational section,. because the formal qualification of the employees has risen in general. This can bee seen in Table 3.3 for the major aggregates of the vocational classification, but it is also true for the majority of the individual vocations.
This trend is supported primarily by one fact: in the present state of the art, technical progress must necessarily point to activities with low qualification requirements, because they alone can be standardized, mechanized or automated. They are also those which make the use of technology rewarding because of their massive repetition. The qualification effects of rational technology are therefore almost always won at the cost of the lower qualified groups. Simultaneously the growing production apparatus requires
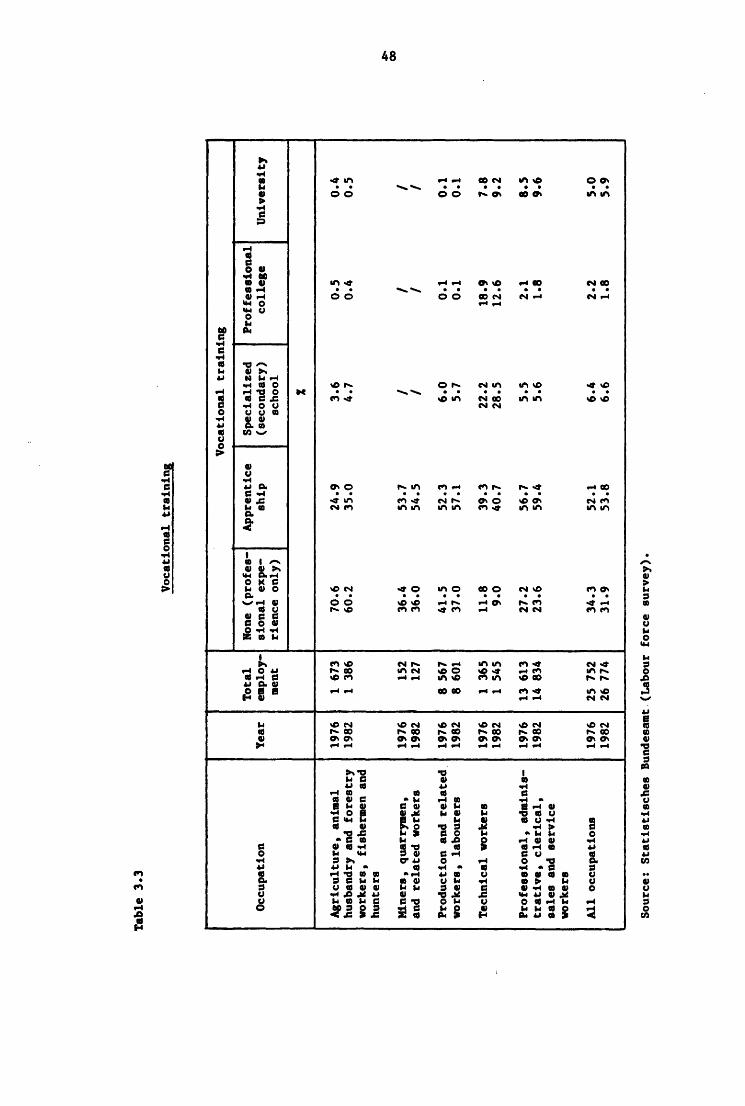
Tab
le 3
.3
Vo
cati
on
al t
rain
ins
Vo
cati
on
al t
rain
ing
To
tal
Non
e (p
rofe
s-A
ppre
ntic
e S
pec
iali
zed
P
roff
esai
on
al
Occ
upat
ion
Yea
r em
ploy
-si
on
al
exp
e-sh
ip
(sec
on
dar
y)
coll
ege
Un
iver
sity
m
ent
rien
ce o
nly
) sc
ho
ol
%
Ag
ricu
ltu
re,
anim
al
1976
1
673
70
.6
24.9
3
.6
0.5
0
.4
husb
andr
y an
d fo
rest
ry
1982
1
386
60
.2
35
.0
4.7
0
.4
0.5
w
ork
ers,
fi
sher
men
and
h
un
ters
Min
ers
• qu
arry
men
, 19
76
152
36.4
53
.7
I I
I an
d re
late
d w
orke
rs
1982
12
7 3
6.0
5
4.5
I
I I
Pro
du
ctio
n a
nd r
elat
ed.
1976
8
567
41
.5
52.3
6
.0
o.1
0
.1
wo
rker
s,
lab
ou
rers
19
82
8 60
1 3
7.0
57
.1
5.7
o
.1
o.1
Tec
hn
ical
wor
kers
19
76
1 36
5 1
1.8
3
9.3
22
.2
18
.9
7.8
19
82
1 54
5 9
.0
40
.7
28.5
1
2.6
9
.2
Pro
fess
ion
al,
adm
inis
-19
76
13 6
13
27
.2
56.7
5
.5
2.1
8
.5
trati
ve,
cle
rical,
19
82
14 8
34
23.6
59
.4
5.6
1
.8
9.6
sa
les
and
serv
ice
wor
kers
All
occ
up
atio
ns
1976
25
75
2 3
4.3
52
.1
6.4
2
.2
5.0
19
82
26
774
31
.9
53
.8
6.6
1
.8
5.9
Sou
rce:
S
tati
stis
ch
es
Bun
desa
mt.
(Lab
our
forc
e su
rvey
).

49
more skilled personnel, who can take over programming, control, supervision and maintenance. But on the other hand from the economic point of view the question remains how far the transfer of human labour to machines can be carried on. The solutions, as is shown by the results of the case studies, appear to be different in the various stages of the historical technical trends. In the stage of mechanization, the principle of Taylorisation dominates the complex labour processes which are broken down into simpler work. The qualified production labour is replaced and unskilled labour, on the one hand, and technically more skilled labour, on the other hand, are required. The qualifications structure is polarized. The automation of manufacturing processes appears now also to replace unskilled labour, by transferring material transport, the charging of machines or the operation of machines to automation. It also affects the lowest qualification groups and thereby cancels the tendencies towards polarization.
Empirically it does not appear to be easy to discern to what extent the trends towards polarization of the qualification structure have already been suspended by automation. Even if the case studies by Kern and Schumann suggest this, it must be stated that the proportion of ancillary workers has increased throughout the whole of the seventies (Section 3.3). Thus the Taylorist and comprehensive technical concepts appear to be super-imposed. However, with an increasing degree of automation of production_, the trend to a rising requirement for more highly qualified specialist labour and technicians might well continue, and the requirement for unskilled labour might well decrease perceptively.


51
4. Contractual arrangements!)
The core sector of the labour market, which comprises fulltime employment in a dependent position, has been reduced in scope since the middle of the seventies. This had long-lasting consequences for the entire labour market, both with respect to the job opportunities of those who are not employed as well as with respect to the mobility of those in employment. The number of new jobs provided for workers by the enterprises and the state has fallen since the beginning of the seventies from seven million ~~ about six million per annum at the beginning of the eighties. Simultaneously the gates were opened to the growing number of young people looking for jobs. On the average of the years 1980 to 1984, 1.4 million young people were accepted per annum from the educational system. This was 200,000 more than in the years 1970 to 1974. Therefore the recession in new jobs had particularly strong effects on the job opportunities for the unemployed and fluctuations between enterprises.
The deterioration of the labour market situation was therefore particularly noticeable for those who had no job. Their opportunities were adversely affected by the low demand for labour and by the reduction in mobility. To the extent that they could not withdraw from the labour market by having recourse to transfer incomes they were compelled to adaptations, among which reactions in several directions became recognizable:
- The trend to self-employment has increased. It is true that this is also a reflexion of the improved background conditions for independent activity and a reflex action to deliberate state promotion. But clear dependence on the unfavourable position in the labour market is also apparent.
- The tendency to release less-qualified employees by means of rationalisation has aggravated the competition for qualifica- . tions. The stream of those applying for general vocational training has increased and retraining and further education have won back their earlier value.
- Granted the reduced alternatives on the labour market, a proportion of the employees had to accept a deterioration in their employment conditions. Short-term employment, fixed-term contracts and temporary work have increased.
1) This chapter relies on the results of a study of the Ifo-Institute which has recently published under the title "Growth Areas at the Margin of the Official Economy"; see Heinze, Schedl, Vogler-Ludwig (1986).
2) Schmidt (1983), p. 17.

52
The necessity for a "new" flexibility has furthermore been rated more highly in the public discussion and has led to a boom in flexibility proposals. However, their conversion into action is still awaited. This becomes clear when the fact is considered that greater flexibility affects different interests and adaptations among the disadvantaged often take place when no alternative is available. An increasing number of job searchers found itself in this situation after the middle of the seventies.
4.1 Self-employment
The current trend which has developed since the fifties for a reduction in self-employment came unmistakably to a standstill in the. second half of the seventies (Table 2 .6). Contributions to this fact were made by both the increasing number of the selfemployed in the sector of miscellaneous services as well as by the clear slowing down of the fall in self-employment in industries which were characterized by concentration and by emigration to other branches (agriculture, goods producing industry, trade).
This trend which is also shown by other indicators (the number of tax payers, trader applications) gave rise to the hope that the deficit in foundation of businesses in the early years of the seventies has been overcome and thal)a new boom in the foundation of businesses had been initiated. However, later investigations made
2) by the Ifo-Institute lead to a much more sceptical
judgement. A boom in the foundation of businesses cannot be identified in view of the range of problems which are raised by the indicators used. The role, which has not yet been clarified, of the legally new foundation of enterprises and the indications of changes in attitudes to reporting permit us to assume that the number of new businesses founded, which is derived from the trader applications, has been clearly overestimated. On the other hand there are also inaccuracies in the data which are available on the self-employed. The absolute figures in the labour force survey are in general clearly exaggerated, as is shown by comparisons with the social insurance employment statistics (Besch!ftigungsstatistik) or with the statistics for manufacturing industry. Therefore no reliable source for the total number of self-employed exists and it can only be expected within the framework of the new national census in 1987. Until that time we are dependent on estimates such as those which are made by the Federal Statistical Office within the framework of employment statistics.
1) Clemens, Friede (1986), P• XII. 2) Weitzel (1986 b), p. 13.

53
4.1.1 Foundation of businesses
At the beginning of )he eighties, the focal point for the foundation o~) businesses1 , according to the surveys of the Ito-Institute , was to be found in the sector of handicrafts and of commerce (Table 4.1). Only a small proportion was related to the industrial sector. To the extent that new businesses were founded in industry, they were primarily repair and assembly businesses. In handicrafts, automobile repair shops, miscellaneous metal-working handicrafts and the building and reconstruction industry were predominant. In the service sector new enterprises were founded in the field of commercial services (advertising, economic consultancy, software) and of technical services (engineering offices and static analysis). Personal services were scarcely represented.
This sectoral pat tern of new bu~)ness activity, which is shown similarly by other data sources , has very conventional aspects in principle. The situation in traditional fields of selfemployment has deteriorated particularly in the past decade (goods production, trade). Accordingly, the trend to self-employment seems to be only characterized to a small extent by innovative aims and to represent the "opening up of new markets". On the contrary, the uncertain employment position may have been an important cause, as the surveys of the Ifo-Institute show. On the average of the economic sectors examined, 14 % of the founders were unemployed before beginning their independent activity and 39 % described their previous jobs as uncertain (Table 4.1). Half the new foundations thus show a connection with the adverse job position of the founder. In handicrafts the figure was almost twothirds.
The fact that the change of trends towards self-employment set in in the middle of the seventies and was not only caused by. the expansion in the services sector but also by stagnation in manufacturing industry and in trade fits into this scene. It must be assumed that dependent employment has not necessarily lost its attractiveness for the self-employed persons at the bottom edge of the earnings scale, but their opportunities for finding a job have decreased. Therefore a proportion of the self-employed continued their activities because of the lack of alternatives. This might apply to a special degree to agriculture as well.
1) Both new foundations as well as the take-over of existing businesses are covered by the term foundation of businesses.
2) Weitzel (1986 a). 3) Lastenausgleichsbank, Annual report 1984, Verband Vereine Cre
ditreform, Annual report 1984/85.

Table 4.1
54
Foundation of businesses 1981/83a)
(%)
Features of new businesses:
Industry Total Full Founder Job was economic was un- uncer-activity employed tain intended
Manufacturing 5.1 92 8 39
Handicrafts 42.3 88 19 44
Retail trade, 19.3 63 11 36
Wholesale trade, selling agency 11.2 79 9 38
Miscellaneous services 22.1 67 12 31
Total 100.0 78 14 39
a) Business founded in 1981 and 1983 which were still in ex-istence at the date of the survey in 1985.
Source: Weitzel (1986 a), pp. 58 and 71.
4.1.2 Professions of the self-employed
The attempt to describe the sectors of activity of the selfemployed in more detail on the basis of the data available o~ occupations brings to light varying tendencies (Table 4 .2) •1J On the one hand, the self-employed enter
- into occupations which are favoured by structural changes (doctors, pharmacists, other medical professions, service occupations, service trade merchants, legal representatives and cooks),
1) These are estimated figures. Starting out from the data level given by the national accounts, the absolute figures for the self-employed were calculated with the assistance of the vocational structures shown in the labour force survey.

55
Table 4.2
Vocations of the self-employed
(selected vocational sectors)
Self-employed Change
Vocational sector 1976 1982 in %
1ooo•>
Farmers 548 440 - 19.7 Gardeners, garden builders 30 32 6.2 Printers 6 8 32.5 Plumbers 26 22 - 16.5 Fitters 18 17 - 0.6 Mechanics 36 32 - 12.0 Precision metal workers (incl. dental technicians) 12 13 7.7
Electricians 31 29 - 7.2 Textile processors 25 18 - 25.5 Leather makers, -processors 18 13 - 24.0 Bakers and confectioners 36 35 - 3.5 Meat- and fish-processors 34 31 - 9.7 Food preparator& 6 10 65.6 Masons, concrete builders 21 22 4.4 Carpenters, roofing workers, scaffolding erectors 13 14 7.0
Building decorators 14 14 - 0.6 Interior decorators 10 9 - 10.6 Cabinet makers, model build. 38 33 - 14.0 Painters, varnish workers 40 34 - 15.9 Engineers, architects 55 59 8.8 Technicians 12 18 49.1 Sales staff 484 460 - 5.1 - Wholesale-, retail sales
staff, sales personnel 401 384 - 4.2 - Travelling represents-
tives, travellers 56 55 - 0.6 Bank- and insurance staff 37 39 4.9
Continuation on the next page
Proportion ot self-employed )
1976 1982
%
74.9 72.1 18.0 16.9 3.9 5.1 9.8 7.4 2.0 2.0 6.9 5.1
15.2 13.3 4.9 4.1 6.2 5.8
15.5 13.3 28.9 25.4 25.2 22.2 2.4 3.6 4.4 4.8
8.7 8.1 11.4 10.9 21.7 19.1 12.3 10.0 14.9 11.7 12.4 12.0 1.7 2.3
23.9 21.6
58.3 58.2
35.3 35.8
7.5 6.5

56
Continuation of Table 4.2
Self-employed Proportion o6 Change self-employed )
Vocational sector 1976 1982 in % 1976 1982
1oooa> %
Other services 34 38 11.4 21.2 20.3 Land transport (driver et al.) 45 50 10.7 4.7 5.5
Businessmen, organizers and auditors 192 248 29.3 29.1 32.3
- .Businessmen, managers 163 212 30.2 28.2 31.8 - Auditors 25 29 15.9 38.1 39.4 Office and ancillary staff 28 31 10.4 0.8 0.8 Security guards 8 7 - 13.0 1.1 0.9 Legal staff 25 27 7.7 27 .o 24.8 - Legal representatives,
legal consultants 24 26 8.0 57.5 53.2 Publicists, interpreters, librarians 12 14 15.9 16.7 17.1
- Publicists 9 11 21.5 25.0 28.2 Artists, assoc. vocations 36 41 13.6 26.3 26.3 Doctors and pharmacists 100 111 10.7 50.3 49.5 Other health staff 14 20 42.0 2.1 2.3 Teachers 24 29 21.0 3.6 3.6 Natural scientists and intellectual vocations 6 6 - 0.6 11.1 7.5
Body care (hairdressers et al.) 55 59 8.8 26.5 25.6
Hotel and restaurant staff 144 142 - 1.3 41.3 37.7 Cleaners 18 16 - 6.5 2.4 2.3 Workers without indication of sector 25 29 15.9 11.9 15.4
Total 2 402 2 380 - 0.9 9.1 8.7
- Without farmers 1 854 1 940 4.6 7.7 7.9
a) Estimated on the basis of the labour force survey. - b) Share of the self-employed in total employment in %.
Source: Statistisches Bundesamt (Labour force survey); computations of the Ifo-Institut.

57
- into professional areas which, when seen from the sectoral perspective, exercise trans-sectional functions (engineers, technicians, drivers and office staff),
- into sectors which are characterized by declining employment or by high unemployment (masons, carpenters, printers, teachers).
On the other hand, in the majority of the handicraft vocations, the numbers of the self-employment are falling, despite the activity in the foundation of new businesses. The same also applies to trade vocations.
When making an evaluation of these changes, it must be taken into consideration that management activities have evidently become increasingly autonomous. The fastest growth in absolute terms is shown by the professional sector entitled "business men and managers", so that it might be assumed that a proportion of the decline in the handicraft and trade vocations has been caused by the organisational and personal separation of management functions from production functions.
Finally it should be mentioned that the increasing numbers of self-employed may conceal an increasing number of "self-employed workers". Such labour conditions, which are carried out on the basis of contract work, are customary in various professional sectors (publicity agents, artists, engineers, architects, transport business). As contract work is the basis for legal relationships between enterprises, it is scarcely possible to define when such a legal relationship corresponds in its character to a dependent labour relationship and when it does not do so. Closer determination of the number of self-employed workers is therefore very difficult on the basis of the available information.
4.1.3 The informal economy
The rise of the informal economy belongs to the trends which have been carefully studied in the course of slow growth indicated by the official statistics. Nevertheless, the estimations of volume and development of the informal economy present a broad range of results and permit contradictory conclusions: For the black economy (which comprises all activities with the predominant aim of tax avoidance) the estimations range between 3. 7 and 27 % of GDP. Plausibility exists only for the lower border of these figures, recognizing the volume of the market potential, the necessary qualifications for black activities and the working time

58
available •1> The volume of domestic work, which is also part of the informal economy, in less than one third of GDP. Various estimations have been presented for this sector too, ranging between 30 and 50 %. All these calculations seem to overestimate the volume of domestic work because they take market prices to evaluate output.
Activities in the informal economy are not independent from the possibilities in the formal economy. On the contrary, income and social security provided by the formal sector are the basis for activities in the informal sector. Thus the growth of the informal economy is restricted by the conditions of the formal sector.
. An analysis of the role of the hidden economy in i)he process of structural change undertaken by the Ifo-Institute suggests that in the sum informal activities have brought positive incentives to the growth of the formal sector. This could be exemplified with empirical data for the construction sector and the automobile industry. Furthermore productivity in the formal economy is improved by informal activities. These activities are normally competitive on areas with low productivity and call themselves for input and investment goods.
A third aspect is of the discussion on the hidden economy handles with the so called alternative economic sector. Its roots come from the increase in unemployment, but they also reach far into social and political trends. Precisely in those social groups which took a critical attitude to the economic and social system, the risk of unemployment accumulated because of inadequate motivation or a dismissive personnel policy so that these people, who are mostly young, saw themselves compelled to create their own jobs. A further important influx for the alternative sec~or comes today from the great surplus in teachers, sociologists and psy~
chologis ts, !)ho see no opportunity for employment in their own professions.
The numerical significance of the alternative economic sector which is oriented towards economic activity is small, numbering from 20,000 to 25,000 jobs. Moreover this sector also includes a large number of unemployed and self-help initiatives in which the unemployed have come together, usually under the sponsorship of charitable societies, in order to consult or to run or operate apprenticeship plants outside the factories. This activity is to a
1) Heinze, Schedl, Vogler-Ludwig (1986), pp. 121 et sequ. 2) Op.cit. 3) Hegner, Schlegelmilch (1983), p. 5.

59
large extent carried out for small or even for no compensation. The entire alternative sector if estimated to number approx. 80,000 to 100,000 active persons. ) The fields of activities of these alternative projects are dispersed over the entire economy. About 70 % should be classified in the service sector, within which the social services have the greatest weight (school projects, care of children and of the elderly, medicinal groups, therapeutic and social projects).
To the extent that they concern the production of goods, they are almost exclusively small enterprises with handicraft production, artistic and i)epair work, printing shops, alternative technology enterprises.
4.2 Short-term and casual employment
4.2.1 Fluctuation of labour
For the classification of short-term and minor employment, it appears to be necessary to observe the fluctuation of the labour market as a whole. Of the total number of employees subject to social security, in 1982 a quarter changed their labour relationship either because they changed their employer (11 %) or in the course of so-called natural fluctuation, they entered or left a job (15 %). However, the latter figure also includes those whose change of employer extended over the end of the year and moreover employees who were employed during the year for a short period by a single employer. In total there were 26.4 million "employment cases" by which labour relationships subject to social security are meant. 9.2 million of these employment cases referred to employees whose labour relationships had changed during the year. This amounts to 1.5 employment cases per worker employed for less. than a year. Here it must be considered that the universe of the employees subject to social security covers the core area of the labour market because here only those employees are counted whose earning limit is above that for social security (limit of 1982: DM 390 per month}. Casual employment and short-term employment are only covered in part, as well as additional jobs.
Clear differences in the fluctuation of labour are shown by sectors (Table 4.3). This fluctuation is higher in the service sector than it is in goods producing industry, it is clearly high-
1) Op.cit. pp. 6 et sequ. 2) Kaiser (1985), p. 98.

60
!'able 4.3
Fluctuation rataa 1982
(Japlo.r••• aubject to aocial aacurity)
Airicultura and Forestry
Goods producing industry Energy, gas, water, aining Manufacturing industry
Chemical industry, oil refining Plastics production, rubber processing Stone and ores, fine ceramics, glass Iron and metal production, foundries, atael forming
Steel, .. chinary and automobile prod., office .. chinary, IDP devices
Electrical engineering, precision mechanics, fabricated metal products
Wood, paper- and printing industry Leather, tastile and clothing industry Food, beverage, tobacco
Construction Conatruction induatry Finishing
Trade, tranaport, aervicea Trade Transport, communications
Railways Poet and communication Miacellaneoua transport
Financial inatitutiona, insurance Financial institutions Insurance companies
Miacellanaous aarvicas Reatauranta and hotela Cleaning and body care Science, education, arta, publiahing Health- and veterinary aervices Legal and busin••• conaultancies etc.
Other aervicas
Local authoritiea/social aecurity
Hon-profit organis., private houaehol4s
Total
laplOYIH't caaes~
337
12 844
550
9 992
701
410
431
820
2 927
1 952
1 001
805
946
2 303
l 653
650
11 166
3 726
1 393
184 385
824
906
641
266
5 141
1 043
477
1 088
1 350
800
383
1 596
480
26 427
DlplO,Jad t.hrou9hout the yaarcJ
1000
136
8 565
449
7 014
546
279
265
600
2 150
1 383
676
530
585
1 102
790
312
6 835
2 331
820
142
195 483
728
520 208
2 956
365
225
700
874 590 202
1 192
318
17 046
F1uctua~ton rate a
' 147
50 23
42
28
47
63
37
36
41
48
52
62
109
109
109
63 60
70
30
97
'70
24
23
28
74
186
112
56
54
35
89
34
51
55
a) Classificationc Syst.matik dar Wirtachafts&weige (draft for the vocational census of 1970). -b) Labour relationship• aubject to social security (full year and seasonal). -c) Estimated. - 4) Employment cases of those aeaaonally amployad as percentage of those employed throughout the year.
Sourcec Becker (1985): lfo-lnstitute.

61
er in the construction industry than in manufacturing industry, and it is higher in miscellaneous services than it is in the case of the financial institutions and the insurance companies. The highest rate of fluctuations are shown by the following sectors:
- restaurants and hotels, - agriculture and forestry, fishing, - cleaning and body care, - construction industry, - post and communication.
The lowest rates of fluctuation are to be found in:
- energy, gas, water, mining, - financial institutions, insurance, - chemical industry, oil refining, - railways, - local authorities and social security.
These differences are caused by a large number of factors. Seasonal fluctuation in employment, the use of temporary workers and also frequent changes of employer by the employees are reflected here. Moreover a stronger decrease in employment by comparison with other sectors as well as the more rapid growth of employment increase the rate of fluctuation. Comparative computations for the year 1981 have shown that the rates of fluctuation are tending slightly downwards. The mobility of the labour force may also have been reduced by the decrease of employment which took place at that time. But formerly these conditions could at best be suspected. The more exact proof can only follow when data are available to cover longer periods of time.
4.2.2 Short-term employment
The development of short-term employment can be observed if the job placements carried out by the Labour Offices are studies. Between 1973 and 1981, according to the figures given by the Bundesanstalt fUr Arbeit, the share of job placements in employmey~ for less than three months rose from 47 to 53 % (Table 4.4). J This is not too great a rise. However, it is notable that above all in the manufacturing trades, which in 1973 were still characterized by very low proportions of short-term placements, clear
1) After 1981 only placements in employment of up to 7 calendar days were recorded, which appears to be to short for the description short-term labour relationships.

62
Table 4.4
Short-term employment
Vocational Sector
Agricultural vocations
Mining and mineral extraction
Stone workers, building mat. producer
Ceramic workers and glass workers
Chemical ind. workers, plastic process.
Paper producers and processors .
Printing workers
Wood workers, wood finishing workers
Metal workers and processors
Fitters, mechanics and assoc. trades
Electricians
Assembly and metal trades
Textile and clothing trades
Leather workers, leather and hide proc.
Nutritional trades
Building trades
Decorators and upholsterers
Carpenters and model-makers
Painters, varnishers and relat. trades
Goods testing workers, mail order work.
Ancillary workers without more precise description ·
Machinists and associated trades
Continuation on the next page
Job placements in employment of up to 3 months in %a)
1973 1981
45.3
4.9
8.1
11.4
23.5
17.2
6.6
3.4
6.7
6.3
8.5
2.6
2.1
16.1
26.7
18.5
8.3
8.0
44.2
75.9
1.5
26.4
2.9
5.5
18.7
20.0
36.9
26.4
10.0
7.5
6.9
9.7
28.1
6.3
4.7
22.1
39.7
11.2
7.3
9.5
68.3
89.9
3.8

63
Continuation of Table 4.4
Vocational sector
Engineers, chemists, physicists and mathematicians
Technicians
Technical specialists
Sales staff
Service trade merchants, assoc. trades
Transport trades
Store keepers, warehousing·and transport workers
Organisational, admin./office trades
Police and security trades
Publishing, interpreters, librarians
Artists and associated trades
Health service trades
Social, educational advisers without closer description; professional occupations in intell./natural sciences
Body care
Hotel and restaurant staff
Domestic staff
Cleaning trades
Total
. Number of placements (1000)
Job placeaents in employment of up to 3 .onths in za)
1973 1981
3.2 7.8
5.4 10.6
17.6 20.9
25.4 30.0
41.2 53.9
39.7 46.1
88.8 90.9
34.3 35.2
20.8 23.8
75.7 78.1
96.2 96.8
8.4 10.6
25.7 15.9
3.6 7.0
50.1 41.6
18.8 23.3
39.1 47.6
46.8 53.3
2 653 1 622
a) Of total number of placements for each vocational sector.
Source: Bundesanstalt fUr Arbeit.

64
increases are to be found. The decrease in employment in goods producing industries has thus not only reduced employment as such, but has also made it more unstable. By comparison with the services sector, the short-term placements, however, still play a smaller part. The results therefore are still conform to the finding of lower fluctuation rates in goods producing industries.
When evaluating this result it must certainly be considered that the employment relations which are arranged through the Labour Offices represent only a part of the total fluctuation and that the Labour Offices are involved in placements in varying degrees according to the vocational sectors concerned. However, little has changed in this respect in the past decade and the varying significance of the Labour Offices for the individual vocational groups may well have not been subjected to any basic change.
4.2.3 Fixed-term labour contracts
Fixed-term labour contracts which are possible in the individual sectors in accordance with varying legal and collective agreements were concluded in 1984 with 11.4 % of the employees (Table 4.5); the major proportion was in the field of vocational training (6.6 %). A relatively large proportion of the otherwise fixed-term labour contracts is to be found in public sector, which customarily concludes in many cases such labour contracts at the beginning of the various official and employee careers. In addition, in the service trades, non-profit organisations, private households and in agriculture such labour contracts on a temporary basis are concluded relatively frequently. In the other sectors their share was below 3 %.
This has been altered presumably by the Employment Promotion Act, which came into force on 1st May 1985. Accordingly, labour contracts can be concluded for a period of 18 months without special reasons being given. More recent surveys made by the Deutsche Industrie- und Handels\,mmer and by the Arbeitsgemeinschaft Selbstl!ndiger Unternehmer, but also questionnaires which have not yet been fully evaluated by the Ifo-Institute indicate that these possibilities have been used to an increasing extent by the enterprises.
1) Wirtschaftswoche of 8th November 1~85, p. 16.

65
Table 4.5
Fixed-term labour contracts 1984
(Share of dependent employees in %)
of which:
Industrya) in the
Total framework Miscel-of vocation. laneous training
Agriculture, forestry, fishing 22.4 17.5 4.9
Energy, gas, water sup-plies, mining 4.0. 2.9 1.1
Manufacturing industry 8.6 6.3 2.3
Construction 10.0 8.0 2.0
Trade 10.0 7.2 2.8
Transport and communi-cation 5.3 3.4 1.9
Financial institutions, insurance companies 7.3 5.9 1.4
Miscellaneous services 14.5 9.1 5.4
State 21.7 3.4 18.3
Non-profit organisations and private households 12.1 4.3 7.8
Total 11.4 6.6 4.8
a) Systematik der Wirtschaftszweige 1979, draft for the Labour force survey.
Source: Statistisches Bundesamt (Labour force survey).
The potential for proportionate expansions of fixed-term labour relationships appears not to be unlimited, because in shortterm periods only a limited know-how can be obtained. But this is of increasing importance in the process of the technical improvement of production. Fixed- term labour contracts may therefore well be concentrated on the initial stages of a career and from the entrepreneurial point of view may seem to be more suitable in principle for less skilled labour than for skilled labour. Thereby

66
those employees are burdened with additional insecurity who in any event have to bear a large proportion of the risks in the labour market.
4.2.4 Contract work
There has also been an expansion in the sector of contract work, which is carried out on behalf of a growing number of temporary work agencies. The official statistics between 1974 and 1980 show an almost tfjee-fold increase in the number of contract workers (Table 4.6) • Moreover, there is a justifiable assumption that the reporting obligation for contract work is evaded by unlawful contracting. Estimates have shown that the ratio between registered and non-r~gistered contract workers in the metals industry ~~ 1 : 6, and in the construction industry it is as much as 1 : 9. The proportion of contract work in total employment, however, may still be small. Even when using the estimated figures, it might scarcely exceed 2 %. But this is not necessarily true for every sector, and particularly not true of the construction industry. A survey of the Ifo-Institute for 1984 showed that the proportion of contract workers in the total average of the manufacturing industry is small (0.3 %) but it is highly concentrated on individual enterprises which use this instrument to a greater degree. Among the enterprises which employed contract workers,
35he share amounted at all events to ten times the average
(3.5 %).
To the extent that the official statistics provide an insight, contract labour is primarily concerned with short term employment relationships, not only between contractors and contracting enterprises but also between contract employees and contractors. More than 80 % of the labour relationships during the seventies ended within a period of up to 3 months. Almost all of them were terminated within a year. From the figures for 1984 no basic change in these facts can be observed (Table 4.6). It is true that the hiring of temporary workers was previously limited to three months. However, the statement that the labour relationships between the agency and the temporary worker were primarily ended within this period means that a spread of the employment risk by the contractors is scarcely accepted. Almost nothing is expected to be changed with respect to this fact by the extension of the temporary work period to 6 months by the Employment Promotion Act.
1) The figures for 1984 are not directly comparable due to changes in the Employment Temporary Labour Law.
2) Bundesregierung (1979). 3) Vogler-Ludwig (forthcoming).

67
Table 4.6
Contract workers
Feature Unit 1974 1980 19848 )
Level 1000 14.8 40.1 32.4
Hi rings 1000 60.7 153.6 97.4
of which: - employed immediately
previously % 61.9 60.8 43.7 - previously economi-
cally active % 29.2 27.0 48.8 - not previously eco-
nomically active . % 8.9 12.2 7.5
Fixed-term contracts between contractor and employee 1000 85.2 180.6 102.7
of which with a period cumu-of: lative
- less than 1 week % 18.9 14.3 14.0 - less than 3 months % 83.7 83.3 77.1 - less than 1 year % 98.0 97.8 -Number of contracts 1000 187.6 424.6 -Days employed 1000 2 991.9 7 836.5 -a) Only conditionally comparable because of a change in the
statistics.
Source: Bundesanstalt fUr Arbeit.
Temporary work plays a very different part in the individual vocational sectors. The highest proportion is attained by it, according to the official data, among ancillary workers (3.8 % of the employees who are subject to social security). The electricians and fitters, mechanics (0.5 %) follow after a large gap. In all the other vocational sectors, including the office vocations, the proportions are far smaller.

68
4.2.5 Casual employment
Casual employment, i.e. the employment of persons who normally do not work, can equally be only schematically discerned here. The hidden figures may be substantial, because these activities are often on the borders of the obligation for social security and, moreover, are not always reported for reasons of taxation. A survey carried out by the Institut fUr Arbeitsmarkt- und Berufsforschung in 1980 has shown that 11 % of the non-economically active persons who are less than 60 years of a~1 had worked occasionally in the course ~f the past 12 months. This amounts to 2.5 million persons. In most cases this occasional employment lasted less than 3 months. If one assumes an average duration of employment of 2 months, this corresponds to about 400,000 fulltime workers with a proportion of 1.7 % of total employment. In conformity with the data from the European Commission's labour force survey it emerges that the share of occasional. employment did not increase during the seventies. In essence, the EC data show that occasional employment was concentrated on agriculture and on the service trades. Usually women were concerned (Table 4.7).
A more recent survey of spare time employment 2) w~~ch was carried out within the framework of the Welfare Survey comes to similar conclusions. Here it was found that occasional employment is strongly dependent on the income per capita in the household. The lower per capita income, the more spare-time activities are carried out. An increase has not been detected in these activities in the course of the last ten years according to this investigation.
4.3 Working time flexibility
With the continuing disequilibrium in the labour market, the sharp distinction between work and unemployment has been increasingly perceived and various proposals have been made in the attempt to overcome it. A central part has been played in this process by the reduction of working time and by the change into flexible forms of working time schedules.
1) Brinkmann, Kohler (1981), p. 141. 2) Helberger, Schwarze (1986). 3) The Welfare Surveys were carried out by Special Research Sec
tion 3 of the Universities of Frankfurt and Mannheim which operates under general title "Micro-analytical Foundations of Social Policy" and which has published a series of research projects relevant to the labour market.

69
Table 4.7
Casual employment
Proportion in %a) Feature
196ob> 1975 1981
Total employment 2.6 2.5 2.1
Men 1.5 0.8 0.6 Women 4.4 5.3 4.5
Employees 2.4 1.5 1.4 Family workers 3.9 18.0 20.3
· Self-employed 2.8 2.8 2.5
Agricult., forestry, fishing fishing 4.5 9.6 8.6
Manufacturing industry 1.9 1.1 0.9 Services, state 2.8 2.7 2.4
a) Proportion of the occasionally active persons in the economically active persons. Reported weekly results. - b) Occasional and seasonal employment. Definition of the question is not completely comparable with later years.
Source: Statistical Office of the European Community (Labour force sample survey).
Flexible working time forms were regarded by their advocates as a mean of coming closer to the wishes of the employees with respect to working time, and thus the reduction in working time was to be realized in those areas where it was desired. The champions of rigid working time-systems and of equal reductions in working time for all employees draw attention, however, to the fact that only in this way the risk of fluctuating working time can be limited for the employees and only thus substantial employment effects can be achieved. Both wishes for reduction in working time are contradictory to the interest of the employers in unaltered and if possible even extended operating times for their production facilities. The progress made in the flexibility of working time must be awaited in view of this antagonistic conflict of interests. This can be seen clearly from the reluctant development of part-time working and the slow spread of variable working time schedules.

70
4.3.1 Part-time work and variable working times
The actual expansion of part-time working, as shown in section 2.1.3 has its main cause in the view of enterprises which regard this form of employment as suitable only for activities which require a limited degree of know-how and in addition are only loosely tied in with the organisation of the business.
In the question of working time the enterprises are concerned with the utilisation of the human capital of the employees. Their interest in long working times becomes all the greater as the trouble-free progress of production and the success of the business operations depends on the work of certain persons. The number of overtime hours worked therefore increases with qualifications1J and attempts are being made to differentiate working time according to th;e qualifications of the employees .2) Therefore part-time working is concentrated de facto on the vocational sectors with relatively low qualifications.
A further obstacle is to be found in the area of social security for part-time employees. It·is true that part-time employees are not disadvantaged in principle :l.n the three major insurance systems (pensions, health insurance and unemployment insurance). However, problems ari~~ during the transition from full-time to part-time employment. As a rule, the claims on these services for the employees (pensions and unemployment pay) are reduced, but on the other hand the ancillary wage costs for the employers increase. The latter applies when a job is divided, which has provided an income above the income limit of the social security system. This constellation impedes the sliding transition to retirement via part-time working and also does not necessarily promote the readiness of the unemployed to accept part-time jobs. Moreover, it limits the supply of part-time jobs in the field of skilled activities.
However, this supply is not only limited by the upper income ceilings, but also by the triviality rules on the lower limit. The incentive to offer jobs outside the obligation for social security, and to save ancillary wage costs in this way, is held down by the low income limits for those who are free of charge within the social security system.
1) Qualified employees work on average 2 hours per week more than unqualified employees (Heyer 1981, p. 15).
2) Gesamtverband der metallverarbeitenden Arbeitgeberverb~nde
(1985). 3) Landenberger (1984).

71
Similar trends to those which have been observed in the expansion of part-time working are also to be found in the case of the variable forms of working time (flexible working time, job sharing, capacity-oriented r)orking times). A study made by the Wissenschaftszentrum Berlin1 comes to the conclusion that for about 17 % of dependent employees flexible working time regulations apply in the enterprise. These are primarily practised in the administrative sectors of the enterprise. By contrast, in the production sector rigid systems of working time predominate. Commerce as well regulates the individual working times of its employees primarflY in accordance with rigid working time systems (60 to 85 %) • ) Individual agreements which depend on the particular case are seldom practised. Adaptations to fluctuation in turnover is therefore effected primarily whithin the rigid regulations for working time or by the employment of ancillary workers. The study by the Wissenschaftszentrum Berlin therefore draws a sobering conclusion: '"Neither the hopes of some of the employers' associations nor the fear of some trade unions that flexible working time would spread rapidly can be confirmed. On the contrary, it is striking that not only the representatives of the employees but also management approach far-reaching and widely effective changes in working times only with hesitation. In the enterprises in which job sharing, part-time working or flexible forms of fulltime employment are practised in certain departments or throughout the plant, the process of preparation and of change-over has usually taken several years. Even in those cases which often concern only individual enterprises, it frequently took months or years until, for example, the desire of the senior executives for parttime working could be realized."
4.3.2 Shift-work
Apart from part-time working, shiftwork is an essential instrument for decoupling the individual working time from the oper~ ating times of the production facilities. Its expansion has increased in the past, as the slight information which is available shows. At the beginning of the sixties, in manufacturing industry 14 % of the employees were acting as shiftworkers. This proportion increased steadily at the b~inning of the seventies to 20 % and by 1984 it had reached 25 %.
For decades past, it was the capital-intensive branches in which shiftworking was practised relatively frequently (metals
1) Burian, Hegner·(1984). 2) Reyher, Spitznagel, Teriet, Streck, Vogler-Ludwig (1985). 3) Vogler-Ludwig (forthcoming).

72
production, the textile industry, paper- and paper-board manufacture; Table 4.8). In addition, shiftworking is also characteristic of individual sectors in the service trades (transport, health service, publishing). More recent :.:.esults of surveys which were made in the manufacturing industry1J show that in particular the growth branches have made increased use of shiftworking in recent years, i.e. the entire capital goods branch, including the chemicals industry and plastic and rubber processing, whereas metal production and the sectors which are dependent on construction have cut down the amount of shiftwork. Accordingly the degree of shiftworking seems to be dependent on the production trend, a conclusion which moreover has also been confirmed by previous surveys within the framework of Ifo Business survey. These observations show clearly cyclical fluctuations in the degree of shiftworking which was clearly correla~~d with the degree of utilization of the production facilities.
Shiftworking is primarily carried out in systems with either two or three shifts, with individual working times of 8 hours per day and 40 hours per week. It is true that other shift systems with reduced individual working times (for example, 6 hours per day or 4 days per week) do appear in practice but they are the exception.
1) Reyher, Spitznagel, Teriet, Streck, Vogler-Ludwig (1985). 2) w. Friedrich, K.Ch. Rtlthlingshtlfer (1980).

73
Tabie 4.8
Special forms of eaploJ!!nt
Emplo~-eesa
Proportion of ••• (%)
Industry shift part- fixed contract (1000) workers time em- term workers
ployees workers
Chemical industry, oil refining 588 17.7 4.2 1.1 0.8
Plastic goods product., rubber processing 298 32.3 4.9 1.6 o.1
Stone, ores, fine ceram-ics and glass industry 285 19.4 5.4 0.8 o.o
Wood working, paper and l97 paper board 37.0 4.4 1.3 0.1
Metal production and metal processing 548 40.3 2.0 0.8 0.2
Steel, aachinery, auto-mobile production 2 102 28.9 2.3 1.2 0.4
Electrical, precision machinery, optics, fabric. aetal products 1 304 19.5 5.5 1.8 0.2
Wood processing, ausical instruments etc. 253 4.8 6.9 1.1 o.o
Printing, reproduction 163 30.9 7.6 1.7 o.o
Textile industry 235 46.7 8.8 0.7 o.o
Leather/clothing ind. 261 1.7 15.2 o.s o.o
Food-stuff and luxury aooda industry 460 14.8 7,6 3.0 0.1
Manufacturing industry 6 695 24.8 4.8 1.4 0.3
Trade 3 332 - 24.1 1.2 0.6
a) In manufacturing industry: Enterprises with 20 or aore employees.
Source: Ifo/IAB-aurvey, October 1984.


75
5. New areas of employment growth
The sectoral and vocational change in employment structures has clearly demonstrated the trend towards the service society. However, the hopes which were connected with the growth of the service sector were disappointed. Its expansion in employment was not enought to compensate for the releases in the goods producing and agricultural sectors. Nevertheless, hopes were not only linked to the growth of service trades production, but also to the dynamism of smaller and medium-sized enterprises and to the growing regions within the Federal Republic of Germany. In these fields, it is assumed that the innovative and competitive enterprises are to be found which are of particular importance for overcoming the employment crisis.
5.1 The service industry
The service sector is at the beginning of the eighties the most significant employment area in the economy, with a share of 53 %. Particularly during the sixties, it demonstrated strong dynamism in growth. But its expansion strength has weakened with the reduced growth during the seventies and eighties. The absolute increase in the employment of this sector has halved during the period 1973 to 1983 by comparison with 1960 to 1973 (Table 5.1). Labour saving in the sectors of commerce and transport, which are dependent on goods production, and the slower expansion of employment in public services were the decisive factors in this trend. On the other hand, no substantial weakening can be observed in the service trades which are either private or business oriented. At the beginning of the eighties, employment growth has again accelerated in these fields.
The trend in employment in the service sector has therefore showed a very differentiated picture, and on closer inspection various trends can be observed. As the statistics for the employees subject to social security shows on the three-digit level in the classification by branches, the service areas having the strongest growth rates include the following (Table 5.2):
- education, science and culture, - leisure and sport, - business services, - health services and care.

Tab
le 5
.1
Ind
ust
ry
Ag
ricu
ltu
re,
fore
stry
, fi
shin
g
Goo
ds
pro
du
cin
g i
nd
ust
ries
Ser
vic
e in
du
stri
es
Tra
de,
tr
an
spo
rtati
on
W
hole
sale
tr
ad
e,
trad
e ag
enci
es
Reta
il t
rad
e R
ailw
ay t
ran
spo
rt
Wat
er tr
an
spo
rt
Po
st a
nd c
omm
unic
atio
n O
ther
tra
nsp
ort
Bu
sin
ess
and
pri
vate
serv
ices
Fin
anci
al i
nst
itu
tio
ns
Insu
ran
ce
Res
tau
ran
ts,
ho
tels
S
cien
ce,
edu
cati
on
, p
ub
lish
ing
H
ealt
h a
nd v
ete
rin
ary
ser
vic
es
Mis
cell
aneo
us
serv
ices
Pu
bli
c se
rvic
es,
n
on
-pro
fit
org
an.
Lo
cal
au
tho
riti
es
So
cial
secu
rity
P
riv
ate
ho
use
ho
lds
No
n-p
rofi
t o
rgan
isat
ion
s
To
tal
Net
ch
ange
in
em
ploy
men
t (1
000)
Lev
els
1983
19
60-1
973
1 39
1 -
1 65
7 10
541
22
6 13
34
0 2
217
4 76
1 25
6 1
294
76
2 02
6 11
7 33
4 -
81
66
-21
50
7 97
53
2 68
3 70
0 75
9 55
7 20
8 20
6 87
77
4 11
2 24
6 15
52
9 12
2 1
388
215
4 87
9 1
202
3 78
7 1
219
239
50
73
-28
6 78
0 21
9
25
272
786
So
urc
e:
Sta
tist
isch
es
Bun
desa
mt
(Nat
ion
al A
cco
un
ts).
Net
cha
nge
1973
-198
3 19
73-1
978
1978
-198
3
-53
3 -
388
-14
5 -
2 18
2 -
1 33
7 -
845
1 13
8 52
0 61
8 -
254
-14
3 -
111
-12
1 -
93
-28
-
49
34
-83
-
104
-64
-
40
-24
-
12
-12
16
-
19
35
28
11
17
577
236
341
83
26
51
2 -
6 8
84
67
17
27
4 23
17
7 10
9 68
20
4 36
16
5
815
427
388
618
359
259
41
20
21
-22
-
14
-8
178
62
116
-1
577
-1
205
-37
2

77
Table 5.2 Growing service industries
(Employment subject so social aecurity)
Service industry
Education, science, culture Private schools, universities Schools and high school of private organisat. Public authorities schools, high schools Cultural and scientifical organisations Theaters Libraries Film and televisio.n Publishing houses
Leisure and sport Travel agencies Sports installations and organisations
Business services Auditing Business advertising Legal consultancy News agencies Architects' and engineers' offices Property management Translation offices Fairs and exhibitions of the local authorities Business and vocational representation Cleaning of buildings Security services Private waste collection
Health services and care Clinics of social insurance
private of the local authorities of non-profit organisations
Private health services Private veterinary services Homes (for aged and institutions)
of non-profit organisations Free welfare services
Annual growth rate (%)
1977 - 1984
4.2 4.7 4.2 1.2 6.1 1.7 3.2 1.4 1.4 4.1 3.2 5.2 3.8 5.1 4.2 4.2 3.7 3.3 3.o 3.0 3.0 2.8 3.8 3.6 3.5 3.7 5.7 3.2 2.7 2.6 4.3 6.7 7.6 4.8 6.9
Source: Bundesanstalt fUr Arbeit (Beschlftigtenstatistik).

78
Strong impulses have been provided by the demand of the private households for educational services. Above all, school and educational institutions outside the public sector were favoured by the increased interest in education, but also by the necessity for further vocational training and retraining. The growth of employment in this sector may well have been underestimated, because teaching is frequently carried on in spare time. The same also applied to the sector of leisure and sports.
Apart from education and leisure, the health and care services, in particular, received strong support from the private demand. Employment could not only be expanded in the private health service. In the clinics of the social insurance companies, the local authorities and the non-profit organisations, the number of employees subject to social security also increased clearly. To some extent the employment in homes (in particular homes for the elderly) and in the service of the free welfare societies expanded still more strongly. Nearly 100,000 jobs were provided in the "care services".
The increase in employment in the miscellaneous service enterprises was decisively supported by the business services. The majority of the additional jobs were made available by auditors, engineering and architectural offices (including software houses), property management as well as companies engaged in the cleaning of buildings.
The difference in growth rates shown above allows it to be recognized that employment - to the extent that it depends on the demand fro~ private households - expanded less among the traditional suppliers of personal services (for example body care, the hotel and restaurant industry), but more in the case of the services which are publicly supplied or financed. Both in education and health services, as well as in the institutions which are oriented towards culture, science or leisure, the state and non~ commercial organisations played an important part. They seldom offer their services against direct compensation, but are financed by means of contribution or from taxation. In the course of the efforts which were made to consolidate the national budget, the oppurtunities for expansion in the state services have deteriorated. It appears that the employees in the private non-commercial organisations have profited from this trend.

79
5.2 Small firms
The role of small and medium-sized enterprises in the development of employment hff attracted in increasing attention in the studies made by Birch for the USA as well as for the Federal Republic of Germany in recent years. It was found that the shift in employment from the goods producing sectors to the service sector has allowed the share of small firms in total employment to increase, because service enterprises are on average smaller than firms in manufacturing industry. To that extent the assumption that smaller enterprises, however they may be precisely defined, have compensated to some extent for the reduction in employment, particularly in the large enterprises of the producing sector, is correct.
Whether the small enterprises in general show a more favourable employment trend than the large firms can, however, not be answered on the basis of the material which is presently available. It is true that this question is answered in
25he affirmative
in various studies: for example Friedrich et al. found at the end of the seventies that smaller firms have more favourable employment expectations than the larger companies. Other studies investigated the actual trend of employment in individual enterprises and !)und a positive employment trend in the case of small businesses. The trend shown in Table 5.3 also points in this direction. But the validity of this evidence is generally shaken by the fact that either only existing enterprises were included in the investigations (thus t\) closure of businesses and new foundations were not observed) , or distributions of employment by size of firm were compared at different points of time and thus the growth of employment in individual enterprises can no longer be identified. It must be assumed that the employment fluctuations which can be found in the big enterprises is seen in the small enterprises in the form of fluctuations in the number of businesses.
The results concerning the trend towards self employment have shown that this tendency has most recently become positive again. Therefore in the case of small businesses a more favourable growth in employment can be assumed. But this assumption is weak, because the number of employees remains obscure.
1) Birch (1979). 2) Friedrich, Nerb, Reyher, Spitznagel (1978). 3) Steinle (1984); Hull (1985); Irsch (1986). 4) This is the case in the table mentioned.

Table 5.3
80
Employment by size of firm
(Share of total employment in %)
Goods producing Service Size of firms industries industries (employed persons)
1980 1985 1980 1985
1 - 9 o.s 0.8 2.8 4.0
10 - 19 0.8 1.4 4.9 5.5
20 - 49 2.9 3.8 11.9 12.7
50 - 99 5.2 6.4 11.8 11.7
100 - 499 26.7 30.0 26.9 27.5
500 plus 63.9 57.6 42.0 38.6
Total 100 100 100 100
Source: Irsch (1986); Kreditanstalt fUr Wiederaufbau.
5.3 Regional disparities
In the past ten years, the disequilibrium in the labour market has led to clear disparities in the employment trend of individual regions in the Federal Republic of Germany. The structural· problems of the whole economy and disparate successes in overcoming structural change have left their mark.
As Chart 5.1 shows the trend in employment was more favorable in the southern regions than in the northern districts. Whereas the employment trend in the course of the seventies and eighties was negative on the average of the Federal Republic the regions of Southern Bavaria and Northern Bavaria were able to increase employment. Baden-Wuerttemberg was approximately able to maintain the employment level of 1974. On the other hand, clear reductions in employment are to be seen in North-Rine-Wes tphalia, Berlin, Lower Saxony and Bremen.
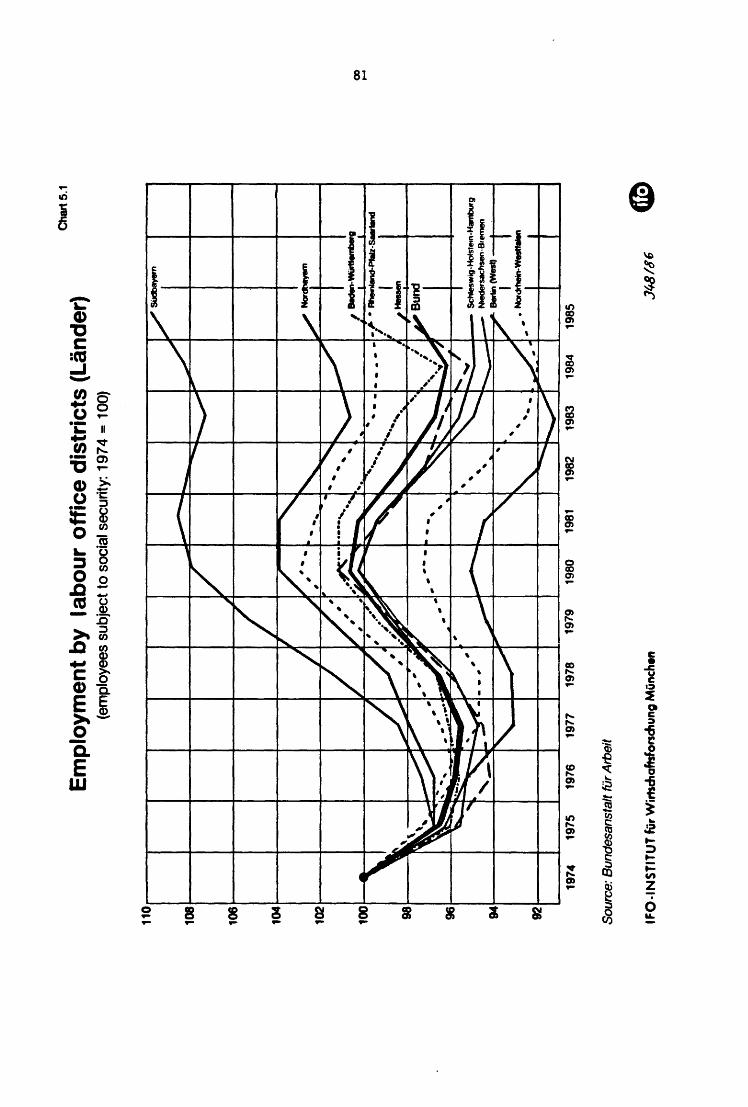
110
108
106
104
102
100 98
96
94
92
- ' l, !\\ ....... ~
~ '
Cha
rt 5
.1
Em
plo
ymen
t b
y la
bo
ur
off
ice
dis
tric
ts (
Lan
der
) (e
mpl
oyee
s su
bjec
t to
soc
ial s
ecur
ity:
197 4
= 1
00)
L
/SUdb
ayern
-~ ~
~v
..........
. ~ ,_
/_
v
"' j
v..
" vN
orr
/ ,
-.....
, .....
.
v V·~
.. ... ...
""" ~
I • "-
!5.·-
· •.... ,
... ~
· .. ._ '
~~
' B
eden
-WU
rtte
mbe
rg
~
'•
~"'
/ L
l
~ V
.· ~ r ~ '·
.... -.
-~-
• R
hetn
land
-Pfll
lz-s
..ta
nd
, ~···
--.--
,'
I . .
. .......
. .....
.. } ~~
~ ~
~ v
~
'· ...
/ ~Bund
• ---
-~---
~ ~
_, '
. -
_, I
... •
_, '
' ...
. -..
-·-:..
-----'
'
~
~ v
, ,
~ ~"
,
-:-~
' ~~ ~---
, ~
' S
chle
swig
-Hol
stet
n-H
ambu
l'g
--.. ~ ~
' .....
... -~
Nte
ders
achs
en-B
rem
en
' ...
...
Ber
tin (
Wes
t)
• .
" ~ i""
""'
" '
./'
I I
' /.
~
' •
Nor
drhe
in-W
esff
*l
,_-.. •
I
I .....
........ ~
1974
19
75
1976
19
77
1978
19
79
1980
19
81
1982
19
83
1984
19
85
So
urc
e: B
un
de
san
sta
lt fU
r Arb
eit
IFO
-IN
STIT
UT
fur W
irtsc
hafts
fonc
hung
Mun
chen
Jt
,B/8
6

82
This distribution has led to the slogan of a "North-South gradiant" in economic trends. Basically, however, the wrong frame of reference was chosen. The disparities in development result primarily from the regional concentration of branches which are weak in growth. North-Rine-Westphalia had to suffer, in particular, from the structural problems of the steel industry and of mining. The costal states (Lower Saxony, Bremen and Hamburg) suffered from the crisis in the ship-building industry, in shipping and the docks. On the other hand, the South was favoured by the possession of a high proportion of manufacturers of capital goods and of service trade enterprises. These disparities radiated via input and income integration over the entire dynamics of the regional economy. Therefore the analyses show that the southern regions have in general performed better in tf) shrinking sectors than the average for the Federal Republic. North-Rhine-Westphalia and especially the Ruhr-district have remained, on the contrary, behind in the growth sectors as well.
Therefore from the historical point of view, the economic dynamism has shifted from the old i~~ustrial centres of the North to the less industrialized South. The important factor here is also the federalist structure of Germany which has led to substantial competition in the creation of relocation advantages for enterprises between the state governments and even the communities. Possibly the southern federal states found that they had more room to manoeuvre in this respect because of their smaller structural problems.
During the eighties, in a reversal of the earlier trend, it was found that the agricultural oriented regions ha~) to accept fewer loss~s in employment than the urban centres. The earlier contradictions between the growth-intensive agglomeration and the rural "poor-houses" appear to be decreasing. The strongly polluted agglomeration are not only avoided by the older people moving to the country-side, but also by younger workers - with the correspondig gains in income distribution, monetary demand and po~ tential in the areas to which the population is moving. The supply of services and the quality of the environment is becoming more important. At the same time, strong shifts of employment from industrial production to the sectors of the service trades can be observed.
1) Jung (1984). 2) RHthlingshHfer (1985). 3) Koller, Kridde, Masopust (1985).

83
6. Conclusions
The employment system in the Federal Republic of Germany has been subjected in the past to substantial structural changes. Great demands have been made on the adaptability of the labour force both by the sectoral changes as well as by the technical and organisational change in production processes. Not all of the workers were able to cope with this development. The necessary process of adaptation was aggravated particularly by the reduction in the flexibility of the total labour market, which has inevitably set in with the reduced demand for labour. Therefore not everyone has had the opportunity for a new beginning. The end of the "economic miracle" has also changed the climate in the labour market. The competition for jobs, and above all for good jobs, was substantially aggravated during the seventies and the enterprises made use of unemployment for an increased selection process among their labour force.
The changes in the demand for labour therefore had very selective effects. Two social groups were primarily affected: the workers in the manufacturing sectors and the self-employed, with their family workers, in the fields of agriculture and forestry, manufacturing industry and trade. Their work was in decreasing demand because of the deceleration in the growth rate in goods production, the progressive trend to technology in production processes and the continuing concentration in the business sector. The individual groups of employees were only partially able to counter the pressure for adaptation by offensive reactions. For many of them, the disqualification of their vocations, long-term unemployment and early transition to pensions remained irreversible.
New opportunities opened up in the labour market primarily for those workers who were prepared to meet the vocational requirements and improve their qualifications. This is discernible, in particular, in the fields of goods production. Skilled workers are required there primarily. They are in demand because of their capability to handle complex technical systems and less because of their specialized knowledge in manual production processes. The readiness to adapt to new technologies and to employ them has again become more significant. This also applies to other vocational sectors in which vocational qualifications are becoming obsolete because of new technologies. On the sunny side of structural change are to be found the technical vocations, employees in administrative work and the civil servants.
The trends illustrated above will not remain without consequences for the system of vocational training - and especially for factory training. The tendency which was formerly observed towards

84
specialisation of vocational training is now increasingly encountering its limitations. The demand is for workers whose knowledge allows them a broad field of employment (for example, automobile mechanics, electricians, sales staff). However, the trend towards a generalization of vocational training has only been hesitantly followed by the educational system. This is also caused by the fact that at the beginning of their career the workers are predominantly trained in the handicraft sector which is interested mainly in specialized knowledge for manual labour but are employed in the industrial field where technical knowledge is prefered. Probably the factory training of a new type of industrial worker must be shifted from handicrafts to manufacturing, and from small to big enterprises.
The introduction of new technologies has sharpened the borderlines on the labour market: with respect to the labour force the enterprises have a strong interest in the optimal use of their human capital. Efforts for the shortening or greater flexibility of working time therefore encounter resistance from the firms. The opportunities for a decrease in unemployment which such measures can offer are not used. In the same sense, the employees who belong to the permanent staff of the enterprises are interested in the advantages of long-term labour contracts, qualified work and appreciable working conditions• They therefore resist greater flexibility in the labour market as a result of reduced protection against dismissal or flexible wages. New forms of employment therefore have only penetrated very hesitatingly and only into the marginal sectors of the labour market. In the present constellation of interests, the result is necessarily the squeezing out of the labour market of those workers whose competitive chances are comparatively poor. The less competitive among them are forced into unemployment, the elderly into retirement, and for the young people further training has accquired growing importance. The households, on the other hand, which were able to offer better qualified and competitive workers, have expanded their labour supply. The price for this squeezing out labour from the market is the increasing burden placed on the income from economic activity by social expenditure.
The present forecasts for the trend in the labour market until the year 2000 do not show any basic change in the present constellation. The high surplus of labour will remain, despite the relief provided by the demographic trend in the nineties. The part played by new technologies will presumably increase in significance and the growth in productivity will not slow down. In the light of this trend, labour market policy can probably only mitigate the problems but cannot solve them.

85
In this situation further qualification of the labour force may well have high priority in all measures which are taken. This is not only a contribution to overcome the present bottlenecks in the labour market and to adjust to structural change, but also to redistribute the job opportunities for all workers. Nevertheless, there will not be enough jobs for those who are interested in working. Measures which counteract the reduction in working capability {job creation measures) and also income maintenance will remain significant.
At present, great hopes are placed on greater flexibility of the labour marktes. In this process positive effects for employment, but also risks for the work force, are discernible. As regards the future dynamics of flexibility, the trend until now, however, provides more cause for scepticism than for euphoria. The int.roduction of more flexible rules, which always signify a new sharing of risks relating to employment or income, is encountering great resistance and will therefore require very long periods of time. But possibly the pressure of increasing unemployment will compel! the introduction of more flexible forms of employment.


ANNEX


89
7. Statistical sources and classifications
7.1 Statistical sources
The statistical observation of the labour market can be based on a large number of surveys, of which three sources are outstanding for a com~jehensive description of the national economy (Table 7.1 and 7.2):
-Labour force survey (Mikrozensus): These annual surveys are the German contribution to the EC-wide labour force surveys. They are representative of the population and supply the most detailed description of the labour market, with respect to the number of characteristics which are surveyed.
- Employment Statistics of the Social Security System (Besch!ftigtenstatistik): These statistics cover all the economically active persons who are subject to social security. They number approximately 75 % of total employment. They do not include the self-employed and family workers, the civil servants and employees, whose monthly income is less than DM 410,--.
-National Accounts (Volkswirtschaftliche Gesamtrechnung): The employment statistics in the national accounts are based on a large number of statistics for individual sectors, apart from the sources named above. They supply a consistent summary of all statistics on employment and thus a reliable picture of the employment trend with respect to its level and its strucutre.
Census data (Volksz!hlungsergebnisse) are at present only available for 1970 and earlier. They will only become available again with the national census which is planned for 1987. The lack of a total statistical survey by the national census has its effects particularly on the reliability of the data from the Labour. Force Survey. Comparisons between the results from the Labour Force Survey and the National Accounts show that the employment level, according to the Labour Force Survey, was 1.3 millions higher in 1984. It must be assumed that the computation process used in the Labour Force Survey supplies exaggerated values. But despite this mistaken estimate, the Labour Force Survey remains indispensable for a description of qualitative changes because of its large number of features.
1) A more detailed description of labour market statistics can be found in Herberger, Mayer (1984).

Table 7.1
1. Title
2. General purpose
3. Sponsor
4. Conducted by
90
Main data sources
Labour Force Survey (Mikrozensus)
representative population survey
Employment Statis- National Accounts tics of the Social (VolkswirtschaftSecurity System liche Gesamtrech(leaehlftigtenata- nung) tistik)
total registration of employees, subjekt to social security
estimation of employment by industry
secretary of state sectetary of labour
secretary of state
Statistisches Bun- Bundesanstalt fUr Statistisehes Bun-desamt Arbeit desamt
5. Frequency yearly quarterly since quarterly, yearly of collec-tion
6. Population total population represent-ed
7. Sample size 1 %, quoted aethod
8. Method of obtaining data
9. Form of storage
oral interview
printed publication:
1974, aonthly since 1986
employees subject ---to aocial securi-ty
total
registration
prited publication:
combination of various statistics, estimations
printed publication:
Statistisches Bun- Bundesanstalt fUr Statistisches Bun-desamt: Faehserie Arbeit: Arbeits- desamt: Fachserie 1, leihe 4.1 aarktstatistik; 18 machine readable Statistisches Bun- aachine readable data: Databank STATISBUND
desamt data: Databank STATISBUND

91
Table 7.2
Basic variables of eaployment statistics
Labour Employment
Variables force statistics National of social accounts survey security
Demoara_2hic variables Sex X X X Age X X Personal status X Household structure X Natonality X X
Em,2lo:l!ent Sector of activity X (90) X (295) X (53) Size of firm (X) Occupation X (328) X (328) X Occupational status X X X Working time X X X Missing hours X Overtime X Short time work X Main income X Personal income X X X Household income X X
Education General education X Vocational training X X Apprenticesh., oth. school X X University X X Adult vocational training X Fields of study X
Region Working place (X) X Living place X Commuter X Mean of transportation X Time spent on transportat. X
~ 1 Bund X X 2 Land X X 3 legierungsbezirk X (X) 4 Kreis (X) 5 Gemeinde
(X) • occasionally X ( ) • level of disaggregation

92
Apart from these comprehensive statistics, there is a vast amount of data on employment which is specific to sectors. The most important are as follows:
- Statistics of manufacturing industries, energy and water supply, mining and quarrying and the constructing industries: monthly reports on turnover and employment for enterprises with 20 or more employees.
- Statistics of the wholesale and retail trade (Handelsberichterstattung): monthly reports on turnover and on employment.
-Employment in public services (Personalstandsstatistik): annual reports on the personnel employed in public service.
. It is not intended to enter into details here of these statistics, because they are integrated in the data of the National Accounts, and, apart from data on level, they only seldom contain qualitative characteristics of employment.
Apart from the statistics on employment, several statistics exist on wages and incomes in manufacturing industry, trade and in the financial institutions and insurance companies. These supply data on a quarterly basis for income levels and on the structure of the employees classified by wage groups as well as more differentiated data, at longer time intervals (every two years), on the components of incomes.
1.2 Classifications
7.2.1 Sector of acti-vity
All the classifications for sectors of economic activity which are used in this report follow the institutional concept, i.e. the total number of employees in a business or enterprise is allocated to a sector correspondig to the focal points of production. In the case of personnel surveys of economically active persons, this leads to certain dis pari ties when compared with the data from the enterprises, because in the personnel surveys, the indication of the economic focal points cannot be carried out with the same degree of precision as in the case of enterprise surveys. In particular, problems arise in the division between state and private economic institutions. The sectoral classification of the Labour Force Survey differs for this reason in the field of private and public services from the breakdown which is used in the National Accounts.

93
In the tables which are displayed it is therefore essential to distinguish between the system used for
- the Labour Force Survey, and - the National Accounts.
They are shown in Table 7.3 and 7.4. The system used for the Labour Force Survey differs in having a more profound breakdown into 90 sectors, whereas the system of the National Accounts has 53. The classifications are oriented )owards the national "Systematik der Wirtschaftszweige 1979" (Wz)l , which is comparable with the NACE only to a limited extent. The essential differences are as follows:
- Electricity, gas, heat and water supply as well as the whole of mining are shown in a common division 1. The extraction and processing of stone and earths, the production and processing of fissionable fuels as well as oil refining are classified, on the other hand, within the manufacturing industry (division 2).
- The repair of consumer goods and vehicles is allocated to manufacturing industry.
- The butcher's stores are allocated to processing industry, to the extent that they are not limited to the status of retail trade butchers and the manipulations which are usual in the trade connected with butchery work.
- The construction of finished parts made of concrete or wood in above-ground construction is allocated to the construction industry (division 3).
- The publishing industry is classified under the service trades (division 4).
In addition, on the lower levels, there are further disparities between the classifications of the NACE and of the WZ, which are based on the use of different classification features.
1) Statistisches Bundesamt (1979 a).

Table 7.3
WZ-No.
0
1 ••• 3 1 2
3
4 ••• 7
4 5
6
7
8
9
94
Industrial classification
Version for the Labour Force Survey
Industry
Agriculture and Forestry
Goods producing industry Energy, gas, water, mining Manufacturing industry
Chemical industry, oil refining Plastics production, rubber processing Stone and ores, fine ceramics, glass Iron and metal production, foundries, steel forming
Steel, machinery and automobile production office machinery, IDP devices
Electrical engineering, precision mechanics, fabricated metal products
Wood, paper- and printing industry Leather, textile and clothing industry Food, beverage, tobacco
Construction Construction industry Finishing
Trade, transport, services Trade Transport, communications
Railways Post and communication Miscellaneous transport
Financial institutions, insurance Financial institutions Insurance companies
Miscellaneous services Restaurants and hotels Cleaning and body care Science, education, arts, publishing Health- and veterinary services Legal and business consultancies etc. Other services
Non-profit organisations, private households
Local authorities/social security

Table 7.4
WZ-No.
0
1 ••• 3 1
2
95
Industrial classification
Version for the National Account
Industry
Agriculture, forestry, fishing
Goods producing industries Energy, mining and quarring
Electricity, gas, water Coal mining Other mining
Manufacturing industry Chemical industry Petroleum refineries Plastic production Rubber processing Stone and ores Fine ceramics Glass and glass products Iron and steel production Non-ferrous metal production Foundries Rolling and drawing mills Structural metal production Machinery Office, computing machinery Motor vehicles Ship building Air and space crafts Electrical equipment Precision equipment, optics Fabricated metal products Music instruments, toys Sawmills, wood mills Furniture, wood products Pulp, paper and paperboard Paper products Printing Leather products Textiles Waering apparel Food manufacturing, beverage industries Tobacco
Continuation on the next page
96
Continuation of Table 7.4
WZ-No.
3
4 ••• 7
4
5
6
7
8
9
Industry
Construction Construction industries Finishing
Trade, transport, services
Trade Wholesale trade Retail trade
Transport, Communication Railway transport Water transport Post and communication Other transport
Financing, insurance Financial institutions Insurance companies
Miscellaneous services Restaurants, hotels Education, research, publication Health, veterinary services Other services
Private households and organisations Private households Non-profit organisations
Public services Public administration and defence Social security
Source: Statistisches Bundesamt (National Accounts).

97
7.2.2 Occupations
The classification of occupations from 1970 (KB) 1) defines on the level of three-digits 238 classification points. It is summarized into 86 vocational sections (two-digits) and 6 vocational sectors (one-digit). On the level of the three-digit classification, the system used is to a farreaching extent comparable to that of ISCO. However, the summaries follow national criteria (Table 7.5).
1) Statistisches Bundesamt (1970).

Table 7.5
KB-No.
1
2
3
4
5
6
98
Classification of occupations
Occupation
Agrigultural trades
Mining trades
Manufacturing trades Chemical workers, plastic processors Stone, ceramics and glass workers Met~l producers and processors Fitters, mechanics Electricians, assemblers Paper and printing trades Woodworkers Textile and clothing trades Food trades Building trades Decorators, painters Quality controllers, mail order workers Ancillary workers Machinists
Technical trades Engineers Chemists, physicists, mathematicians Technicians Technical specialists
Service trades Sales staff Transport trades Service trade merchants Bodycare, hotel and cleaning trades Educational workers Administrative trades Organisation and management trades Security and policing trades Artistic professions
Miscellaneous workers
Source: Statistisches Bundesamt (1970).

99
8. References
MittAB = Mitteilungen aus der Arbeitsmarkt- und Berufsforschung BeitrAB = Beitr~ge zur Arbeitsmarkt- und Berufsforschung
Becker, B. (1984): Sozialversicherungspflichtig Besch~ftigte nach Besch~ftigungsdauer, Bruttoarbeitsentgelt und Art der Beschiftigung. Wirtschaft und Statistik, no. 12
( 1985): Sozialversicherungspflichtig Besch~ftige nach Besch~ftigungsdauer und Bruttoarbeitsentgelt. Ergebnisse der Besch~ftigtenstatistik 1982. Wirtschaft und Statistik, no. 12
Birch, D.J. (1979): The Job Generation Process, Cambridge (Mass.)
BHhl, K., Stooa, F., Troll, L. (1981): Berufs- und T~tigkeitsinhalte im Wandel, BeitrAB, no. 12, NUrnberg
Brinkmann, c., Kohler, H. (1981): Am Rande der Erwerbsbeteiligung: Frauen mit geringfUgiger, gelegentlicher oder befristeter Arbeit, in: Klauder, w., KUhlewind, G.: Probleme der Messung und Vorausschitzung des Frauenerwerbspotentials. BeitrAB, no. 56, NUrnberg
Burian, K., Heyer, F. (1984): Betriebliche Erfahrungen mit neuen Arbeitszeitformen. IIM/LMP 84-1, Berlin
Bundesregierung (1979): Vierter Bericht der Bundesregierung Uber Erfahrungen bei der Anwedung des ArbeitnehmerUberlassungsgesetzes. Bundestagsdrucksache 8/4479
Clemens, R., Friede, Ch. (1986): ExistenzgrUndungen in der Bundesrepublik Deutschland, Grundlagen einer ExistenzgrUndungsstatistik. Schriften zur Mittelstandsforschung, no. 8 NF, Stuttgart
Commission of the European Communities (1985): European Economy, no. 10, Supplement B
Deutsches Institut fUr Wirtschaftsforschung (1985): Verkehr in Zahlen, Bonn
(1985 a): Die Entwicklung des Personenverkehrs in der Bundesrepublik Deutschland bis 1982. Wochenbericht 34
(1983): Auswirkungen des Strukturwandels auf den Arbeitsmarkt, Anforderungen des Strukturwandels an das Besch~ftigungssystem, Berlin

100
Dostal, W. ( 1982 a): Bildung und Beschl:lftigung im technischen Wandel, BildungsBkonomische und arbeitsmarktpolitische Rahmenbedingungen des technischen Wandels am Beispiel der elektronischen Datenverarbeitung und Mikroelektronik, Institut fUr Arbeitsmarkt- und Berufsforschung der Bundesanstalt fUr Arbeit, NUrnberg
(1982 b): FUnf Jahre Mikroelektronik-Diskussion, in: MittAB, no. 2, PP• 151-166
(1984): Datenverarbeitung und Beschl:lftigung, Teil 3: Der Informationsbereich, in: MittAB, no. 4, pp. 490-505
Dostal, w. et al. (1982): Flexible Fertigungssysteme und Arbeitsplatzstrukturen, in: MittAB, no. 2, pp. 182-191
Dostal, w., KBstner, K. (1982): Beschl:lftigungsverl:lnderungen beim Einsatz numerisch gesteuerter Werkzeugmaschinen, in: MittAB, no. 4, pp. 443-449
Dostal, w., Lahner, M., Ulrich, E. (1977): Datensammlung zum Projekt Auswirkungen technischer Anderungen auf Arbeitskrl:lfte, in: BeitrAB, no. 17
DUll, K. (1985): Gesellschaftliche Modernisierungspolitik durch neue "Produktionskonzepte"? In: WSI-Mitteilungen, no. 3
Friedrich, w., Nerb, G., Reyer, L., Spitznagel, E. (1978): Zu den Beschl:lftigungserwartungen, den Arbeitsplatzreserven und zum Potential an zusl:ltzlichen Teilzeitarbeitspll:ltzen in der Verarbeitenden Industrie und im Bauhauptgewerbe, Ergebnisse einer reprlisentativen Befragung, in: MittAB, no. 2, pp. 235-252
Friedrich, w., Rtlthlingshtlfer, K.Ch. (1980): Schichtarbeit in der Industrie. Ifo-Studien zur Industriewirtschaft, vol. 21, MUnchen
Friedrich, w., Spitznagel, E. (1978): Verbreitung und Beurteilung · einzelner Formen der Teilzei tarbei t und ihre Expansionschancen aus Unternehmersicht, in: MittAB, no. 4/81
Gesamtverband der Metallindustriellen Arbeitgeberverblinde e.v. (1985): Sonderumfrage zur betrieblichen DurchfUhrung der ab 1.4.1985 geltenden neuen tariflichen Arbeitszeitregelungen in der Metallindustrie
Haug, F. (1984): Symposium "Industriesoziologischer Technikbegriff". Institut fUr Sozialforschung, Frankfurt/Main, 25. - 26.11.1983. In: KBlner Zeitschrift fUr Soziologie und Sozialpsychologie, no. 1

101
Hegner, F., Schlegelmilch, c. (1983): Formen und Entwicklungschancen unkonventioneller BeschKftigungsinitiativen. IIM/LMP 83-19, Wissenschaftszentrum Berlin
Heinze, J., Schedl, H., Vogler-Ludwig, K. (1986): Wachstumsfelder am Rande der offiziellen Wirtschaft. Auswirkungen expandierender Produktions- und BeschKftigungsformen auf Produktivit~t und Strukturwandel. Ifo-Studien zur Strukturforschung, vol. 7, MUnchen
Heiberger, Ch., Schwarze, J. (1986): Umfang und Struktur der Nebenerwerbst~tigkeit in der Bundesrepublik Deutschland, in: MittAB, no. 2
Herberger, L., Mayer, H.-L. (1984): Uberblick Uber die derzeitigen Statistiken des Arbeitsmarktes und der BeschUftigung, in: Statistiken des Arbeitsmarktes und der BeschKftigung (Special Volume of the Federal Statistical Office), Wiesbaden
Heyer, G. (1981): Arbeitszeitforschung: Diskrepanzen ermittelt. Bundesarbeitsblatt, no. 9
Hofbauer, H. ( 1979): Zum Erwerbsverhalten verheirateter Frauen, in: MittAB, no. 2
Hull, C.J. (1985) Job-Generation among independent West-German Manufacturing Firms 1974-1980 - Evidence from Four Regions in: Environment and Planning C: Government and Policy, 1985, vol. 3
Institut fUr Arbeitsmarkt- und Berufsforschung (1986): ArbeitskrMftestruktur 2000 - Schwerpunktheft der Mitteilungen aus der Arbeitsmarkt- und Berufsforschung, MittAB, no. 1
lnstitut fUr Sozialwissenschaftliche Forschung (1980): Neue Technologien in der Textverarbeitung - Industriesoziologische Analyse ihres Einsatzes in BUro und Verwaltung, RKW (Ed.), Mar burg
Irsch, N. (1986): Kleine und mittlere Unternehmen im Strukturwandel, Frankfurt
Jung, H.-u. (1984): Berufs- und Qualifikationsstrukturen im SUdNord-Vergleich, Hannover
Kaiser, M. (1985): Alternativ-Hkonomische BeschUftigungsexperimente - quantitative und qualitative Aspekte, MittAB, no. 1
Kern, H., Schumann, M. (1970): Industriearbeit und ArbeiterbewuBtsein
102
(1984): Das Ende der Arbeitsteilung?, Rationalisierung in der industriellen Produktion: Bestandsaufnahme, Trendbestimmung, Kdnchen
Klauder, w., KUhlewind, G. (1981): Probleme der Messung und Voraussch~tzung des Frauenerwerbspotentials, BeitrAB, no. 56, NUrnberg
Klauder, w., Schnur, P., Thon, M. (1985): Arbeitsmarktperspektiven der achtziger und neunziger Jahre. Neue Modellrechnungen fUr Potential und Bedarf an ArbeitskrXften, MlttAB, no. 1
Koller, M., Kridde, H., Masopust, G. (1985): Zur Struktur und Entwicklung regionaler ArbeitsmMrkte. MittAB, no. 1
Lahner, M. ( 1975): Auswirkungen technischer Anderungen auf ArbeitskrXfte in der ErnMhrungsindustrie, in: MittAB, no. 4, P• 317
(1976): Auswirkungen technischer Anderungen in metallverarbeitenden Industrien, in: ~tlttAB, no. 3, p. 317
(1982): Auswirkungen technisch-organisatorischer Anderungen auf ArbeitskrMfte im Einzelhandel, in: •attAB, no. 2, pp. 192-205
(1983): Auswirkungen technischer Anderungen in metallverarbeitenden Industriezweigen 1979. Wiederholung der Untersuchung von 1974, in MittAB, no. 2, PP• 153-166
Lahner, M., Grabiszewski, R. (1977): Auswirkungen technischer Anderungen in der Druckerei- und VervielfMltigungsindustrie, in: MittAB, no. 4, p. 524
Lahner, M., Ulrich, E., Kijstner, K. (1974): Auswirkungen technischer Anderungen auf ArbeitskrXfte in der holzverarbeitenden Industrie, in: MittAB, no. 2, p. 118
Landenberger, M. (1983): ArbeitszeitwUnsche. Vergleichende Analyse vorliegender Befragungsergebnisse. IIM/LMP 83-17, Wissenschaftszentrum Berlin
(1984): Flexible Arbeitszeitformen und soziale Sicherung der BeschUftigten. IIM/LMP 84-17, Wissenschaftszentrum Berlin
Malsch, Th. (1985): "Neue Produktionskonzepte" - Zwischen Rationalitllt und Rationalisierung - Mit Kern und Schumann auf Paradigmensuche, Wissenschaftszentrum Berlin
Mickler, o., Mohr, w., Kadritzke, u. (1978): Produktion und Qualifikation. Eine empirische Untersuchung zur Entwicklung von Qualifikationsanforderungen in der industriellen Produktion und deren Ursachen, Berlin

103
OECD (1985): Employment Outlook, Paris
Reinhard, M., et al. (1983): Gesamtwirtschaftliche und sektorale Perspektiven der Telekommunikation in der Bundesrepublik Deutschland, MUnchen
Reyher, L., Bach, H.-u. (1980): "Arbeitskr~fte-Gesamtrechnung",
Best~nde und Bewegungen am Arbeitsmarkt, MlttAB, no. 4
Reyher, L., Spitznagel, E., Teriet, B., Streck, W.R., Vogler-Ludwig, K. (1985): ArbeitszeitverkUrzung- BetriebszeitverlMngerung. Zu den Besch~ftigungspotentialen einer Entkoppelung von Arbeits- und Betriebszeiten. Ifo-Schnelldienst, no. 14
Rtsthlingshtsfer, K.Ch. (1985): "SUd-Nord-Gef~lle": Mehr als ein Schlagwort? In: Ifo-Schnelldienst, no. 12
Rohmert, w., Haider, E. (1982): Neue Technologien in der Textverarbeitung, vol. 2, Arbeitswissenschaftliche Analyse ihres Einsatzes in BUro und Verwaltung, Institut fUr Arbeitswissenschaft der Technischen Hochschule Darmstadt, Darmstadt
Schmidt, K.D. (1983): Arbeitsm~rkte im Wandel - Konsequenzen fUr die Bildungspolitik, Kiel
Schmidt, R. (1985): Zu den arbeitspolitischen Chancen und Grenzen neuer Produktionskonzepte - einige Anmerkungen ·zum Konzept Horst Kerns und Michael Schumanns einer industriellen "Modernisierung als gesellschaftlichem Projekt", in: WSI-Mitteilungen, no. 3
Scholz, L., et al. (1980): Arbeitswirtschaftliche und soziale Folgewirkungen neuer Technologien im Bereich der Textverarbeitung, MUnchen
Sorge, A. (1985): Horst Kern und Michael Schumann: Das Ende der Arbeitsteilung. Book Reviews, in: Economic and Industrial Democracy, no. 4
Statistisches Bundesamt (1970): Klassifizierung der Berufe, Ausgabe 1970, Stuttgart
(1979): Systematik der Wirtschaftszweige, Ausgabe 1979, Stuttgart
Steinle, w. (1984): Der Beitrag kleiner und mittlerer Unternehmen zur BeschKftigungsentwicklung, in: MittAB, no. 2, pp. 257-266
Troll, L. (1982): Arbeitsplatz BUro. Qualifikation und Arbeitsplatzsituation im Wandel, in: MlttAB, no. 4, pp. 480-496

104
Ulrich, E., Lahner, M., KHstner, K. (1972): Auswirkungen technischer Anderungen auf Arbeitskrlfte. Bericht Uber Methode und erste Ergebnisse einer Erhebung in der kunststoffverarbeitenden lndustrie, in: MittAB, no. 1
Vogler-Ludwig, K. (1983): Auswirkungen des Strukturwandels auf den Arbeitsmarkt, Erglnzungsband zur lfo-Strukturberichterstattung 1983, Ifo-Studien zur Strukturforschung, vol. 1, MUnchen
(forthcoming) ArbeitszeitverkUrzung - BetriebszeitverlMngerung, GfP-Workshop 1985
Weitzel, G. (1986 a): Beschlftigungswirkungen von ExistenzgrUndungen. lfo-Studien zu Handels- und Dienstleistungsfragen, vol. 28, MUnchen
( 1986 b): Bescheidene Beschlftigungswirkungen durch NeugrUndungen. lfo-Schnelldienst, no. 7

105
9. Bibliography
9.1 Employment statistics: definitions, methods, sources
Herberger, L. (1985): Aktualisierung und Genauigkeit der reprUsentativen Statistik der BevtSlkerung und des Erwerbslebens, Allgemeines statistisches Archiv, vol. 69, no. 1
employment statistics (task, method, content), labour force survey, sample surveys
Cramer, u. (1985): Probleme der Genauigkeit der Besch~ftigtenstatistik, Allgemeines statistisches Archiv, vol. 69, no. 1
employment statistics of the social security system
Moertl, H. (1985): Berufsstatistik; Aufgaben, Quellen, DarstellungsmBglichkeiten, Wirtschaft und Statistik, no. 5
occupations (statistical sources, results)
Herberger, L., Mayer, H-L. (1984): Uberblick Uber die derzeitigen Statistiken des Arbeitsmarktes und der Beschlftigung, Wirtschaft und Statistik, no. 2
employment statistics (comprehensive descreption of all relevant statistics)
Herberger, 1., Becker, B. (1983): Sozialversicherungspflichtig Beschlftigte in der Beschlftigtenstatistik und im Mikrozen-· sus, Wirtschaft und Statistik, no. 4
employment statistics of the social security system (comparison with results of the labour force survey)
Institut fUr Arbeitsmarkt- und Berufsforschung der Bundesanstalt fUr Arbeit (Hrsg.) (1983): Arbeitsmarktstatistik. Konzepte und Methoden in der Bundesrepublik Deutschland und ausgewtihlten Industriestaaten; Literaturdokumentation, Profildienst aus der Arbeitsmarkt- und Berufsforschung, no. L 41
bibliography on employment statistics

106
Wermter, w. (1981): Die Besch~ftigtenstatistik der Bundesanstalt fUr Arbeit, Mitteilungen aus der Arbeitsmarkt- und Berufsforschung, vol. 14, no. 4
employment statistics of the social security system (method)
Freiburghaus, D. (1979): The Measurement of Unemployment in the Federal Republic of Germany, Berlin
unemployment (measurement, structure, statistics)
9. 2 Global trends in · labour market developments: descriptions, econometric models, structural change, forecasts, working time
Institut fUr Arbeitsmarkt- und Berufsforschung, (1986): Zur Arbeitsmarktentwicklung bis 2000, BeitrKge zur Arbeitsmarktund Berufsforschung, no. 42-7
forecast of labour market development, balance of labour market 1982-2000, short summary
Engelen-Kefer, u. (1985): Arbeitslosigkeit in der Bundesrepublik Deutschland; Diagnose und Perspektiven, Mitteilungen des Instituts fUr Angewandte Wirtschaftsforschung, vol. 13, no. 1
longterm labour market development, economic growth, working time reduction, unemployment
Reyher, L., Spitznagel, E., Teriet, B., Streck, W.R., VoglerLudwig, K. (1985): ArbeitszeitverkUrzung- Betriebszeitverl~ngerung; zu den Besch~ftigungspotentialen einer Entkoppelung von Arbeits- und Betriebszeiten, Ifo-Schnelldienst, vol. 38, rio. 14
working time reduction, operating time of production facilities, employment effects

107
Kevelaer, K.-H., van Hinrichs, K. (1985): Arbeitszeit und "Wirtschaftswunder"; Rahmenbedingungen des Ubergangs zur 40-Stunden-Woche in der Bundesrepublik Deutschland, Politische Vierteljahresschrift, PVS-Literatur, vol. 26, no. 1
working time reduction (historical development), trade unious, employers, employment effects
Kohler, H., Reyher, L. (1985): Jahresarbeitszeit und Arbeitsvolumen, Mitteilungen aus der Arbeitsmarkt- und Berufsforschung, vol. 18, no. 1
working time per year, hours worked, overtime, part time work
Koller, M., Kridde, H., Masopust, G. (1985): Zur Struktur und Entwicklung regionaler Arbeitsplltze, Mitteilungen aus der Arbeitsmarkt- und Berufsforschung, vol. 18, no. 1
regional labour markets, employment, unemployment, short term forecast
Bach, H.-u., Reyher, L. (1985): Strukturen und Entwicklung der Erwerbst~tigkeit, Frauen auf dem Arbeitsmarkt, Mitteilungen aus der Arbeitsmarkt- und Berufsforschung, vol. 18, no. 1
labour supply, women, balance of labour market
Oppolzer, A. (1985): Flexibilisierung; Kennzeichen der neuen Arbeitspolitik, Afa-Informationen, vol. 35. no. 4
flexibility of working time, working conditions, industrial law
International Labour Office, Geneve, (1985): flexible working time production; Federal Republic of Germany, Social and Labour Bulletin, no. 1
flexibility of working time, shift work, automation of production
Schulte zur Surlage, R. (1985): Qualifikationsstruktur der Arbeitsnachfrage, Frankfurt
occupational structure, qualifications, structural change, labour market segmentation

108
Klauder, w., Schnur, P., Thon, M. (1985): Arbeitsmarktperspektiven der BOer und 90er Jahre; Neue Modellrechnungen fUr Potential und Bedarf an Arbeitskritften, Mitteilungen aus der Arbeitsmarkt- und Berufsforschung, vol. 18, no. 1
longterm forecast of labour market development 1982-2000
Krupp, H.-J. ( 1984): Perspektiven der Beschitftigungsentwicklung, Die Neue Gesellschaft, vol. 31, no. 2
labour market development, working time reduction, technical change, unemployment
Institut fUr Arbeitsmarkt- und Berufsforschung der Bundesanstalt fUr Arbeit (Hrsg.) (1984): Zu den Besch~ftigungswirkungen verschiedener Ruhestandsregelungen; Zusammenfassung wichtiger Ergebnisse einer Unternehmensbefragung, BeitrKge zur Arbeitsmarkt- und Berufsforschung, no. 42.5, NUrnberg
age of retirement, employment effects
Zwiener, R. (1984): Modellsimultionen zur WochenarbeitszeitverkUrzung; Modellmodifikation, SimulationsdurchfUhrung und Modelldokumentation, Deutsches Institut fUr Wirtschaftsforschung, Vierteljahresheft, no. 2
working time reduction, forecast, simulation
Wingen, M., Linder, P. (1984): Auf der Suche nach einer Neustrukturierung der Lebensarbeitszeit; datenorientierte Anmerkungen und unkonventionelle ErwMgungen, Sozialer Fortschritt, vol. 33, no. 5
life time working hours reduction of working time, employ~ ment effects, budgetary implications
Gtsrres, P.A. (1984): Die Umverteilung der Arbeit; BeschKftigungs-, Wachstums- und Wohlfahrtseffekte einer ArbeitszeitverkUrzung, Frankfurt
distribution of working time, social welfare, employment effects of working time reductions, wage elasticities

109
Warnken, J. (1984): Arbeitszeit und sektorale Produktivititsentwicklung, Mitteilungen des Rheinisch-Westfi!lischen Instituts fUr Wirtschaftsforschung, vol. 35, no. 1
working time reduction, employment effects, productivity
Kreutz, H., PreisendHrfer, P. (1984): Flexibilisierung oder VerkUrzung? Die Vermeidung unerwUnschter Folgen der Arbeitszeitpolitik durch Einbezug empirischer Erkenntnisse, Angewandte Sozialforschung, vol. 12, no. 3
working time reduction, flexibility of working time, social integration, leisure time behavior
Schmid, A. (1984): Beschlftigung und Arbeitsmarkt; eine sozioBkonomische EinfUhrung, Frankfurt
employment, labour market theories, labour market policies
Wenger, H. (1984): Segmentation am Arbeitsmarkt und Arbeitslosigkeit, Frankfurt
labour market segmentation
Adams, K.-H., Eckey, H.-F. (1984): Regionale Beschlftigungskrisen in der Bundesrepublik Deutschland; Ursachen und Erscheinungsformen, WSI- Mitteilungen, vol. 37, no. 8
regional employment, unemployment, sectoral structure
Mayer, H.-L. (1983): Umschichtung der ErwerbsbevHlkerung; Bestands- und Llngsschni ttergebnisse des Mikrozensus, Wirtschaft und Statistik, no. 10
occupational mobility, participation rates, sectoral structure of employment, status of employment
Reyher, L., Kohler, H. (1983): Arbeitszeit und Arbeitsvolumen; die empirische Basis der Arbeitszeit-Politik, Beitrilge zur Arbeitsmarkt- und Berufsforschung, no. 75, NUrnberg
working hours per year, hours worked, working time reduction, employment effects

110
Krumper, A. (1983): Gesamtwirtschaftliche Auswirkungen einer VerkUrzung der Arbeitszeit, Ifo-Schnelldienst, vol. 36, no. 30
employment effects of a reduction in working time, global economic effects (growth, costs, productivity), econometric simulation
Engfer, u., Hinrichs, K., Offe, c., Wiesenthal, H. (1983): Arbeitszeitsituation und ArbeitszeitverkUrzung in der Sicht der BeschKftigten; Ergebnisse einer Arbeitnehmerbefragung, Mitteilungen aus der Arbeitsmarkt- und Berufsforschung, vol. 16, no. 2
working time reduction, desired working time
Galler, H.-P., Wagner, G. (1983): .ArbeitszeitverkUrzung und Arbeitsangebot, Wirtschaftsdienst, vol. 63, no. 7
working time reduction, individual reaction, labour supply
Hof, B. (1983): Tempoverlagerungen der Produktions-, Investitionsund der BeschKftigungsentwicklung; Analyse, IW-Trends, no. 3
long term developments in employment, output and investment
GUrtler·~ J., Nerb, G. (1983): Voraussichtliche Reaktionen der Unternehmen auf eine VerkUrzung der tariflichen Wochenarbeitszeit
working time reduction, entrepreneurial reactions
GtSrres, P.A. (1983): VerkUrzung der Arbeitszeit - Wirkungen auf BeschKftigung, Wachstum und Wohlfahrt, MUnchen
working time reduction, employment effects
Institut fUr Arbeitsmarkt- und Berufsforschung der Bundesanstalt fUr Arbeit (Hrsg.) (1983): BeschKftigungsabbau- AusmaB und Struktur; Ein Vergleich der Rezessionsjahre 1974/75 und 1981/82, Beitr!ge zur Arbeitsmarkt- und Berufsforschung, NUrnberg, no. 42.4
reduction of working places, cyclical developments
111
Brinkmann, Ch. ( 1983): Arbeitszeitprl:lferenzen - Ein Hinweis auf neue Reprl:lsentativbefragungen, Mitteilungen aus der Arbeitsmarkt- und Berufsforschung, vol. 16, no. 2
working time preferences, employees
Landenberger, M. (1983): ArbeitzeitwUnsche; Vergleichende Analyse vorliegender Befragungsergebnisse, Berlin
working time preferences, results of sample surveys
Spitznagel, E. (1983): Unternehmensbefragungen zur ArbeitszeitverkUrzung, Beitrl:lge zur Arbeitsmarkt- und Berufsforschung, no. 75
working time reduction, results from business surveys, employment effects
Seifert, H., WelzmUller, R. (1983): ArbeitszeitverkUrzung und Verteilung, WSI-Mitteilungen, vol. 36, no. 4
working time reduction, effects on income distribution, productivity, employment
Bosch, G. (1983): Arbeitszeit und Rationalisierung; Ergebnisse betrieblicher Fallstudien, vol. 36, no. 4
working time reduction, case studies, employment effects
Teriet, B. (1983): Alternative Arbeitszeitmuster und spezielle ArbeitszeitverkUrzungen; Eine bundesrepublikanische Kasuistik, Beitrl:lge zur Arbeitsmarkt- und Berufsforschung, no. 75, ~urnberg ·
working time reduction, models
Vogler-Ludwig, K. (1983): Auswirkungen des Strukturwandels auf den Arbeitsmarkt, ~unchen
labour market development, structural change (industry, occupation), flexibility of wages

112
Rettig, R. (1982): Ein disagregiertes Prognosemodell fUr die Bundesrepublik Deutschland, Rheinisch-Westf~liches Institut fUr Wirtschaftsforschung, Essen
econometric forecast 1960-1995, employment growth
Warnken, J. (1982): Sektorale Tendenzen des Qualifikationseinsatzes in der Bundesrepublik Deutschland seit Beginn der 60er Jahre dargestellt am Beispiel des verarbeitenden Gewerbes und der personenbezogenen Dienstleistungen, Mitteilungen des Rheinisch-Westf~lischen Instituts fUr Wirtschaftsforschung, vol. 33,1
structural change in employment, qualification, industry
Teriet, B. (1982): Arbeitsumverteilung zwischen linearer ArbeitszeitverkUrzung und/oder Arbeitszeitflexibilisierung; Optionen einer Arbeitsum- und -neuverteilung, Gewerkschaftliche Monatshefte, vol. 33, no. 2
working time reduction, redistribution, flexibility of working time
Fotiadis, F. ( 1982): Die Eignung einer VerkUrzung der Wochenarbeitszeit als arbeitsmarktpolitisches Instrument, Mitteilungen des Instituts fUr angewandte Wirtschaftsforschung, vol. 10, no. 2
working time reduction, econometric model, employment effects, productivity effects
Preiser, K. (1982): Arbeitszeit - Berichterstattung und Gesellschaftspolitik, Berlin
working time development, social politics
Ermann, K., Leupoldt, R., Institut fUr Arbeitsmarkt- und Berufsforschung der Bundesanstalt fUr Arbeit (Hrsg.) (1981): Arbeitsmarktstatistische Zahlen in Zeitreihenform. Jahreszahlen fUr die Bundesrepublik Deutschland (Ausgabe 1981), Beitr~ge zur Arbeitsmarkt- und Berufsforschung, no. 03.1, NUrnberg
time series of labour market statistics, employment, unemployment, education

113
Wolfmeyer, P., Warnken, J. ( 1981): Zum Wandel der beruflichen Qualifikationsstruktur in der Bundesrepublik Deutschland seit Anfang der 60er Jahre, Mitteilungen des RheinischWestf!lischen Instituts fUr Wirtschaftsforschung, vol. 32, no. 4
change in qualifications, occuptional mobility
Rettig, R. (1981): Nachfragestruktur und Arbeitskr!ftebedarf, Mitteilungen des Rheinisch-Westf!lischen Instituts fUr Wirtschaftsforschung, vol. 32, 1/2
structure of labour demand
Bundesinstitut fUr Berufsbildungsforschung, Berlin (Hrsg.), Institut fUr Arbeitsmarkt- und Berufsforschung der Bundesanstalt fUr Arbeit, NUrnberg (Hrsg.) (1981): Qualifikation und Berufsverlauf; Erste Ergebnisse einer repr!sentativen Erhebung bei Erwerbspersonen in der Bundesrepublik Deutschland, Berlin
vocational training, occupational structure, mobility
Brinkmann, Ch. (1981): Ver!nderung des Arbeitsvolumenangebots bei Realisierung von ArbeitszeitwUnschen - Befragungsergebnisse und Modellrechnungen, Beitr!ge zur Arbeitsmarkt- und Berufsforschung, no. 56, NUrnberg
desired working time, labour supply, hours worked, sample surveys
Knepel, H. (1981): SozioBkonomische Indikatormodelle zur Arbeitsmarktanalyse, Frankfurt
labour market development, social indicators, econometric model
Teriet, B. (1981): Flexible Arbeitszeit; Alternativen fUr ein aktives Arbeits- und Betriebszeitmanagement
flexibility of working time, job sharing, contractual agreements
114
Enke, H., KHrber-Weik, M., Schweizer, K.-u. (1980): Ein Hkonometrisches Regionalmodell der industriellen BeschMftigungsund Lohnentwicklung in der Bundesrepublik Deutschland, TUbing en
regional labour markets, econometric model, employment, wages
KUhlewind, G. (1980): RUckblick auf Arbeitsmarktprojektionen fUr die siebziger Jahre in der Bundesrepublik Deutschland, Mitteilungen aus der Arbeitsmarkt- und Berufsforschung, vol. 13, no. 3
labour market forecasts, evaluation
JMger, w. (1980): Die Struktur des Arbeitsmarktes in der Bundesrepublik Deutschland. Ein nach Berufsgruppen und Wirtschaftssektoren disaggregiertes Prognosemodell, DUsseldorf
employment structure (occupations, industry), econometric forecast
Bundesministerium fUr Bildung und Wissenschaft, Bonn (Hrsg.) (1980): Stand, Entwicklung und Ergebnisse der Prognoseforschung zum kUnftigen ArbeitskrMfte- und Qualifikationsbedarf. Bericht an den AusschuG fUr Bildung und Wissenschaft des Deutschen Bundestages, Bonn
methods of forecasts, labour demand, labour supply, educational policy
Deutsches Institut fUr Wirtschaftsforschung, Berlin (Hrsg.) (1980): Die Bedeutung des strukturellen Wandels fUr die BeschMftigung. Input-Output-Analysen der BeschMftigungswirkungen von StrukturverMnderungen der Nachfrage 1962 bis 1976, Berlin
structural change, input-output-model, employment effects of structural change in demand
Steger, A. (1980): Haushalte und Familien bis zum Jahr 2000. Eine mikroanalytische Untersuchung fUr die Bundesrepublik Deutschland, Frankfurt
demographic changes (foreast, simultion)

115
9.3 Job content: technical change, mobility, new occupations, qualifications
Seppelfeld, E., Rost-Schaude, E., Klatt, G. (1986): Neue Technologien und Berufsbildung; QualifizierungsmaBnahmen in der Bundesrepublik Deutschland, Frankfurt
new technologies, vocational training, microelectronics
Warnken, J. (1986): Zur Entwicklung der "internen" Anpassungsflfhigkeit der Berufe bis zum Jahre 2000; Projektionen unter den Annahmen der Wachstumsszenarien der Prognos-Studie, Mitteilungen aus der Arbeitsmarkt- und Berufsforschung, vol. 19 , no. 1
flexibility of occupations, forecast 1980-2000
BHgenhold, D. (1985): Die Selbst~ndigen; Zur Soziologie dezentraler Produktion, Frankfurt
self-employment, social situation, occupational mobility
Buck, B. (1985): Berufe und neue Technologien; tiber den Bedeutungsverlust berufsfHrmig organisierter Arbeit und Konsequenzen fUr die Berufsbildung
technical change, vocational training, change in qualifications, main activity
Hartmann, M. ( 1985): Dequalifizierung oder Requalifizierung der Arbeit?; tiber das Theorem der "reellen Subsumtion", Leviathan, vol. 13, no. 2
qualification, polarisation, occupational flexibility taylorism, technical change
Winkler-BUttner, D. (1985): BevHlkerungsrUckgang und ArbeitskrHfteangebot, Wirtschaftsdienst, vol. 65, no. 5
demographic development, labour market supply, occupational mobility, qualifications

116
Seliger, G. (1985): Produktionstechnik, Arbeit und Automatisierung, Diskurs. Bremer Beitr~ge zu Wissenschaft und Gesellschaft, no. 10
production technologies, organisation of labour, qualifications
Rauner, F. (1985): Technik und Bildung, Diskurs. Bremer Beitr~ge zu Wissenschaft und Gesellschaft, no. 10
technical change, qualification requirements, vocational training, educational planning
Meier, B. (1985): BUroarbeit im Wandel; Daten, Trends und Argumente zur Diskussion um die Folgen moderner BUrotechnik, KHln
office work, information technologies, qualification requirements
Dostal, w. (1985): Moderne Informationstechnik und BeschMftigung, Literaturdokumentation zur Arbeitsmarkt- und Berufsforschung
bibliography on information technologies and employment
Sonntag, K. (Hrsg.) (1985): Neue Produktionstechniken und qualifizierte Arbeit; Beitr~ge zur Technik, Arbeitsorganisation, Qualifikation, Personalplanung und -entwicklung in der computerunterstUtzten Fertigung und Konstruktion, KHln
flexible production schemes, qualification requirements, company manpower planning, vocational training
Schlaffke, w. (Hrsg.), Winter, H. (Hrsg.) (1985): Perspektiven betrieblicher Weiterbildung; Leistungen und Aufgaben, KHln
vocational training within establishments, demand for skilled workers
Schmidt, R. (1985): Zu den arbeitspolitischen Chancen und Grenzen neuer Produktionskonzepte; Einige Anmerkungen zum Konzept Horst Kerns und Michael Schumanns einer indus triellen ""Modernisierung als gesellschaftlichem Projekt"", WSI-Mi tteilungen, vol. 38, no. 3
technical change, industrial work, qualification requirements, Kern/Schumann-study

117
Czech, D., Weiss, G. (1985): Technologische Entwicklung und Arbeitsgestaltung im Bankgewerbe, WSI-Mitteilungen, vol. 38, no. 3
financial institutions, technical change, information technologies, qualifications
Sl!Bmuth, R., Vallentin-Pralat, I. (19.85): Frauenbeschiiftigung und neue Technologien; Konsequenzen fUr die Qualifizierung, Frauenforschung, vol. 3, no. 1/2
female employment and new technologies
Lisop, I. (1985): 40 Jahre Berufsausbildung im technischen Wandel; Ihre Zukunft im RUckspiegel betrachtet, Frankfurt
vocational training, technical change, dual system of vocational training
Schmitz, P.-J. (1984): MHglichkeiten und Grenzen der Rationalisierung im BUro; Ein kritischer Uberblick unter besonderer BerUcksichtigung neuer Informationstechnologien, Spardorf
office work, information technologies, qualification requirements
Herrmann, H. (1984): Frauenarbeit und neue Technologien, Beitr~ge zur Gesellschafts- und Bildungspolitik, no. 99
employment, female technical change, information technologies, qualification requirements
Bundesministerium fUr Bildung und Wissenschaft {Hrsg.) ( 1984) :· Stand und Perspektiven de~ beruflichen Weiterbildung in der Bundesrepublik Deutschland; Entwicklung und Einsatz von Humanressourcen als Folge und Voraussetzung von strukturellem und technologischem Wandel, Bad Honnef
advanced training, technical change, human-capital, educational policies
GUnther, J. (Hrsg.) (1984): Quo vadis Industriegesellschaft? Perspektiven zu FUhrungsfragen von Morgen, Heidelberg
industrial society manegement, technical change, qualification requirements

118
Kern, H. (1984): Das Ende der Arbeitsteilung? Rationalisierung in der industriellen Produktion - Bestandsaufnahme, Trendbestimmung, MUnchen
technical change, labour division, qualification requirements, labour market segmentation
Briefs, u. (1984): lnformationstechnologien und Zukunft der Arbeit; Ein politisches Handbuch zu Mikroelektronik und Computertechnik, KHln
Information technology, unemployment, social control, contractual agreements
Re~nhard, M., Scholz, L. (1983): Neue Technologien in der Textverarbeitung; BestimmungsgrUnde und Wirkungen ihres Einsatzes in Einzel- und gesamtwirtschaftlicher Sicht, lfo-Schnelldienst, vol. 36, no. 1/2
text processing, employment effects, occupational mobility
Hofbauer, H. (1983): Berufsverlauf nach AbschluB der betrieblichen Berufsausbildung, Mitteilungen aus der Arbeitsmarkt- und Berufsforschung, vol. 16, no. 3
occupational mobility, vocational training within establishments
Dirrheimer, A., Hartmann, G., Sorge, A. (1983): Qualifikationsspielr»ume bei Anwendung der Mikroelektronik, Mitteilungen aus der Arbeitsmarkt- und Berufsforschung, vol. 16, no. 1
microelectronics, organisation of labour
Mertens, D., Kaiser, M. (1983): Konzepte der Rigiditlt, Flexibilitlt, Limitationalitlt und Identit»t in Forschungen Uber den beruflichen Verbleib, Beitr1lge zur Arbeitsmarkt- und Berufsforschung, no. 77, NUrnberg
occupational flexibility, identity, regidity
Oppenl~nder, K.-H. ( 1983): Auswirkungen des technischen Wandels auf Beschllftigtenzahl und Beschllftigtenstruktur, lfo-Studien, vol. 29, no. 2
technical change, employment effects, occupational structure

119
Sorge, A., Hartmann, G., Warner, M., Nicholas, I. (1983: Polarisierung der Qualifikationsstrukturen in der Zukunft?, Berufsbildung, no. 11
CNC-technology, occupational structure, organisation of labour
Kaiser, M. (1982): Berufliche Flexibilit~t; Konzeption, Befunde, SchluBfolgerungen, Kritik und Forschungsperspektiven, Beitr~ge zur Arbeitsmarkt- und Berufsforschung, no. 70, NUrnberg
occupational flexibility, mobility
Andress, H.-J. (1982): T~tigkeitsfelder und Berufserfahrung- Analyse zeitbezogener Daten mit Hilfe von Sterbetafeln an Hand eines Beispiel aus der Mobilit~tsforschung, Zeitschrift fUr Soziologie, vol. 11, no. 4
occupational mobility, methods
Staudt, E., Schepanski, N. (1982): Innovation, Qualifikation und Organisationsentwicklung; Die Folgen der Mikrocomputertechnik fUr Ausbildung und Personalwirtschaft, Duisburg
microelectronics qualification requirements, organisation of labour, company manpower planning
Dostal, w. (1982): Bildung und BeschUftigung im technischen Wandel; BildungsHkonomische und arbeitsmarktpolitische Rahmenbedingungen des technischen Wandels am Beispiel der elektronischen Datenverarbeitung und der Mikroelektronik, BeitrUge zur Arbeitsmarkt- und Berufsforschung, no. 65, NUrnberg
technical change, education, employment, microelectronics
Herder-Dorneich, p. (Hrsg.) (1982): Arbeitsmarkt und Arbeitsmarktpolitik, Berlin
labour market policy, wage subsidies, regional labour markets, occupations

120
Drexel, 1. (1982): Belegschaftsstrukturen zwischen Verlnderungsdruck und Beharrung; Zur Durchsetzung neuer Ausbildungsberufe gegen bestehende Qualifikations- und Lohnstrukturen, Frankfurt
new occupations for skilled workers, problems of introduction
GKrtner, D., Goldgrlbe, A. (1982): Darstellung von Verfahren zur Auswertung von Berufsanalysen, vol. 11, no. 3
description of job content, methods
Bornschier, v. (1981): Arbeitsteilung, strukturelle Mobilitlt und Klassenbildung. Eine theoretische Perspektive fUr die Mobilitltsforschung, Zeitschrift .fUr Soziologie, vol. 10, no. 2
occupational mobility, division of labour, theoretical aspects
Wolfmeyer, P., Warnken, J. (1981): Zum Wandel der beruflichen Qualifikationsstruktur in der Bundesrepublik Deutschland seit Anfang der 60er Jahre, Mitteilungen des Rheinisch- WestfKlischen Instituts fUr Wirtschaftsforschung, vol. 32, no. 4
occupational structure, formal qualifications, flexibility
Bundesministerium fUr Forschung und Technologie (Hrsg.) ( 1981): Industrieroboter; Bedingungen und soziale Folgen des Einsatzes neuer Technologien in der Automobilproduktion, Frankfurt
robots in the automobile production, qualification requirements, employment effects, social consequences
Rationalisierungs-Kuratorium der Deutschen Wirtschaft, (Hrsg.) (1980), Wirtschaftliche und soziale Auswirkungen des CNCWerkzeugmaschineneinsatzes, Eschborn
CNC-machinery, employment effects, productivity, qualification requirements
Bohl, K., StooB, F., Troll, L. (1980): Berufs- und TKtigkeitsinhalte im Wandel, Beitrlge zur Arbeitsmarkt- und Berufsforschung, no. 12, NUrnberg
job content, main activities

121
Stooa, F. (1980): Tendenzen des Wandels beruflicher Strukturen in den siebziger Jahren. Ein Vergleich zwischen prognostizierter und tats!chlicher Entwicklung, Mitteilungen aus der Arbeitsmarkt- und Berufsforschung, vol. 13, no. 3
change in occupational structure, retrospective
Brandes, H. (1980): Flexibilit!t und Qualifikation, Darmstadt
individual flexibility, qualification
Dirrheimer, A., Hartmann, G., Sorge, A. (1980): Qualitative Ver~nderung der Arbeit durch neue Informationstechnik, Berlin
microelectronics, qualification requirements
Hoffmann, u. (1980): Facharbeiter, Industrielle Arbeit als Beruf, Frankfurt
skilled workers, industrial work, technical change
9.4 Contractual arrangements: flexibility, self-employment, parttime work, temporary work, fixed-term contracts, hidden economy, domestic work
Debus, N. (1982): Leiharbeit - Das Gesch!ft mit der Ware Arbeitskraft; Zur unternehmerischen Strategie der Arbei tskrE!fte~ flexibilisierung und dem Problem gewerkschaftlicher Interessenvertretung, Marburg
temporary work
Schellhaas, H.-M. (1986): Das Arbeitsrecht als Besch!ftigungshemmnis?; Referat fUr die Konferenz "Mehr Arbei t durch weniger Recht?" Am 13. und 14.2.1986 in Berlin, Berlin
industrial law, employment effects

122
Bundesanstalt fUr Arbeit, (Hrsg.) (1986): Arbeitsmarktanalyse 1985 anhand ausgewKhlter Bestands- und Bewegungsdaten, Amtliche Nachrichten der Bundesanstalt fUr Arbeit, val. 34, no. 3
unemployment, regional distribution, distribution by occupation, distribution by branches
Lampert, H. (1986): M6glichkeiten und Grenzen einer flexibilisierung der BeschKftigungsverhKltnisse, Wirtschaftsdienst, val. 66, no. 4
deregulation, wages, working time, collective agreements
Ollmann, R., Niessen, Schwarzarbeit in val. 65, no. 4
H.-J., Ebling, M. (1985): Eigen- und der Bundesrepublik, Wirtschaftsdienst,
hidden economy, domestic work
Seifert, H. (1985): Schwarzarbeit und Teilzeitarbeit; Arbeitsmarktpolitische Voraussetzungen und Folgen der Schwarzarbeit, Zeitschrift fUr Sozialreform, val. 31, no. 3
moonlighting, part-time work, reduction of working time, unemployment
Seifert, H. (1985): Was bringt Deregulierung fUr den Arbeitsmarkt; Das Beispiel des BeschKftigungsfBrderungsgesetzes, WSI-Mitteilungen, val. 38, no. 5
employment promotion act, deregulation, temporary work
Linne, G., Voswinkel, s. (1985): Befristete Arbeitsverh~ltnisse -· verstlrkte Spaltung der Arbeitnehmer, WSI-Mitteilungen, val. 38, no. 5
fixed-term contracts
G~rtner, w. (Hrsg.) Wenig, A. (Hrsg.) (1985): The economics of the shadow economy; proceedings of the international conference on the economics of the shadow economy, held at the university of bielefeld, west germany, october 10-14, 1983, Berlin u.a.
hidden economy, reduction of working time, domestic work

123
Schm!hl, w. (1985): Sozia1e Sicherung und Schattenwirtschaft; Ein ProblemUberblick, Frankfurt/Mannheim
hidden economy, social security
Sch!fer, D., Wittmann, P. (1985): Zur Abgrenzung und Erfassung der Schattenwirtschaft, Wirtschaft und Statistik, no. 8
hidden economy, definition, methods of measurement
BHgenhold, D. (1985): Die Selbstlndigen; Zur Soziologie dezentraler Produktion, Frankfurt
self-employment, social situation, occupational mobility
Kaiser, M. (1985): Alternativ-Hkonomische Beschlftigungsexperimente - quantitative und qualitative Aspekte; Eine Zwischenbilanz, Beitrlge zur Arbeitsmarkt- und Berufsforschung, no. 90.3
alternative sector, unemployment, self-employment
Hegelheimer, A. (1985): Akademikerbesch!ftigung im Wandel; Tendenzen und Perspektiven, Beitrlge zur Arbeitsmarkt- und Berufsforschung, no. 90.3
high-school graduates, employment structure
Hegner, F., Schlegelmilch, c. (1984): Formen und Entwicklungschancen unkonventioneller Beschlftigungsinitiativen; Empirische Bestandsaufnahme und Vorschlag fUr eine Typologie (Teil 1 und 2), Zeitschrift fUr Sozialreform, vol. 30, no. 8 u. 9
unconventional forms of employment, alternative sector
Romahn, H. (1984): Schattenwirtschaft und Besch!ftigung, WSI-Mitteilungen, vol. 37, no. 11
hidden economy, labour market segmentation, self-employment,
RHsner, H.-a.· (1984): Mehr Arbeitsmarkteffizienz durch Tarifflexibilisierung?, Wirtschaftsdienst, vol. 64, no. 12
collective agreements, deregulation

124
Institut fUr Arbeitsmarkt- und Berufsforschung der Bundesanstalt fUr Arbeit (Hrsg.) (1984): Job-Sharing; Aspekte und Konzepte, Bei trlge zur Arbei tsmarkt- und Berufsforschung, no. 42.5
job sharing
Riebel, v. (1984): ArbeitszeitverkUrzung und Schwarzarbeit; Auswirkungen einer VerkUrzung der Wochenarbei tszei t auf das individuelle Arbeitsangebot, Zeitschrift fUr Wirtschaftsund Sozialwissenschaften, vol. 104, no. 5
hidden economy, reduction of working time, labour supply, time budgets
Sch!fer, w. (Hrsg.) (1984): SchattenBkonomie; Theoretische Grundlagen und wirtschaftspolitische Konsequenzen, GHttingen
hidden economy, domestic work, taxation, reduction of working time
Huber, J. (1984): Die zwei Gesichter der Arbeit; Ungenutzte MHglichkeiten der Dualwirtschaft, Frankfurt
dual economy, domestic work, industrial society
Landenberger, M. ( 1984) : Flexible Arbei tszei tformen und soziale Sicherung der BeschKftigten, Berlin
flexible working time schemes, part-time work, social security
BUchtemann, Ch.-F. (1984): Zus!tzliche Besch!ftigung durch befri-· stete ArbeitsvertrKge?, Wirtschaftsdienst, vol. 64, no. 11
fixed-term contracts
Schanz, G. (1984): MBglichkeiten und Grenzen der Partner-Teilzeitarbeit, Das Wirtschaftsstudium, WISU, vol. 13, no. 5
job sharing

125
Wagner, u. (1984): Teilzeitarbeit, Zeitarbeit, Leiharbeit, Literaturdokumentation zur Arbeitsmarkt- und Berufsforschung, NUrnberg
bibliograhy on part-time work and temporary work
Bratka, Ch.-M. (1983): Teilzeitarbeit; Diskussion mHglicher arbeitsmarktpolitischer und sozialer Folgen individueller ArbeitszeitverkUrzung, MUnchen
part-time work
Bundesarbeitgeberverband Chemie (Hrsg.) (1983): Flexible Teilzeitarbeit; M6glichkeiten einer Flexibilisierung der Arbeitszeit, Heidelberg
flexible working time, part-time work
Galler, H.-P., Wagner, G. (1983): ArbeitszeitverkUrzung und Arbeitsangebot, Wirtschaftsdienst, vol. 63, no. 7
reduction of working time, labour supply
Hedtkamp, G. (Hrsg.) (1983): Beitrlge zum Problem der Schattenwirtschaft, Berlin
hidden economy
Hirsch-Kreinsen, H. (1983): Leiharbeit in Maschinenbaubetrieben; Ergebnisse einer Untersuchung in fUnf Maschinenbaubetrieben, WSI-Mitteilungen, vol. 36, no. 8
temporary work, manufacturing of machinery
Wiesenthal, H., Offe, c., Hinrichs, K., Engfer, u. (1983): Arbeitszeitflexibilisierung und gewerkschaftliche Interessenvertretung; Regelungsprobleme und Risiken individualisierter Arbeitszeiten, WSI-Mitteilungen, vol. 36, no. 10
working time flexibility, policy of the trade unions
Benseler, F., Heinze, R.-G., KlHnne, A. (Hrsg.) (1982): Zukunft der Arbeit; Eigenarbeit, AlternativHkonomie?, Hamburg
dual economy, domestic work

126
Hofbauer, H. (1981): Zur Struktur der Teilzeitarbeit bei Frauen, in: Probleme der Messung und Vorausschltzung des Frauenerwerbspotentials, Beitrlge zur Arbeitsmarkt- und Berufsforschung, no. 56
part-time work of women, distribution, conditions
Osterland, M. (1981): Struktur und Arbeitsweise des ArbeitskrKfteverleihs - am Beispiel zweier Bremer Verleihfirmen, Mitteilungsblatt der zentralen wissenschaftlichen Einrichtung "Arbeit und Betrieb", no. 2
temporary work
Fr.iedrich, w., Spitznagel, E. (1981): Verbreitung und Beurteilung einzelner Formen der Teilzeitarbeit und ihre Expansionschancen aus Unternehmenssicht, Mitteilungen aus der Arbeitsmarkt- und Berufsforschung, vol. 14, no. 4
part-time work, entrepreneurial view
Koller, M., Reyher, L., Teriet, B. (1980): Teilzeitarbeit in der Bundesrepublik Deutschland; Eine Bestandsaufnahme, NUrnberg
part-time work
Hofbauer, H. (1980): StatusmobilitKt in den siebziger Jahren, Mitteilungen aus der Arbeitsmarkt- und Berufsforschung, vol. 13, no. 4
status mobility
Vonderach, G. (1980): Die "Neuen SelbstKndigen", 10 Thesen zur Soziologie eines unvermuteten PhKnomens, Mitteilungen aus der Arbeitsmarkt- und Berufsforschung, vol. 13, no. 2
self-employment, alternativ sector, high-school graduates
Kaiser, M., Stooss, F. (1980): Zur Entwicklung der SelbstKndigen unter den Hochschulabsolventen. Ausgewlhlte Befunde aus der amtlichen Statistik und aus neueren Erhebungen bei Erwerbstltigen Fachhochschul- und Hochschulabsolventen, Mitteilungen aus der Arbeitsmarkt- und Berufsforschung, vol. 13, no. 2
self-employment, high school graduates

European Communities - Commission
Programme for research and actions on the development of the labour market New forms and new areas of employment growth Final report for Germany by Kurt Vogler-Ludwig
Document
Luxembourg: Office for Official Publications of the European Communities
1987 - 1 36 pp. - 21 .0 x 29.7 em
EN
ISBN 92-825-7545-4
Catalogue number: CB-49-8 7-494-EN-C
Price (excluding VAT) in Luxembourg:
ECU 11 .60 BFR 500 IRL 9 UKL8.10 USD 13
Venta y suscripciones · Salg og abonnement · Verkauf und Abonnement · nwAI')aeu; KOI auv6pofJEc; Sales and subscriptions · Vente et abonnements · Vendita e abbonamenti
Verkoop en abonnementen · Venda e assinaturas
BELGIOUE/BELGIE
Moniteur belge/Belgisch Staatsblad Rue de Louvaon 40-42/ Leuvensestraat 40-42 1000 Bruxelles/ 1000 Brussel Tel 5120026 CCP I Postrekenmg 000-2005502-2 7
Sous-dep6ts I Agentschappen
Lobra ine europeenne I Europese Boekhandel Rue de Ia Loo 2441Wetstraat 244 1040 Bruxelles11 040 Brussel
CREDOC Rue de Ia Montagne 34/Bergstraat 34 Bte 11 1 Bus 1 1 1 000 Bruxelles/ 1000 Brussel
DANMARK
Schultz EF-publikationer
M0ntergade 1 9 1 116 K0benhavn K Tlf 101) 14 11 95 G~rokonto 200 11 95
BR DEUTSCHLAND
Bundesanzeoger Verlag
Breote StraBe Postfach 1 0 80 06 5000 Koln 1 Tel (0221)2029-0 Fernschreober ANZEIGER BONN 8 882 595 Telecopierer 20 29 278
GREECE
G C Eleftheroudakis SA lnternatoonal Bookstore 4 Nokos Street 1 05 63 Athens Tel 322 22 55 Telex 2 19410 ELEF
Sub-agent for Northern Greece
Molho's Bookstore The Busoness Bookshop 10 Tsomiski Street Thessalonoko Tel 275271 Telex 412885 LIMO
ESPANA
Boletin Oficial del Estado Trafalgar 2 7 E-28010 Madrid Tel. (91) 4466000
Mundi-Prensa Libras, S.A. Castello 37 E-28001 Madrod Tel (91) 4313399(Libros)
431 32 22 (Suscripciones) 435 36 37 (Direcco6n)
Telex 49370-MPLI-E
FRANCE
Service de vente en France des publications des Communautes europeennes
Journal offociel 26. rue Desaox 75 732 Paris Cedex 15 Tel. 11145786139
IRELAND
Government Publications Sales Office Sun Alliance House Molesworth Street Dublin 2 Tel 71 03 09
or by post
Statoonery Offoce St Martm's House Waterloo Road Dublin 4 Tel 68 90 66
IT ALIA
Locosa Spa Voa Lamarmora. 45 Casella postale 552 50 12 1 Forenze Tel 579751 Telex 5 70466 LICOSA I CCP 343 509
Subagento
Libreroa scientofica Lucio de Boasio - AEIOU Voa Meravoglo. 16 20 123 Milano Tel 80 76 79
Libreria Tassi Voa A. Farnese. 28 00 192 Roma Tel 31 05 90
Librena gouridica Voa 12 Ottobre. 1 72/R 16 1 2 1 Genova Tel. 59 56 93
GRAND-DUCHE DE LUXEMBOURG
Office des publications officoelles des Communautes europeennes 2. rue Mercoer L-2985 Luxembourg Tel. 49 92 81 Telex PUBOF LU 1324 b CCP 19190-81 CC bancaore BIL 8-1 09/6003/200
Messageries Paul Kraus 1 1 . rue Chrostophe Planton L-2339 Luxembourg Tel. 48 21 31 Telex 2515 CCP 49242-63
NEDERLAND
Staatsdrukkerij- en uotgeverijbedrijf Christoffel Plantijnstraat Postbus 20014 2500 EA 's-Gravenhage Tel (070) 78 99 11
PORTUGAL
lmprensa Nacoonal
Av Francisco Manuel de Melo P- 1 000 Losboa Tel 65 39 96
Distribuodora Livros Bertrand Lda
Grupo Bertrand. SARL Rua das Terras dos Vales. 4-A Apart 37 P- 2700 Amadora CODEX Tel. 493 90 50 - 494 87 88 Telex 1 5 798 BERDIS
UNITED KINGDOM
HM Stationery Offoce HMSO Publocatoons Centre 51 None Elms Lane London SW8 5DR Tel (01) 211 56 56
Sub-agent
Alan Armstrong & Assocoates Ltd
72 Park Ru<Ou london NWl 4SH Tel (011 723 39 02 Telex 297635 AAAL TO G
SCHWEIZI SUISSE, SVIZZERA
Libraoroe Payot
6. rue Grenus 1211 Geneve Tel 31 89 50 CCP 12 236
UNITED STATES OF AMERICA
European Community lnformatoon Servoce
2100 M Street. NW Suote 707 Washongton. DC 2003 7 Tel (202) 862 9500
CANADA
Renouf Publishing Co .. Ltd
61 Sparks Street Ottawa Ontaroo K 1 P 5R 1 Tel. Toll Free 1 (800) 2674164 Ottawa Regoon (613) 238 8985-6 Telex 053-4936
JAPAN
Kinokunoya Company Ltd 17-7 Shm1uku 3-Chome Shiniuku-ku Tokyo 160-91 Tel. (03) 354 0131
Journal Department
PO Box 55 Chitose Tokyo 1 56 Tel. (03) 439 0124

Price (excluding VAT) in Luxembourg :
ECU 11.60 BFR 500 IRL 9 UKL 8.10 USD 13
ISBN 92-825-7545-4 '* '* .. :R '* '* OFFICE FOR OFFICIAL PUBLICATIONS
'* Of) * OF THE EUROPEAN COMMUNITIES '* * * '* '* L- 2985 Luxembourg 111111111111111111111111
9 789282 575451