Embed Size (px)
Citation preview

i
Obesity and Diabetes, the Built Environment, and the 'Local' Food Economy
Matthew J. Salois Department of Food Economics and Marketing University of Reading PO Box 237 Reading, Berkshire RG6 6AR UK Email: [email protected] Phone: +44-(0)118-378-7702
Selected Paper prepared for presentation at the Agricultural & Applied Economics
Association's 2011 AAEA & NAREA Joint Annual Meeting, Pittsburgh, Pennsylvania, July
24-26, 2011.
Copyright 2011 by Matthew J. Salois. All rights reserved. Reader may make verbatim copies
of this document for non-commercial purposes by any means, provided that this copyright
notice appears on all such copies.

ii
Abstract
Obesity and diabetes are increasingly attributed to environmental factors, however, little attention has been paid to the influence of the ‘local’ food economy. This paper examines the association of measures relating to the built environment and ‘local’ agriculture with U.S. county-level prevalence of obesity and diabetes. Key indicators of the ‘local’ food economy include the density of farmers’ markets and the presence of farms with direct sales. This paper employs a robust regression estimator to account for non-normality of the data and to accommodate outliers. Overall, the built environment is associated with the prevalence of obesity and diabetes and a strong 'local' food economy may play an important role in prevention. Results imply considerable scope for community-level interventions. Keywords: community-intervention, diabetes, food environment, famers’ market, leverage points, ‘local’ food, robust regression, obesity, outliers.

1
1. Introduction
Poor dietary choices are associated with obesity, diabetes, and other chronic diseases
that are leading causes of death such as heart disease, stroke, and cancer (McGinnis and
Nestle 1989). Much of the existing research on risk factors focuses on the role of individual-
level factors and examines how dietary choices and health are affected by demographic and
socioeconomic characteristics such as education, employment, ethnicity, and income (Dowler
2001; Davey Smith and Brunner 1997). While research into individual-level factors is
important, interventions supported by this research have had limited success (Elinder and
Jansson 2008; Egger and Swinburn 1997). More recently, the influence of the built
environment has received considerable attention, particularly in the United States.
The literature highlights the importance of community-level factors as explanations of
dietary choices (Morland et al 2002) and diet-related health outcomes, such as obesity and
diabetes (Morland et al. 2006; Mobley et al. 2006). Evidence suggests the built environment,
and the food environment especially, plays a strong role in influencing obesity (Feng et al.
2010). Food environmental factors shown to be important include the density of restaurants,
including fast-food outlets and full-service venues, as well as the density of retail food stores,
including supermarkets and convenience stores. Reviews of the existing literature suggest
more research on the influence of the built environment on health is needed, particularly
research emphasizing the potential of broad-based community-level interventions (Holsten
2008; Papas et al. 2007). Success of community-level interventions depends on the extent
that the built environment is associated with obesity and diabetes. An association suggests a
role for local and regional governments in addressing important health issues (WHO 2010).
While many features of the built environment have been examined, little attention in
the literature has been given to the possible influence of the ‘local’ food economy. The term
‘local’ means foods that have been sourced locally from farms and usually refers to a distance

2
(e.g. within 50 miles) or a political boundary (e.g., within county borders). The hallmark of
the ‘local’ food economy is the farmers’ market, although Community Supported Agriculture
programs, and other outlets like roadside stands, small and independent grocers, and direct
farm sales are also examples (Adams and Salois 2010). In a recent report from the Centers for
Disease Control (CDC) on recommended strategies to prevent obesity, one suggestion was
that communities should improve ways to bring food from "farm to fork" more directly and
effortlessly, namely through increased density of farmers’ markets (Kettle Kahn et al. 2009).
The key reasoning is that ‘local’ food outlets, like farmers' markets, serve as an important
additional source of healthy food options, especially fresh fruits and vegetables. From a
health perspective, a community that has a strong ‘local’ food economy has a greater
availability of affordable healthy food options, which can promote better dietary decision-
making and health. To date, only a handful of studies examine the presence of ‘local’ foods
on dietary outcomes (Anliker 1992; Balsam 1994; Herman et al 2008), and none directly on
health outcomes. Prior findings support the idea that farmers’ markets improve dietary
choices by enhancing the availability of affordable healthy foods, such as fresh fruits and
vegetables (Larsen and Gilliland 2009). There is a clear need, however, for research into how
‘local’ foods may influence dietary health outcomes, such as obesity and diabetes.
The objective of this study is to examine how the built environment affects the
prevalence of obesity and diabetes in the U.S., paying special attention to the impact of the
‘local’ food economy. Including an extensive set of environmental indicators is essential for
assessing simultaneous effects of different indicators on both obesity and diabetes. Focusing
on particular indicators in isolation, such as fast food restaurants, can yield misleading results
and incorrect policy conclusions. The general built environmental is indicated by measures
relating to geography, physical activity availability, and the food environment. Indicators on
the strength of the ‘local’ food economy include the density of farmers’ markets, presence of

3
farms with direct sales, and the per capita volume of direct farm sales. Robust regression is
used to account for non-normality of the data and to accommodate outliers in the dependent
and independent variables. This paper is organized as follows. Section 2 introduces the
economic model and describes the data. Section 3 describes the estimator strategy and
discusses the main results. The final section reviews the policy implications and concludes.
2. Economic Model and Data
Building on the previous literature, a simple and general empirical model describes
the relationship between a particular health outcome and the built environment,
( ), |H f S B= Ω , where H is specific health outcome (e.g., being obese, or having diabetes),
S is a vector of socioeconomic variables (e.g., race, or income) and B is a vector of
community-level variables representing the built environment and other geographic factors.
The built environment can be described by availability of different types of food outlets (e.g.,
fast-food restaurants, grocery stores, farmers markets) or other environmental features (e.g.,
recreational facilities, natural amenities). The vector Ω represents unobservable health
attributes and taste parameters that affect the health outcome. Many studies tend to focus on
either individual socioeconomic characteristics (i.e., race, age, gender, income, etc.), or
behavioral variables (i.e., physical activity, dietary intake, etc), or particular health conditions
(i.e., medical illnesses, chronic diseases, etc.) as explanatory factors for obesity and diabetes.
Recent evidence, however, suggests the built environment plays a strong role in influencing
obesity (and to a lesser extent diabetes).
The majority of the literature on the built environment and obesity tends to focus on
specific environmental characteristics. For example, Morland et al. (2006) find supermarkets
to be negatively associated with obesity prevalence; Maddock (2004) finds the presence of
fast-food outlets are positively associated with obesity; Giles-Corti et al. (2003) find that
greater access to recreational facilities is associated with lower obesity rates. There is a need,

4
however, for studies that include a more comprehensive set of environmental indicators, since
omitting important variables can result in under- or over-estimated relationships (Black and
Macinko 2008). Rather than focus on one type of environmental attribute, the current paper
includes an extensive set of environmental variables.
Primary county-level data are obtained from the Food Environment Atlas published
by the Economic Research Service (ERS) of the U.S. Department of Agriculture (USDA).
The Atlas provides statistics on three main categories: health, food environment, and
community characteristics. Health variables include the prevalence of adult obesity and
diabetes. The food environment variables describe the different types of food outlets, and
include measures such as the number of grocery stores, supercenters, and convenience stores.
Community characteristics include measures such as race/ethnicity, income, and poverty,
among others. The data in the Atlas are sourced from different government entities for all
3,141 U.S. counties. This study only includes counties in the continental U.S. and omits
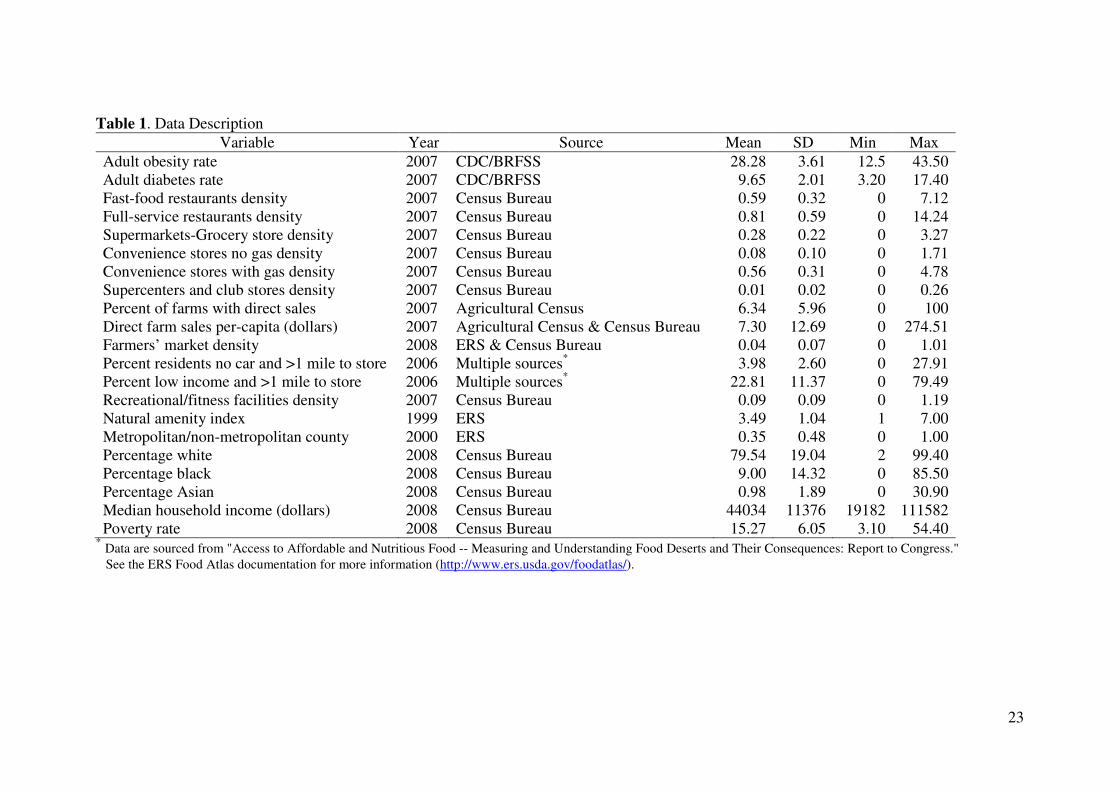
counties with missing information ( n = 3,051). Table 1 lists all the variables used along with
the year, original data source, and descriptive statistics.
Two health outcome measures are investigated: county rates of obesity and diabetes.
The obesity rate is the age-adjusted percentage of adults (age > 20) with body mass index
(BMI) greater than or equal to 30. Body mass index is computed by dividing weight in
kilograms by height in meters squared. The diabetes rate is the age-adjusted percentage of
adults with diabetes, excluding gestational diabetes. The rates of obesity and diabetes are
based on estimates from the CDC, obtained from the Behavioral Risk Factor Surveillance
System (BRFSS). A potential limitation of the BRFSS data is that they are self-reported
measures. Since respondents tend to underestimate body weight and overestimate height the
obesity rate may be underestimated. Additionally, it is possible that obesity and diabetes
share a simultaneous relationship. There is a growing medical and epidemiological literature

5
aimed at investigating the causal nature of the relationship between obesity and diabetes
(Barrett-Connor 1989). Some studies suggest that obesity may cause diabetes, while others
suggest that diabetes may cause obesity (Sakurai et al. 1999; Abdullah et al. 2010). The
evidence is mixed (Hekimsoy and Oktem 2003), however, and the causal nature may very
well run in both directions. Recently, Costa-Font and Gil (2005) examine the association
between obesity and a set of chronic diseases and find a positive association with diabetes,
high cholesterol, hypertension, and heart disease. While the current paper does not examine
the linkage between obesity and diabetes, such a relationship may exist.
Variables describing the food environment can be partitioned into three categories:
eating-out food environment, retail food environment, and the ‘local’ food environment. The
eating-out environment is indicated by the number of full-service and fast-food (or limited-
service) restaurants per 1,000 persons. Full-service restaurants are defined as establishments
that provide food services to customers on the basis of a waiter/waitress service (i.e.,
customers are seated while ordering and being served food and then pay after eating). Fast-
food restaurants are defined as establishments that provide food services to customers on the
basis that food is ordered and paid for before eating.
The retail food environment is indicated by the number of supermarkets and grocery
stores, gas-based convenience stores, no-gas convenience stores, and supercenter/warehouse
club stores per 1,000 persons. Supermarkets and grocery stores are defined as establishments
typically referred to as medium-sized supermarkets and also include small-end grocery stores
that retail food as their primary business function (this includes delicatessen-type outlets).
Gas-based convenience stores are defined as establishments engaged in selling fuel or
gasoline but also sell a selection of limited food items. No-gas convenience stores are defined
as establishments that retail a limited selection of food items but do not sell fuel or gasoline.

6
Supercenters and warehouse clubs are defined as establishments that in addition to retailing
food and groceries, also sell merchandise including clothing, furniture, and electronics.
The ‘local’ food environment is indicated by the percent of farms with direct-sales,
the value of direct farm sales per capita, and the number of farmers’ markets. The percent of
farms with direct sales is defined as the percent of farms in the county that sell directly to
final consumers. The value of direct farm sales per capita is defined as the dollar value of
direct farm sales in the county divided by the population of the county. Both variables are
sourced from the U.S. Agricultural Census. Farmers’ markets are defined as the number in
the county per 1,000 residents. A farmers’ market is defined as an establishment in which at
least two vendors retail food products directly to the consumer through the same venue. In
order to count as a farmers’ market, more than half of total retail sales must be obtained from
the consumer directly. Figures on the density of farmers' markets are sourced from the USDA
Agricultural Marketing Service.
Other variables capture aspects of the built environment relating to food accessibility,
physical activity outlets, and geography. Food accessibility is indicated by the percentage of
housing units in a county that are more than one mile from a supermarket or large grocery
store and have no car, and also by the percentage of the total population in a county that are
low income and live more than one mile from a supermarket or large grocery store.
Availability of physical activity outlets is indicated by the density of recreational & fitness
facilities, measured as the number of fitness and recreation centers in a county divided by the
number of residents. Fitness and recreation centers are defined as facilities primarily engaged
in activities such as exercise or recreational sports activities. The geographic environment is
indicated by a natural amenity index based on topographical variation (e.g., water, mountains,
sunny weather patterns, etc.). The index measures a county’s natural amenities score as a
standard deviation from the all-county average value. An index with a large negative value

7
indicates a county that has a much lower score than the all-county average, while a large
positive value indicates a county with natural amenities higher than the all-county average.
An indicator is also included if the county is a metropolitan (=1) or non-metropolitan county
(=0). Under the 2003 Office of Management and Budget (OMB) classification, nearby
counties are classified as metropolitan if they are economically tied to the central (i.e., metro)
county, as measured by the share of workers commuting on a daily basis. Counties are
classified as non-metropolitan if they are outside the boundaries of metropolitan areas and
have no cities with 50,000 residents or more.
Socioeconomic variables indicate the racial/ethnic composition of the county,
including the percent of county residents that are white, that are black or African-American,
and that are Asian (percent of county residents Hispanic is omitted). Economic well-being is
measured by median household income (in thousands of U.S. dollars). Lastly, the poverty
rate indicates the percent of county residents with household income below the poverty
threshold. A description of all variables can be obtained from www.ers.usda.gov/FoodAtlas/.
Conjecturing the direction of the relationship between the built environment
indicators with obesity and diabetes depends entirely on the particular environmental attribute
in question. For example, fast-food outlets and convenience stores are both thought to be
positively related with obesity and diabetes, since they are generally sources of energy-dense
and high-fat food. The direction is less clear, however, for supermarkets or full-service
restaurants, as the offering of food is more varied (i.e., both healthy and unhealthy food).
Since farmers markets are generally thought to be excellent sources of fresh fruits and
vegetables as well as other healthy foods, the density of farmers markets is hypothesized to
be negatively related with obesity and diabetes. A similar relationship is conjectured for the
percent of farms with direct sales and the total per capita volume of direct farm sales.

8
3. Estimation and Results
Ordinary least squares (OLS) is driven by the assumption of normally distributed
error terms. If the errors are characterized by a fat-tailed non-normal distribution, then OLS
estimates are inefficient. Fat-tailed error distributions can arise when outliers are present.
Two types of outliers may occur, which involves a data point that substantially deviates from
the expected value (Rousseeuw and Leroy 1987). The first type, a vertical outlier, occurs on
the dependent variable. The second type, a leverage point, occurs on the explanatory variable.
Either type is an influential observation and can strongly impact OLS estimates. Very large
errors results in an inflated OLS error variance and causes the standard errors to also be
inflated, which negatively affects efficiency. Removing influential observations is a mistake,
although common, since these observations are often the most important (Dehon et al. 2009).
Robust regression estimators accommodate fat-tailed error distributions and provide
estimates resistant to influential observations (Huber 1973, 1981). Robust estimators operate
by giving less weight to observations further from the expected value. MM-estimators (Yohai
1987) combine high breakdown value estimation and efficient estimation and build upon S-
estimators proposed by Rousseeuw and Yohai (1984). Unlike S-estimators, however, MM-
estimators maintain high efficiency when the residuals are normally distributed and can cope
with data contamination up to 50% of the sample but still achieve 95% asymptotic efficiency
even if the errors follow a normal distribution (Hampel 1971, 1974).
The data are first investigated for normality. Several test statistics substantiate
rejection of normality, which are summarized in table 2. Each test has its own advantages and
disadvantages. For example, the Jarque-Bera test and the Lilliefors test are sensitive to small
samples. The Shapiro-Wilks test and the Anderson-Darling test are considered best, in terms
of power, for detecting departures from normality. Regardless of the test statistic, each rejects
the normality hypothesis (although rejection of normality is stronger in the obesity model).

9
Therefore, OLS is unsuitable and robust regression is more appropriate. The MM-estimator is
applied next to assess the impact of the built environment on the prevalence of obesity and
diabetes. Parameter estimates are given in table 3. The final weights used in the fitting
process of the MM-estimator regression for obesity and diabetes indicate a non-trivial
number of observations are down-weighted in both models.
4.1 ‘Local’ Food Results
Measures describing the ‘local’ food economy are noteworthy. The percentage of
farms in the county that engage in direct sales has a significant and negative association with
the obesity rate. Moreover, as the total per capita dollar volume of direct farm sales increases,
both the rate of obesity and diabetes falls. A $100 increase in per capita direct farm sales is
associated with 0.80% lower obesity rate and a 1.2% lower diabetes rate. Lastly, the density
of farmers’ markets is found to be negatively related to the prevalence of diabetes. An
additional farmers’ market per 1,000 people is associated with a 0.78% lower diabetes rate.
While the coefficient on the density of farmers markets is negative in the obesity equation,
the estimate is not statistically significant.
Overall, while the magnitudes of the estimates are small, results suggest the ‘local’
food economy is negatively associated with obesity and diabetes. Although no previous study
looks at the impact of alternative food systems (such as farmers markets) on health outcomes,
existing research finds improved access to farmers' markets is associated with increased
availability of healthy food at lower costs (Larsen and Gilliland 2009) and increased
consumption of fresh fruits and vegetables among low-income people (Conrey et al. 2003).
Although the results do not specify the causal mechanisms in which a strong ‘local’ food
economy is associated with lower prevalence of obesity and diabetes, one likely mechanism
is the increase in supply of healthy food options. Farmers' markets and direct farm sales
10
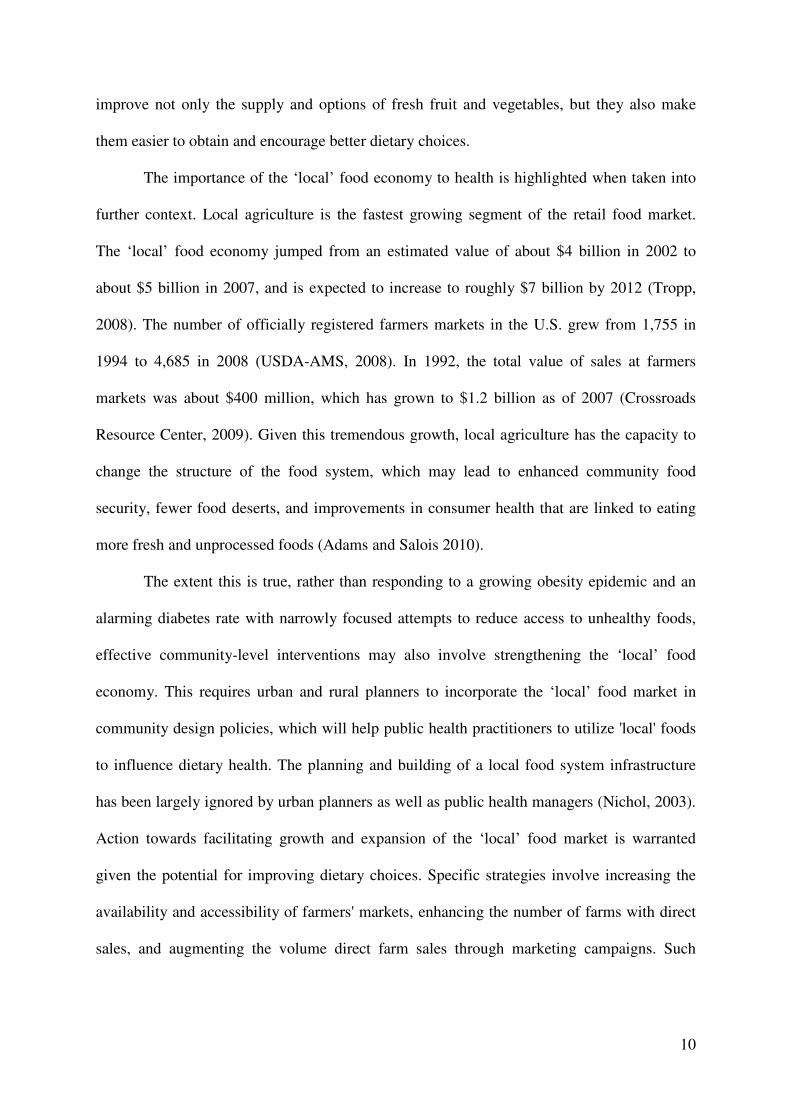
improve not only the supply and options of fresh fruit and vegetables, but they also make
them easier to obtain and encourage better dietary choices.
The importance of the ‘local’ food economy to health is highlighted when taken into
further context. Local agriculture is the fastest growing segment of the retail food market.
The ‘local’ food economy jumped from an estimated value of about $4 billion in 2002 to
about $5 billion in 2007, and is expected to increase to roughly $7 billion by 2012 (Tropp,
2008). The number of officially registered farmers markets in the U.S. grew from 1,755 in
1994 to 4,685 in 2008 (USDA-AMS, 2008). In 1992, the total value of sales at farmers
markets was about $400 million, which has grown to $1.2 billion as of 2007 (Crossroads
Resource Center, 2009). Given this tremendous growth, local agriculture has the capacity to
change the structure of the food system, which may lead to enhanced community food
security, fewer food deserts, and improvements in consumer health that are linked to eating
more fresh and unprocessed foods (Adams and Salois 2010).
The extent this is true, rather than responding to a growing obesity epidemic and an
alarming diabetes rate with narrowly focused attempts to reduce access to unhealthy foods,
effective community-level interventions may also involve strengthening the ‘local’ food
economy. This requires urban and rural planners to incorporate the ‘local’ food market in
community design policies, which will help public health practitioners to utilize 'local' foods
to influence dietary health. The planning and building of a local food system infrastructure
has been largely ignored by urban planners as well as public health managers (Nichol, 2003).
Action towards facilitating growth and expansion of the ‘local’ food market is warranted
given the potential for improving dietary choices. Specific strategies involve increasing the
availability and accessibility of farmers' markets, enhancing the number of farms with direct
sales, and augmenting the volume direct farm sales through marketing campaigns. Such

11
strategies may bring healthy food options not just to the community-at-large, but also to low-
income and high-risk individuals (Black and Macinko 2008).
Caution is warranted in the interpretation of the results, however, given the cross-
sectional nature of the data. The possibility remains that healthier communities support
alternative food systems which encourage a stronger ‘local’ food economy rather than the
other direction. Additionally, there is a potential self-selection problem, as healthier people
may choose to live in environments with better access to healthy and nutritious food.
Particularly within the context of the ‘local’ food environment, observed associations may
reflect underlying preferences that impact location decisions. If the impact of farmers'
markets, for example, is entirely due to selection (i.e., healthy people with lower BMIs
choose to live in counties with a more farmers' markets), then a policy aimed at increasing the
supply of farmers' markets would have little effect on obesity. Therefore, estimated
associations do not imply causality and could represent resident self-selection (Douglas Frank
et al. 2007; Plantinga and Bernell 2007a, 2007b). This limitation is shared by most studies on
the built environment, emphasizing the need for longitudinal-based data sets.
4.2 Other Built Environment Results
Socioeconomic indicators perform as expected and are similar to other studies on
obesity, though fewer comparisons for diabetes are available (Boardman et al. 2005; Lopez
2007; Vandegrift and Yoked 2004). The percentage of the population white or black has a
positive association with both obesity and diabetes, while the percentage Asian has a negative
association (the percent Asian is insignificant for diabetes). Rising median household income
is associated with reduced rates of obesity and diabetes. A negative association between
income and obesity is also a common finding (Lopez 2007; Vandegrift and Yoked 2004).
While most studies in the literature do not decompose impacts of income and poverty, results
imply an increase in the poverty rate is associated with higher obesity but not diabetes.

12
Results indicate that distance and availability play important roles in both obesity and
diabetes, particularly for low-income households. An increase in the percent of low-income
households greater than one mile to a supermarket or grocery store has a positive association
with both obesity and diabetes. Results highlight the problem of so-called food deserts, areas
with limited access to affordable and nutritious food (Black and Mancinko). Limited
accessibility to food outlets can be the result of transportation difficulties, such as not owning
a car or poor access to public transportation, but can also be the result of an inadequate
supply of food outlets selling nutritious food. Many studies find that low-income households
live further away from healthy food outlets and closer to unhealthy places, like fast-food
restaurants (Block et al. 2004; Moore and Diez Roux 2006; Powell et al. 2007). Lack of
access to healthier foods and easier accessibility of processed and unhealthy foods can cause
decreased consumption of fresh fruits and vegetables among the poor (Morland et al. 2002).
Density of recreational and fitness facilities have a negative association with obesity
and diabetes. Studies find the availability of such facilities is associated with greater physical
activity (Brownson 2001; Poortinga 2006) and better health (Mobley et al. 2006). In addition,
natural amenities are found to have a negative association with obesity and diabetes. The
amenity index is a likely proxy for the extent of outdoor recreational activities available and
may reflect the availability of physical activity options for residents. Other studies find that
more open space can lead to lower rates of obesity and diabetes (Ellaway et al. 2005; Giles-
Corti et al. 2005). Lin et al. (2007) find that less amenable climates are associated with
increased overweight and obesity.
While the density of fast-food restaurants has a positive association with diabetes, the
effect on obesity is not significant. Although there is evidence that consumption of fast-food
is associated with obesity and insulin resistance (Jeffrey and French 1998; Pereira et al.
2005), there is conflicting evidence that the actual density of fast-food outlets is positively

13
correlated with obesity (Feng et al. 2010). For example, Maddock (2004) finds a positive
correlation between prevalence of fast-food outlets and obesity using state-level data, a
finding confirmed by Mehta and Chang (2008) and Chou et al. (2004) using individual-level
data. Jeffery et al. (2006), however, find that while eating at fast-food restaurants is positively
associated with obesity, the actual density of fast-food outlets is not. Full-service restaurants
have a significant and negative association with both obesity and diabetes. The density of
full-service restaurants may indicate an eating environment with better food options or may
proxy attitudes of residents with preferences for healthier foods. On the other hand,
restaurants have been the target of local and regional government initiatives aimed at
improving food choices (e.g., the New York City-sponsored National Sodium Reduction
Initiative led by the health department aimed at reducing the amount of salt in restaurant
foods). Such initiatives are common as it is increasingly recognized that more food is eaten
away from home, which tends to be higher in fats and calories than food prepared at home
(Mehta and Chang 2008).
The density of grocery and supermarket stores is not significantly associated with
obesity or diabetes. The insignificant effect obtained here may be the result of combining
supermarkets and small-end grocery stores in the same measure which can have opposing
effects. Morland and Evenson (2009) find that areas with more small grocery stores had
higher obesity rates. While Morland et al. (2006) find a negative association for supermarkets
and a positive association for grocery stores, once the model included socioeconomic
variables the positive effect became insignificant. The insignificant estimate could also be the
result of including such a complete set of environmental measures. For example, Mobley et
al. (2006) find that grocery stores are unrelated to obesity once they include a full set of
indicators in the model.
14
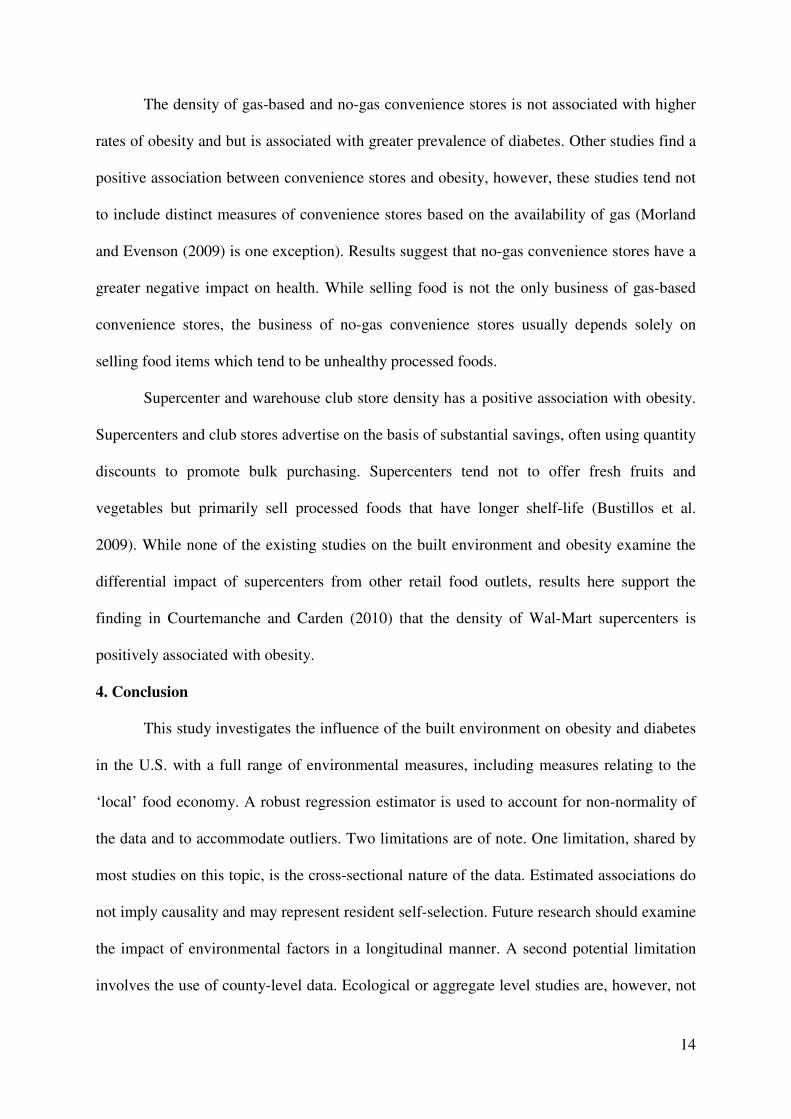
The density of gas-based and no-gas convenience stores is not associated with higher
rates of obesity and but is associated with greater prevalence of diabetes. Other studies find a
positive association between convenience stores and obesity, however, these studies tend not
to include distinct measures of convenience stores based on the availability of gas (Morland
and Evenson (2009) is one exception). Results suggest that no-gas convenience stores have a
greater negative impact on health. While selling food is not the only business of gas-based
convenience stores, the business of no-gas convenience stores usually depends solely on
selling food items which tend to be unhealthy processed foods.
Supercenter and warehouse club store density has a positive association with obesity.
Supercenters and club stores advertise on the basis of substantial savings, often using quantity
discounts to promote bulk purchasing. Supercenters tend not to offer fresh fruits and
vegetables but primarily sell processed foods that have longer shelf-life (Bustillos et al.
2009). While none of the existing studies on the built environment and obesity examine the
differential impact of supercenters from other retail food outlets, results here support the
finding in Courtemanche and Carden (2010) that the density of Wal-Mart supercenters is
positively associated with obesity.
4. Conclusion
This study investigates the influence of the built environment on obesity and diabetes
in the U.S. with a full range of environmental measures, including measures relating to the
‘local’ food economy. A robust regression estimator is used to account for non-normality of
the data and to accommodate outliers. Two limitations are of note. One limitation, shared by
most studies on this topic, is the cross-sectional nature of the data. Estimated associations do
not imply causality and may represent resident self-selection. Future research should examine
the impact of environmental factors in a longitudinal manner. A second potential limitation
involves the use of county-level data. Ecological or aggregate level studies are, however, not

15
uncommon in the built environment literature (Chou et al. 2004; Lopez et al. 2006; Maddock
2004; Mehta and Chang 2008; Pickett et al. 2005; Vandegrift and Yoked 2004), with data at
the county, state, and even country level. More importantly, as pointed out earlier,
interventions recommended by individual-level studies have been largely unsuccessful at
altering dietary behavior. A key problem is that treatment and educational programs designed
to reduce obesity are likely to be ineffective in the absence of a supportive environment. This
problem serves as a call for a wider, broader ecological approach to studying obesity.
Environmental studies that operate at a broader population level may be more appropriate
than individual-level studies when examining risk factors relating to the obesogenic
environment. As discussed by Sallis et al. (1998, p.379): "environmental and policy
interventions based on ecological models of behavior have the potential to influence entire
populations."
Despite these limitations, several benefits emerge from the analysis. First, few studies
include a complete set of environmental factors, focusing instead on certain factors in
isolation, such as fast-food restaurants or grocery stores. Estimated effects of environmental
indicators on health outcomes obtained in isolation can result in under- or over-estimated
relationships (Black and Macinko 2008), emphasizing the importance of comprehensive
studies. Second, the current literature largely ignores the role of the ‘local’ food economy.
Key indicators of the ‘local’ food economy (including the percent of farms with direct-sales,
the value of direct farm sales per capita, and the number of farmers’ markets) are found to be
negatively related to both obesity and diabetes. Third, the literature overlooks how the built
environment impacts diabetes, focusing on obesity only. Results suggest that environmental
features, in addition to socioeconomic characteristics, are key explanatory factors of both
obesity and diabetes.

16
Although the findings in this paper do not assess causality, policy implications surface
nonetheless which emphasize involvement of local and regional authorities. First, while few
studies include a measure of both poverty and income, the positive association found here
confirms the conclusion in Drewnowkski (2004) that obesity follows a socioeconomic
gradient, with higher rates found among the poor. This suggests that although community-
level interventions should aim to benefit all members, special attention should be given to the
poor, who are at greater risk. Second, not only do results on the access measures emphasize
that community-level interventions should target low-income households, but also that
effective interventions may involve improving accessibility of healthy food. Better access can
be achieved by improving the density of food outlets through targeted urbanization and
zoning policies that minimize the existence of food deserts. Alternatively, enhanced access
can be achieved through transportation strategies, which may include better public transit
programs with access to food retailers, enhanced food delivery services by supermarkets, or
even pick-up and drop-off services for customers offered by the stores themselves (Mikkelsen
and Chehimi 2007). Third, since environmental amenities and physical activity outlets are
negatively associated with obesity, community-level interventions could include efforts to
expand the availability of community services that promote physical activity. Such options
may involve the creation of more parks and open space or recreational centers. Actions
towards this end should be mindful of the ability of low-income households to pay to use
such facilities as well as the need to fund such projects from public taxes.
Lastly, this paper suggests another aspect of the built environment related to obesity
and diabetes: the ‘local’ food economy. Specifically, results find a negative association
between ‘local’ food indicators and county prevalence rates of obesity and diabetes. Research
suggests that ‘local’ food outlets encourage better dietary choices and healthier eating. To
the extent this is true, efforts to curb obesity and diabetes could involve interventions based

17
on community-wide programs to develop a strong ‘local’ food economy through creation of
farmers' markets and enhanced direct farm sales. Since very few studies investigate ‘local’
food indicators on health outcomes additional research is needed. In particular, future
research needs to develop theoretical and empirical models that explain why this relationship
exists, specifically attempting to uncover the causal mechanisms.

18
References
Abdullah A, Stoelwinder J, Shortreed S, et al. 2010. The duration of obesity and the risk of type 2 diabetes. Public Health Nutrition 14(1): 119-126.
Adams DC, Salois MJ. 2010. Local versus organic: a turn in consumer preferences and willingness-to-pay. Renewable Agriculture and Food Systems 25(4): 331-341.
Anliker JA, Winnie M, Drake LT. 1992. An evaluation of the Connecticut Farmers' Market coupon program. Journal of Nutrition Education 24: 185-191.
Balsam A, Webber D, Oehlke B. 1994. The Farmers' Market Coupon Program for low-income elders. Journal of Nutrition for the Elderly 13: 35-42.
Barrett-Connor, E. 1989. Epidemiology, obesity, and non-insulin-dependent diabetes mellitus. Epidemiologic Reviews 11(1):172-181.
Black JL, Macinko J. 2008. Neighborhoods and obesity. Nutrition Reviews 66(1): 2-20.
Block JP, Scribner RA, DeSalvo KB, 2004. Fast food, race/ethnicity, and income: a geographic analysis. American Journal of Preventive Medicine 27(3): 211-7.
Boardman JD, Saint Onge JM, Rogers RG, Denny JT. 2005. Race differentials in obesity: the impact of place. Journal of Health and Social Behavior 46(3): 229-43.
Brownson RC, Baker EA, Housemann RA, Brennan LK, Bacak, SJ 2001. Environmental and policy determinants of physical activity in the United States. American Journal of Public
Health 91(12): 1995-2003.
Bustillos B, Sharkey JR, Anding J, McIntosh A.2009. Availability of more healthful food alternatives in traditional, convenience, and nontraditional types of food stores in two rural Texas counties. Journal of the American Dietetic Association 109(5): 883-9.
Chen S, Florax RJGM, Snyder S, Miller CC. 2010. Obesity and access to chain stores. Economic Geography 86(4): 431-452.
Chou S, Grossman M, Saffer H. 2004. An economic analysis of adult obesity: results from the Behavioral Risk Factor Surveillance System. Journal of Health Economics 23(3): 565-87.
Conrey EJ, O'Loughlin J, Masson P, et al. 2003. Integrated program enhancements increased utilization of farmers' market nutrition program. Journal of Nutrition 133(6): 1841-1844.
Costa-Font J, Gil J. 2005. Obesity and the incidence of chronic diseases in Spain: a seemingly unrelated probit approach. Economics and Human Biology 3(2): 188-214.
Courtemanche C, Carden A. 2010. Supersizing supercenters? The impact of Wal-Mart supercenters on body mass index and obesity. Journal of Urban Economics, In Press.
Crossroads Resource Center. 2009. Direct farm sales rising dramatically, new Agriculture Census data show. Press Release, 2 February. Available at http://www.crcworks.org/.

19
Davey Smith G, Brunner E. 1997. Socio-economic differentials in health: the role of nutrition. Proceedings of the Nutrition Society 56(1A): 75-90.
Dehon C, Gassner M, and Verardi V. 2009. Beware of 'good' outliers and overoptimistic conclusions. Oxford Bulletin of Economics and Statistics 71(3): 437-452.
Douglas Frank L, Saelens BE, Powell KE, Chapman JE. 2007. Stepping towards causation: do built environments or neighborhood and travel preferences explain physical activity, driving, and obesity? Social Science and Medicine 65(9): 1898-1914.
Dowler E. 2001. Inequalities in diet and physical activity in Europe. Public Health Nutrition 4(2b): 701-709.
Drewnowski A. 2007. The real contribution of added sugars and fats to obesity. Epidemiologic Reviews 29(19): 160-71.
Egger G, Swinburn B. 2010. An "Ecological" Approach to the Obesity Pandemic. British
Medical Journal 315(7106): 477-480.
Elinder LS, Jansson M. 2009. Obesogenic environments--aspects on measurement and indicators. Public Health Nutrition 12(3): 307-15.
Ellaway A, Macintyre S, Bonnefoy X. 2005. Graffiti, greenery, and obesity in adults: secondary analysis of European cross sectional survey. British Medical Journal 331(7517): 606.
Feng J, Glass TA, Curriero FC, Stewart WF, Schwartz BS. 2010. The built environment and obesity: a systematic review of the epidemiologic evidence. Health and Place 16(2): 175-90.
Giles-Corti, B., Macintyre, S., Clarkson, J. P., Pikora, T., Donovan, R. J. 2003. Environmental and lifestyle factors associated with overweight and obesity in Perth, Australia. American Journal of Health Promotion, 18(1): 93-102.
Giles-Corti B, Broomhall MH, Knuiman M, Collins C Douglas K, Ng K, et al. 2005. Increasing walking: how important is distance to, attractiveness, and size of public open space? American Journal of Preventive Medicine 28(2 Suppl 2): 169-76.
Hampel FR. 1971. A general qualitative definition of robustness. Annals of Mathematical
Statistics 41(6): 1887-1896.
Hampel FR. 1974.The influence curve and it role in robust estimation. Journal of the
American Statistical Association 69(346): 383-393.
Hekimsoy Z, Oktem IK. 2003. Duration of obesity is not a risk factor for type 2 diabetes mellitus, arterial hypertension and hyperlipidemia. Diabetes, Obesity and Metabolism 5(6): 432-437.
Herman DR, Harrison GG, Afifi AA, Jenks E. 2008. Effect of a targeted subsidy on intake of fruits and vegetables among low-income women in the Special Supplemental Nutrition

20
Program for Women, Infants, and Children. American Journal of Public Health 98(1): 98-105.
Holsten JE. 2009. Obesity and the community food environment: a systematic review. Public
Health Nutrition 12(3): 397-405.
Huber PJ. 1973. Robust regression: asymptotics, conjectures, and Monte Carlo. Annals of
Statistics 1(5): 799-821. Huber PJ. 1981. Robust Statistics. John Wiley & Sons: New York, NY.
Jeffery RW, Baxter J, McGuire M, Linde J. 2006. Are fast food restaurants an environmental risk factor for obesity? International Journal of Behavioral Nutrition and Physical Activity 3(2).
Kettle Kahn L, Sobush K, Keener D, Goodman K, Lowry A, Kekietek J, Zaro S. 2009. Recommended community strategies and measurements to prevent obesity in the United States. MMWR 58(RR-7): 1-26.
Larsen K, Gilliland J. 2009. A farmers' market in a food desert: Evaluating impacts on the price and availability of healthy food. Health and Place 15(4): 1158-62.
Lin G, Spann S, Hyman D, Pavlik V. 2007. Climate amenity and BMI. Obesity 15(8): 2120-2127.
Lopez RP. 2007. Risk Factors and Chronic Disease Neighborhood Risk Factors for Obesity. Obesity 15(5): 2111-2119.
Maddock J. 2004. The relationship between obesity and the prevalence of fast-food restaurants: state-level analysis. American Journal of Health Promotion 19(2): 137-143.
McGinnis JM, Nestle M. 1989. The Surgeon General's report on nutrition and health: policy implications and implementation strategies. American Journal of Clinical Nutrition 49(1): 23-28.
Mehta NK, Chang VW. 2008. Weight status and restaurant availability a multilevel analysis. American Journal of Preventive Medicine 34(2): 127-33.
Mikkelsen L., Chehimi S. 2007. The Links Between the Neighborhood Food Environment
and Childhood Nutrition. Prevention Institute: Oakland, CA.
Mobley LR, Root ED, Finkelstein EA, Khavjou O, Farris RP, Will JC. 2006. Environment, obesity, and cardiovascular disease risk in low-income women. American Journal of
Preventive Medicine 30(4): 327-332.
Moore LV, Diez Roux AV. 2006. Associations of neighborhood characteristics with the location and type of food stores. American Journal of Public Health 96(2): 325-31.

21
Morland K, Diez Roux AV, Wing S. 2006. Supermarkets, other food stores, and obesity: the atherosclerosis risk in communities study. American Journal of Preventive Medicine, 30(4): 333-9.
Morland K, Wing S, Diez Roux A. 2002. The contextual effect of the local food environment on residents' diets: the atherosclerosis risk in communities study. American Journal of Public
Health 92(11): 1761-7.
Morland KB, Evenson KR, 2009. Obesity prevalence and the local food environment. Health
and Place 15(2): 491-5.
Nichol L. 2003. Local food production: some implications for planning. Planning Theory and
Practice 4(4): 409-427.
Papas, MA, Alberg AJ, Ewing R, Helzlsouer KJ, Gary TL, Klassen AC. 2007. The built environment and obesity. Epidemiologic Reviews 29(27): 129-43. Pereira MA, Kartashov AI, Ebbeling CB, Van Horn L, Slattery ML, Jacobs DR, Ludwig DS. 2005. Fast-food habits, weight gain, and insulin resistance (the CARDIA study): 15-year prospective analysis. Lancet 365(9453): 36-42. Pickett KE, et al., 2005. Wider income gaps, wider waistbands? An ecological study of obesity and income inequality. Journal of Epidemiology and Community Health 59(8): 670-4. Plantinga AJ, Bernell S. 2007a. The association between urban sprawl and obesity: Is it a two-way street? Journal of Regional Science 47(5): 857-79 Plantinga AJ, Bernell S. 2007b. Can urban planning reduce obesity? The role of self-selection in explaining the link between weight and urban sprawl. Review of Agricultural Economics 29(3): 57-63
Poortinga W. 2006. Perceptions of the environment, physical activity, and obesity. Social
Science and Medicine 63(11): 2835-46.
Powell LM, Slater S, Mirtcheva D, Bao Y, Chaloupka FJ. 2007. Food store availability and neighborhood characteristics in the United States. Preventive Medicine 44(3): 189-95.
Rousseeuw PJ, Yohai VJ. 1984. Robust regression by means of S-estimators. In Robust and
Nonlinear Time Series (Franke J, Härdle W, and Martin D). Lecture Notes in Statistics 26: 256-272. Rousseeuw PJ, Leroy MA. 1987. Robust Regression and Outlier Detection. John Wiley & Sons: New York, NY. Sakurai Y, Teruya K, Shimada N, et al. 1999. Association between duration of obesity and risk of non-insulin dependent diabetes mellitus. American Journal of Epidemiology 149(3): 256-260. Sallis JF, Bauman A, Pratt M. 1998. Environmental and policy interventions to promote physical activity. American Journal of Preventive Medicine 15(4): 379-97.

22
Tropp D. 2008. The growing role of local food markets: Discussion. American Journal of
Agricultural Economics 90(5): 1310-1311.
USDA-AMS. 2008. Number of Farmers Markets Continues to Rise in U.S. Available at http:\\www.ams.usda.gov/.
Vandegrift D, Yoked T. 2004. Obesity rates, income, and suburban sprawl: an analysis of US states. Health and Place 10(3): 221-9.
WHO. 2010. Hidden cities: unmasking and overcoming health inequities in urban settings. The WHO Centre for Health Development, Kobe, and United Nations Human Settlements Programme (UN-HABITAT)."
Yohai VJ. 1987. High breakdown-point and high efficiency robust estimates for regression. Annals of Statistics 15(2): 642-656.
23
Table 1. Data Description
Variable Year Source Mean SD Min Max
Adult obesity rate 2007 CDC/BRFSS 28.28 3.61 12.5 43.50 Adult diabetes rate 2007 CDC/BRFSS 9.65 2.01 3.20 17.40 Fast-food restaurants density 2007 Census Bureau 0.59 0.32 0 7.12 Full-service restaurants density 2007 Census Bureau 0.81 0.59 0 14.24 Supermarkets-Grocery store density 2007 Census Bureau 0.28 0.22 0 3.27 Convenience stores no gas density 2007 Census Bureau 0.08 0.10 0 1.71 Convenience stores with gas density 2007 Census Bureau 0.56 0.31 0 4.78 Supercenters and club stores density 2007 Census Bureau 0.01 0.02 0 0.26 Percent of farms with direct sales 2007 Agricultural Census 6.34 5.96 0 100 Direct farm sales per-capita (dollars) 2007 Agricultural Census & Census Bureau 7.30 12.69 0 274.51 Farmers’ market density 2008 ERS & Census Bureau 0.04 0.07 0 1.01 Percent residents no car and >1 mile to store 2006 Multiple sources* 3.98 2.60 0 27.91 Percent low income and >1 mile to store 2006 Multiple sources* 22.81 11.37 0 79.49 Recreational/fitness facilities density 2007 Census Bureau 0.09 0.09 0 1.19 Natural amenity index 1999 ERS 3.49 1.04 1 7.00 Metropolitan/non-metropolitan county 2000 ERS 0.35 0.48 0 1.00 Percentage white 2008 Census Bureau 79.54 19.04 2 99.40 Percentage black 2008 Census Bureau 9.00 14.32 0 85.50 Percentage Asian 2008 Census Bureau 0.98 1.89 0 30.90 Median household income (dollars) 2008 Census Bureau 44034 11376 19182 111582 Poverty rate 2008 Census Bureau 15.27 6.05 3.10 54.40
* Data are sourced from "Access to Affordable and Nutritious Food -- Measuring and Understanding Food Deserts and Their Consequences: Report to Congress."
See the ERS Food Atlas documentation for more information (http://www.ers.usda.gov/foodatlas/).

24
Table 2. Normality test statistics (p-value in parentheses)
Test name Critical value1 Obesity model Diabetes model
Anderson-Darling 0.751 9.135 1.953
Cramer-von Mises 0.220 1.281 0.322
Lilliefors 0.016 0.042 0.021
Jarque-Bera 5.99 364.002 22.565
Shapiro-Wilks2 1.00 0.983 0.998 1 The critical value is based on a 5% significance level. 2 Rejection occurs if the test statistic is less than the critical value.

25
Table 3. Robust regression estimates (t-statistics in parentheses)
Variable Obesity Diabetes
Intercept 30.201*** 9.474*** (34.476) (17.518)
Percentage white 0.024*** 0.017***
(5.379) (5.991)
Percentage black 0.094*** 0.065***
(16.496) (21.280)
Percentage Asian -0.194*** -0.020
(-6.014) (-0.875)
Median household income (thousands of dollars) -0.390*** -0.488***
(-4.092) (-8.951)
Poverty rate 0.060*** -0.012
(3.199) (-1.009)
Percent of households no car and >1 mile to store 0.016 0.099***
(0.482) (3.825)
Percent low income and >1 mile to store 0.027*** 0.027***
(3.204) (4.537)
Recreational and fitness facilities density -3.180*** -0.644*
(-5.139) (-1.852)
ERS natural amenity index -0.765*** -0.051*
(-12.791) (-1.703)
Fast-food restaurants density -0.286 0.321***
(-1.413) (2.655)
Full-service restaurants density -1.272*** -0.606***
(-9.792) (-8.659)
Supermarkets-Grocery store density -0.251 -0.002
(-1.114) (-0.017)
Convenience stores no gas density 0.001 1.993***
(0.003) (6.233)
Convenience stores with gas density 0.210 0.199*
(1.176) (1.893)
Supercenters and club stores density 8.737*** 1.690
(3.244) (1.343)
Percent of farms with direct sales -0.032*** -0.007
(-4.230) (-1.420)
Direct farm sales per capita (dollars) -0.011*** -0.013***
(-2.968) (-5.348)
Farmers’ market density -0.203 -0.925**
(-0.339) (-2.464) *** indicates two-tailed significance at the 0.99 level, ** at 0.95 level, * at 0.90 level.


![Obesity and diabetes [autosaved]](https://img.dokumen.tips/doc/110x75/5a669cdb7f8b9a0c768b4a7b/obesity-and-diabetes-autosaved.jpg)


