Embed Size (px)
Citation preview

LEARNING OUTCOMES
INVESTMENT DECISIONS
State the objectives of capital investment decisions.
Discuss the importance and purpose of Capital budgeting for a business entity.
Calculate cash flows in capital budgeting decisions and try to explain the basic principles for measuring the same.
Discuss the various investment evaluation techniques like Pay-back, Net Present Value (NPV), Profitability Index (PI), Internal Rate of Return (IRR), Modified Internal Rate of Return (MIRR) and Accounting Rate of Return (ARR).
Apply the concepts of the various investment evaluation techniques for capital investment decision making.
Discuss the advantages and disadvantages of the above-mentioned techniques.
CHAPTER 7
© The Institute of Chartered Accountants of India

7.2 FINANCIAL MANAGEMENT
7.1 INTRODUCTION In the first chapter we have discussed the three important functions of financial management which were Investment Decisions, Financing Decisions and Dividend Decisions. So far we have studied Financing decisions in previous chapters. In this chapter we will discuss the second important decision area of financial management which is Investment Decision. Investment decision is concerned with optimum utilization of fund to maximize the wealth of the organization and in turn the wealth of its shareholders. Investment decision is very crucial for an organization to fulfill its objectives; in fact, it generates revenue and ensures long term existence of the organization. Even the entities which exist not for profit are also required to make investment decision though not to earn profit but to fulfill its mission.
As we have seen in the financing decision chapters that each rupee of capital raised by an entity bears some cost, commonly known as cost of capital. It is necessary that each rupee raised is to be invested in a very prudent manner. It requires a proper planning for capital, and it is done through a proper budgeting. A proper
7
© The Institute of Chartered Accountants of India

7.3
INVESTMENT DECISIONS
budgeting requires all the characteristics of budget. Due to this feature, investment decisions are very popularly known as Capital Budgeting, which means applying the principles of budgeting for capital investment.
In simple terms, Capital Budgeting involves: -
Identification of investment projects that are strategic to business’ overall objectives;
Estimating and evaluating post-tax incremental cash flows for each of the investment proposals; and
Selection of an investment proposal that maximizes the return to the investors.
7.2 PURPOSE OF CAPITAL BUDGTETING The capital budgeting decisions are important, crucial and critical business decisions due to following reasons:
(i) Substantial expenditure: Investment decisions are related with fulfillment of long term objectives and existence of an organization. To invest in a project or projects, a substantial capital investment is required. Based on size of capital and timing of cash flows, sources of finance are selected. Due to huge capital investments and associated costs, it is therefore necessary for an entity to make such decisions after a thorough study and planning.
(ii) Long time period: The capital budgeting decision has its effect over a long period of time. These decisions not only affect the future benefits and costs of the firm but also influence the rate and direction of growth of the firm.
(iii) Irreversibility: Most of the investment decisions are irreversible. Once the decision implemented it is very difficult and reasonably and economically not possible to reverse the decision. The reason may be upfront payment of amount, contractual obligations, technological impossibilities etc.
(iv) Complex decisions: The capital investment decision involves an assessment of future events, which in fact is difficult to predict. Further it is quite difficult to estimate in quantitative terms all the benefits or the costs relating to a particular investment decision.
© The Institute of Chartered Accountants of India

7.4 FINANCIAL MANAGEMENT
7.3 CAPITAL BUDGETING PROCESS The extent to which the capital budgeting process needs to be formalised and systematic procedures established depends on the size of the organisation; number of projects to be considered; direct financial benefit of each project considered by itself; the composition of the firm's existing assets and management's desire to change that composition; timing of expenditures associated with the projects that are finally accepted.
(i) Planning: The capital budgeting process begins with the identification of potential investment opportunities. The opportunity then enters the planning phase when the potential effect on the firm's fortunes is assessed and the ability of the management of the firm to exploit the opportunity is determined. Opportunities having little merit are rejected and promising opportunities are advanced in the form of a proposal to enter the evaluation phase.
(ii) Evaluation: This phase involves the determination of proposal and its investments, inflows and outflows. Investment appraisal techniques, ranging from the simple payback method and accounting rate of return to the more sophisticated discounted cash flow techniques, are used to appraise the proposals. The technique selected should be the one that enables the manager to make the best decision in the light of prevailing circumstances.
(iii) Selection: Considering the returns and risks associated with the individual projects as well as the cost of capital to the organisation, the organisation will choose among projects so as to maximise shareholders’ wealth.
(iv) Implementation: When the final selection has been made, the firm must acquire the necessary funds, purchase the assets, and begin the implementation of the project.
(v) Control: The progress of the project is monitored with the aid of feedback reports. These reports will include capital expenditure progress reports, performance reports comparing actual performance against plans set and post completion audits.
(vi) Review: When a project terminates, or even before, the organisation should review the entire project to explain its success or failure. This phase may have implication for firms planning and evaluation procedures. Further, the review may produce ideas for new proposals to be undertaken in the future.
© The Institute of Chartered Accountants of India

7.5
INVESTMENT DECISIONS
7.4 TYPES OF CAPITAL INVESTMENT DECISIONS There are many ways to classify the capital budgeting decision. Generally capital investment decisions are classified in two ways. One way is to classify them on the basis of firm’s existence. Another way is to classify them on the basis of decision situation.
7.4.1 On the basis of firm’s existence The capital budgeting decisions are taken by both newly incorporated firms as well as by existing firms. The new firms may require taking decision in respect of selection of a plant to be installed. The existing firm may require taking decisions to meet the requirement of new environment or to face the challenges of competition. These decisions may be classified as follows:
(i) Replacement and Modernisation decisions: The replacement and modernisation decisions aim at to improve operating efficiency and to reduce cost. Generally, all types of plant and machinery require replacement either because of the economic life of the plant or machinery is over or because it has become technologically outdated. The former decision is known as replacement decisions and latter is known as modernisation decisions. Both replacement and modernisation decisions are called cost reduction decisions.
Type
s of C
apita
l Inv
estm
ent
Dec
ision
s
On the basis of firm’s existence
Replacement and Modernisation decisions
Expansion decisions
Diversification decisions
On the basis of decision situation
Mutualy exclusive decisions
Accept-Reject decisions
Contingent decisions
© The Institute of Chartered Accountants of India

7.6 FINANCIAL MANAGEMENT
(ii) Expansion decisions: Existing successful firms may experience growth in demand of their product line. If such firms experience shortage or delay in the delivery of their products due to inadequate production facilities, they may consider proposal to add capacity to existing product line.
(iii) Diversification decisions: These decisions require evaluation of proposals to diversify into new product lines, new markets etc. for reducing the risk of failure by dealing in different products or by operating in several markets.
Both expansion and diversification decisions are called revenue expansion decisions.
7.4.2 On the basis of decision situation The capital budgeting decisions on the basis of decision situation are classified as follows:
(i) Mutually exclusive decisions: The decisions are said to be mutually exclusive if two or more alternative proposals are such that the acceptance of one proposal will exclude the acceptance of the other alternative proposals. For instance, a firm may be considering proposal to install a semi-automatic or highly automatic machine. If the firm installs a semi-automatic machine it excludes the acceptance of proposal to install highly automatic machine.
(ii) Accept-reject decisions: The accept-reject decisions occur when proposals are independent and do not compete with each other. The firm may accept or reject a proposal on the basis of a minimum return on the required investment. All those proposals which give a higher return than certain desired rate of return are accepted and the rest are rejected.
(iii) Contingent decisions: The contingent decisions are dependable proposals. The investment in one proposal requires investment in one or more other proposals. For example, if a company accepts a proposal to set up a factory in remote area it may have to invest in infrastructure also e.g. building of roads, houses for employees etc.
7.4.3 Steps of Capital Budgeting Procedure 1. Estimation of Cash flows over the entire life for each of the projects under
consideration.
2. Evaluate each of the alternative using different decision criteria.
© The Institute of Chartered Accountants of India

7.7
INVESTMENT DECISIONS
3. Determining the minimum required rate of return (i.e. WACC) to be used as Discount rate.
Accordingly, this chapter is divided into two sections
1. Estimation of Cash Flows
2. Capital Budgeting Techniques
SECTION 1
7.5 ESTIMATION OF PROJECT CASH FLOWS Capital Budgeting analysis considers only incremental cash flows from an investment likely to result due to acceptance of any project. Therefore, one of the most important tasks in capital budgeting is estimating future cash flows for a project. Though one of the techniques Accounting Rate of Return (ARR) evaluates profitability of a project on the basis of accounting profit but accounting profit has its limitations. Timing of cash flow may not match with the period of profit. Further, non-cash item like depreciation has no immediate cash outflow.
The cash flows are estimated on the basis of input provided by various departments.
The project cash flow stream consists of cash outflows and cash inflows. The costs are denoted as cash outflows whereas the benefits are denoted as cash inflows.
An investment decision implies the choice of an objective, an appraisal technique and the project’s life. The objective and technique must be related to definite period of time. The life of the project may be determined by taking into consideration the following factors:
(i) Technological obsolescence;
(ii) Physical deterioration; and
(iii) A decline in demand for the output of the project.
No matter how good a company's maintenance policy, its technological or demand forecasting abilities are, uncertainty always be there.
Calculating Cash Flows: Before, we analyze how cash flow is computed in capital budgeting decision, following items need consideration:
© The Institute of Chartered Accountants of India
7.8 FINANCIAL MANAGEMENT
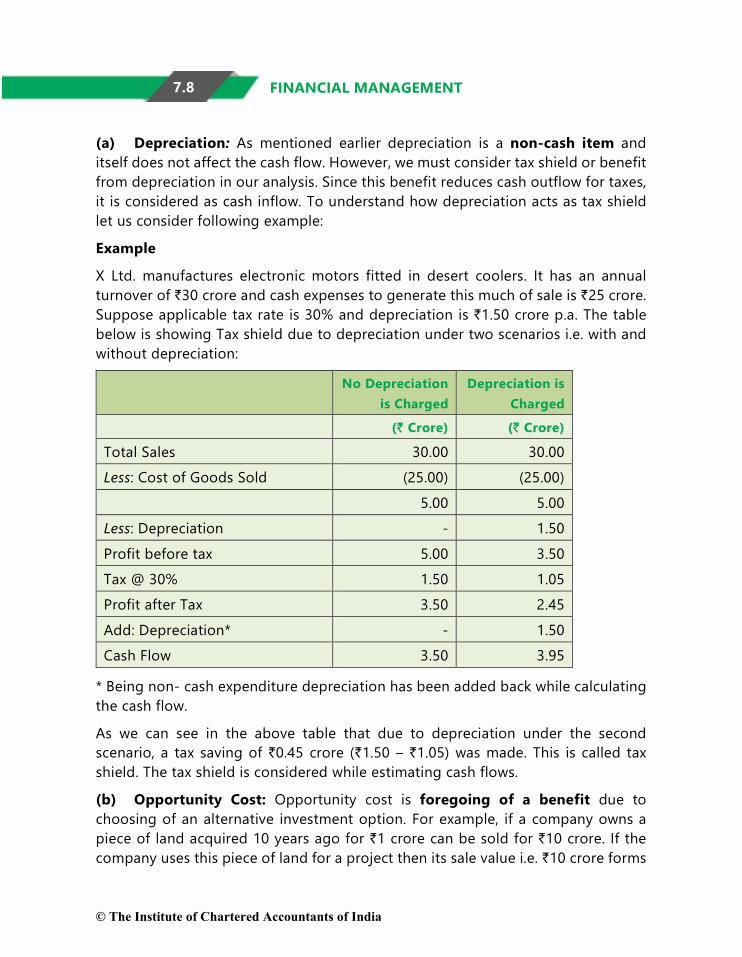
(a) Depreciation: As mentioned earlier depreciation is a non-cash item and itself does not affect the cash flow. However, we must consider tax shield or benefit from depreciation in our analysis. Since this benefit reduces cash outflow for taxes, it is considered as cash inflow. To understand how depreciation acts as tax shield let us consider following example:
Example
X Ltd. manufactures electronic motors fitted in desert coolers. It has an annual turnover of `30 crore and cash expenses to generate this much of sale is `25 crore. Suppose applicable tax rate is 30% and depreciation is `1.50 crore p.a. The table below is showing Tax shield due to depreciation under two scenarios i.e. with and without depreciation:
No Depreciation is Charged
Depreciation is Charged
(` Crore) (` Crore)
Total Sales 30.00 30.00 Less: Cost of Goods Sold (25.00) (25.00) 5.00 5.00 Less: Depreciation - 1.50 Profit before tax 5.00 3.50 Tax @ 30% 1.50 1.05 Profit after Tax 3.50 2.45 Add: Depreciation* - 1.50 Cash Flow 3.50 3.95
* Being non- cash expenditure depreciation has been added back while calculating the cash flow.
As we can see in the above table that due to depreciation under the second scenario, a tax saving of `0.45 crore (`1.50 – `1.05) was made. This is called tax shield. The tax shield is considered while estimating cash flows.
(b) Opportunity Cost: Opportunity cost is foregoing of a benefit due to choosing of an alternative investment option. For example, if a company owns a piece of land acquired 10 years ago for `1 crore can be sold for `10 crore. If the company uses this piece of land for a project then its sale value i.e. `10 crore forms
© The Institute of Chartered Accountants of India

7.9
INVESTMENT DECISIONS
the part of initial outlay as by using the land the company has foregone `10 crore which could be earned by selling it. This opportunity cost can occur both at the time of initial outlay and during the tenure of the project.
Opportunity costs are considered for estimation of cash outflows.
(c) Sunk Cost: Sunk cost is an outlay of cash that has already been incurred and cannot be reversed in present. Therefore, these costs do not have any impact on decision making, hence should be excluded from capital budgeting analysis. For example, if a company has paid a sum of `1,00,000 for consultancy fees to a firm to prepare a Project Report for analysing a particular project. The consultancy fee is irrelevant and not considered for estimating cash flows as it has already been paid and shall not affect our decision whether project should be undertaken or not.
(d) Working Capital: Every big project requires working capital because, for every business, investment in working capital is must. Therefore, while evaluating the projects initial working capital requirement should be treated as cash outflow and at the end of the project its release should be treated as cash inflow. It is important to note that no depreciation is provided on working capital though it might be possible that at the time of its release its value might have been reduced. Further there may be also a possibility that additional working capital may be required during the life of the project. In such cases the additional working capital required is treated as cash outflow at that period of time. Similarly, any reduction in working capital shall be treated as cash inflow. It may be noted that, if nothing has been specifically mentioned for the release of working capital it is assumed that full amount has been realized at the end of the project. However, adjustment on account of increase or decrease in working capital needs to be incorporated.
(e) Allocated Overheads: As discussed in subject of Cost and Management Accounting, allocated overheads are charged on the basis of some rational basis such as machine hour, labour hour, direct material consumption etc. Since, expenditures already incurred are allocated to new proposal; they should not be considered as cash flows. However, it is expected that overhead cost shall increase due to acceptance of any proposal then incremental overhead cost shall be treated as cash outflow.
(f) Additional Capital Investment: It is not necessary that capital investment shall be required in the beginning of the project. It can also be required during the continuance of the project. In such cases it shall be treated as cash outflows.
© The Institute of Chartered Accountants of India

7.10 FINANCIAL MANAGEMENT
Categories of Cash Flows: It is helpful to place project cash flows into three categories:-
(a) Initial Cash Outflow: The initial cash out flow for a project depends upon the type of capital investment decision as follows:-
(i) If decision is related to investment in a fresh proposal or an expansion decision then initial cash outflow shall be calculated as follows:
Amount Amount Cost of new Asset(s) xxx Add: Installation/Set-Up Costs xxx Add: Investment in Working Capital xxx xxx Initial Cash Outflow xxx
(ii) If decision is related to replacement decision then initial cash outflow shall be calculated as follows:
Amount Amount Cost of new Asset(s) xxx Add: Add: Installation/Set-Up Costs xxx Add/(less): Increase (Decrease) in net Working
Capital level xxx
Less: Net Proceeds from sale of old assets (If it is a replacement situation)
(xxx)
Add/(less): Tax expense (saving/ loss) due to sale of Old Asset (If it is a replacement situation)
xxx xxx
Initial Cash Outflow xxx
(b) Interim Cash Flows: After making the initial cash outflow that is necessary to begin implementing a project, the firm hopes to get benefit from the future cash inflows generated by the project. As mentioned earlier calculation of cash flows depends on the fact whether analysis is related to fresh project or modernization of existing facilities or replacement of existing machined decision.
(i) New Project: If analysis is related to a fresh or completely a new project then interim cash flow is calculated as follows:-
© The Institute of Chartered Accountants of India
7.11
INVESTMENT DECISIONS
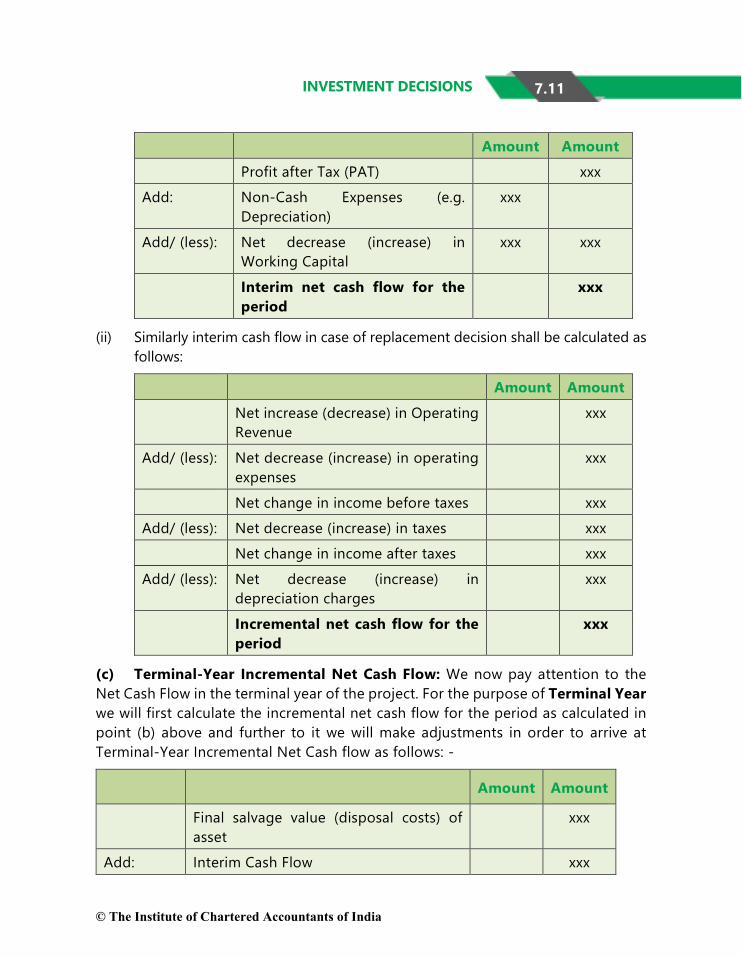
Amount Amount Profit after Tax (PAT) xxx Add: Non-Cash Expenses (e.g.
Depreciation) xxx
Add/ (less): Net decrease (increase) in Working Capital
xxx xxx
Interim net cash flow for the period
xxx
(ii) Similarly interim cash flow in case of replacement decision shall be calculated as follows:
Amount Amount Net increase (decrease) in Operating
Revenue xxx
Add/ (less): Net decrease (increase) in operating expenses
xxx
Net change in income before taxes xxx Add/ (less): Net decrease (increase) in taxes xxx Net change in income after taxes xxx Add/ (less): Net decrease (increase) in
depreciation charges xxx
Incremental net cash flow for the period
xxx
(c) Terminal-Year Incremental Net Cash Flow: We now pay attention to the Net Cash Flow in the terminal year of the project. For the purpose of Terminal Year we will first calculate the incremental net cash flow for the period as calculated in point (b) above and further to it we will make adjustments in order to arrive at Terminal-Year Incremental Net Cash flow as follows: -
Amount Amount
Final salvage value (disposal costs) of asset
xxx
Add: Interim Cash Flow xxx
© The Institute of Chartered Accountants of India

7.12 FINANCIAL MANAGEMENT
Add/ (less): Tax savings (tax expenses) due to sale or disposal of asset (Including Depreciation)
xxx
Add: Release of Net Working Capital xxx Terminal Year incremental net cash flow
xxx
7.6 BASIC PRINCIPLES FOR MEASURING PROJECT CASH FLOWS
For developing the project cash flows the following principles must be kept in mind:
7.6.1 Block of Assets and Depreciation From above discussion it is clear that tax shield/ benefit from depreciation is considered while calculating cash flows from the project. Taxable income is calculated as per the provisions of Income Tax or similar Act of a country. The treatment of deprecation is based on the concept of “Block of Assets”, which means a group of assets falling within a particular class of assets. This class of assets can be building, machinery, furniture etc. in respect of which depreciation is charged at same rate. The treatment of tax depends on the fact whether block of asset consist of one asset or several assets. To understand the concept of block of asset let us discuss an example.
Example
Suppose A Ltd. acquired new machinery for `1,00,000 depreciable at 20% as per Written Down Value (WDV) method. The machine has an expected life of 5 years with salvage value of `10,000. The treatment of Depreciation/ Short Term Capital Loss in the 5th year in two cases shall be as follows:
Depreciation for initial 4 years shall be common and WDV at the beginning of the 5th year shall be computed as follows:
`
Purchase Price of Machinery 1,00,000 Less: Depreciation @20% for year 1 20,000WDV at the end of year 1 80,000 Less: Depreciation @20% for year 2 16,000
© The Institute of Chartered Accountants of India

7.13
INVESTMENT DECISIONS
WDV at the end of year 2 64,000 Less: Depreciation @20% for year 3 12,800 WDV at the end of year 3 51,200 Less: Depreciation @20% for year 4 10,240 WDV at the end of year 4 40,960
(i) Case 1: There is no other asset in the Block: When there is one asset in the block and block shall cease to exist at the end of 5th year no deprecation shall be charged in this year and tax benefit/loss on Short Term Capital Loss/ Gain shall be calculated as follows:
`
WDV at the beginning of year 5 40,960 Less: Sale value of Machine 10,000 Short Term Capital Loss 30,960 Tax Benefit on STCL @ 30% 9,288
(ii) Case 2: More than one asset exists in the Block: When more than one asset exists in the block and deprecation shall be charged in the terminal year (5th year) in which asset is sold. The WDV on which depreciation be charged shall be calculated by deducting sale value from the WDV in the beginning of the year. Tax benefit on Depreciation shall be calculated as follows:
`
WDV at the beginning of year 5 40,960 Less: Sale value of Machine 10,000 WDV 30,960 Depreciation @20% 6,192 Tax Benefit on Depreciation @ 30% 1,858
Now suppose if in above two cases sale value of machine is ` 50,000, then no depreciation shall be provided in case 2 and tax loss on Short Term Capital Gain in Case 1 shall be computed as follows:
`
WDV at the beginning of year 5 40,960
© The Institute of Chartered Accountants of India

7.14 FINANCIAL MANAGEMENT
Less: Sale value of Machine 50,000 Short Term Capital Gain 9,040 Tax Loss on STCG @ 30% 2,712
7.6.2 Exclusion of Financing Costs Principle When cash flows relating to long-term funds are being defined, financing costs of long-term funds (interest on long-term debt and equity dividend) should be excluded from the analysis. The interest and dividend payments are reflected in the weighted average cost of capital. Hence, if interest on long-term debt and dividend on equity capital are deducted in defining the cash flows, the cost of long-term funds will be counted twice.
The exclusion of financing costs principle means that:
(i) The interest on long-term debt (or interest) is ignored while computing profits and taxes and;
(ii) The expected dividends are deemed irrelevant in cash flow analysis.
While dividends pose no difficulty as they come only from profit after taxes, interest needs to be handled properly. Since interest is usually deducted in the process of arriving at profit after tax, an amount equal to ‘Interest (1 − Tax rate)’ should be added back to the figure of Profit after Tax as shown below:
Profit Before Interest and Tax × (1 − Tax rate)
= (Profit Before Tax + Interest) (1 − Tax rate)
= (Profit Before Tax) (1 − Tax rate) + (Interest) (1 − Tax rate)
= Profit After Tax + Interest (1 − Tax rate)
Thus, whether the tax rate is applied directly to the profit before interest and tax figure or whether the tax − adjusted interest, which is simply interest (1 − tax rate), is added to profit after tax, we get the same result.
Example
Suppose XYZ Ltd.’s expected profit for the forthcoming 4 years is as follows:
Year 1 Year 2 Year 3 Year 4
Profit before Interest and Tax `10,000 `20,000 `40,000 `50,000
If interest payable is `5,000 and tax rate is 30% the profit after tax excluding financing cost shall be as follows:
© The Institute of Chartered Accountants of India

7.15
INVESTMENT DECISIONS
Year 1 (`)
Year 2 (`)
Year 3 (`)
Year 4 (`)
Profit before Interest and Tax 10,000 20,000 40,000 50,000 Less: Interest (5,000) (5,000) (5,000) (5,000) 5,000 15,000 35,000 45,000 Less: Tax @ 30% (1,500) (4,500) (10,500) 13,500 Profit after Tax (PAT) 3,500 10,500 24,500 31,500 Add: Interest (1- t) 3,500 3,500 3,500 3,500 PAT excluding financing cost 7,000 14,000 28,000 35,000
Alternatively
Year 1 (`)
Year 2 (`)
Year 3 (`)
Year 4 (`)
Profit before Interest and Tax 10,000 20,000 40,000 50,000 Less: Tax @ 30% 3,000 6,000 12,000 15,000 PAT excluding financing cost 7,000 14,000 28,000 35,000
7.6.3 Post−tax Principle Tax payments like other payments must be properly deducted in deriving the cash flows. That is, cash flows must be defined in post-tax terms. It is always better to avoid using Pre Tax Cash Flows and using Pre-Tax Discounting Rate.
STATEMENT SHOWING THE CALCULATION OF CASH INFLOW AFTER TAX (CFAT)
Sl. No. (`)
1 Total Sales Units xxx 2 Selling Price per unit xxx 3. Total Sales [1 × 2] xxx 4. Less: Variable Cost xxx 5. Contribution [3-4] xxx 6. Less: Fixed Cost (a) Fixed Cash Cost xxx (b) Depreciation xxx
© The Institute of Chartered Accountants of India

7.16 FINANCIAL MANAGEMENT
7. Earning Before Tax [6-7] xxx 8. Less: Tax xxx 9. Earning After Tax [7-8] xxx 10. Add: Depreciation xxx 11. Cash Inflow After Tax (CFAT) [9 +10] xxx
ILLUSTRATION 1
ABC Ltd is evaluating the purchase of a new machinery with a depreciable base of `1,00,000; expected economic life of 4 years and change in earnings before taxes and depreciation of `45,000 in year 1, `30,000 in year 2, `25,000 in year 3 and `35,000 in year 4. Assume straight-line depreciation and a 20% tax rate. You are required to COMPUTE relevant cash flows.
SOLUTION
Amount (in `)
Years 1 2 3 4
Earnings before tax and depreciation 45,000 30,000 25,000 35,000 Less: Depreciation (25,000) (25,000) (25,000) (25,000) Earnings before tax 20,000 5,000 0 10,000 Less: Tax @20% (4,000) (1,000) 0 (2,000) 16,000 4,000 0 8,000 Add: Depreciation 25,000 25,000 25,000 25,000 Net Cash flow 41,000 29,000 25,000 33,000
Working Note:
Depreciation = `1, 00,000÷4 = `25,000
© The Institute of Chartered Accountants of India

7.17
INVESTMENT DECISIONS
SECTION 2
7.7 CAPITAL BUDGETING TECHNIQUES In order to maximise the return to the shareholders of a company, it is important that the best or most profitable investment projects are selected. Results of making a bad long-term investment decision can be devastating in both financial and strategic terms. Care required for investment project selection and evaluation.
There are a number of techniques available for appraisal of investment proposals and can be classified as presented below:
Organizations may use any one or more of capital investment evaluation techniques; some organizations use different methods for different types of projects while others may use multiple methods for evaluating each project. These techniques have been discussed below – net present value, profitability index, internal rate of return, modified internal rate of return, payback period, and accounting (book) rate of return.
7.8 TRADITIONAL OR NON-DISCOUNTING TECHNIQUES
These techniques of capital Budgeting does not discount the future cash flows. There are two such techniques namely Payback Period and Accounting Rate of Return
7
Capital Budgeting Techniques
Traditional or Non Discounting
Payback Period
Accounting Rate of Return (ARR)
Time adjusted or Discounted Cash
Flows
Net Present Value (NPV)
Profitability Index (PI)
Internal Rate of Return (IRR)
Modified Internal Rate of Return (MIRR)
Discounted Payback
© The Institute of Chartered Accountants of India

7.18 FINANCIAL MANAGEMENT
7.8.1 Payback Period Time required to recover the initial cash-outflow is called pay-back period. The payback period of an investment is the length of time required for the cumulative total net cash flows from the investment to equal the total initial cash outlays. At that point in time, the investor has recovered the money invested in the project.
Steps in Payback period technique: -
(a) The first steps in calculating the payback period is determining the total initial capital investment (cash outflow) and
(b) The second step is calculating/estimating the annual expected after-tax cash flows over the useful life of the investment.
1. When the cash inflows are uniform over the useful life of the project, the number of years in the payback period can be calculated using the following equation:
Total initial capital investmentPayback period = Annual expected after - tax net cash flow
Example: Suppose a project costs `20,00,000 and yields annually a profit of `3,00,000 after depreciation @ 12½% (straight line method) but before tax 50%. The first step would be to calculate the cash inflow from this project. The cash inflow is `4,00,000 calculated as follows:
Particulars (`) Profit before tax 3,00,000 Less: Tax @ 50% (1,50,000) Profit after tax 1,50,000 Add: Depreciation written off 2,50,000 Total cash inflow 4,00,000
While calculating cash inflow, depreciation is added back to profit after tax since it does not result in cash outflow. The cash generated from a project therefore is equal to profit after tax plus depreciation. The payback period of the project shall be:
Payback period = ` 20,00,0004,00,000
= 5 Years
© The Institute of Chartered Accountants of India

7.19
INVESTMENT DECISIONS
Some Accountants calculate payback period after discounting the cash flows by a predetermined rate and the payback period so calculated is called, ‘Discounted payback period’ (discussed later on).
2. When the annual cash inflows are not uniform, the cumulative cash inflow from operations must be calculated for each year. The payback period shall be corresponding period when total of cumulative cash inflows is equal to the initial capital investment. However, if exact sum does not match then the period in which it lies should be identified. After that we need to compute the fraction of the year. This method can be understood with the help of an example
Example
Suppose XYZ Ltd. is analyzing a project requiring an initial cash outlay of `2,00,000 and expected to generate cash inflows as follows:
Year Annual Cash Inflows
1 80,000 2 60,000 3 60,000 4 20,000
It’s payback period shall be computed by using cumulative cash flows as follows:
Year Annual Cash Inflows Cumulative Cash Inflows 1 80,000 80,000 2 60,000 1,40,000 3 60,000 2,00,000 ← 4 20,000 2,20,000
In 3 years total cash inflows equal to initial cash outlay. Hence, payback period is 3 years.
Suppose if in above example the initial outlay is `2,05,000 then payback period shall be computed as follows:
Year Annual Cash Inflows Cumulative Cash Inflows
1 80,000 80,000 2 60,000 1,40,000
© The Institute of Chartered Accountants of India

7.20 FINANCIAL MANAGEMENT
3 60,000 2,00,000 4 20,000 2,20,000 ←
Payback period shall lie between 3 to 4 years. Since up to 3 years a sum of `2,00,000 shall be recovered balance of `5,000 shall be recovered in the part (fraction) of 4th year, computation is as follows:
year41
20,0005,000
=
Thus, total cash outlay of ` 205,000 shall be recovered in 3¼ years’ time.
Advantages of Payback period It is easy to compute.
It is easy to understand as it provides a quick estimate of the time needed for the organization to recoup the cash invested.
The length of the payback period can also serve as an estimate of a project’s risk; the longer the payback period, the riskier the project as long-term predictions are less reliable. In some industries with high obsolescence risk like software industry or in situations where an organization is short on cash, short payback periods often become the determining factor for investments.
Limitations of Payback period It ignores the time value of money. As long as the payback periods for two
projects are the same, the payback period technique considers them equal as investments, even if one project generates most of its net cash inflows in the early years of the project while the other project generates most of its net cash inflows in the latter years of the payback period.
A second limitation of this technique is its failure to consider an investment’s total profitability; it only considers cash inflows upto the period in which initial investment is fully recovered and ignores cash flows after the payback period.
Payback technique places much emphasis on short payback periods thereby ignoring long-term projects.
7.8.1.1 Payback Reciprocal As the name indicates it is the reciprocal of payback period. A major drawback of the payback period method of capital budgeting is that it does not indicate any cut off period for the purpose of investment decision. It is, however, argued that the
© The Institute of Chartered Accountants of India
7.21
INVESTMENT DECISIONS
reciprocal of the payback would be a close approximation of the Internal Rate of Return (later discussed in detail) if the life of the project is at least twice the payback period and the project generates equal amount of the annual cash inflows. In practice, the payback reciprocal is a helpful tool for quick estimation of rate of return of a project provided its life is at least twice the payback period.
The payback reciprocal can be calculated as follows:
Payback Reciprocal = Average annual cash in flow Initial investment
Example
Suppose a project requires an initial investment of ̀ 20,000 and it would give annual cash inflow of `4,000. The useful life of the project is estimated to be 5 years. In this example payback reciprocal will be:
`
`
4,000×10020,000
=20%
The above payback reciprocal provides a reasonable approximation of the internal rate of return, i.e. 19%.
7.8.2 Accounting (Book) Rate of Return (ARR) or Average Rate of Return (ARR) The accounting rate of return of an investment measures the average annual net income of the project (incremental income) as a percentage of the investment.
Accounting rate of return = Average annual net incomeInvestment
The numerator is the average annual net income generated by the project over its useful life. The denominator can be either the initial investment (including installation cost) or the average investment over the useful life of the project. Average investment means the average amount of fund remained blocked during the lifetime of the project under consideration. Further ARR can be calculated in a number of ways as shown in the following example.
Example
Suppose Times Ltd. is going to invest in a project a sum of ` 3,00,000 having a life span of 3 years. Salvage value of machine is `90,000. The profit before depreciation for each year is `1,50,000.
© The Institute of Chartered Accountants of India

7.22 FINANCIAL MANAGEMENT
The Profit after Tax and value of Investment in the Beginning and at the End of each year shall be as follows:
Year Profit Before
Depreciation (`)
Depreciation
(`)
Profit after Dep.
(`)
Value of Investment in (`)
Beginning End 1 1,50,000 70,000 80,000 3,00,000 2,30,000 2 1,50,000 70,000 80,000 2,30,000 1,60,000 3 1,50,000 70,000 80,000 1,60,000 90,000
The ARR can be computed by following methods as follows:
(a) Version 1: Annual Basis
ProfitafterDepreciationARR =
Investmentinthebeginingof theyear
Year 1 80,000 =26.67%
3,00,000
2 80,000 =34.78%2,30,000
3 80,000 =50%1,60,000
26.67%+34.78%+50.00%AverageARR = =37.15%
3
(b) Version 2: Total Investment Basis
AverageAnnualProfitARR = ×100Investmentinthebegining
(80,000+80,000+80,000) / 3= ×1003,00,000 = 26.67%
© The Institute of Chartered Accountants of India

7.23
INVESTMENT DECISIONS
(c) Version 3: Average Investment Basis
AverageAnnualProfitARR = ×100AverageInvestment
Average Investment = (`3,00,000 + ` 90,000)/2 = `1,95,000
Or, ½(Initial Investment – Salvage Value) + Salvage Value
= ½(`3,00,000 –`90,000) + `90,000 = ` 1,95,000
80,000= ×100
1,95,000 = 41.03%
Further, it is important to note that project may also require additional working capital during its life in addition to initial working capital. In such situation formula for the calculation of average investment shall be modified as follows:
½(Initial Investment – Salvage Value) + Salvage Value+ Additional Working Capital
Continuing above example, suppose a sum of `45,000 is required as additional working capital during the project life then average investment shall be:
= ½ (`3,00,000 – `90,000) + `90,000 + `45,000 = `2,40,000 and
ARR 80,000= ×100
2,40,000 = 33.33%
Some organizations prefer the initial investment because it is objectively determined and is not influenced by either the choice of the depreciation method or the estimation of the salvage value. Either of these amounts is used in practice but it is important that the same method be used for all investments under consideration.
Advantages of ARR This technique uses readily available data that is routinely generated for
financial reports and does not require any special procedures to generate data.
This method may also mirror the method used to evaluate performance on the operating results of an investment and management performance. Using the same procedure in both decision-making and performance evaluation ensures consistency.
© The Institute of Chartered Accountants of India

7.24 FINANCIAL MANAGEMENT
Calculation of the accounting rate of return method considers all net incomes over the entire life of the project and provides a measure of the investment’s profitability.
Limitations of ARR The accounting rate of return technique, like the payback period technique,
ignores the time value of money and considers the value of all cash flows to be equal.
The technique uses accounting numbers that are dependent on the organization’s choice of accounting procedures, and different accounting procedures, e.g., depreciation methods, can lead to substantially different amounts for an investment’s net income and book values.
The method uses net income rather than cash flows; while net income is a useful measure of profitability, the net cash flow is a better measure of an investment’s performance.
Furthermore, inclusion of only the book value of the invested asset ignores the fact that a project can require commitments of working capital and other outlays that are not included in the book value of the project.
ILLUSTRATION 2
A project requiring an investment of `10,00,000 and it yields profit after tax and depreciation which is as follows:
Years Profit after tax and depreciation (`)
1 50,000
2 75,000
3 1,25,000
4 1,30,000
5 80,000
Total 4,60,000 Suppose further that at the end of the 5th year, the plant and machinery of the project can be sold for ` 80,000. DETERMINE Average Rate of Return.
SOLUTION
In this case the rate of return can be calculated as follows:
© The Institute of Chartered Accountants of India

7.25
INVESTMENT DECISIONS
Total Profit÷No. of yearsAverage investment / Initial Investment
×100
(a) If Initial Investment is considered then,
= `
`
4,60,000÷5years ×10010,00,000
=`
`
92,000 ×10010,00,000
=9.2%
This rate is compared with the rate expected on other projects, had the same funds been invested alternatively in those projects. Sometimes, the management compares this rate with the minimum rate (called-cut off rate). For example, management may decide that they will not undertake any project which has an average annual yield after tax less than 20%. Any capital expenditure proposal which has an average annual yield of less than 20% will be automatically rejected.
(b) If Average investment is considered, then,
= 92,000 ×
Average investment100 =
92,000 ×5,40,000
100 = 17.04%
Where,
Average Investment= ½ (Initial investment – Salvage value) + Salvage value = ½ (10,00,000 – 80,000) + 80,000
= 4,60,000 + 80,000 = 5,40,000
7.9 DISCOUNTING TECHNIQUES Discounting techniques consider time value of money and discount the cash flows to their Present Value. These techniques are also known as Present Value techniques. These are namely Net Present Value (NPV), Internal Rate of Return (IRR) and Profitability Index (PI). First let us discuss about Determination of Discount rate and it will be followed by the three techniques.
Determining Discount Rate Theoretically, the discount rate or desired rate of return on an investment is the rate of return the firm would have earned by investing the same funds in the best available alternative investment that has the same risk. Determining the best alternative opportunity available is difficult in practical terms so rather than using the true opportunity cost, organizations often use an alternative measure for the desired rate of return. An organization may establish a minimum rate of return that all capital projects must meet; this minimum could be based on an industry average
© The Institute of Chartered Accountants of India

7.26 FINANCIAL MANAGEMENT
or the cost of other investment opportunities. Many organizations choose to use the overall cost of capital or Weighted Average Cost of Capital (WACC) that an organization has incurred in raising funds or expects to incur in raising the funds needed for an investment.
7.9.1 Net Present Value Technique (NPV) The net present value technique is a discounted cash flow method that considers the time value of money in evaluating capital investments. An investment has cash flows throughout its life, and it is assumed that an amount of cash flow in the early years of an investment is worth more than an amount of cash flow in a later year.
The net present value method uses a specified discount rate to bring all subsequent cash inflows after the initial investment to their present values (the time of the initial investment is year 0).
The net present value of a project is the amount, in current value of amount, the investment earns after paying cost of capital in each period.
Net present value = Present value of net cash inflow - Total net initial investment
Since it might be possible that some additional investment may also be required during the life time of the project then appropriate formula shall be:
Net present value = Present value of cash inflows - Present value of cash outflows
It can be expressed as below:
31 2 n2 3 n
CC C CNPV = + + +......+ -I(1+k) (1+k) (1+k) (1+k)
∑n t
tt = 1
CNPV = -I(1+k)
Where,
C=Cash flow of various years
K = discount rate
N=Life of the project
I = Investment
© The Institute of Chartered Accountants of India

7.27
INVESTMENT DECISIONS
Steps to calculating Net Present Value (NPV): The steps to calculating net present value are: -
1. Determine the net cash inflow in each year of the investment
2. Select the desired rate of return or discounting rate or Weighted Average Cost of Capital.
3. Find the discount factor for each year based on the desired rate of return selected.
4. Determine the present values of the net cash flows by multiplying the cash flows by respective discount factors of respective period called Present Value (PV) of Cash flows
5. Total the amounts of all PVs of Cash Flows
Decision Rule:
If NPV ≥ 0 Accept the Proposal
If NPV ≤ 0 Reject the Proposal
The NPV method can be used to select between mutually exclusive projects; the one with the higher NPV should be selected
ILLUSTRATION 3
COMPUTE the net present value for a project with a net investment of `1,00,000 and net cash flows year one is `55,000; for year two is `80,000 and for year three is ` 15,000. Further, the company’s cost of capital is 10%?
[PVIF @ 10% for three years are 0.909, 0.826 and 0.751]
SOLUTION
Year Net Cash Flows PVIF @ 10% Discounted Cash Flows
0 (1,00,000) 1.000 (1,00,000)
1 55,000 0.909 49,995
2 80,000 0.826 66,080
3 15,000 0.751 11,265
Net Present Value 27,340
© The Institute of Chartered Accountants of India

7.28 FINANCIAL MANAGEMENT
Recommendation: Since the net present value of the project is positive, the company should accept the project.
ILLUSTRATION 4
ABC Ltd is a small company that is currently analyzing capital expenditure proposals for the purchase of equipment; the company uses the net present value technique to evaluate projects. The capital budget is limited to ` 500,000 which ABC Ltd believes is the maximum capital it can raise. The initial investment and projected net cash flows for each project are shown below. The cost of capital of ABC Ltd is 12%. You are required to COMPUTE the NPV of the different projects.
Project A Project B Project C Project D
Initial Investment 200,000 190,000 250,000 210,000
Project Cash Inflows
Year 1 50,000 40,000 75,000 75,000
2 50,000 50,000 75,000 75,000
3 50,000 70,000 60,000 60,000
4 50,000 75,000 80,000 40,000
5 50,000 75,000 100,000 20,000
SOLUTION
Calculation of net present value:
Period PV factor Project A Project B Project C Project D 0 1.000 (2,00,000) (1,90,000) (2,50,000) (2,10,000) 1 0.893 44,650 35,720 66,975 66,975 2 0.797 39,850 39,850 59,775 59,775 3 0.712 35,600 49,840 42,720 42,720 4 0.636 31,800 47,700 50,880 25,440 5 0.567 28,350 42,525 56,700 11,340
Net Present Value (19,750) 25,635 27,050 (3,750)
Advantages of NPV NPV method takes into account the time value of money.
The whole stream of cash flows is considered.
© The Institute of Chartered Accountants of India

7.29
INVESTMENT DECISIONS
The net present value can be seen as the addition to the wealth of shareholders. The criterion of NPV is thus in conformity with basic financial objectives.
The NPV uses the discounted cash flows i.e., expresses cash flows in terms of current rupees. The NPVs of different projects therefore can be compared. It implies that each project can be evaluated independent of others on its own merit.
Limitations of NPV It involves difficult calculations.
The application of this method necessitates forecasting cash flows and the discount rate. Thus accuracy of NPV depends on accurate estimation of these two factors which may be quite difficult in practice.
The decision under NPV method is based on absolute measure. It ignores the difference in initial outflows, size of different proposals etc. while evaluating mutually exclusive projects.
7.9.2 Profitability Index /Desirability Factor/Present Value Index Method (PI) The students may have seen how with the help of discounted cash flow technique, the two alternative proposals for capital expenditure can be compared. In certain cases we have to compare a number of proposals each involving different amounts of cash inflows.
One of the methods of comparing such proposals is to work out what is known as the ‘Desirability factor’, or ‘Profitability index’ or ‘Present Value Index Method’.
Mathematically:
The Profitability Index (PI) is calculated as below:
Profitability Index (PI)= Sum of discounted cash in flows Initial cash outlay or Total discounted cash outflow (as the case may)
Decision Rule:
If PI ≥ 1 Accept the Proposal
If PI ≤ 1 Reject the Proposal
In case of mutually exclusive projects; project with higher PI should be selected
© The Institute of Chartered Accountants of India

7.30 FINANCIAL MANAGEMENT
ILLUSTRATION 5
Suppose we have three projects involving discounted cash outflow of `5,50,000, ` 75,000 and `1,00,20,000 respectively. Suppose further that the sum of discounted cash inflows for these projects are `6,50,000, `95,000 and `1,00,30,000 respectively. CALCULATE the desirability factors for the three projects.
SOLUTION
The desirability factors for the three projects would be as follows:
1. `
`
6,50,0005,50,000
=1.18
2. `
`
95,00075,000
= 1.27
3. `
`
1,00,30,0001,00,20,000
=1.001
It would be seen that in absolute terms project 3 gives the highest cash inflows yet its desirability factor is low. This is because the outflow is also very high. The Desirability/ Profitability Index factor helps us in ranking various projects.
Since PI is an extension of NPV it has same advantages and limitation.
Advantages of PI The method also uses the concept of time value of money and is a better project
evaluation technique than NPV.
In the PI method, since the present value of cash inflows is divided by the present value of cash outflow, it is a relative measure of a project’s profitability.
Limitations of PI Profitability index fails as a guide in resolving capital rationing where projects are
indivisible.
Once a single large project with high NPV is selected, possibility of accepting several small projects which together may have higher NPV than the single project is excluded.
Also situations may arise where a project with a lower profitability index selected may generate cash flows in such a way that another project can be taken up one or two years later, the total NPV in such case being more than the one with a project with highest Profitability Index.
© The Institute of Chartered Accountants of India

7.31
INVESTMENT DECISIONS
The Profitability Index approach thus cannot be used indiscriminately but all other type of alternatives of projects will have to be worked out.
7.9.3 Internal Rate of Return Method (IRR) The internal rate of return method considers the time value of money, the initial cash investment, and all cash flows from the investment. But unlike the net present value method, the internal rate of return method does not use the desired rate of return but estimates the discount rate that makes the present value of subsequent cash inflows equal to the initial investment. This discount rate is called IRR.
IRR Definition: Internal rate of return for an investment proposal is the discount rate that equates the present value of the expected cash inflows with the initial cash outflow.
This IRR is then compared to a criterion rate of return that can be the organization’s desired rate of return for evaluating capital investments.
Calculation of IRR: The procedures for computing the internal rate of return vary with the pattern of net cash flows over the useful life of an investment.
Scenario 1: For an investment with uniform cash flows over its life, the following equation is used:
Step 1: Total initial investment =Annual cash inflow × Annuity discount factor of the discount rate for the number of periods of the investment’s useful life
If A is the annuity discount factor, then
A =Total initial cash disbursements and commitments for the investment
Annual (equal) cash inflows from the investment Step 2: Once A has been calculated, the discount rate is the interest rate that has the same discounting factor as A in the annuity table along the row for the number of periods of the useful life of the investment. If exact value of ‘A’ could be found in Present Value Annuity Factor (PVAF) table corresponding to the period of the project the respective discounting factor or rate shall be IRR. However, it rarely happens therefore we follow the method discussed below:
Step 1: Compute approximate payback period also called fake payback period.
Step 2: Locate this value in PVAF table corresponding to period of life of the project. The value may be falling between two discounting rates.
Step 3: Discount cash flows using these two discounting rates.
© The Institute of Chartered Accountants of India

7.32 FINANCIAL MANAGEMENT
Step 4: Use following Interpolation Formula:
NPV at LRLR+ ×(HR -LR)NPV at LR - NPV at HR
Where,
LR = Lower Rate
HR = Higher Rate
ILLUSTRATION 6
A Ltd. is evaluating a project involving an outlay of `10,00,000 resulting in an annual cash inflow of ` 2,50,000 for 6 years. Assuming salvage value of the project is zero; DETERMINE the IRR of the project.
SOLUTION
First of all we shall find an approximation of the payback period:
10,00,000 = 42,50,000
Now we shall search this figure in the PVAF table corresponding to 6-year row.
The value 4 lies between values 4.111 and 3.998 correspondingly discounting rates 12% and 13% respectively.
NPV @ 12%
NPV12%= (10,00,000) + 4.111 × 2,50,000 = 27,750
NPV13%= (10,00,000) + 3.998 × 2,50,000 = -500
The internal rate of return is, thus, more than 12% but less than 13%. The exact rate can be obtained by interpolation:
IRR 27,750=12%+ ×(13%-12%)27,750 - (500)
= 12% + 27,75028,250
= 12.98%
IRR = 12.98%
Scenario 2: When the cash inflows are not uniform over the life of the investment, the determination of the discount rate can involve trial and error and interpolation
© The Institute of Chartered Accountants of India

7.33
INVESTMENT DECISIONS
between discounting rates as mentioned above. However, IRR can also be found out by using following procedure:
Step 1: Discount the cash flow at any random rate say 10%, 15% or 20% randomly.
Step 2: If resultant NPV is negative then discount cash flows again by lower discounting rate to make NPV positive. Conversely, if resultant NPV is positive then again discount cash flows by higher discounting rate to make NPV negative.
Step 3: Use following Interpolation Formula:
NPV at LR=LR+ ×(HR -LR)NPV at LR - NPV at HR
Where
LR = Lower Rate
HR = Higher Rate
ILLUSTRATION 7
CALCULATE the internal rate of return of an investment of `1,36,000 which yields the following cash inflows:
Year Cash Inflows (in `)
1 30,000
2 40,000
3 60,000
4 30,000
5 20,000
SOLUTION
Let us discount cash flows by 10%.
Year Cash Inflows (`) Discounting factor at 10%
Present Value (`)
1 30,000 0.909 27,270 2 40,000 0.826 33,040 3 60,000 0.751 45,060 4 30,000 0.683 20,490
© The Institute of Chartered Accountants of India

7.34 FINANCIAL MANAGEMENT
5 20,000 0.621 12,420 Total present value 1,38,280
The present value at 10% comes to `1,38,280, which is more than the initial investment. Therefore, a higher discount rate is suggested, say, 12%.
Year Cash Inflows (`) Discounting factor at 12%
Present Value (`)
1 30,000 0.893 26,790 2 40,000 0.797 31,880 3 60,000 0.712 42,720 4 30,000 0.636 19,080 5 20,000 0.567 11,340 Total present value 1,31,810
The internal rate of return is, thus, more than 10% but less than 12%. The exact rate can be obtained by interpolation:
IRR =
` `
` `
1,38,280- 1,36,00010+ 1,38,280- 1,31,810
× 2
= 10 +
2,280 ×26,470
= 10 + 0.70
IRR = 10.70%
ILLUSTRATION 8
A company proposes to install machine involving a capital cost of `3,60,000. The life of the machine is 5 years and its salvage value at the end of the life is nil. The machine will produce the net operating income after depreciation of `68,000 per annum. The company's tax rate is 45%.
The Net Present Value factors for 5 years are as under:
Discounting rate 14 15 16 17 18
Cumulative factor 3.43 3.35 3.27 3.20 3.13
You are required to CALCULATE the internal rate of return of the proposal.
© The Institute of Chartered Accountants of India

7.35
INVESTMENT DECISIONS
SOLUTION
Computation of Cash inflow per annum (`)
Net operating income per annum 68,000 Less: Tax @ 45% (30,600) Profit after tax 37,400 Add: Depreciation (` 3,60,000 / 5 years) 72,000 Cash inflow 1,09,400
The IRR of the investment can be found as follows:
NPV = −`3,60,000 + `1,09,400 (PVAF5, r) = 0
or PVAF5,r (Cumulative factor) = `
`
3,60,000 =3.291,09,400
Computation of Internal Rate of Return
Discounting Rate 15% 16% Cumulative factor 3.35 3.27 PV of Inflows 3,66,490
(`1,09,400×3.35) 3,57,738
(`1,09,400×3.27) Initial outlay (`) 3,60,000 3,60,000 NPV (`) 6,490 (2,262)
IRR =
6,49015+ =15+0.746,490+2,262
= 15.74%.
Acceptance Rule
The use of IRR, as a criterion to accept capital investment decision involves a comparison of IRR with the required rate of return known as cut off rate. The project should the accepted if IRR is greater than cut-off rate. If IRR is equal to cut off rate the firm is indifferent. If IRR less than cut off rate the project is rejected. Thus,
If IRR ≥ Cut-off Rate or WACC Accept the Proposal
If IRR ≤ Cut-off Rate or WACC Reject the Proposal
© The Institute of Chartered Accountants of India

7.36 FINANCIAL MANAGEMENT
Internal Rate of Return and Mutually Exclusive Projects Projects are called mutually exclusive, when the selection of one precludes the selection of others e.g. in case a company owns a piece of land which can be put to use for either of the two different projects S or L, then such projects are mutually exclusive to each other i.e. the selection of one project necessarily means the rejection of the other. Refer to the figure below:
As long as the cost of capital is greater than the crossover rate of 7%, then (1) NPVS is larger than NPVL and (2) IRRS exceeds IRRL. Hence, if the cut off rate or the cost of capital is greater than 7%, both the methods shall lead to selection of project S. However, if the cost of capital is less than 7%, the NPV method ranks Project L higher, but the IRR method indicates that the Project S is better.
As can be seen from the above discussion, mutually exclusive projects can create problems with the IRR technique because IRR is expressed as a percentage and does not take into account the scale of investment or the quantum of money earned.
Let us consider another example of two mutually exclusive projects A and B with the following details,
Cash flows
Year 0 Year 1 IRR NPV (10%) Project A (` 1,00,000) `1,50,000 50% ` 36,360 Project B (` 5,00,000) ` 6,25,000 25% ` 68,180
© The Institute of Chartered Accountants of India

7.37
INVESTMENT DECISIONS
Project A earns a return of 50% which is more than what Project B earns; however, the NPV of Project B is greater than that of Project A. Acceptance of Project A means that Project B must be rejected since the two Projects are mutually exclusive. Acceptance of Project A also implies that the total investment will be `4,00,000 less than if Project B had been accepted, `4,00,000 being the difference between the initial investment of the two projects. Assuming that the funds are freely available at 10%, the total capital expenditure of the company should be ideally equal to the sum total of all outflows provided they earn more than 10% along with the chosen project from amongst the mutually exclusive. Hence, in case the smaller of the two Projects i.e. Project A is selected, the implication will be of rejecting the investment of additional funds required by the larger investment. This shall lead to a reduction in the shareholders’ wealth and thus, such an action shall be against the very basic tenets of Financial Management.
In the above mentioned example the larger of the two projects had the lower IRR, but nevertheless provided for the wealth maximising choice. However, it is not safe to assume that a choice can be made between mutually exclusive projects using IRR in cases where the larger project also happens to have the higher IRR. Consider the following two Projects A and B with their relevant cash flows;
Year A B (`) (`)
0 (9,00,000) (8,00,000) 1 7,00,000 62,500 2 6,00,000 6,00,000 3 4,00,000 6,00,000 4 50,000 6,00,000
In this case Project A is the larger investment and also has a higher IRR as shown below,
Year (`) r = 46% PV (`) (`) r = 35% PV (`)
0 (9,00,000) 1.0000 (9,00,000) (8,00,000) 1.0000 (8,00,000)
1 7,00,000 0.6849 4,79,430 62,500 0.7407 46,294
2 6,00,000 0.4691 2,81,460 6,00,000 0.5487 3,29,220
3 4,00,000 0.3213 1,28,520 6,00,000 0.4064 2,43,840
© The Institute of Chartered Accountants of India

7.38 FINANCIAL MANAGEMENT
4 50,000 0.2201 11,005 6,00,000 0.3011 1,80,660
(415) 14
IRR of Project A = 46%
IRR of Project B = 35%
However, in case the relevant discounting factor is taken as 5%, the NPV of the two projects provides a different picture as follows;
Project A Project B Year (`) r= 5% PV (`) (`) r= 5% PV (`)
0 (9,00,000) 1.0 (9,00,000) (8,00,000) 1.0 (8,00,000) 1 7,00,000 0.9524 6,66,680 62,500 0.9524 59,525 2 6,00,000 0.9070 5,44,200 6,00,000 0.9070 5,44,200 3 4,00,000 0.8638 3,45,520 6,00,000 0.8638 5,18,280 4 50,000 0.8227 41,135 6,00,000 0.8227 4,93,620 NPV 6,97,535 8,15,625
As may be seen from the above, Project B should be the one to be selected even though its IRR is lower than that of Project A. This decision shall need to be taken in spite of the fact that Project A has a larger investment coupled with a higher IRR as compared with Project B. This type of an anomalous situation arises because of the reinvestment assumptions implicit in the two evaluation methods of NPV and IRR.
7.9.4 Discounted Payback Period Method Some accountants prefer to calculate payback period after discounting the cash flow by a predetermined rate and the payback period so calculated is called, ‘Discounted payback period’. One of the most popular economic criteria for evaluating capital projects also is the payback period. Payback period is the time required for cumulative cash inflows to recover the cash outflows of the project.
This is considered superior to simple payback period method because it takes into account time value of money.
For example, a `30,000 cash outlay for a project with annual cash inflows of `6,000 would have a payback of 5 years (`30,000 / `6,000).
© The Institute of Chartered Accountants of India

7.39
INVESTMENT DECISIONS
The problem with the Payback Period is that it ignores the time value of money. In order to correct this, we can use discounted cash flows in calculating the payback period. Referring back to our example, if we discount the cash inflows at 15% required rate of return we have:
Year Cash Flow PVF@15% PV Cumulative PV 1 6,000 0.870 5,220 5,220
2 6,000 0.756 4,536 9,756
3 6,000 0.658 3,948 13,704
4 6,000 0.572 3,432 17,136
5 6,000 0.497 2,982 20,118
6 6,000 0.432 2,592 22,710
7 6,000 0.376 2,256 24,966
8 6,000 0.327 1,962 26,928
9 6,000 0.284 1,704 28,632
10 6,000 0.247 1,482 30,114 ←
The cumulative total of discounted cash flows after ten years is `30,114. Therefore, our discounted payback is approximately 10 years as opposed to 5 years under simple payback. It should be noted that as the required rate of return increases, the distortion between simple payback and discounted payback grows. Discounted Payback is more appropriate way of measuring the payback period since it considers the time value of money.
7.9.5 The Reinvestment Assumption The Net Present Value technique assumes that all cash flows can be reinvested at the discount rate used for calculating the NPV. This is a logical assumption since the use of the NPV technique implies that all projects which provide a higher return than the discounting factor are accepted.
In contrast, IRR technique assumes that all cash flows are reinvested at the projects IRR. This assumption means that projects with heavy cash flows in the early years will be favoured by the IRR method vis-à-vis projects which have got heavy cash flows in the later years. This implicit reinvestment assumption means that Projects like A, with cash flows concentrated in the earlier years of life will be preferred by the method relative to Projects such as B.
© The Institute of Chartered Accountants of India

7.40 FINANCIAL MANAGEMENT
7.9.6 Multiple Internal Rate of Return In cases where project cash flows change signs or reverse during the life of a project e.g. an initial cash outflow is followed by cash inflows and subsequently followed by a major cash outflow, there may be more than one IRR. The following graph of discount rate versus NPV may be used as an illustration;
In such situations if the cost of capital is less than the two IRR’s, a decision can be made easily, however otherwise the IRR decision rule may turn out to be misleading as the project should only be invested if the cost of capital is between IRR1 and IRR2.. To understand the concept of multiple IRR it is necessary to understand the implicit re-investment assumption in both NPV and IRR techniques.
Advantages of IRR This method makes use of the concept of time value of money.
All the cash flows in the project are considered.
IRR is easier to use as instantaneous understanding of desirability can be determined by comparing it with the cost of capital
IRR technique helps in achieving the objective of maximisation of shareholder’s wealth.
Limitations of IRR The calculation process is tedious if there are more than one cash outflows
interspersed between the cash inflows, there can be multiple IRR, the interpretation of which is difficult.
© The Institute of Chartered Accountants of India
7.41
INVESTMENT DECISIONS
The IRR approach creates a peculiar situation if we compare two projects with different inflow/outflow patterns.
It is assumed that under this method all the future cash inflows of a proposal are reinvested at a rate equal to the IRR. It is ridiculous to imagine that the same firm has a ability to reinvest the cash flows at a rate equal to IRR.
If mutually exclusive projects are considered as investment options which have considerably different cash outlays. A project with a larger fund commitment but lower IRR contributes more in terms of absolute NPV and increases the shareholders’ wealth. In such situation decisions based only on IRR criterion may not be correct.
7.9.7 Modified Internal Rate of Return (MIRR) As mentioned earlier, there are several limitations attached with the concept of the conventional Internal Rate of Return. The MIRR addresses some of these deficiencies e.g., it eliminates multiple IRR rates; it addresses the reinvestment rate issue and produces results which are consistent with the Net Present Value method. This method is also called Terminal Value method.
Under this method, all cash flows, apart from the initial investment, are brought to the terminal value using an appropriate discount rate (usually the Cost of Capital). This results in a single stream of cash inflow in the terminal year. The MIRR is obtained by assuming a single outflow in the zeroth year and the terminal cash inflow as mentioned above. The discount rate which equates the present value of the terminal cash inflow to the zeroth year outflow is called the MIRR.
The decision criterion of MIRR is same as IRR i.e. you accept an investment if MIRR is larger than required rate of return and reject if it is lower than the required rate of return.
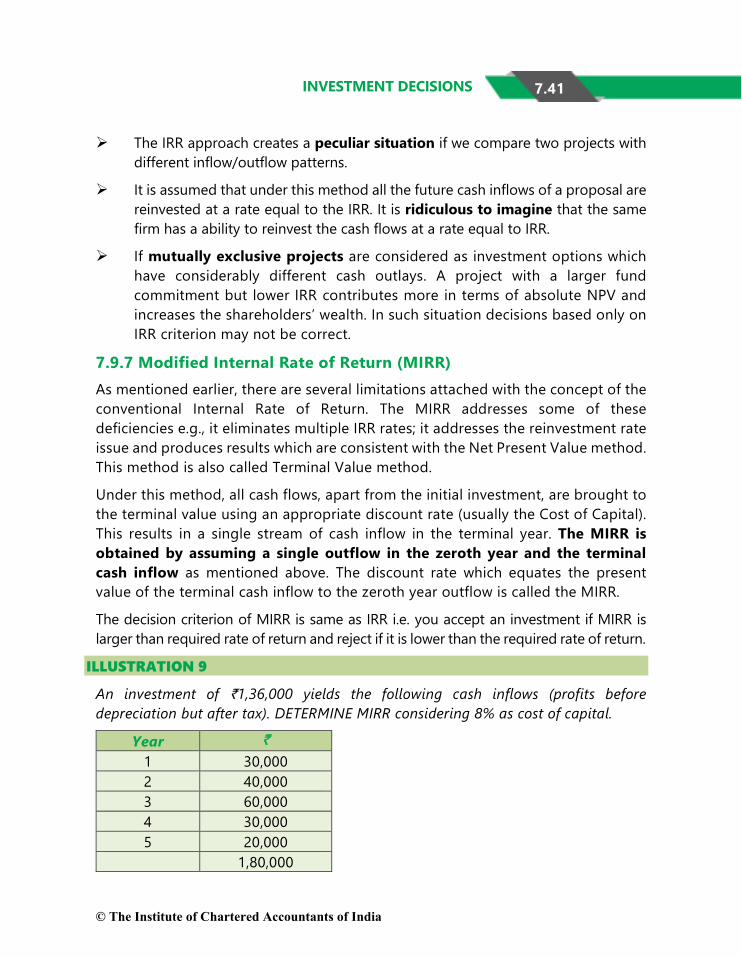
ILLUSTRATION 9
An investment of `1,36,000 yields the following cash inflows (profits before depreciation but after tax). DETERMINE MIRR considering 8% as cost of capital.
Year ` 1 30,000 2 40,000 3 60,000 4 30,000 5 20,000 1,80,000
© The Institute of Chartered Accountants of India

7.42 FINANCIAL MANAGEMENT
SOLUTION
Year- 0 , Cashflow-`1,36,000
The MIRR is calculated on the basis of investing the inflows at the cost of capital. The table below shows the value of the inflows if they are immediately reinvested at 8%.
Year Cash flow @ 8% reinvestment rate factor
`
1 30,000 1.3605* 40,815 2 40,000 1.2597 50,388 3 60,000 1.1664 69,984 4 30,000 1.0800 32,400 5 20,000 1.0000 20,000 2,13,587
* Investment of ` 1 at the end of the year 1 is reinvested for 4 years (at the end of 5 years) shall become 1(1.08)4= 1.3605. Similarly, reinvestment rate factor for remaining years shall be calculated. Please note investment at the end of 5th year shall be reinvested for zero year hence reinvestment rate factor shall be 1.00.
The total cash outflow in year 0 (`1,36,000) is compared with the possible inflow at
year 5 and the resulting figure of 2,13,5871,36,000 = 0.6367 is the discount factor in year
5. By looking at the year 5 row in the present value tables, you will see that this gives a return of 9%. This means that the `2,13,587 received in year 5 is equivalent to `1,36,000 in year 0 if the discount rate is 9%. Alternatively, we can compute MIRR as follows:
Total return = 1,36,0002,13,587 = 1.5705
MIRR = 51
1.5705 - 1 = 9%.
7.9.8 Comparison of Net Present Value and Internal Rate of Return Methods Similarity
Both the net present value and the internal rate of return methods are discounted cash flow methods which mean that they consider the time value of money.
© The Institute of Chartered Accountants of India

7.43
INVESTMENT DECISIONS
Both the techniques consider all cash flows over the expected useful life of the investment.
7.9.9 Different conclusion in the following scenarios There are circumstances/scenarios under which the net present value method and the internal rate of return methods will reach different conclusions. Let’s discuss these scenarios:-
Scenario 1 –Scale or Size Disparity
Being IRR a relative measure and NPV an absolute measure in case of disparity in scale or size both may give contradicting ranking. This can be understood with the help of following illustration:
ILLUSTRATION 10
Suppose there are two Project A and Project B are under consideration. The cash flows associated with these projects are as follows:
Year Project A Project B 0 (1,00,000) (3,00,000) 1 50,000 1,40,000 2 60,000 1,90,000 3 40,000 1,00,000
Assuming Cost of Capital equal to 10% IDENTIFY which project should be accepted as per NPV Method and IRR Method.
SOLUTION
Net Present Value of Projects
Year Cash Inflows
Project A (`)
Cash Inflows
Project B (`)
Present Value
Factor @ 10%
PV of Project A
(`)
PV of Project B
(`)
0 (1,00,000) (3,00,000) 1.000 (1,00,000) (3,00,000) 1 50,000 1,40,000 0.909 45,450 1,27,260 2 60,000 1,90,000 0.826 49,560 1,56,940 3 40,000 1,00,000 0.751 30,040 75,100 25,050 59,300
© The Institute of Chartered Accountants of India

7.44 FINANCIAL MANAGEMENT
Internal Rate of Returns of projects
Since by discounting cash flows at 10% we are getting values very far from zero. Therefore, let us discount cash flows using 20% discounting rate.
Year Cash Inflows
Project A (`)
Cash Inflows
Project B (`)
Present Value
Factor @ 20%
PV of Project A
(`)
PV of Project B
(`)
0 (1,00,000) (3,00,000) 1.000 (1,00,000) (3,00,000) 1 50,000 1,40,000 0.833 41,650 1,16,620 2 60,000 1,90,000 0.694 41,640 1,31,860 3 40,000 1,00,000 0.579 23,160 57,900 6,450 6,380
Since by discounting cash flows at 20% we are getting values far from zero. Therefore, let us discount cash flows using 25% discounting rate.
Year Cash Inflows
Project A (`)
Cash Inflows
Project B (`)
Present Value
Factor @ 25%
PV of Project A
(`)
PV of Project B
(`)
0 (1,00,000) (3,00,000) 1.000 (1,00,000) (3,00,000) 1 50,000 1,40,000 0.800 40,000 1,12,000 2 60,000 1,90,000 0.640 38,400 1,21,600 3 40,000 1,00,000 0.512 20,480 51,200 (1,120) (15,200)
The internal rate of return is, thus, more than 20% but less than 25%. The exact rate can be obtained by interpolation:
IRRA 6,450=20%+ ×(25%-20%)6,450 - (1,120)
=20% +
6,450 × 5%7,570
= 24.26%
IRRB 6,380=20%+ ×(25%-20%)6,380 - (15,200)
= 20% +
6,380 ×5%21,580
= 21.48%
© The Institute of Chartered Accountants of India

7.45
INVESTMENT DECISIONS
Overall Position
Project A Project B
NPV @ 10% 25,050 59,300
IRR 24.26% 21.48%
Thus there is contradiction in ranking by two methods.
Scenario 2 – Time Disparity in Cash Flows
It might be possible that overall cash flows may be more or less same in the projects but there may be disparity in their flows i.e. larger part of cash inflows may be occurred in the beginning or end of the project. In such situation there may be difference in the ranking of projects as per two methods.
ILLUSTRATION 11
Suppose ABC Ltd. is considering two Project X and Project Y for investment. The cash flows associated with these projects are as follows:
Year Project X Project Y
0 (2,50,000) (3,00,000)
1 2,00,000 50,000
2 1,00,000 1,00,000
3 50,000 3,00,000
Assuming Cost of Capital be 10%, IDENTIFY which project should be accepted as per NPV Method and IRR Method.
SOLUTION
Net Present Value of Projects
Year Cash Inflows
Project X (`)
Cash Inflows
Project Y (`)
Present Value
Factor @ 10%
PV of Project X (`)
PV of Project Y (`)
0 (2,50,000) (3,00,000) 1.000 (2,50,000) (3,00,000)
1 2,00,000 50,000 0.909 1,81,800 45,450
© The Institute of Chartered Accountants of India

7.46 FINANCIAL MANAGEMENT
2 1,00,000 1,00,000 0.826 82,600 82,600
3 50,000 3,00,000 0.751 37,550 2,25,300
51,950 53,350
Internal Rate of Returns of projects
Since by discounting cash flows at 10% we are getting values far from zero. Therefore, let us discount cash flows using 20% discounting rate.
Year Cash Inflows
Project X (`)
Cash Inflows
Project Y (`)
Present Value
Factor @ 20%
PV of Project X
(`)
PV of Project Y (`)
0 (2,50,000) (3,00,000) 1.000 (2,50,000) (3,00,000) 1 2,00,000 50,000 0.833 1,66,600 41,650 2 1,00,000 1,00,000 0.694 69,400 69,400 3 50,000 3,00,000 0.579 28,950 1,73,700 14,950 (15,250)
Since by discounting cash flows at 20% we are getting value of Project X is positive and value of Project Y is negative. Therefore, let us discount cash flows of Project X using 25% discounting rate and Project Y using discount rate of 1
Year Cash Inflows
Project X (`)
Present Value Factor @ 25%
PV of Project X
(`)
Cash Inflows
Project Y (`)
Present Value Factor @ 15%
PV of Project Y
(`)
0 (2,50,000) 1.000 (2,50,000) (3,00,000) 1.000 (3,00,000)
1 2,00,000 0.800 1,60,000 50,000 0.870 43,500
2 1,00,000 0.640 64,000 1,00,000 0.756 75,600
3 50,000 0.512 25,600 3,00,000 0.658 1,97,400
(400) 16,500
© The Institute of Chartered Accountants of India

7.47
INVESTMENT DECISIONS
The internal rate can be obtained by interpolation:
IRRX 14,950=20%+ ×(25%-20%)14,950 - (400)
= 20% +
14,950 × 5%15,350
= 24.87%
IRRB 16,500=15%+ ×(20%-15%)16,500 - (15,250)
=15% +
16,500 ×5%31,750
= 17.60%
Overall Position
Project A Project B
NPV @ 10% 51,950 53,350
IRR 24.87% 17.60%
Thus there is contradiction in ranking by two methods.
Scenario 3 – Disparity in life of Proposals (Unequal Lives)
Conflict in ranking may also arise if we are comparing two projects (especially mutually exclusive) having unequal lives.
ILLUSTRATION 12
Suppose MVA Ltd. is considering two Project A and Project B for investment. The cash flows associated with these projects are as follows:
Year Project A Project B
0 (5,00,000) (5,00,000)
1 7,50,000 2,00,000
2 0 2,00,000
3 0 7,00,000
Assuming Cost of Capital equal to 12%, ANALYSE which project should be accepted as per NPV Method and IRR Method?
© The Institute of Chartered Accountants of India

7.48 FINANCIAL MANAGEMENT
SOLUTION
Net Present Value of Projects
Year Cash Inflows
Project A (`)
Cash Inflows
Project B (`)
Present Value
Factor @ 12%
PV of Project A
(`)
PV of Project B
(`)
0 (5,00,000) (5,00,000) 1.000 (5,00,000) (5,00,000)
1 7,50,000 2,00,000 0.893 6,69,750 1,78,600
2 0 2,00,000 0.797 0 1,59,400
3 0 7,00,000 0.712 0 4,98,400
1,69,750 3,36,400
Internal Rate of Returns of projects
Let us discount cash flows using 50% discounting rate.
Year Cash Inflows
Project A (`)
Cash Inflows
Project B (`)
Present Value
Factor @ 50%
PV of Project A
(`)
PV of Project B
(`)
0 (5,00,000) (5,00,000) 1.000 (5,00,000) (5,00,000) 1 7,50,000 2,00,000 0.667 5,00,250 1,33,400 2 0 2,00,000 0.444 0 88,800 3 0 7,00,000 0.296 0 2,07,200 250 (70,600)
Since, IRR of project A shall be 50% as NPV is very small. Further, by discounting cash flows at 50% we are getting NPV of Project B negative, let us discount cash flows of Project B using 15% discounting rate.
Year Cash Inflows Project B (`)
Present Value Factor @ 15%
PV of Project B (`)
0 (5,00,000) 1.000 (5,00,000) 1 2,00,000 0.870 1,74,000 2 2,00,000 0.756 1,51,200
© The Institute of Chartered Accountants of India

7.49
INVESTMENT DECISIONS
3 7,00,000 0.658 4,60,600 2,85,800
The internal rate can be obtained by interpolation:
IRRB 2,85,800=15%+ ×(50%-15%)2,85,800 - (70,600)
= 15% +
2,85,800 ×35%3,56,400
= 43.07%
Overall Position
Project A Project B
NPV @ 10% 1,69,750 3,36,400 IRR 50.00% 43.07%
Thus there is contradiction in ranking by two methods.
7.10 SUMMARY OF DECISION CRITERIA OF CAPITAL BUDGETING TECHNIQUES
Techniques For Independent Project For Mutually Exclusive Projects
Non-Discounted
Pay Back (i) When Payback period ≤ Maximum Acceptable Payback period: Accepted
(ii) When Payback period ≥ Maximum Acceptable Payback period: Rejected
Project with least Payback period should be selected
Accounting Rate of Return(ARR)
(i) When ARR≥ Minimum Acceptable Rate of Return: Accepted
(ii) When ARR ≤ Minimum Acceptable Rate of Return: Rejected
Project with the maximum ARR should be selected.
© The Institute of Chartered Accountants of India

7.50 FINANCIAL MANAGEMENT
Discounted Net Present Value (NPV)
(i) When NPV > 0: Accepted (ii) When NPV < 0: Rejected
Project with the highest positive NPV should be selected
Profitability Index(PI)
(i) When PI > 1: Accepted (ii) When PI<1:Rejected
When Net Present Value is same project with Highest PI should be selected
Internal Rate of Return (IRR)
(i) When IRR >K: Accepted (ii) When IRR <K: Rejected
Project with the maximum IRR should be selected
7.11 SPECIAL CASES 7.11.1 Capital Budgeting under Capital Rationing As discussed earlier, if project has positive NPV it should be accepted with an objective of maximisation of wealth of shareholders. However, there may be a situation due to resource (capital) constraints (rationing) a firm may have to select some projects among various projects, all having positive NPVs. Broadly two scenarios may influence the method of evaluation to be adopted.
(i) If projects are independent of each other and are divisible in nature: In such situation NPV Rule should be modified and accordingly projects should be ranked on the basis of ‘NPV per rupee of Capital ’method.
(ii) If projects are not divisible: In such situation projects shall be ranked on the basis of absolute NPV and should be mixed up to the point available resources are exhausted.
ILLUSTRATION 13
Shiva Limited is planning its capital investment programme for next year. It has five projects all of which give a positive NPV at the company cut-off rate of 15 percent, the investment outflows and present values being as follows:
© The Institute of Chartered Accountants of India

7.51
INVESTMENT DECISIONS
Project Investment NPV @ 15% `000 `000
A (50) 15.4
B (40) 18.7
C (25) 10.1
D (30) 11.2
E (35) 19.3
The company is limited to a capital spending of `1,20,000.
You are required to ILLUSTRATE the returns from a package of projects within the capital spending limit. The projects are independent of each other and are divisible (i.e., part-project is possible).
SOLUTION
Computation of NPVs per ` 1 of Investment and Ranking of the Projects
Project Investment NPV @ 15% NPV per `1 invested
Ranking `'000 `'000
A (50) 15.4 0.31 5 B (40) 18.7 0.47 2 C (25) 10.1 0.40 3 D (30) 11.2 0.37 4 E (35) 19.3 0.55 1
Building up of a Programme of Projects based on their Rankings
Project Investment NPV @ 15% `000 `000
E (35) 19.3 B (40) 18.7 C (25) 10.1 D (20) 7.5 (2/3 of project total) 120 55.6
© The Institute of Chartered Accountants of India

7.52 FINANCIAL MANAGEMENT
Thus Project A should be rejected and only two-third of Project D be undertaken. If the projects are not divisible then other combinations can be examined as:
Investment NPV @ 15% ` 000 `000
E + B + C 100 48.1 E + B + D 105 49.2
In this case E + B + D would be preferable as it provides a higher NPV despite D ranking lower than C.
7.11.2 Projects with unequal lives Sometimes firm may be faced with any of the following problems:
(i) Retaining an old asset or replace it with new one.
(ii) Choosing one proposal among two proposals (Mutually Exclusive).
Although, while evaluating the proposals the above scenarios do not pose any special problem if they have same life period. But problem arises in case projects have unequal lives. In such situations we can deal with the problem by following any of the following method:
(i) Replacement Chain Method
(ii) Equivalent Annualized Criterion
These two methods can be understood with the help of following illustration.
ILLUSTRATION 14
R plc is considering modernizing its production facilities and it has two proposals under consideration. The expected cash flows associated with these projects and their NPV as per discounting rate of 12% and IRR is as follows:
Year Cash Flow
Project A (`) Project B (`)
0 (40,00,000) (20,00,000) 1 8,00,000 7,00,000 2 14,00,000 13,00,000 3 13,00,000 12,00,000
© The Institute of Chartered Accountants of India

7.53
INVESTMENT DECISIONS
4 12,00,000 0 5 11,00,000 0 6 10,00,000 0
NPV @12% 6,49,094 5,15,488 IRR 17.47% 25.20%
IDENTIFY which project should R plc accept?
SOLUTION
Although from NPV point of view Project A appears to be better but from IRR point of view Project B appears to be better. Since, both projects have unequal lives selection on the basis of these two methods shall not be proper. In such situation we shall use any of the following method:
(i) Replacement Chain (Common Life) Method: Since the life of the Project A is 6 years and Project B is 3 years to equalize lives we can have second opportunity of investing in project B after one time investing. The position of cash flows in such situation shall be as follows:
NPV of extended life of 6 years of Project B shall be `8,82,403 and IRR of 25.20%. Accordingly, with extended life NPV of Project B it appears to be more attractive.
(ii) Equivalent Annualized Criterion: The method discussed above has one drawback when we have to compare two projects one has a life of 3 years and other has 5 years. In such case the above method shall require analysis of a period of 15 years i.e. common multiple of these two values. The simple solution to this problem is use of Equivalent Annualised Criterion involving following steps:
(a) Compute NPV using the WACC or discounting rate.
(b) Compute Present Value Annuity Factor (PVAF) of discounting factor used above for the period of each project.
(c) Divide NPV computed under step (a) by PVAF as computed under step (b) and compare the values.
© The Institute of Chartered Accountants of India

7.54 FINANCIAL MANAGEMENT
Accordingly, for proposal under consideration:
Project A Project B NPV @ 12% ` 6,49,094 `5,15,488 PVAF @12% 4.112 2.402 Equivalent Annualized Criterion `1,57,854 `2,14,608
Thus, Project B should be selected.
ILLUSTRATION 15
Alpha Company is considering the following investment projects:
Cash Flows (`)
Projects C0 C1 C2 C3
A -10,000 +10,000
B -10,000 +7,500 +7,500
C -10,000 +2,000 +4,000 +12,000
D -10,000 +10,000 +3,000 +3,000
(a) ANALYSE the rank the projects according to each of the following methods: (i) Payback, (ii) ARR, (iii) IRR and (iv) NPV, assuming discount rates of 10 and 30 per cent.
(b) Assuming the projects are independent, which one should be accepted? If the projects are mutually exclusive, IDENTIFY which project is the best?
SOLUTION
(a) (i) Payback Period
Project A : 10,000/10,000 = 1 year
Project B: 10,000/7,500 = 1 1/3 years.
Project C: =−
+12,000
6,00010,000 years2 years312
Project D: 1 year.
(ii) ARR
Project A : (10,000-10,000)1/ 2 = 0(10,000)1/ 2
© The Institute of Chartered Accountants of India

7.55
INVESTMENT DECISIONS
Project B : (15,000-10,000)1/ 2 2,500= =50%(10,000)1/ 2 5,000
Project C: (18,000-10,000)1/ 3 2,667= =53%(10,000)1/ 2 5,000
Project D: (16,000-10,000)1/ 3 2,000= = 40%(10,000)1/ 2 5,000
Note: This net cash proceed includes recovery of investment also. Therefore, net cash earnings are found by deducting initial investment.
(iii) IRR
Project A: The net cash proceeds in year 1 are just equal to investment. Therefore, r = 0%.
Project B: This project produces an annuity of ̀ 7,500 for two years. Therefore, the required PVAF is: 10,000/7,500 = 1.33. This factor is found under 32% column. Therefore, r = 32%
Project C: Since cash flows are uneven, the trial and error method will be followed. Using 20% rate of discount the NPV is + ̀ 1,389. At 30% rate of discount, the NPV is -`633. The true rate of return should be less than 30%. At 27% rate of discount it is found that the NPV is -`86 and at 26% +`105. Through interpolation, we find r = 26.5%
Project D: In this case also by using the trial and error method, it is found that at 37.6% rate of discount NPV becomes almost zero. Therefore, r = 37.6%.
(iv) NPV Project A: at 10% -10,000+10,000×0.909 = -910 at 30% -10,000+10,000×0.769 = -2,310 Project B:
at 10% -10,000+7,500(0.909+0.826) = 3,013
at 30% -10,000+7,500(0.769+0.592)= +208
© The Institute of Chartered Accountants of India

7.56 FINANCIAL MANAGEMENT
Project C:
at 10% -10,000+2,000×0.909+4,000×0.826+12,000×0.751= +4,134
at 30% -10,000+2,000×0.769+4,000×0.592+12,000×0.455 =-633 Project D:
at 10% -10,000+10,000×0.909+3,000×(0.826+0.751) =+ 3,821
at 30% -10,000+10,000×0.769+3,000×(0.592+0.455) = + 831
The projects are ranked as follows according to the various methods:
Ranks Projects PBP ARR IRR NPV
(10%) NPV
(30%) A 1 4 4 4 4 B 2 2 2 3 2 C 3 1 3 1 3 D 1 3 1 2 1
(b) Payback and ARR are theoretically unsound method for choosing between the investment projects. Between the two time-adjusted (DCF) investment criteria, NPV and IRR, NPV gives consistent results. If the projects are independent (and there is no capital rationing), either IRR or NPV can be used since the same set of projects will be accepted by any of the methods. In the present case, except Project A all the three projects should be accepted if the discount rate is 10%. Only Projects B and D should be undertaken if the discount rate is 30%.
If it is assumed that the projects are mutually exclusive, then under the assumption of 30% discount rate, the choice is between B and D (A and C are unprofitable). Both criteria IRR and NPV give the same results – D is the best. Under the assumption of 10% discount rate, ranking according to IRR and NPV conflict (except for Project A). If the IRR rule is followed, Project D should be accepted. But the NPV rule tells that Project C is the best. The NPV rule generally gives consistent results in conformity with the wealth maximization principle. Therefore, Project C should be accepted following the NPV rule.
ILLUSTRATION 16
The expected cash flows of three projects are given below. The cost of capital is 10 per cent.
© The Institute of Chartered Accountants of India

7.57
INVESTMENT DECISIONS
(a) CALCULATE the payback period, net present value, internal rate of return and accounting rate of return of each project.
(b) IDENTIFY the rankings of the projects by each of the four methods.
(figures in ‘000)
Period Project A (`) Project B (`) Project C (`)
0 (5,000) (5,000) (5,000)
1 900 700 2,000
2 900 800 2,000
3 900 900 2,000
4 900 1,000 1,000
5 900 1,100
6 900 1,200
7 900 1,300
8 900 1,400
9 900 1,500
10 900 1,600
SOLUTION
(a) Payback Period Method:
A = 5 + (500/900) = 5.56 years
B = 5 + (500/1,200) = 5.42 years
C = 2 + (1,000/2,000) = 2.5 years
Net Present Value Method:
NPVA = (− 5,000) + (900×6.145) = (5,000) + 5,530.5 = `530.5
NPVB is calculated as follows:
Year Cash flow (`) 10% discount factor Present value (`) 0 (5000) 1.000 (5,000) 1 700 0.909 636 2 800 0.826 661
© The Institute of Chartered Accountants of India

7.58 FINANCIAL MANAGEMENT
3 900 0.751 676 4 1000 0.683 683 5 1100 0.621 683 6 1200 0.564 677 7 1300 0.513 667 8 1400 0.467 654 9 1500 0.424 636 10 1600 0.386 618
1591
NPVC is calculated as follows:
Year Cash flow (`) 10% discount factor Present value (`) 0 (5000) 1.000 (5,000) 1 2000 0.909 1,818 2 2000 0.826 1,652 3 2000 0.751 1,502 4 1000 0.683 683 655
Internal Rate of Return
NPV at 12% = (5,000) + 900×5.650
= (5,000) + 5085= 85
NPV at 13% = (5,000) + 900×5.426
= (5,000) + 4,883.40= -116.60
IRRA =
8512+ ×(13-12) =12+0.4285+116.60
IRRA = 12.42%.
© The Institute of Chartered Accountants of India

7.59
INVESTMENT DECISIONS
IRRB
Year Cash flow (`)
10% discount
factor
Present value
(`)
20% discount
factor
Present value (`)
0 (5,000) 1.000 (5,000) 1.000 (5,000) 1 700 0.909 636 0.833 583 2 800 0.826 661 0.694 555 3 900 0.751 676 0.579 521 4 1,000 0.683 683 0.482 482 5 1,100 0.621 683 0.402 442 6 1,200 0.564 677 0.335 402 7 1,300 0.513 667 0.279 363 8 1,400 0.467 654 0.233 326 9 1,500 0.424 636 0.194 291 10 1,600 0.386 618 0.162 259
1,591 (776)
Interpolating: IRRB= 10% 1,591 + × (20%-10%) = 10% + 6.72% = 16.72%(1,591 + 776)
IRRC
Year Cash flow (`)
15% discount
factor
Present value
(`)
18% discount
factor
Present value (`)
0 (5,000) 1.000 (5,000) 1.000 (5,000) 1 2,000 0.870 1,740 0.847 1,694 2 2,000 0.756 1,512 0.718 1,436 3 2,000 0.658 1,316 0.609 1,218 4 1,000 0.572 572 0.516 516 140 (136)
Interpolating: IRRC = 140 15% + × (18%-15%) = 15% + 1.52% = 16.52%(140 + 136)
© The Institute of Chartered Accountants of India

7.60 FINANCIAL MANAGEMENT
Accounting Rate of Return:
ARRA: Average capital employed = 5,000 = 2,5002
`
Average accounting profit = (9,000 5,000) 40010−
=
`
ARRA = (400 × 100) = 16 per cent2,500
ARRB: Average accounting profit = (11,500 5,000) 65010−
=
`
ARRB = (650 × 100) = 26 per cent2,500
ARRC: Average accounting profit = (7,000 5,000) 5004−
=
`
ARRC =(500 × 100) = 20 per cent
2,500
(b) Summary of Results
Project A B C Payback (years) 5.5 5.4 2.5 ARR (%) 16 26 20 IRR (%) 12.42 16.72 16.52 NPV (`) 530.50 1,591 655
Comparison of Rankings
Method Payback ARR IRR NPV 1 C B B B 2 B C C C 3 A A A A
© The Institute of Chartered Accountants of India

7.61
INVESTMENT DECISIONS
SUMMARY ♦ Capital budgeting is the process of evaluating and selecting long-term
investments that are in line with the goal of investor’s wealth maximization.
♦ The capital budgeting decisions are important, crucial and critical business decisions due to substantial expenditure involved; long period for the recovery of benefits; irreversibility of decisions and the complexity involved in capital investment decisions.
♦ One of the most important tasks in capital budgeting is estimating future cash flows for a project. The final decision we make at the end of the capital budgeting process is no better than the accuracy of our cash-flow estimates.
♦ Tax payments like other payments must be properly deducted in deriving the cash flows. That is, cash flows must be defined in post-tax terms.
♦ There are a number of capital budgeting techniques available for appraisal of investment proposals and can be classified as traditional (non-discounted) and time-adjusted (discounted).
♦ The most common traditional capital budgeting techniques are Payback Period and Accounting (Book) Rate of Return.
flow cash net tax-after expected Annual
investment capital initial Total periodPayback =
investment Initial
flow in cash Annual Average ReciprocalPayback =
♦ Accounting (Book) Rate of Return (ARR) or Average Rate of Return (ARR):
Accounting rate of return = Average annual net incomeInvestment
♦ Net Present Value Technique (NPV):
Net present value = Present value of cash inflows - Present value of cash outflows
31 2 n2 3 n
CC C CNPV = + + + ......+ - I(1+ k) (1+ k) (1+ k) (1+ k)
♦ Profitability Index /Desirability Factor/Present Value Index Method (PI):
Profitability Index (PI) = Sum of discounted cash in flows Initial cash outlay or Total discounted cash outflow (as the case may)
© The Institute of Chartered Accountants of India

7.62 FINANCIAL MANAGEMENT
♦ Internal Rate of Return Method (IRR):
NPV at LRLR+ ×(HR -LR)NPV at LR - NPV at HR
♦ Modified Internal Rate of Return (MIRR): All cash flows, apart from the initial investment, are brought to the terminal value using an appropriate discount rate (usually the Cost of Capital).
TEST YOUR KNOWLEDGE MCQs based Questions 1. A capital budgeting technique which does not require the computation of cost
of capital for decision making purposes is,
(a) Net Present Value method
(b) Internal Rate of Return method
(c) Modified Internal Rate of Return method
(d) Pay back
2. If two alternative proposals are such that the acceptance of one shall exclude the possibility of the acceptance of another then such decision making will lead to,
(a) Mutually exclusive decisions
(b) Accept reject decisions
(c) Contingent decisions
(d) None of the above
3. In case a company considers a discounting factor higher than the cost of capital for arriving at present values, the present values of cash inflows will be
(a) Less than those computed on the basis of cost of capital
(b) More than those computed on the basis of cost of capital
(c) Equal to those computed on the basis of the cost of capital
(d) None of the above
4. The pay back technique is specially useful during times
(a) When the value of money is turbulent
(b) When there is no inflation
© The Institute of Chartered Accountants of India

7.63
INVESTMENT DECISIONS
(c) When the economy is growing at a steady rate coupled with minimal inflation.
(d) None of the above
5. While evaluating capital investment proposals, time value of money is used in which of the following techniques,
(a) Payback method
(b) Accounting rate of return
(c) Net present value
(d) None of the above
6. IRR would favour project proposals which have,
(a) Heavy cash inflows in the early stages of the project.
(b) Evenly distributed cash inflows throughout the project.
(c) Heavy cash inflows at the later stages of the project
(d) None of the above.
7. The re- investment assumption in the case of the IRR technique assumes that,
(a) Cash flows can be re- invested at the projects IRR
(b) Cash flows can be re- invested at the weighted cost of capital
(c) Cash flows can be re- invested at the marginal cost of capital
(d) None of the above
8. Multiple IRRs are obtained when,
(a) Cash flows in the early stages of the project exceed cash flows during the later stages.
(b) Cash flows reverse their signs during the project
(c) Cash flows are uneven
(d) None of the above.
9. Depreciation is included as a cost in which of the following techniques,
(a) Accounting rate of return
(b) Net present value
© The Institute of Chartered Accountants of India

7.64 FINANCIAL MANAGEMENT
(c) Internal rate of return
(d) None of the above
10. Management is considering a ̀ 1,00,000 investment in a project with a 5 year life and no residual value . If the total income from the project is expected to be ` 60,000 and recognition is given to the effect of straight line depreciation on the investment, the average rate of return is :
(a) 12%
(b) 24%
(c) 60%
(d) 75%
11. Assume cash outflow equals ` 1,20,000 followed by cash inflows of ` 25,000 per year for 8 years and a cost of capital of 11%. What is the Net present value?
(a) (` 38,214)
(b) ` 9,653
(c) ` 8,653
(d) ` 38,214
12. What is the Internal rate of return for a project having cash flows of ` 40,000 per year for 10 years and a cost of ` 2,26,009?
(a) 8%
(b) 9%
(c) 10%
(d) 12%
13. While evaluating investments, the release of working capital at the end of the projects life should be considered as,
(a) Cash in flow
(b) Cash out flow
(c) Having no effect upon the capital budgeting decision
(d) None of the above.
© The Institute of Chartered Accountants of India

7.65
INVESTMENT DECISIONS
14. Capital rationing refers to a situation where,
(a) Funds are restricted and the management has to choose from amongst available alternative investments.
(b) Funds are unlimited and the management has to decide how to allocate them to suitable projects.
(c) Very few feasible investment proposals are available with the management.
(d) None of the above
15. Capital budgeting is done for
(a) Evaluating short term investment decisions.
(b) Evaluating medium term investment decisions.
(c) Evaluating long term investment decisions.
(d) None of the above
Theoretical Questions 1. DISCUSS the various technique of capital budgeting.
2. DISCUSS NPV. How it is calculated?
3. DISCUSS in detail the ‘Capital Budgeting Process.
4. CLASSIFY various types of Capital Investment decisions known to you.
5. DESCRIBE the advantage and disadvantage of profitability of index.
6. DESCRIBE MIRR.
Practical Problems 1. Lockwood Limited wants to replace its old machine with a new automatic
machine. Two models A and B are available at the same cost of `5 lakhs each. Salvage value of the old machine is `1 lakh. The utilities of the existing machine can be used if the company purchases A. Additional cost of utilities to be purchased in that case are ̀ 1 lakh. If the company purchases B then all the existing utilities will have to be replaced with new utilities costing `2 lakhs. The salvage value of the old utilities will be `0.20 lakhs. The earnings after taxation are expected to be:
© The Institute of Chartered Accountants of India

7.66 FINANCIAL MANAGEMENT
(cash in-flows of) Year A
`
B `
P.V. Factor @ 15%
1 1,00,000 2,00,000 0.87 2 1,50,000 2,10,000 0.76 3 1,80,000 1,80,000 0.66 4 2,00,000 1,70,000 0.57 5 1,70,000 40,000 0.50
Salvage Value at the end of Year 5
50,000 60,000
The targeted return on capital is 15%. You are required to (i) COMPUTE, for the two machines separately, net present value, discounted payback period and desirability factor and (ii) ADVICE which of the machines is to be selected?
2. Hindlever Company is considering a new product line to supplement its range of products. It is anticipated that the new product line will involve cash investments of ̀ 7,00,000 at time 0 and ̀ 10,00,000 in year 1. After-tax cash inflows of ̀ 2,50,000 are expected in year 2, `3,00,000 in year 3, `3,50,000 in year 4 and `4,00,000 each year thereafter through year 10. Although the product line might be viable after year 10, the company prefers to be conservative and end all calculations at that time.
(a) If the required rate of return is 15 per cent, COMPUTE net present value of the project? Is it acceptable?
(b) ANALYSE What would be the case if the required rate of return were 10 per cent?
(c) CALCULATE its internal rate of return?
(d) COMPUTE the project’s payback period?
3. Elite Cooker Company is evaluating three investment situations: (1) produce a new line of aluminium skillets, (2) expand its existing cooker line to include several new sizes, and (3) develop a new, higher-quality line of cookers. If only the project in question is undertaken, the expected present values and the amounts of investment required are:
© The Institute of Chartered Accountants of India

7.67 INVESTMENT DECISIONS
Project Investment required
Present value of Future Cash-Flows
` `
1 2,00,000 2,90,000 2 1,15,000 1,85,000 3 2,70,000 4,00,000
If projects 1 and 2 are jointly undertaken, there will be no economies; the investments required and present values will simply be the sum of the parts. With projects 1 and 3, economies are possible in investment because one of the machines acquired can be used in both production processes. The total investment required for projects 1 and 3 combined is `4,40,000. If projects 2 and 3 are undertaken, there are economies to be achieved in marketing and producing the products but not in investment. The expected present value of future cash flows for projects 2 and 3 is `6,20,000. If all three projects are undertaken simultaneously, the economies noted will still hold. However, a `1,25,000 extension on the plant will be necessary, as space is not available for all three projects. ANALYSE which project or projects should be chosen?
4. Cello Limited is considering buying a new machine which would have a usefuleconomic life of five years, a cost of `1,25,000 and a scrap value of `30,000, with80 per cent of the cost being payable at the start of the project and 20 per centat the end of the first year. The machine would produce 50,000 units per annumof a new product with an estimated selling price of `3 per unit. Direct costswould be ̀ 1.75 per unit and annual fixed costs, including depreciation calculatedon a straight- line basis, would be `40,000 per annum.
In the first year and the second year, special sales promotion expenditure, notincluded in the above costs, would be incurred, amounting to `10,000 and`15,000 respectively.
ANALYSE the project using the NPV method of investment appraisal, assumingthe company’s cost of capital to be 10 percent.
© The Institute of Chartered Accountants of India

7.68 FINANCIAL MANAGEMENT
ANSWERS/SOLUTIONS Answers to the MCQs based Questions
1. (d) 2. (a) 3. (a) 4. (a) 5. (c) 6. (a) 7. (a) 8. (b) 9. (a) 10. (b) 11. (c) 12. (d)
13. (a) 14. (a) 15. (c)
Answers to the Theoretical Questions 1. Please refer paragraph 7.7
2. Please refer paragraph 7.9.1
3. Please refer paragraph 7.3
4. Please refer paragraph 7.4
5. Please refer paragraph 7.9.2.
6. Please refer paragraph 7.12.
Answers to the Practical Problems 1. (i) Expenditure at year zero (` in lakhs)
Particulars A B Cost of Machine 5.00 5.00 Cost of Utilities 1.00 2.00 Salvage of Old Machine (1.00) (1.00) Salvage of Old Utilities – (0.20) Total Expenditure (Net) 5.00 5.80
(ii) Discounted Value of Cash inflows
(`in lakhs)
Machine A Machine B Year NPV
Factor @ 15%
Cash inflows
Discounted value of inflows
Cash Flows
Discounted value of inflows
0 1.00 (5.00) (5.00) (5.80) (5.80) 1 0.87 1.00 0.87 2.00 1.74
© The Institute of Chartered Accountants of India

7.69
INVESTMENT DECISIONS
2 0.76 1.50 1.14 2.10 1.60 3 0.66 1.80 1.19 1.80 1.19 4 0.57 2.00 1.14 1.70 0.97 5 0.50 1.70 0.85 0.40 0.20
Salvage 0.50 0.50 0.25 0.60 0.30 Net Present Value
5.44 (+)0.44
6.00 (+)0.20
Since the Net present Value of both the machines is positive both are acceptable.
(iii) Discounted Pay-back Period (` in lakhs)
Machine A Machine B Year Discounted cash
inflows Cumulative Discounted cash inflows
Discounted cash inflows
Cumulative Discounted
cash inflows
1 0.87 0.87 1.74 1.74 2 1.14 2.01 1.60 3.34 3 1.19 3.20 1.19 4.53 4 1.14 4.34 0.97 5.50 5 1.10* 5.44 0.50 6.00
* Includes salvage value
Discounted Payback Period (For A and B):
Machine A = 4 years + 0.661.10
= 4.6 years
Machine B = 4 years + 0.300.50
= 4.6 years
Profitability Index (PI) =outlay cash Initial
inflow cash net of valuepresent of Sum
Machine A = `
`c
5.44 lakhs5.00 lakhs
=1.088 Machine B = `
`
6.00 lakhs5.80 * lakhs
= 1.034
© The Institute of Chartered Accountants of India

7.70 FINANCIAL MANAGEMENT
*[Cost of Machine B = Purchase cost + Incremental cost (Additional utilities cost less recoverable value of utilities)] = [5,00,000+(2,00,000-1,00,000-20,000)]
(iv) Since the absolute surplus in the case of A is more than B and also the desirabilityfactor, it is better to choose A.
The discounted payback period in both the cases is same, also the net presentvalue is positive in both the cases but the desirability factor (profitability index)is higher in the case of Machine A, it is therefore better to choose Machine A.
2. (a)
Year Cash flow Discount Factor (15%)
Present value
(`) (`)
0 (7,00,000) 1.000 (7,00,000) 1 (10,00,000) 0.870 (8,70,000) 2 2,50,000 0.756 1,89,000 3 3,00,000 0.658 1,97,400 4 3,50,000 0.572 2,00,200
5−10 4,00,000 2.163 8,65,200 Net Present Value (1,18,200)
As the net present value is negative, the project is unacceptable.
(b) Similarly, NPV at 10% discount rate can be computed as follows:
Year Cash flow Discount Factor (10%)
Present value
(`) (`)
0 (7,00,000) 1.000 (7,00,000) 1 (10,00,000) 0.909 (9,09,000) 2 2,50,000 0.826 2,06,500 3 3,00,000 0.751 2,25,300 4 3,50,000 0.683 2,39,050
5−10 4,00,000 2.974 11,89,600 Net Present Value 2,51,450
Since NPV = `2,51,450 is positive, hence the project would be acceptable.
© The Institute of Chartered Accountants of India

7.71 INVESTMENT DECISIONS
(c) IRR = NPVatLRLR+ ×(HR -LR)NPVatLR-NPVatHR
= 10% + ` `
2,51,450 ×(15%-10%)2,51,450-(-)1,18,200
= 10% + 3.4012 or 13.40%
(d) Payback Period = 6 years:
−`7,00,000−`10,00,000 + `2,50,000 + `3,00,000 + `3,50,000 + `4,00,000 +`4,00,000 = 0
3.
Project Investment Required
Present value of Future Cash
Flows
Net Present value
` ` `
1 2,00,000 2,90,000 90,000 2 1,15,000 1,85,000 70,000 3 2,70,000 4,00,000 1,30,000
1 and 2 3,15,000 4,75,000 1,60,000 1 and 3 4,40,000 6,90,000 2,50,000 2 and 3 3,85,000 6,20,000 2,35,000
1, 2 and 3 (Refer Working note)
6,80,000* 9,10,000 2,30,000
Working Note:
(i) Total Investment required if all the three projects are undertakensimultaneously:
(`) Project 1& 3 4,40,000 Project 2 1,15,000 Plant extension cost 1,25,000 Total 6,80,000
© The Institute of Chartered Accountants of India
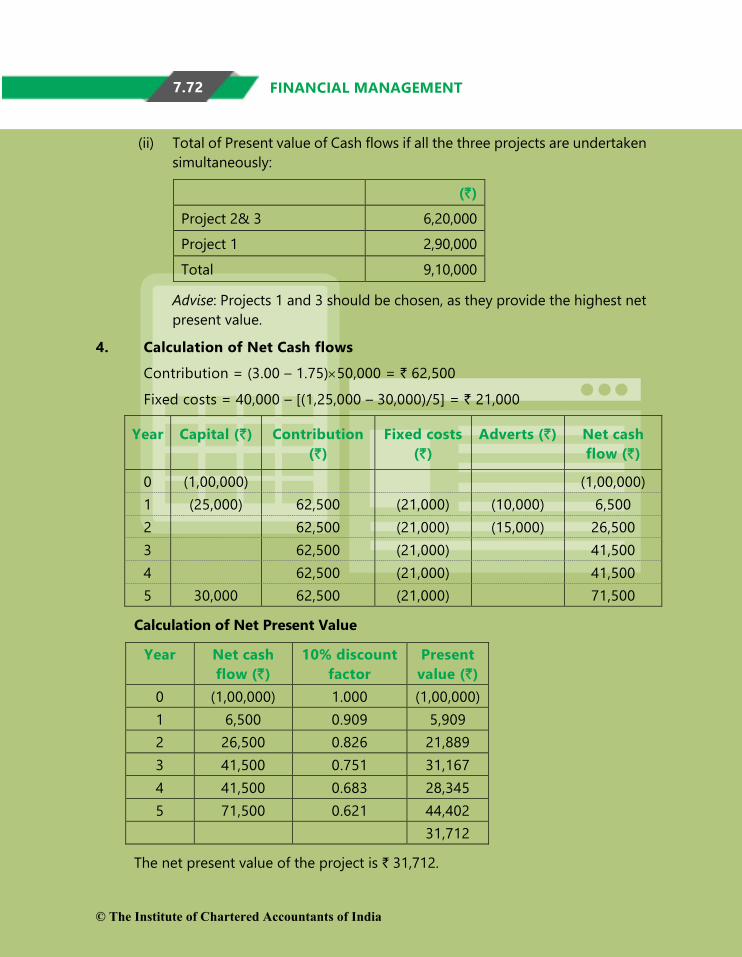
7.72 FINANCIAL MANAGEMENT
(ii) Total of Present value of Cash flows if all the three projects are undertakensimultaneously:
(`) Project 2& 3 6,20,000 Project 1 2,90,000 Total 9,10,000
Advise: Projects 1 and 3 should be chosen, as they provide the highest net present value.
4. Calculation of Net Cash flows
Contribution = (3.00 – 1.75)×50,000 = ` 62,500
Fixed costs = 40,000 – [(1,25,000 – 30,000)/5] = ` 21,000
Year Capital (`) Contribution (`)
Fixed costs (`)
Adverts (`) Net cash flow (`)
0 (1,00,000) (1,00,000) 1 (25,000) 62,500 (21,000) (10,000) 6,500 2 62,500 (21,000) (15,000) 26,500 3 62,500 (21,000) 41,500 4 62,500 (21,000) 41,500 5 30,000 62,500 (21,000) 71,500
Calculation of Net Present Value
Year Net cash flow (`)
10% discount factor
Present value (`)
0 (1,00,000) 1.000 (1,00,000) 1 6,500 0.909 5,909 2 26,500 0.826 21,889 3 41,500 0.751 31,167 4 41,500 0.683 28,345 5 71,500 0.621 44,402
31,712
The net present value of the project is ` 31,712.
© The Institute of Chartered Accountants of India