Embed Size (px)
Citation preview

Privileged and confidential – do not distribute externally
Insights for evaluating lifetime value for game developersGoogle Play Developer Communications
Written by Ignacio Monereo
Privileged and confidential – do not distribute externally

Privileged and confidential – do not distribute externally
Table of contents
1. Use your data to take the right decisions
2. Lifetime value in games
3. Popular ways of calculating LTV in mobile gaming
4. Other things to consider when calculating LTV in games
5. Conclusion
6. Additional resources
Privileged and confidential – do not distribute externally

Privileged and confidential – do not distribute externally
The following white paper outlines some of different ways of calculating LTV. Besides understanding the computation of LTV, the purpose of this white paper is to also discuss the merits of this concept as a business metric and collect some best practices to optimize the LTV calculation and usage in your business.
In writing this white paper we conducted a series of interviews with top game developers and experts. We would like to give special thanks to these partners for their time and contribution.
Disclaimer
Privileged and confidential – do not distribute externally

Privileged and confidential – do not distribute externally
While we all dream of building the next iconic game that will be remembered by future generations for its unique visuals and innovative gameplay, we generally spend a lot of time thinking about some of the fundamental business questions that underlie a sustainable business: How much can I spend in acquiring a new player? What is the potential value of this user versus another one? How can I quantify the social effect of people sharing my game and bringing in new players? When will my players churn and what can I do to prevent it?
The breadth of data generated by gameplay and the ability to target actions at a user level has led to customer analytics becoming a core part of a games business. The complex nature of mobile game monetization and competition in the games industry means that there is pressure to find more innovative approaches to take action from your data, in order to give your business an edge. One method is to build models that help to predict the lifetime value (LTV) of your game players.
In order to take advantage of the benefits data can bring, it’s important to follow these recommended actions:
1. Track the relevant metrics
Focus on collecting data that will allow you to test hypotheses and identify actionable data; such as active players, engagement, cost of new customers, revenues, and profits. Avoid vanity metrics like registered players, downloads, and raw page views.
2. Plan thoroughly
Planning the analytics events and experiments thoroughly will help you understand gaps in the funnel. For example, an event might be defined as every time a person purchases an in app item or each time they complete a session.
3. Ensure the integrity of your data
Analytics events (see point 2) need methodical testing to ensure integrity of the data. As such, accurate collection of payment data is critical, from validating in-app purchases (IAPs) from day 1 to attributing installs accurately. If we are using a third party tool, access to raw data will be essential to handle the data efficiently.
Use your data to take the right decisions
Privileged and confidential – do not distribute externally

Privileged and confidential – do not distribute externally
4. Have enough data
A statistically significant data sample is necessary. Low sample sizes during the soft launch process might complicate return on investment (ROI), return on ad spend (ROAS), or lifetime value (LTV) calculations by country or campaign. Think about alternative methods to increase your audience (e.g. Early Access collection), or simply making trade offs (lower accuracy).
Privileged and confidential – do not distribute externally
Privileged and confidential – do not distribute externally
What is LTV?
As the term already implies, LTV estimates the total monetary value of a specific player during his or her entire lifetime.
Although lifetime value is a widespread metric that allows gaming developers to understand the value of their gamers, today there is no standard way of calculating it. Most developers either use their own custom method of calculating LTV, or are using a 3rd party tool. Regardless of the calculation method, there are three main pitfalls developers can fall into when working with LTV.
Lifetime value in games
1. The first mistake many developers make is not including all revenue sources in their LTV calculations. It’s quite common for developers to calculate LTV only for IAPs, and add at the very end a percentage on top in regards to the other sources of revenues e.g. advertising. LTV, whenever possible, should include all monetization business models, such as IAP, ad revenue, etc., as otherwise we might not include a legiti-mate revenue and hence miss out on opportunities to grow.
2. The second pitfall some developers encounter is assessing the impact of less obvious factors such as: release of new titles by competition, the stage of the company, changes in exchange rates, etc. These can skew LTV significantly without the developer making any changes to the game at all. Overall we need to consider LTV as a dynamic metric that evolves continuously with the game thanks to:
a. Internal changes - new content or functionalities, in-game economy, player behaviors. b. External changes - game trends, competition, currency fluctuations, platform changes.
3. Lastly, some developers see LTV as a competitive strength. However, LTV is just is just a metric and therefore it does not represent a competitive advantage towards other developers. As well it is not an exact value hence it should be also considered as a range (e.g. LTV is in between 1 and $1.2) or within a certain accuracy (e.g. 85% confidence). Ultimately the goal is to avoid lifetime projections that are too optimistic/pessimistic and will end up driving bad behaviors.
Privileged and confidential – do not distribute externally
Privileged and confidential – do not distribute externally
How will LTV help my business decisions?
LTV is commonly used for player acquisition, but it can also be used for many other purposes; such as overall business profitability, optimising Live ops, and in managing new feature releases. Among the common usages of LTV we find:
a. Profitability: LTV is an estimation of the total cash-flows a user will provide throughout his/her entire lifetime. So if we compare the estimated income to the costs associated, we can estimate the bottom line impact to the business’ cash flow on a per user basis.
b. User acquisition: As long as the cost of acquiring a new player is not above the net LTV, in theory we can still invest in user acquisition. A rule of thumb applied by many developers in player acquisition is that costs should ideally remain below 1/3 of the gross LTV but will depend in many other factors (expected growth, market landscape)
c. New features and Live ops: Content updates can impact retention, engagement and monetization, all drivers of lifetime value. Top developers test the effect of the new updates prior to launch to see the overall impact in LTV.
d. Building new games: Certain developers will assess the viability of an unreleased game by looking at the LTV while still in beta.
Privileged and confidential – do not distribute externally
Privileged and confidential – do not distribute externally
As mentioned above there is no standard way of calculating LTV. However developers usually agree that LTV is based on at least two variables: lifetime (looking at user engagement and retention) and monetization (average number of transactions, monetary value, conversion rate).
Although there is agreement that these two variables have to be somewhat part of the calculation, there is also a debate around the exact way to calculate them.
1. Lifetime
Lifetime is usually measured as retention. The debate starts here with different views of how retention is calculated:
1. Classic2. Range3. Rolling
The classic daily retention approach only looks at gamers that connect at a specific day after the install date, while range retention looks at those returning during an interval of time, e.g. week. Rolling retention looks at people returning after a certain period of time.
Each of these calculation methods can fit certain types of games better. For example, a storytelling game that releases episodes or seasons at certain periods of time - and therefore has gamers return only once the new season has been released - will argue that classic retention is not as relevant for them and they might be more interested in range retention and season/episode completion rate. Some hyper-casual game developers look at retention per hours instead of days, as in their case the first hours (not the first days) will determine the success of their game.
One last word of caution on retention - it is usually defined as the person opening the app. It’s worth noting that there might still be significant differences between opening the app - for example to collect a daily reward, or to play another battle in an online multiplayer game. As such we might want to re-define retention as the act of opening the app to do a certain action.
Popular ways of calculating LTV in mobile gaming
Privileged and confidential – do not distribute externally
Privileged and confidential – do not distribute externally
How far you want to go in your LTV estimate?
Before calculating the LTV metric, developers usually agree on a specific period of time for LTV calculation purposes e.g. estimate LTV for the next 90 days, 180 days, 1 yr, 2 yrs, or even 5 years.
Note that some people might find this concept contradictory as the term ‘lifetime’ itself theoretically means the total duration of the entire life of a person. However as LTV is usually an average estimation, a developer might want to remain conservative and calculate the LTV to a certain period of time. Note as well that the further you go in the future estimation, accuracy will tend to be lower.
A few factors will impact your choice of the period and developers usually look at a number of factors, including the following:
• Type/genre of game: The more specifically expected life cycle of the game genre overall. E.g. a super casual game might have a shorter life versus a hardcore game running as a service hence the LTV will be calculated at different periods.
• Business model: IAP’s vs. subscriptions vs. advertising. As an example, generally subscriptions users might have longer lifetimes and hence the chosen period might be longer
• Stage of the company: early vs. mature stage. Early stage companies will often select longer and more optimistic periods of time when calculating LTV because they are relying on the future development of a certain technology, or due simply to a lack of historical data.
• ROI horizon: well funded companies might be able to invest in user acquisition for longer periods of time, hence extending the lifetime period. e.g. 180 days is the period that will allow enough revenues to reach a breakeven point.
2. Monetization
As with retention, there is debate on how the monetization variable is calculated. Most gaming developers look at ARPDAU (average revenue per daily active users), but some take into account ARPU (average revenue per monthly users), or ARPPU (average revenue per paying users). As we will see later on, depending on the model used to estimate LTV, we will use one or another.
Regardless of which monetisation variable you choose, it’s important to be consistent with the time period you select, and be aware of some of the limitations with averaging out the resulting number. For example, the ARPDAU of a game will probably fluctuate significantly if we estimate it based on the last quarter, month, or week.
Privileged and confidential – do not distribute externally
Privileged and confidential – do not distribute externally
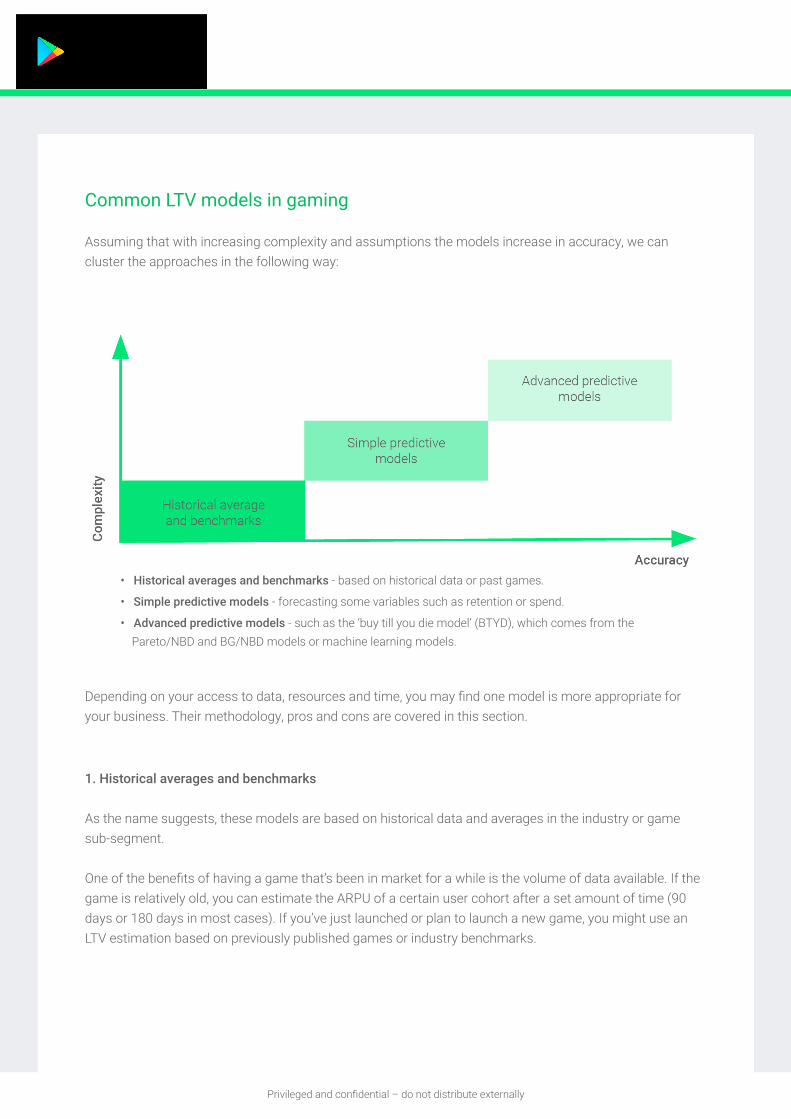
Common LTV models in gaming
Assuming that with increasing complexity and assumptions the models increase in accuracy, we can cluster the approaches in the following way:
Depending on your access to data, resources and time, you may find one model is more appropriate for your business. Their methodology, pros and cons are covered in this section.
1. Historical averages and benchmarks
As the name suggests, these models are based on historical data and averages in the industry or game sub-segment.
One of the benefits of having a game that’s been in market for a while is the volume of data available. If the game is relatively old, you can estimate the ARPU of a certain user cohort after a set amount of time (90 days or 180 days in most cases). If you’ve just launched or plan to launch a new game, you might use an LTV estimation based on previously published games or industry benchmarks.
Privileged and confidential – do not distribute externally
• Historical averages and benchmarks - based on historical data or past games.
• Simple predictive models - forecasting some variables such as retention or spend.
• Advanced predictive models - such as the ‘buy till you die model’ (BTYD), which comes from the Pareto/NBD and BG/NBD models or machine learning models.
Privileged and confidential – do not distribute externally
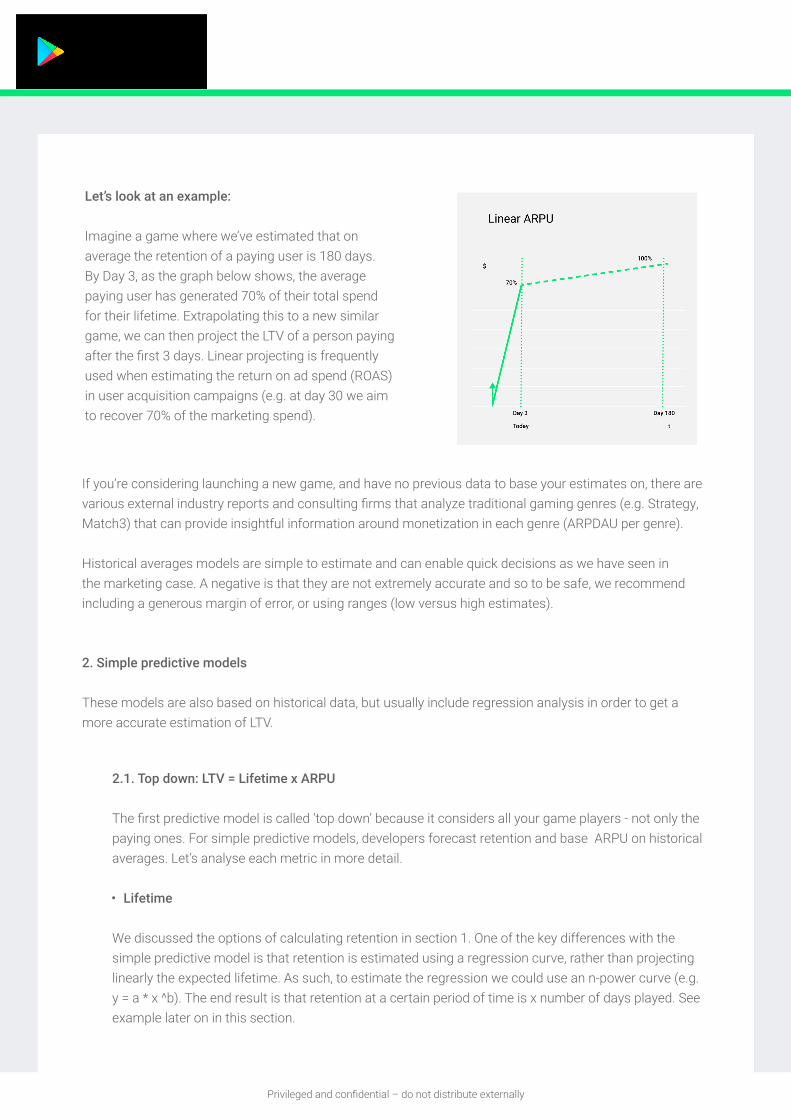
Let’s look at an example:
Imagine a game where we’ve estimated that on average the retention of a paying user is 180 days. By Day 3, as the graph below shows, the average paying user has generated 70% of their total spend for their lifetime. Extrapolating this to a new similar game, we can then project the LTV of a person paying after the first 3 days. Linear projecting is frequently used when estimating the return on ad spend (ROAS) in user acquisition campaigns (e.g. at day 30 we aim to recover 70% of the marketing spend).
If you’re considering launching a new game, and have no previous data to base your estimates on, there are various external industry reports and consulting firms that analyze traditional gaming genres (e.g. Strategy, Match3) that can provide insightful information around monetization in each genre (ARPDAU per genre).
Historical averages models are simple to estimate and can enable quick decisions as we have seen in the marketing case. A negative is that they are not extremely accurate and so to be safe, we recommend including a generous margin of error, or using ranges (low versus high estimates).
2. Simple predictive models
These models are also based on historical data, but usually include regression analysis in order to get a more accurate estimation of LTV.
2.1. Top down: LTV = Lifetime x ARPU
The first predictive model is called ‘top down’ because it considers all your game players - not only the paying ones. For simple predictive models, developers forecast retention and base ARPU on historical averages. Let’s analyse each metric in more detail.
• Lifetime
We discussed the options of calculating retention in section 1. One of the key differences with the simple predictive model is that retention is estimated using a regression curve, rather than projecting linearly the expected lifetime. As such, to estimate the regression we could use an n-power curve (e.g. y = a * x ^b). The end result is that retention at a certain period of time is x number of days played. See example later on in this section.
Privileged and confidential – do not distribute externally
Privileged and confidential – do not distribute externally
• Average Revenue Per User
ARPU usually refers to average monthly revenues / per user, however among game developers, Average Revenue Per Daily Active User, referring to daily revenues, is the most commonly used metric when calculating LTV. As mentioned in section 2, the way in which we estimate ARPU will determine the LTV results.
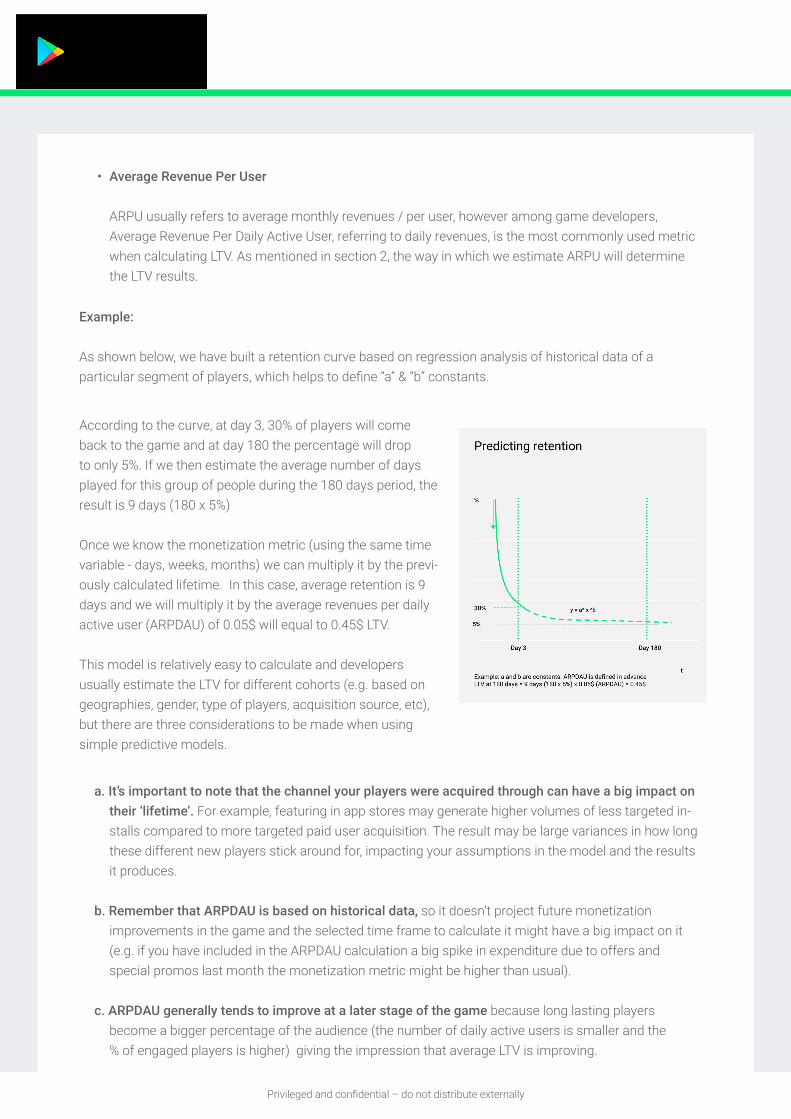
According to the curve, at day 3, 30% of players will come back to the game and at day 180 the percentage will drop to only 5%. If we then estimate the average number of days played for this group of people during the 180 days period, the result is 9 days (180 x 5%)
Once we know the monetization metric (using the same time variable - days, weeks, months) we can multiply it by the previ-ously calculated lifetime. In this case, average retention is 9 days and we will multiply it by the average revenues per daily active user (ARPDAU) of 0.05$ will equal to 0.45$ LTV.
This model is relatively easy to calculate and developers usually estimate the LTV for different cohorts (e.g. based on geographies, gender, type of players, acquisition source, etc), but there are three considerations to be made when using simple predictive models.
Example:
As shown below, we have built a retention curve based on regression analysis of historical data of a particular segment of players, which helps to define “a” & “b” constants.
a. It’s important to note that the channel your players were acquired through can have a big impact on their ‘lifetime’. For example, featuring in app stores may generate higher volumes of less targeted in-stalls compared to more targeted paid user acquisition. The result may be large variances in how long these different new players stick around for, impacting your assumptions in the model and the results it produces.
b. Remember that ARPDAU is based on historical data, so it doesn’t project future monetization improvements in the game and the selected time frame to calculate it might have a big impact on it
(e.g. if you have included in the ARPDAU calculation a big spike in expenditure due to offers and special promos last month the monetization metric might be higher than usual).
c. ARPDAU generally tends to improve at a later stage of the game because long lasting players become a bigger percentage of the audience (the number of daily active users is smaller and the % of engaged players is higher) giving the impression that average LTV is improving.
Privileged and confidential – do not distribute externally

Privileged and confidential – do not distribute externally
2.2. Bottoms up: ARPPU
The bottoms up approach is based exclusively on those paying instead of all players (paying and not paying). This model relies on various metrics and assumptions:
• Average revenues per paying user (ARPPU) generated at a point of time.• This model assumes that most transactions in a game will be generated in the first days of the
life of a player, and usually a logarithmic/power function might fit well with this behaviour (as most of the acceleration occurs at the beginning) . E.g. Y = c * Ln(x) + b
Where “c” and “b” are constants we can estimate based on regression analysis of historical data. X is the number of days since install and Y is the projected LTV.
• Conversion rate (% of players becoming paying users) is generally stable and therefore the per-centage of paying players will not vary significantly. In any case the LTV is usually not affected by an increase in the number of those paying.
Example:
The curve above shows the expected expenditure pattern for a segment of players until day 180. According to this model then we could estimate based on the amount spent by a person paying at day 3, that the expected LTV at day 180 would be 0.45$.
This model is arguably more precise as we only target actual buyers.
On the other hand, changes in dynamics within the game industry, what is called the games as a service model, might affect the curve, as we observe very successful games that are regularly introducing new content and features, which affect the expenditure curve and make it more difficult to fit the model with a simple logarithmic/power function (e.g. RPG or CCG games).
Privileged and confidential – do not distribute externally
Privileged and confidential – do not distribute externally
3. Advanced predictive models
Advanced predictive models drill down to the individual user level based on probabilistic models. These models are known to produce a predictive, user lifetime value or pLTV.
Among the most popular models are the Pareto/NBD1 and BG/NBD2 models. They are relatively simple, as they only look at the frequency of purchases and the value of transactions to estimate LTV.
The models are then based on 2 variables:
1. Likelihood of a customer making a purchase in the selected period. This uses two metrics:
Recency: When the customer made the last purchase - assumes customers who recently purchased are more likely to buy again. Frequency: How frequently a customer makes a purchases - assumes customers who buy more often are more likely to buy again. This is as well a strong indicator of higher engagement.
2. Expected monetary value of the next purchases. This will be based on previous purchases and estimated through a separate model. The estimated currency value of the next purchase will be independently calculated from the likelihood of spending again.
The BG/NBD model is considered to be slightly easier to calculate as it assumes the user will churn only after they have made a purchase. In contrast, the Pareto/NBD model assumes a user could churn at any time during their life. Clearly, while easier to calculate, the BG/NBD model has limitations given reality, where very few people monetize and might churn at any time.
The outputs of both models are the probability of being alive (pAlive) after the last purchase the estimated number of transactions during the forecasted period and the forecasted average order value (AOV) for a particular user. pLTV will be the product of the expected number of transactions and the AOV.
pLTV = nº of expected transactions x expected AOV
Like the simple predictive model ‘bottom up’ approach, the advanced predictive models only take into account active buyers and not all players.
1David C. Schmittlein, Donald G. Morrison and Richard Colombo, “Counting Your Customers: Who Are They and What Will They Do Next?” 2(Bruce Hardie and Pet er Fader, “Counting Your Customers” the Easy Way: An Alternative to the Pareto/NBD Model)
Privileged and confidential – do not distribute externally

Privileged and confidential – do not distribute externally
Predictive models have many advantages:
• They allow developers to estimate LTV at a per user basis, enabling segmentation of these players according to their needs.
• Developers can create personas and target similar players based on their estimated LTV. • These models are open source, meaning that any developer can use the algorithms and run them on
their servers.
However, predictive models have some constraints as well:
• They only look at those who are paying.• As the model doesn’t take into account non paying players, it may be harder to use in games where
players convert to paying only months into the future. For example, hardcore games where the monetization curve depends enormously on the game depth and the developer’s ability to enrich the in-game economy might need more data.
• It does not easily cater for other business models, such as advertising (or at least it is challenging to include them as the number of events might be much higher and hence the amount the data as well).
• They need a high quantity of player data (generally 4 months or more).
What about machine learning models?
As machine learning and artificial neural networks become more popular, some developers are looking at ways to calculate LTV using these techniques. As an example, Firebase Predictions allows developers to predict churn and expenditure based on machine learning, a great first step towards working out the LTV.The main advantage of using machine learning techniques is that we might be able to handle more data. Hence, in addition to the purchase data, you could also include behavioral events. This information can then be used to predict potential payers at an earlier stage of player life, which is extremely useful to run user acquisition campaigns, as well as to optimize early on in the life of a user (e.g. conversion to payers and retention).
While models like the BG/NBD - Pareto/NBD only look at those paying (at least 1 purchase) and therefore require a wait for the purchase to happen, machine learning models could predict, based on behavioral events, who will actually become a paying gamer and ultimately estimate how much they will spend. On the other hand, if we rely exclusively on behavioural events, we would have to rely more heavily on assumptions around the potential expenditure. These in turn create opportunities to develop and assess new methodologies which are already underway, so lookout for future insights on this area.
Privileged and confidential – do not distribute externally
Privileged and confidential – do not distribute externally
Which model should I use given all of this?
A predictive LTV model will inform your business decisions better than simple historical averages. To decide whether you should use the simple or advanced models, you need to ask yourself to consider the following:
• Data availability: Games that have been in the market longer are more likely to have enough quantities of data available as the basis for analysis.
• Business model: The models explained above work well for IAP pricing, less so for other types of revenue, such as advertising.
• Type of game: Casual or hardcore.
• Internal resources: Availability of the team and re-sources to run the model and more importantly to take actions based on this insights. E.g. a team of data analysts and strong live ops, and user acquisition teams are critical if you want to target specific actions and campaigns to players.
Privileged and confidential – do not distribute externally
Privileged and confidential – do not distribute externally
Virality (also called the K-factor), is very relevant when thinking about user acquisition cam-paigns. It can be calculated as the incremental players added on top of paid marketing, exclud-ing normal organic downloads. It will increase the amount of players and will not affect LTV, unless the proportion of those paying is higher, or they are spending more than the regular play-ers. See example below:
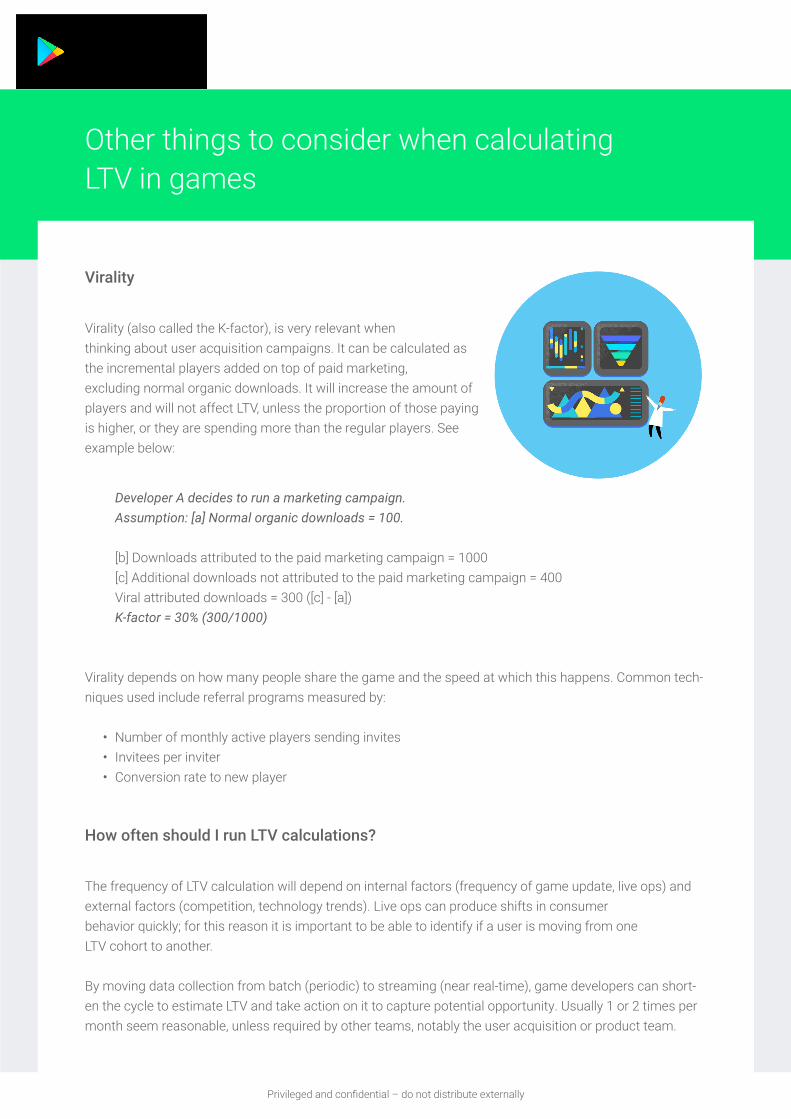
Virality
Virality (also called the K-factor), is very relevant when thinking about user acquisition campaigns. It can be calculated as the incremental players added on top of paid marketing, excluding normal organic downloads. It will increase the amount of players and will not affect LTV, unless the proportion of those paying is higher, or they are spending more than the regular players. See example below:
Other things to consider when calculating LTV in games
Developer A decides to run a marketing campaign. Assumption: [a] Normal organic downloads = 100.
[b] Downloads attributed to the paid marketing campaign = 1000[c] Additional downloads not attributed to the paid marketing campaign = 400Viral attributed downloads = 300 ([c] - [a])K-factor = 30% (300/1000)
Virality depends on how many people share the game and the speed at which this happens. Common tech-niques used include referral programs measured by:
• Number of monthly active players sending invites• Invitees per inviter• Conversion rate to new player
How often should I run LTV calculations?
The frequency of LTV calculation will depend on internal factors (frequency of game update, live ops) and external factors (competition, technology trends). Live ops can produce shifts in consumer behavior quickly; for this reason it is important to be able to identify if a user is moving from one LTV cohort to another.
By moving data collection from batch (periodic) to streaming (near real-time), game developers can short-en the cycle to estimate LTV and take action on it to capture potential opportunity. Usually 1 or 2 times per month seem reasonable, unless required by other teams, notably the user acquisition or product team.
Privileged and confidential – do not distribute externally

Privileged and confidential – do not distribute externally
One of the benefits of calculating LTV over time is to find patterns in monetization and engagement.
Segment your players to increase revenue potential Developers usually segment their players so as to better drive specific actions and campaigns in order to increase the LTV of that respective segment.
Common segmentations include:
• High versus low spenders: t’s common to separate high spenders from low spenders in order to distinguish LTV. It’s also important to differentiate between high spenders with only a few, high value transactions, and high spenders with a lot of lower value transactions.
• Time cohorts of players: Often this approach is used to track changes in a game after an update and measure new players reaction.
• Geographies: Being able to differentiate the behaviour of people between countries, for example, be-tween high monetization markets (such as US, UK, AU), or high volume regions (e.g. IN, BR, ID).Traffic sources: Organic versus paid.
• Age and gender • Type of purchases: Starter pack, late in-game monetization etc.• Behavior actions: Some developers include these type of events within their LTV calculations as they
might identify certain actions that trigger long term retention or expenditure. E.g. people logged in the game through social networks.
What’s the impact of players on my bottom line?
Many developers use average variable contribution (VC) per user in calculating LTV, using this instead of ARPU. The variable contribution per user is calculated by deducting the variable costs (marketing costs, platform revenue share, serving costs per user) from total revenues, divided by the number of players. This will help to determine when the developer will recover the investment. Such an approach can help develop-ers focus on players with higher profitability (Net LTV).
What are my players worth in 3 - 5 years?
Thanks to the trend towards games as a service (using techniques such as live ops), many games have seen significant increases in lifetimes beyond a year. In such cases, discounting future cash flows and taking into consideration cost of funds (e.g. Working Average Capital Cost Rate - WACC) can give a more nuanced view of a user value now, for the future. For example, assuming a lifetime of n years, the formula could be expressed in the following way:
LTV = Revs Year 1 + Revs Year 2 x 1/ (1+ r) + ... + Revs Year n x 1 / (1+ r )^(n-1)
Privileged and confidential – do not distribute externally
Privileged and confidential – do not distribute externally
LTV for advertising revenue
Advertising is an important source of income for many game developers and is important to add to the LTV calculation. Outside of direct ad revenue, placements can aid retention (e.g. rewarded video), and help move players towards becoming IAP paying players.
As said before in the article is generally advisable to incorporate in some way this valuable source of reve-nues. Some developers would take the game’s revenue and impressions data, and estimate the revenues per thousand impressions (eRPM or eCPM) on a per country basis . With this information they will multiply the eCPM by the average ads seen by players in the game.
However and similar to the in-app purchases we can think of predictive ways to estimate LTV, e.g. using probabilistic models or Machine Learning to estimate the engagement and interaction of players with ads.
LTV for non monetary value activities
Some people might not pay and barely click on ads but might still drive engagement in the game, aiding the whole game community, and helping to drive expenditure indirectly. A good example of this are games in the MOBA category (massive online battle arena games). Those with high session frequency and long duration in game may just be as important as paying players. As such we could assign an arbitrary value to those activities so that we take them into account in our calculations.
Privileged and confidential – do not distribute externally
Privileged and confidential – do not distribute externally
Virality (also called the K-factor), is very relevant when thinking about user acquisition cam-paigns. It can be calculated as the incremental players added on top of paid marketing, exclud-ing normal organic downloads. It will increase the amount of players and will not affect LTV, unless the proportion of those paying is higher, or they are spending more than the regular play-ers. See example below:
Conclusion
As we have seen, the lifetime value metric has a variety of usages and is widely adopted in the mobile gaming industry. However, we have also seen that there is no standard way of calculating it, therefore there might be multiple valid ways to do so, depending on several internal (game nature, company resources, data available), or external (type of audience, competitors) factors.
As such, whenever calculating the lifetime value of our players, we need to be ready to make trade-offs in terms of accuracy and resources needed, in order to make the most of this valuable resource.
When using the lifetime value metric for user acquisition or live ops, we need to try avoid some common pitfalls such as: overly optimistic calculations, missing out sources of revenues, or considering it a competitive strength which may lead to under- or over- estimation. We might also want to consider key aspects such as calculating the net LTV, discounting cash flows, or adequately segmenting the calculation
To summarize 5 key points to remember:
1. LTV has many usages: user acquisition, profitability but also live ops, sales, games pipeline.
2. Predicting the future is not an accurate science, always consider a range/margin of error.
3. There are many ways to estimate the LTV; if possible, use predictive models to estimate
individual LTV
4. Decide in advance key aspects such as: cohorts, frequency of LTV calculation, profitability, or
inclusion of other business models.
5. To improve accuracy, plan in advance all in-game events, track only relevant metrics, maintain
the integrity of data, and take decisions based on a relevant enough sample.
Virality (also called the K-factor), is very relevant when thinking about user acquisition cam-paigns. It can be calculated as the incremental players added on top of paid marketing, exclud-ing normal organic downloads. It will increase the amount of players and will not affect LTV, unless the proportion of those paying is higher, or they are spending more than the regular play-ers. See example below:
Privileged and confidential – do not distribute externally

Privileged and confidential – do not distribute externally
Virality (also called the K-factor), is very relevant when thinking about user acquisition cam-paigns. It can be calculated as the incremental players added on top of paid marketing, exclud-ing normal organic downloads. It will increase the amount of players and will not affect LTV, unless the proportion of those paying is higher, or they are spending more than the regular play-ers. See example below:
Virality (also called the K-factor), is very relevant when thinking about user acquisition cam-paigns. It can be calculated as the incremental players added on top of paid marketing, exclud-ing normal organic downloads. It will increase the amount of players and will not affect LTV, unless the proportion of those paying is higher, or they are spending more than the regular play-ers. See example below:
Additional resources:
• “Making money in Play I/O 2016” by Tamzin Taylor
• “The rules of the games” by Matteo Vallone
• “6 CLV (LTV) Calculators for Mobile Apps” by Yaniv Nizan
• “5 Ways to calculate lifetime value for free-to-play games” by Vasiliy Sabirov
• “Two Methods for Modeling LTV with a Spreadsheet” by Eric Seufert
• “Generic LTV calculation (Harvard Business School)” by Thomas Eisenmann
• “Subscription apps: Calculating LTV for Subscription businesses”
• “Counting Your Customers: Who Are They and What Will They Do Next?” by David C. Schmittlein,
Donald G. Morrison and Richard Colombo
• “Counting Your Customers” the Easy Way: An Alternative to the Pareto/NBD Model by Peter S. Fader, Bruce G. S. Hardie, Ka Lok Lee
• Probability Models for Customer-Base Analysis” - Peter S. Fadera,⁎ & Bruce G.S. Hardie
• “The Gamma-Gamma Model of Monetary Value” - Peter S. Fader, Bruce G. S. Hardie
• “Understanding the predictable” by Lloyd Menkick
• “Deep dive: Cancellation rate in SaaS business models” by Jason Cohen
• “Startup Killer: the Cost of Customer Acquisition” by David Skok
• “Cost of Acquisition of users” by Rob Moffat
• “What’s your TRUE customer lifetime value (LTV)? — DCF provides the answer” by David Skok
• “Want to boost your news app? Hire a gamer” by Frederic Filloux
• “How to Project Customer Retention for a Subscription Business” by Sean R Moran
• “The Value of Keeping the Right Customers” by Amy Gallo
• “Survival models” by Princeton
• “3 ways to calculate LTV” Delta DNA
• “Hacking word of mouth” - by Jason Bosinoff
• “LTV calculator” by David Yin
Privileged and confidential – do not distribute externally