Embed Size (px)
Citation preview

PRESTIGE GROUP | Presentation | March 2017
I N V E S T O R P R E S E N T A T I O N | Q 4 F Y 1 7 & F Y 1 7
Shot at site | Prestige Mayberry
PRESTIGE GROUP | Presentation | March 2017
INDEX.
1. ABOUT PRESTIGE
2. OPERATIONAL HIGHLIGHTS
3. FINANCIAL HIGHLIGHTS
4. PROJECT PORTFOLIO & UPDATE
5. RECEIVABLES PROFILE
6. AWARDS & RECOGNITIONS
7. PROJECT STATUS
8. GUIDANCE VS ACHIEVED
2

3
Iconic developments
-Forum Mall, Prestige
Shantiniketan, UB
City, Prestige
Golfshire etc
42 mn sftPotential
development from
Low cost land bank of
424 acre
ICRA A+,
ICRA A1+Credit rating
CRISIL DA1rated Developer by CRISIL
Spearheaded by
Real Estate Icon, Mr.
Irfan Razack & his
brothers
Mr. Rezwan and
Mr.Noaman Razack
Ongoing Projects
spanning
Over 60.2 Mnsf of
developable area
Completed projects spanning across 80Mnsf of Developed area
Strong Joint
Venture
partners -
CapitaLand,
etc
One of the Most
Trusted Developers
by Land Owners and
Customers
205
58Over 30Years
of Legacy
Strong
Associations with
Various Banks &
FIs
Excellence
Across Sector-
Residential,
Commercial,
Retail &
Hospitality
Diversified Cash
Flows
from Various
Segments
Upcoming
Projects spanning
Over 47.8 Mnsf of
developable area
358.6 mn sftGLA of Operational
Rental portfolio (PG share)
12.2mn sftGLA Under
construction &
Planning (PG share)
A B O U T P R E S T I G E

PRESTIGE GROUP | Presentation | March 2017
B U S I N E S S S E G M E N T S
RESIDENTIAL Apartments VillasIntegrated Townships
Plotted Developments
COMMERCIAL Office SpaceBuilt to suit Campuses
SEZs IT Parks
RETAIL Malls
HOSPITALITY ResortsServiced
ApartmentsHotels Food Courts
SERVICESSub leasing & fit out services
Interior Design & Execution
Project & Construction
Mgmt ServicesFacilities &
Property Mgmt
Logistics
4

5
S C A L E O F O P E R A T I O N
PARTICULARS
Residential Commercial Retail HospitalityPlotted
DevelopmentTotal
Nos. Area Nos. Area Nos. Area Nos. Area Nos. Area Nos. Area
Completed Projects 85 36.96 100 29.15 6 4.81 6 1.37 8 7.42 205 79.70
Ongoing Projects 41 49.59 8 5.53 6 3.04 3 2.07 0 0.00 58 60.23
Upcoming Projects 23 30.31 10 15.70 2 1.78 0 0.00 0 0.00 35 47.79
Land Bank* 41.53
TOTAL 149 116.86 118 50.38 14 9.62 9 3.44 8 7.42 298 229.25
*Estimated
Areas are in Million SqftD e e p d e v e l o p m e n t p i p e l i n e t o t h e t u n e o f 1 5 0 m n s f t
6
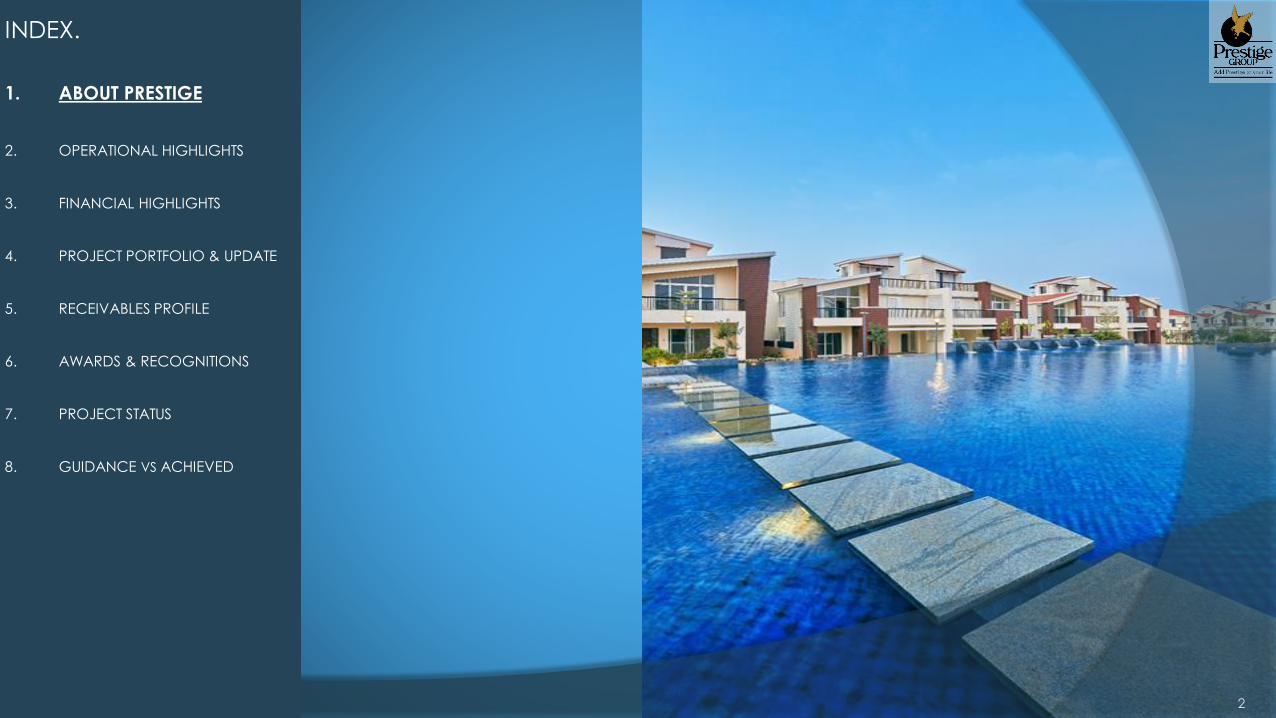
S H A R E H O L D I N G P A T T E R N
Promoters FIIs Mutual Funds Retail
70%
25%
1%
4%
As on 31st March 2017

7
Irfan RazackChairman & Managing
Director
Rezwan RazackJoint Managing Director
Noaman RazackWholetime Director
Uzma IrfanDirector
Jagdeesh K. ReddyIndependent
Director
B.G. KoshyIndependent
Director
Noor Ahmed JafferIndependent
Director
Dr. Pangal Ranganath
NayakIndependent
Director
B O A R D O F D I R E C T O R S

PRESTIGE GROUP | Presentation | March 2017
E X E C U T I V E M A N A G E M E N T
Faiz RezwanExecutive Director-
Contracts & Projects
Zackria HashimExecutive Director- Land
Acquisition
Zaid SadiqExecutive Director-
Liasion & Hospitality
Anjum JungExecutive Director- Interior
Design
Nayeem NoorExecutive Director-
Government Relations
Omer Bin JungExecutive Director-
Hospitality
V. GopalExecutive Director-
Projects & Planning
Zayd NoamanExecutive Director- CMD’s
OFFICE
8

PRESTIGE GROUP | Presentation | March 2017 9
Suresh SingaraveluExecutive Director- Retail,
Hospitality & Business
Expansion
Swaroop AnishExecutive Director- Business
Development
Venkat K NarayanExecutive Director-
Finance & CFO
E X E C U T I V E M A N A G E M E N T
Arvind PaiExecutive Director- Legal
Lt. Col. Milan Khurana (Retd.)
Executive Director – HR, IT &
Admin

10
INDEX.
1. ABOUT PRESTIGE
2. OPERATIONAL HIGHLIGHTS
3. FINANCIAL HIGHLIGHTS
4. PROJECT PORTFOLIO & UPDATE
5. RECEIVABLES PROFILE
6. AWARDS & RECOGNITIONS
7. PROJECT STATUS
8. GUIDANCE VS ACHIEVED

PRESTIGE GROUP | Presentation | March 2017
Particulars Q4FY17 Q4FY16 Q3FY17 FY17 FY16
TOTA
L
New Sales value 6,354 12,411 4,293 24,585 31,498
New Sales Volume 0.90 1.93 0.68 3.82 5.01
Avg Realization/Sft 7,035 6,424 6,297 6,441 6,286
Collections 11,544 10,380 9,678 41,232 39,513
Leasing Volume 0.77 0.40 0.14 1.26 1.32
Area Delivered 1.67 2.91 0.81 12.74 4.71
Area Launched - 4.52 - 1.98 8.35
PR
ESTI
GE S
HA
RE
New Sales value 5,249 9,889 3,465 19,799 26,329
New Sales Volume 0.73 1.53 0.55 3.07 4.26
Collections 9,991 8,624 8,159 35,064 32,800
Leasing Volume 0.14 0.17 0.01 0.21 0.45
Rental Income 1,384 1,261 1,354 5,429 4,468
O P E R A T I O N A L H I G H L I G H T SValue in ₹ MillionVolume in Mnsqft
11

PRESTIGE GROUP | Presentation | March 2017
B U S I N E S S P E R F O R M A N C E
Q 4 C O M P L E T I O N S
12
Sl.No Project Completed Location SegmentDevelopable
Area (Mnsf)
Economic
Interest
Prestige Share
(Mnsf)
1 Prestige Hermitage Bengaluru Residential 0.23 50% 0.12
2 Prestige Edwardian Bengaluru Residential 0.17 45% 0.08
3 Prestige Garden Bay Bengaluru Residential 0.64 72% 0.46
4 Prestige Royal Wood Hyderabad Residential 0.63 50% 0.32
TOTAL 1.67 0.97

PRESTIGE GROUP | Presentation | March 2017
S A L E S S U M M A R Y | P R E S T I G E S H A R EValues are in Million ₹
Areas are in Million Sqft
NOTE
− Substantial portion of above sales are yet to come for revenue recognition in the books of accounts since the projects have not reached the
threshold limits of 25% completion (excluding land)
− The above sales value and realization are excluding Stamp duty, Registration fee and Taxes. (These exclusions approximately aggregate to
around 15% of the sales value).
13
Particulars
Q4FY17 Q4FY16 Q3FY17 FY17 FY16
Area Units Value Area Units Value Area Units Value Area Units Value Area Units Value
Residential
Mid Income Segment 0.57 347 3,716 1.08 721 6,975 0.39 237 2,321 2.39 1520 14683 3.33 2,136 19,913
Premium Segment 0.05 37 974 0.14 54 1,105 0.04 13 419 0.26 88 2633 0.45 170 3,980
TOTAL 0.62 384 4690 1.22 775 8,080 0.43 250 2,740 2.66 1609 17316 3.78 2,306 23,893
Commercial 0.11 559 0.32 1,809 0.12 - 725 0.41 0 2483 0.48 - 2,436
GRAND TOTAL 0.73 384 5249 1.53 775 9,889 0.55 250 3,464 3.07 1609 19799 4.26 2,306 26,329
Realisation per sft 7,150 6,443 6,269 6,186
PRESTIGE GROUP | Presentation | March 2017
INDEX.
1. ABOUT PRESTIGE
2. OPERATIONAL HIGHLIGHTS
3. FINANCIAL HIGHLIGHTS
4. PROJECT PORTFOLIO & UPDATE
5. RECEIVABLES PROFILE
6. AWARDS & RECOGNITIONS
7. PROJECT STATUS
8. GUIDANCE VS ACHIEVED
14

PRESTIGE GROUP | Presentation | March 2017
F I N A N C I A L H I G H L I G H T S | Q 4 F Y 1 7 | S T A N D A L O N EValues are in Million ₹
15
Particulars Q4FY17 Q4FY16 Q3FY17 FY17 FY16
Turnover (Rs. Mn) 5905 9329 5700 22819 34007
EBIDTA (Rs. Mn) 1196 1119 1139 5493 7168
EBIDTA % 20% 12% 20% 24% 21%
PAT (Rs. Mn) 550* 481 693 3323* 4006
PAT % 9% 5% 12% 15% 12%
*Excludes exceptional gain of Rs 2568 Mn

PRESTIGE GROUP | Presentation | March 2017
S T A N D A L O N E | B A L A N C E S H E E T A S A T 3 1 s t M a r c h 2 0 1 7
Values are in Million ₹
16
As at As at
Particulars 31-Mar-17 31-Mar-16
A. ASSETS
(1) Non-current assets
(a) Property, plant and equipment 1,228 1,468
(b) Capital work-in-progress 1,756 3,766
(c) Investment properties 2,462 4,747
(d) Other intangible assets 44 39
(e) Financial assets 34,502 33,819
(f) Deferred tax assets (net) 740 -
(g) Income tax assets (net) 1,137 867
(h) Other non-current assets 9,776 1,756
51,645 46,462
(2) Current assets
(a) Inventories 45,503 41,418
(b) Financial assets 21,844 24,532
(c) Other current assets 4,322 4,802
71,669 70,752
Total 1,23,314 1,17,214

PRESTIGE GROUP | Presentation | March 2017
S T A N D A L O N E | B A L A N C E S H E E T A S A T 3 1 s t M a r c h 2 0 1 7
Values are in Million ₹
17
As at As at
Particulars 31-Mar-17 31-Mar-16
B. EQUITY AND LIABILITIES
(1) Equity
(a) Equity share capital 3,750 3,750
(b) Other Equity 43,677 37,789
47,427 41,539
(2) Non-current liabilities
(a) Financial Liabilities 6,533 10,927
(b) Provisions 66 43
(c) Other non current liabilities 62 87
(d) Deferred tax liabilities (Net) - 8
6,661 11,065
(3) Current liabilities
(a) Financial Liabilities 38,795 36,628
(b) Provisions 1,670 1,064
(c) Other current liabilities 28,761 26,918
69,226 64,610
Total 1,23,314 1,17,214

PRESTIGE GROUP | Presentation | March 2017
S T A N D A L O N E | P & L A C C O U N T A S O N 3 1 s t M a r c h 2 0 1 7Values are in Million ₹
18
Year ended Quarter ended
Particulars 31-Mar-17 31-Mar-16 31-Mar-17 30-Dec-16 31-Mar-16
(I) Revenue from Operations 21,803 32,613 5,629 5,480 9,056 (II) Other Income (Excluding Exceptional item of Rs. 2,568
Mn) 1,016 1,394 276 220 273
(III) Total Revenue - (I+II) 22,819 34,007 5,905 5,700 9,329
(IV) Expenses
Purchases of Stock of units - - - - -
Cost of sales on projects 12,069 21,613 3,303 3,229 6,670
Property and Facilities operating expenses 2,432 2,332 618 615 622
Employee benefits expense 1,615 1,220 424 406 195
Finance costs 1,876 2,210 563 392 534
Depreciation and amortization expense 495 504 115 130 130
Other expenses 1,210 1,674 364 311 722
Total Expenses 19,697 29,553 5,387 5,083 8,873
(V) Profit before tax (III-IV) 3,122 4,454 518 617 456
(VI) Tax expense - 201 448 - 32 - 76 - 25
(VII) Profit (Loss) for the period 3,323 4,006 550 693 481
(VIII) Other Comprehensive loss/(Income) - 3 - 3 - 1 - 1
(IX) Total Comprehensive Income (VII-VIII) 3,320 4,006 553 692 480
(X) Exceptional items 2,568 - 2,568 - -
(IX) Total Comprehensive Income after exceptional items 5,888 4,006 3,121 692 480

PRESTIGE GROUP | Presentation | March 2017
F I N A N C I A L S | K E Y R A T I O S | S T A N D A L O N EValues are in Million ₹
19
Sl. No. Particulars
Quarter ended
31-Mar-17
Ratio/%
30-Dec-16
Ratio/%
31-Mar-16
Ratio/%(Audited) (Unaudited) (Audited)
1 Sale of Projects & Property Income 5,629 5,480 9,056
2 Other Income 276 220 273
3 Total Income 5,905 5,700 9,329
4 Cost of project sold and property expenses 3,921 3,844 7,292
5 Gross Margin 1,708 30% 1,636 30% 1,764 19%
6 Admin, Employee and Selling cost 788 717 917
7 EBIDTA 1,196 20% 1,139 20% 1,120 12%
8 Financial Expenses 563 392 534
9 Depreciation 115 130 130
10 Total Expenses 5,387 5,083 8,873
11 PBT 518 9% 617 11% 456 5%
12 Tax (32) (76) (25)
13 PAT 550 9% 693 12% 481 5%
14 Other Comprehensive loss/(Income) 3 (1) (1)
15 Total Comprehensive Income 553 9% 692 12% 480 5%
16 Exceptional items 2,568 - -
17 Profit after tax 3,121 692 480
16 EPS (Annualized) (In Rs) 33.29 7.38 5.12
17 Market Price per share 218.10 170.00 172.75
18 PE Ratio 7 23 34
19 Market Cap 81,788 63,750 64,781

PRESTIGE GROUP | Presentation | March 2017
Values are in Million ₹
20
F I N A N C I A L H I G H L I G H T S | Q 4 F Y 1 7 | C O N S O L I D A T E D
Particulars Q4FY17 Q4FY16 Q3FY17 FY17 FY16
Turnover (Rs. Mn) 14633 13875 12536 48617 58141
EBIDTA (Rs. Mn) 2909 2231 2582 10070 13493
EBIDTA % 20% 16% 21% 21% 23%
PAT (Rs. Mn) 1111 670 980 3672 6465
PAT % 8% 5% 8% 8% 11%

PRESTIGE GROUP | Presentation | March 2017
C O N S O L I D A T E D | B A L A N C E S H E E T A S A T 3 1 s t M a r c h 2 0 1 7
Values are in Million ₹
21
As at As at
Particulars 31-Mar-17 31-Mar-16
A. ASSETS
(1) Non-current assets
(a) Property, plant and equipment 5,872 6,208
(b) Capital work-in-progress 17,952 9,819
(c) Investment properties 27,235 27,826
(d) Goodwill (arising on
consolidation) 3,069 3,069
(e) Other intangible assets 47 42
(f) Financial assets 13,965 13,956
(g) Deferred tax assets (net) 1,014 92
(h) Current tax assets (net) 3,200 1,952
(i) Other non-current assets 3,220 2,285
75,574 65,249
(2) Current assets
(a) Inventories 66,919 67,148
(b) Financial assets 20,420 24,648
(c) Other current assets 7,567 7,643
94,906 99,439
Total 1,70,480 1,64,688

PRESTIGE GROUP | Presentation | March 2017
Values are in Million ₹
22
As at As at
Particulars 31-Mar-17 31-Mar-16
B. EQUITY AND LIABILITIES
(1) Equity
(a) Equity share capital 3,750 3,750
(b) Other Equity 40,889 38,249
(c) Non controlling interest 2,114 2,266
46,753 44,265
(2) Non-current liabilities
(a) Financial Liabilities 36,653 33,227
(b) Long-term provisions 121 62
(c) Deferred tax liabilities (Net) 2,124 1,906
38,898 35,195
(3) Current liabilities
(a) Financial Liabilities 37,879 36,153
(b) Short-term provisions 2,003 1,360
(c) Current tax liabilities 1,533 1,223
(d) Other current liabilities 43,414 46,492
84,829 85,228
Total 1,70,480 1,64,688
C O N S O L I D A T E D | B A L A N C E S H E E T A S A T 3 1 s t M a r c h 2 0 1 7

PRESTIGE GROUP | Presentation | March 2017 23
C O N S O L I D A T E D | P & L a s o n 3 1 s t M a r c h 2 0 1 7Values are in Million ₹
Year ended Quarter ended
Particulars 31-Mar-17 31-Mar-16 31-Mar-17 31-Dec-16 31-Mar-16
(I) Revenue from Operations 47,745 55,310 14,437 12,341 13,674
(II) Other Income 872 2,831 196 195 201
(III) Total Revenue - (I+II) 48,617 58,141 14,633 12,536 13,875
(IV) Expenses
Cost of sales on projects 28,284 35,131 8,960 7,476 8,861
Property and Facilities operating expenses 5,257 4,956 1,467 1,150 1,364
Employee benefits expense 2,933 2,030 757 740 210
Finance costs 3,160 3,462 869 730 980
Depreciation and amortization expense 1,637 1,274 389 439 371
Other expenses 2,073 2,531 540 588 1,209
Total Expenses 43,344 49,384 12,982 11,123 12,995
(V) Profit before tax (III-IV) 5,273 8,757 1,651 1,413 880
(VI) Tax expense 1,601 2,292 540 433 210
VII. Profit (Loss) for the year 3,672 6,465 1,111 980 670
Share of profit / (loss) from associates (Net) (VIII) 121 67 25 58 48
Profit after tax (before adjustment for Minority interest) (IX = VII - VIII) 3,793 6,532 1,136 1,038 718
Share in profit / (loss) to Minority interest (X) 1,095 435 243 355 101
Profit after tax and Minority interest (VIII - X) 2,698 6,097 893 683 617
Other Comprehensive Income (10) (6) 10 (5) (6)
Profit after Other Comprehensive Income 2,688 6,091 903 678 611

PRESTIGE GROUP | Presentation | March 2017 24
FINANCIALS | CONSOLIDATED | KEY RATIOS Values are in Million ₹
Sl. No. Particulars
Quarter ended
31-Mar-17Ratio/%
31-Dec-16Ratio/%
31-Mar-16Ratio/%
(Unaudited) (Unaudited) (Unaudited)
1 Sale of Projects & Property Income 14,437 12,341 13,674
2 Other Income 196 195 201
3 Total Income 14,633 12,536 13,875
4 Cost of project sold and property expenses 10,427 8,626 10,225
5 Gross Margin 4,010 28% 3,715 30% 3,449 25%
6 Admin, Employee and Selling cost 1,297 1,328 1,419
7 EBIDTA 2,909 20% 2,582 21% 2,231 16%
8 Financial Expenses 869 730 980
9 Depreciation 389 439 371
10 Total Expenses 12,982 11,123 12,995
11 PBT 1,651 11% 1,413 11% 880 6%
12 Tax 540 433 210
13 PAT 1,111 8% 980 8% 670 5%
14 Share of profit / (loss) from associates 25 58 48
15 Minority (243) (355) (101)
16 Other Comprehensive Income 10 (5) (6)
17 Profit after tax 903 678 611
18 EPS (Annualized) (In Rs) 9.63 7.23 6.52
19 Market Price per share 218.10 170.00 172.75
20 PE Ratio 23 24 27
21 Market Cap 81,788 63,750 64,781

PRESTIGE GROUP | Presentation | March 2017 25
UNRECOGNIZED REVENUE | F R O M P R O J E C T S U N D E R C O N S T R U C T I O NValues are in Million ₹
Sl.No Projects
Total sales value of
unit sold as at
31-Mar-2017
Cumulative
turnover declared
upto 31-Mar-2017
Balance turnover
to be declared on
POC
Expected timeline
to reach 25%
trigger
Residential Projects
1 Prestige Bellavista 13,843 13,697 147
2 Prestige Tranquility 9,742 9,639 102
3 Prestige White Meadows-1&2 6,509 6,406 103
4 Prestige Kingfisher Towers 8,289 7,116 1,173
5 Prestige Golf Shire 7,016 5,849 1,168
6 Prestige Royal wood 2,051 1,960 91
7 Prestige Edwardian 754 402 351
8 Prestige Ferns Residency 9,109 7,849 1,260
9 Prestige Mayberry 2,822 2,724 98
10 Prestige Westwoods 4,961 3,697 1,264
11 Prestige Ivy Terraces 1,869 1,453 416
12 Prestige Downtown 1,210 1,136 74
13 Prestige Augusta Golf Village 7,444 5,070 2,374
14 Prestige Misty Waters 5,035 4,230 805
15 Prestige Silver Spring 2,679 2,073 605
16 Prestige Jade Pavilion 2,771 2,598 173

PRESTIGE GROUP | Presentation | March 2017 26
UNRECOGNIZED REVENUE | F R O M P R O J E C T S U N D E R C O N S T R U C T I O N
Values are in Million ₹
Sl.No Projects
Total sales value of
unit sold as at
31-Mar-2017
Cumulative
turnover declared
upto 31-Mar-2017
Balance turnover
to be declared on
POC
Expected timeline
to reach 25%
trigger
17 Prestige Sunrise Park - Phase I & Phase II 10,529 7,811 2,718
18 Prestige Lakeside Habitat Phase I & II 22,405 13,316 9,088
19 Prestige Royale Garden-Phase I & Phase II 4,778 2,426 2,352
20 Prestige Brooklyn Heights 1,045 797 248
21 Prestige Bagmane Temple Bells 5,141 3,095 2,046
22 Prestige Spencer Heights 731 - 731
23 Prestige Hermitage 1,002 333 669
24 Prestige Hillside Retreat 205 147 58
25 Prestige Falcon Towers 693 337 357
26 Prestige Trade Tower 1,091 986 105
27 Prestige Saleh Ahmed 151 102 49
28 TMS Square - Cochin 306 165 141
29 Prestige Mysore Central 73 39 34
30 Prestige Falcon City- Phase I & II 18,502 9,399 9,104
31 Prestige Falcon City Buy Back 1,906 949 957
32 Prestige Falcon City Buy Back 2 550 274 276
33 Prestige Gulmohar 2,478 1,038 1,440
34 Prestige Pine Wood 1,731 - 1,731 FY 18

PRESTIGE GROUP | Presentation | March 2017 27
UNRECOGNIZED REVENUE | F R O M P R O J E C T S U N D E R C O N S T R U C T I O NValues are in Million ₹
Sl.No Projects
Total sales value of
unit sold as at
31-Mar-2017
Cumulative
turnover declared
upto 31-Mar-2017
Balance turnover
to be declared on
POC
Expected timeline
to reach 25%
trigger
35 Prestige Ivy League 2,158 - 2,158 FY 18
36 Prestige Leela Residences 3,088 - 3,088 FY 18
37 Prestige déjà vu 667 - 667 FY 18
38 Prestige Kenilworth 1,413 - 1,413 FY 18
39 Presige Woodside 1,140 - 1,140 FY 18
40 Prestige High Fields_Phase I 4,059 - 4,059 FY 18
41 Prestige Technostar 3,834 - 3,834 FY 18
42 Prestige Lake Ridge 1,903 - 1,903 FY 18
43 Prestige Northpoint 1,455 - 1,455 FY 18
44 Prestige Song of South 5,646 - 5,646 FY 18
45 Hillside Gateway 2,213 - 2,213 FY 18
46 Prestige Kew Gardens 5,133 - 5,133 FY 18
47 Prestige Fairfield 1,774 - 1,774 FY 19
48 Prestige Boulevard 757 - 757 FY 19
49 Prestige Valley Crest 743 - 743 FY 19
50 Prestige Woodland Park 1,658 - 1,658 FY 19
51 Prestige Bougainvillea - II 195 - 195 FY 19
52 Prestige MSR 358 - 358 FY 19
GRAND TOTAL 1,97,616 1,17,113 80,504
Includes sales value attributable to land lord’s area/revenue, accounted as per Ind-AS

PRESTIGE GROUP | Investor Presentation | December 2016 28
P R O J E C T D E B T O R S S U M M A R YValues are in Million ₹
Name of the ProjectOpening Balance as
at01-Jan-2017 New Sales Adjustment Amount Realised
Closing Balance as
at 31-Mar-2017
Completed Projects
Prestige Oasis 37 3 0 4 36
Prestige Shantiniketan 38 422 - 21 390 49
Prestige Neptunes Court Yard 11 41 - 26 - 27
Prestige Tech Park Phase - III 19 - - 0 0 19
Prestige Technopolis 10 0 - 0 - 10
Prestige Khoday Tower 250 453 - 453 - 250
Prestige Silver Oak 158 - 190 77 271
Prestige Philadelphia 44 - - - 44
Prestige Plaza 130 - - 0 17 113
Prestige Star 25 - - 4 - 22
Prestige West Holmes 9 - 0 1 8
Prestige SilverCrest 24 13 45 45 37
Prestige Summerfields 263 125 - 46 82 260
Prestige Parkview 43 3 15 40 21
Prestige Sunny Side 80 51 16 89 58
Prestige Garden Bay 111 31 7 66 83
Prestige Glen wood 91 25 - 21 24 71
Prestige Silver Sun 25 - 15 24 16
Prestige Techvista 31 12 - 4 14 24
Prestige Casabella 170 26 21 63 112
Prestige Mayberry 260 10 - 20 67 223
Others 18 - - - 18
Sub Total - A 1,849 1,215 - 284 1,005 1,772
Note: In addition to the above, there are Land Owner dues to the extent of Rs. 1551 mn.

PRESTIGE GROUP | Investor Presentation | December 2016 29
Name of the ProjectOpening Balance as
at 01-Jan-2017
Incremental POC
Turnover POC Adjustment Amount Realised
Closing Balance as
at 31-Mar-2017
Ongoing Projects
Prestige Edwardian 82 130 (60) 167 105
Prestige Golfshire 282 (5) (323) 297 303
Prestige White Meadows 894 81 (106) 253 829
Prestige Kingfisher Towers 1,360 (25) 37 546 752
Prestige Tranquility 168 590 132 328 298
Prestige Bellavista 104 153 2 149 107
Prestige Royal Wood 79 136 22 77 116
Prestige Ferns Residency 68 487 77 322 156
Prestige Ivy Terraces 33 146 67 73 38
Prestige Westwoods 340 271 86 247 278
Prestige Downtown 30 110 (7) 107 40
Prestige Augusta Golf Village 53 303 153 162 41
Prestige Misty Waters 130 171 (118) 214 205
Prestige Silversprings 111 (292) (442) 162 99
Prestige Sunrise Park 57 591 (89) 665 72
Prestige Lakeside Habitat 192 1,565 394 1,065 297
Prestige Brookyln Heights 10 77 66 12 8
Prestige Royale Gardens 45 151 (46) 227 15
Prestige Jade Pavilion 50 328 181 57 140
Prestige Bagamane Temple Bells 93 193 (68) 329 26
Prestige Falcon City 268 3,608 2,547 1,023 305
Sub Total - B 4,448 8,769 2,504 6,481 4,231
P R O J E C T D E B T O R S S U M M A R YValues are in Million ₹

PRESTIGE GROUP | Investor Presentation | December 2016 30
P R O J E C T D E B T O R S S U M M A R YValues are in Million ₹
Name of the Project
Opening Balance as
at 01-Jan-2017
Incremental POC
Turnover POC Adjustment Amount Realised
Closing Balance as
at 31-Mar-2017
Prestige Spencer Heights - - - 7 -
Prestige Kenil Worth - - - 131 -
Prestige High Fields - - - 200 -
Prestige Ivy League - - - 116 -
Prestige Leela Residences - - - 65 -
Prestige Woodland Park - - - 4
Prestige Pine Wood - - - 53 -
Prestige North Point - - - 2 -
Prestige Wood Side - - - 28 -
Prestige Gulmohar - - - 205 -
Prestige Song of the south - - - 539 -
Prestige Hillside Gateway - - - 119 -
Prestige Boulevard - - - 68 -
Prestige Kew Gardens - - - 359 -
Prestige Fair Field - - - 4 -
Prestige Techno Star - - - 445 -
Prestige Lake Ridge - - - 146 -
Prestige Valley Crest - - - 12 -
Prestige Misty Waters II - - - 2 -
Sub Total - C - - - 2,504 -
Total (A+B+C) 6,296 9,984 2,504 9,991 6,003

PRESTIGE GROUP | Presentation | March 2017
D E B T P R O F I L E A S O N 3 1 s t M a r c h 2 0 1 7 Values are in Million ₹
31
Particulars Standalone %
Consolidated
Loan %
Debt as on 31.03.2017
Secured Loan 26,830.6 100.0% 56,810.5 100.0%
a. Project Debt - Resi & Comm 13,214.0 49.2% 14,323.4 25.2%
b. Capex Loans - -
- Office Space 1,975.9 7.4% 3,080.0 5.4%
- Retail - 0.0% 839.8 1.5%
- Hospitality - 0.0% 6,542.7 11.5%
c. Rental Securitisation Loans 1,213.9 4.5% 21,597.7 38.0%
d. Receivables discounting loans 10,426.9 38.9% 10,426.9 18.4%
Gross Debt 26,830.6 100.0% 56,810.5 100.0%
Less: Cash & Bank Balances 2,324.9 4,736.7
Net Debt 24,505.7 52,073.8
Networth 47,427.2 46,752.9
Debt Equity Ratio 0.52 1.11

PRESTIGE GROUP | Presentation | March 2017
ANNUALI ZED PROJECTED EX I T RENTALS FOR AREA LEASED
32
Sl. No Project Name Segment
Total
Leasable Area (Mnsqft)
Economic
Interest (Mnsqft)
Area Leased
Prestige Share (Mnsqft)
Rent Per Sft
(Rs)
Rent P.A
(Annualised) (RsMn)
1 Prestige Estates Projects Limited Commercial 1.90 1.90 1.90 38 866
2 West Palm Developers Pvt Ltd Commercial 0.32 0.19 0.19 36 82
3 Prestige Valley View Estates Pvt Ltd Commercial 0.03 0.019 0.019 62 14
4 Exora Business Park - Phase I-III Commercial 2.18 2.18 2.18 59 1,541
5 ICBI India Pvt Ltd Commercial 0.06 0.05 0.05 78 47
6 Cessna (B1 to B8) Commercial 2.77 2.35 2.35 45 1,277
7 Prestige Polygon Commercial 0.33 0.33 0.33 75 300
8 Forum Vijaya- Commercial Commercial 0.19 0.10 0.10 44 50
9 Forum Mall Retail 0.35 0.28 0.28 138 466
10 UB City Retail Retail 0.10 0.04 0.04 320 169
11 Forum Value Mall Retail 0.29 0.15 0.15 75 131
12 Forum Vijaya- Retail Retail 0.64 0.32 0.32 90 343
13 Forum Mall Sujana Hyderabad Retail 0.81 0.20 0.20 84 201
14 Forum Mall Mangalore Retail 0.66 0.23 0.23 32 86
15 SKN Commercial Commercial 0.29 0.29 0.29 41 144
Total annualised rentals 10.92 8.63 8.63 5,717

PRESTIGE GROUP | Presentation | March 2017
ANNUALI ZED PROJECTED EX I T RENTALS FOR AREA LEASED
33
Sl. No Project Name Segment
Total Leasable Area
(Mnsqft)Economic
Interest (Mnsqft)
Area Leased Prestige Share
(Mnsqft)Rent Per Sft
(Rs)
Rent P.A(Annualised) (Rs
Mn)
Rental Income by 31st March 2018
1 Prestige Polygon Commercial 0.05 0.05 0.00 75 45
2 Prestige Trade Tower Commercial 0.48 0.16 0.09 130 254
3 Cessna Business Park B9 Commercial 0.49 0.42 0.00 75 378
4 TMS Square - Commercial Commercial 0.12 0.07 0.00 50 43
5 Prestige Saleh Ahmed Commercial 0.08 0.04 0.00 100 47
6 Forum Mall Mysore Retail 0.37 0.19 0.08 45 103
7 TMS Square - Retail Retail 0.09 0.05 0.00 60 38
8 Forum Mall Shantiniketan Retail 0.64 0.41 0.16 70 344
9 Prestige Mysore Central Retail 0.08 0.05 0.05 60 36
Incremental rentals in FY18 2.41 1.45 0.38 1287
Total annualised rentals by March 2018 13.33 10.07 9.01 7,005

PRESTIGE GROUP | Presentation | March 2017
INDEX.
1. ABOUT PRESTIGE
2. OPERATIONAL HIGHLIGHTS
3. FINANCIAL HIGHLIGHTS
4. PROJECT PORTFOLIO & UPDATE
5. RECEIVABLES PROFILE
6. AWARDS & RECOGNITIONS
7. PROJECT STATUS
8. GUIDANCE VS ACHIEVED
34

PRESTIGE GROUP | Presentation | March 2017
P R O D U C T M I X | O N G O I N G P R O J E C T SSEG
MEN
T
GEO
GR
AP
HY
35
Segment No. of ProjectsDevelopable Area (Mnsf)
Residential 41 49.59
Commercial 8 5.53
Retail 6 3.04
Hospitality 3 2.07
Total 58 60.23
City No. of ProjectsDevelopable Area (Mnsf)
Bengaluru 47 52.03
Chennai 1 0.53
Cochin 5 3.50
Hyderabad 2 2.52
Mysuru 2 0.69
Mangaluru 1 0.96
Total 58 60.23
Residential
82%
Commercial
9%
Retail
5%
Hospitality
4%
Residential
Commercial
Retail
Hospitality
Bengaluru
86%
Chennai
1%
Cochin
6%
Hyderabad
4%
Mysuru
1% Mangaluru
2%
Bengaluru
Chennai
Cochin
Hyderabad
Mysuru
Mangaluru

PRESTIGE GROUP | Presentation | March 2017
P R O D U C T M I X | U P C O M I N G P R O J E C T SSEG
MEN
T
GEO
GR
AP
HY
36
Segment No. of ProjectsDevelopable
Area (Mnsf)
Residential 23 30.31
Commercial 10 15.70
Retail 2 1.78
Total 35 47.79
City No. of ProjectsDevelopable
Area (Mnsf)
Bengaluru 21 32.83
Chennai 5 6.07
Cochin 2 1.98
Mangaluru 3 0.77
Hyderabad 1 4.26
Ooty 1 0.07
Pune 1 1.40
Ahmedabad 1 0.42
Total 35 47.79
Residential, 63%
Commercial, 33%
Retail, 4%
Residential
Commercial
Retail
Bengaluru, 69%
Chennai, 13%
Cochin, 4%
Mangaluru, 2%
Hyderabad, 9%Pune, 3%
Ahmedabad, 1%
Bengaluru
Chennai
Cochin
Mangaluru
Hyderabad
Ooty
Pune
Ahmedabad

PRESTIGE GROUP | Presentation | March 2017
O N G O I N G P R O J E C T S | R E S I D E N T I A L
37
Sl.No Project CityDevelopable Area
(Mnsf)Economic Interest
Prestige Share (Mnsf)
No of Units Prestige Share of
Units
1 Prestige Golfshire Bengaluru 1.75 100.00% 1.75 228 228
2 Prestige White Meadows -T3/T4 Bengaluru 1.04 100.00% 1.04 151 151
3 Kingfisher Towers Bengaluru 1.15 45.51% 0.52 83 38
4 Prestige Hillside Retreat Bengaluru 0.11 75.00% 0.08 58 44
5 Prestige Ferns Residency Bengaluru 3.38 62.00% 2.10 1,483 919
6 Prestige Misty Waters Bengaluru 1.22 51.00% 0.62 558 285
7 Prestige Brooklyn Heights Bengaluru 0.30 62.00% 0.19 94 58
8 Prestige Spencer Heights Bengaluru 0.11 100.00% 0.11 34 34
9 Prestige Royale Garden - Phase I & II Bengaluru 3.15 68.50% 2.16 1,696 1,162
10 Prestige Sunrise Park - Phase I Bengaluru 1.69 99.00% 1.67 1,046 1,036
11 Prestige West Woods Bengaluru 1.34 60.00% 0.80 567 340
12 Prestige Augusta Golf Village Bengaluru 1.38 67.00% 0.92 460 308
13 Prestige Jade Pavilion Bengaluru 0.72 51.60% 0.37 266 137
14 Prestige Sunrise Park - Phase II Bengaluru 1.58 99.00% 1.56 864 855
15 Prestige Silver Spring Chennai 0.53 27.54% 0.15 121 33
16 Prestige Thomson Cochin 0.60 25.00% 0.15 238 60
17 Prestige Ivy Terraces Bengaluru 0.64 62.00% 0.40 315 195
18 Prestige Lakeside Habitat- Phase I & II Bengaluru 5.60 69.30% 3.88 2,488 1,724
19 Prestige Falcon City Phase I Bengaluru 4.98 42.84% 2.13 1,890 810

PRESTIGE GROUP | Presentation | March 2017
O N G O I N G P R O J E C T S | R E S I D E N T I A L
38
Sl.No Project CityDevelopable Area
(Mnsf)Economic Interest
Prestige Share (Mnsf)
No of Units Prestige Share of
Units
20 Prestige Bagmane Temple Bells Bengaluru 1.73 70.00% 1.21 968 678
21 Prestige Gulmohar Bengaluru 0.87 51.00% 0.44 404 206
22 Prestige Leela Residences Bengaluru 0.53 60.00% 0.32 88 53
23 Prestige Ivy League Hyderabad 0.97 60.00% 0.58 349 209
24 Prestige High Fields_Phase I Hyderabad 1.55 68.34% 1.06 665 454
25 Prestige North Point Bengaluru 0.40 51.00% 0.21 184 94
26 Prestige Pine Wood Bengaluru 0.62 44.00% 0.27 256 113
27 Prestige Woodland Park Bengaluru 0.38 50.00% 0.19 166 83
28 Prestige Woodside Bengaluru 0.41 60.00% 0.25 132 79
29 Prestige MSR Bengaluru 0.15 65.00% 0.10 66 43
30 Prestige Bougainvillea Platinum Bengaluru 0.13 60.00% 0.08 22 13
31 Prestige Falcon City Phase II Bengaluru 1.52 35.70% 0.54 630 225
32 Prestige Déjà vu Bengaluru 0.15 56.00% 0.08 40 22
33 Prestige Kenilworth Bengaluru 0.19 40.00% 0.08 42 17
34 Prestige Song of the South Bengaluru 2.28 69.04% 1.57 1,117 771
35 Prestige Hillside Gateway Cochin 1.55 70.00% 1.09 629 440
36 Prestige Kew Gardens Bengaluru 1.71 60% 1.03 979 587
37 Prestige Fairfield (Dollars Colony) Bengaluru 0.54 27.03% 0.15 165 45
38 Prestige Boulevard Bengaluru 0.26 100% 0.26 144 144

PRESTIGE GROUP | Presentation | March 2017
O N G O I N G P R O J E C T S | R E S I D E N T I A L
39
Sl.No Project CityDevelopable Area
(Mnsf)Economic Interest
Prestige Share (Mnsf)
No of Units Prestige Share of
Units
39 Prestige Misty Waters (Phase 2) Bengaluru 0.41 51.00% 0.21 198 101
40 Prestige Lake ridge Bengaluru 1.02 66.70% 0.68 560 374
41 Prestige Valley Crest (Bejai Property) Mangaluru 0.96 70.00% 0.67 510 357
Total - A 49.59 31.67 20,954 13,525

PRESTIGE GROUP | Presentation | March 2017
O N G O I N G P R O J E C T S
Off
ice
40
Sl. No Project CityDevelopable Area
(Mnsf)Economic Interest
Prestige Share (Mnsf)
1 Prestige Trade Towers Bengaluru 0.62 45.00% 0.28
2 Cessna Business Park B9-B11 Bengaluru 1.98 85.00% 1.68
3 Prestige TMS Square Cochin 0.17 58.00% 0.10
4 Prestige Falcon Towers Bengaluru 0.49 45.00% 0.22
5 Prestige Saleh Ahmed Bengaluru 0.11 50.00% 0.06
6 Prestige Technostar Bengaluru 1.60 80.00% 1.28
7 Prestige Central Street Bengaluru 0.18 55.00% 0.10
8 Prestige Logistics Centre, Malur Bengaluru 0.38 100.00% 0.38
Total - B 5.53 4.10
Re
tail
Sl. No Project CityDevelopable Area
(Mnsf)Economic Interest
Prestige Share
(Mnsf)
1 Forum Shantiniketan Bengaluru 1.08 64.00% 0.69
2 Forum Mysuru Mysuru 0.58 50.99% 0.29
3 Prestige Mysuru Central Mysuru 0.11 65.00% 0.07
4 Prestige TMS Square Cochin 0.12 56.00% 0.07
5 Forum Thomsun Cochin 1.06 25.00% 0.26
6 Prestige Cube Bengaluru 0.09 100.00% 0.09
Total - C 3.04 1.47

PRESTIGE GROUP | Presentation | March 2017
O N G O I N G P R O J E C T S
Ho
spita
lity
41
Sl. No Project CityDevelopable
Area (Mnsf)Economic Interest
Prestige Share (Mnsf)
No. of Keys
1
Conrad (Hilton)
Bengaluru 0.49 100.00% 0.49 285
2
Sheraton Hotel & Convention Center
Bengaluru 0.65 100.00% 0.65 360
3
Marriott Hotel & Convention Centre
Bengaluru 0.93 100.00% 0.93 297
Total - D 2.07 2.07 942
GRAND TOTAL 60.23 39.31

PRESTIGE GROUP | Presentation | March 2017
U P C O M I N G P R O J E C T S | R E S I D E N T I A L
42
Sl.No Project CityDevelopable Area
(Mnsf) Economic Interest Prestige Share (Mnsf)
1 Prestige Greenmoor Bengaluru 0.67 25.00% 0.17
2 Prestige Hillcrest Ooty 0.07 50.00% 0.04
3 Prestige Lakeside Habitat Phase III Bengaluru 3.29 69.30% 2.28
4 Prestige Primerose Hills Bengaluru 2.02 62.00% 1.25
5 Prestige Park Square Bengaluru 1.10 42.00% 0.46
6 Roshanara Property Bengaluru 0.22 100.00% 0.22
7 Mangaluru Villas Mangaluru 0.14 68.00% 0.09
8 Prestige Avalon Bengaluru 0.09 40.00% 0.03
9 Prestige Fontaine Bleau Bengaluru 0.20 60.00% 0.12
10 Prestige Dolce Vita Bengaluru 0.22 60.00% 0.13
11 Prestige Courtyards Chennai 0.90 70.00% 0.63
12 Prestige Lake ridge Bengaluru 1.02 66.70% 0.68
13 Prestige Cosmopoliton Chennai 0.18 100.00% 0.18
14 Prestige Jindal Property Bengaluru 4.65 37.23% 1.73
15 Prestige Verdant Vistas Mangaluru 0.29 60.00% 0.17
16 Prestige High Fields Phase II Hyderabad 4.26 68.34% 2.91

PRESTIGE GROUP | Presentation | March 2017
U P C O M I N G P R O J E C T S | R E S I D E N T I A L
43
Sl.No Project CityDevelopable Area
(Mnsf)Economic Interest Prestige Share (Mnsf)
17 Song of south Ph II Bengaluru 2.28 69.04% 1.57
18 Prestige Botanique Bengaluru 0.14 55.00% 0.08
19 Prestige Palm Residences Mangaluru 0.34 75.00% 0.26
20 Prestige Green Gables Bengaluru 2.02 60.00% 1.21
21 Prestige Elysian, Bannerghatta Road Bengaluru 1.09 30.60% 0.33
22 Prestige Falcon City- Phase II Bengaluru 1.59 35.70% 0.57
23 Prestige Pelican Drive, Chennai (Pallavaram) Chennai 3.54 31.62% 1.12
Total - A 30.31 16.23

PRESTIGE GROUP | Presentation | March 2017
U P C O M I N G P R O J E C T S | C O M M E R C I A L
44
Sl. No Project CityDevelopable
Area (Mnsf)Economic
InterestPrestige Share
(Mnsf)
1 Prestige Tech Cloud Bengaluru 4.48 86.00% 3.85
2 Prestige Tech Park IV Bengaluru 1.55 90.00% 1.40
3 Prestige Tech Pacifica Park (ORR) Bengaluru 1.65 62.95% 1.04
4 Mount road Chennai Chennai 0.32 45.00% 0.14
5 Prestige Strar Tech Bengaluru 1.82 51.00% 0.93
6 Kharadi, Pune Property Pune 1.40 66.75% 0.93
7 Gift City (Ahmedabad) Ahmedabad 0.42 100.00% 0.42
8 Cyber Green (Kochi Smart City) Cochin 1.46 100.00% 1.46
9 Prestige Retreat Bengaluru 1.48 100.00% 1.48
10 Prestige First World, Omr, Chennai Chennai 1.13 47.6% 0.54
Total - B 15.70 12.19
Off
ice
Re
tail
Sl. No Project CityDevelopable
Area (Mnsf)Economic
InterestPrestige Share
(Mnsf)
1 Prestige Hillside Gateway (Kakanad) Cochin 0.52 70.00% 0.36
2 Falcon City Forum Mall Bengaluru 1.26 35.70% 0.45
Total - C 1.78 0.81
GRAND TOTAL - A+B+C 47.79 29.23

PRESTIGE GROUP | Presentation | March 2017
L A N D B A N K
Potential Developable area of 42 mn sft (Prestige Share 28 Mn sqft)
Sl. No Entity Name Location Land Area (Acres) Economic Interest PEPL Share (Acres)
1 Prestige Bidadi Holdings Pvt Ltd Bidadi 143 100% 143
2 Prestige Projects Pvt Ltd Sarjapur/Bengaluru 182 33% 59
3 Prestige Estates Projects Ltd Bengaluru 2 100% 2
4 Village D Nandi Pvt Ltd Bengaluru 23 100% 23
5 Eden Investments Goa 74 78% 57
Total 424 284
45

PRESTIGE GROUP | Presentation | March 2017
INDEX.
1. ABOUT PRESTIGE
2. OPERATIONAL HIGHLIGHTS
3. FINANCIAL HIGHLIGHTS
4. PROJECT PORTFOLIO & UPDATE
5. RECEIVABLES PROFILE
6. AWARDS & RECOGNITIONS
7. PROJECT STATUS
8. GUIDANCE VS ACHIEVED
46
PRESTIGE GROUP | Presentation | March 2017
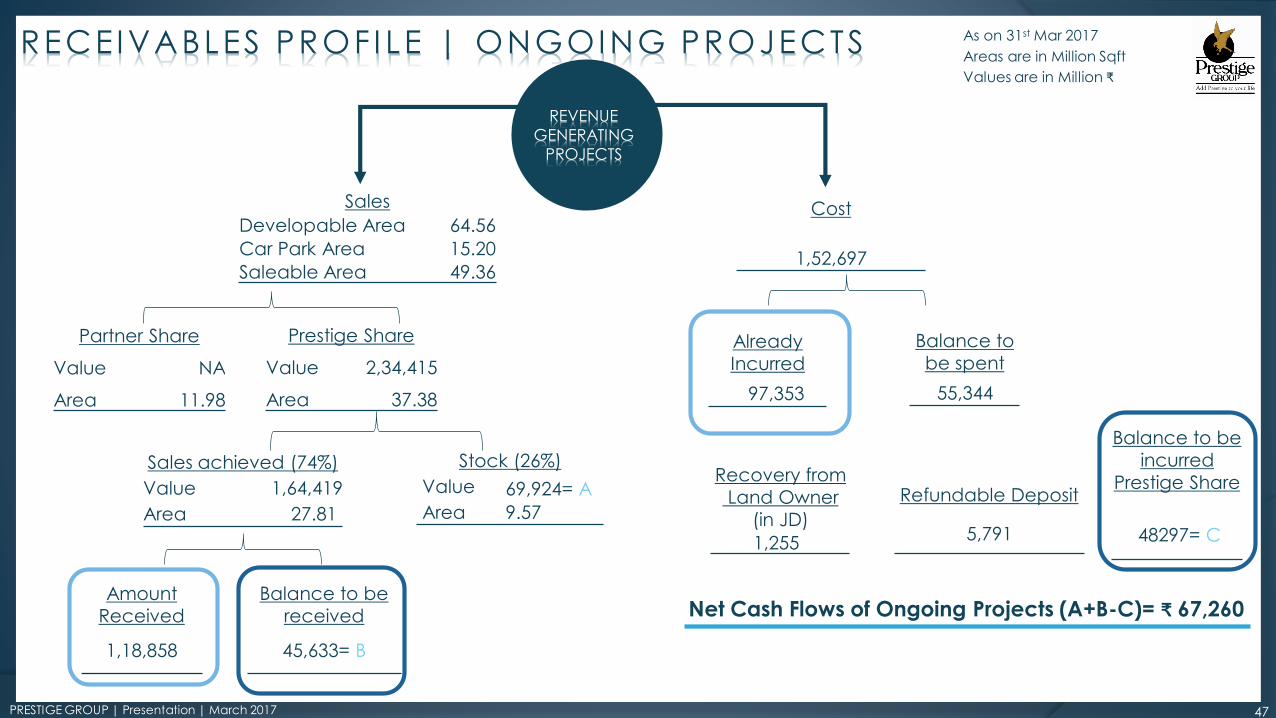
As on 31st Mar 2017
Areas are in Million Sqft
Values are in Million ₹
Sales
Developable Area 64.56
Car Park Area 15.20
Saleable Area 49.36
Prestige Share
Value 2,34,415
Area 37.38
Sales achieved (74%)
Value 1,64,419
Area 27.81
Stock (26%)
Value 69,924= A
Area 9.57
Amount
Received
1,18,858
Balance to be
received
45,633= B
Already
Incurred
97,353
Balance to
be spent
55,344
Recovery from
Land Owner
(in JD)
1,255
Refundable Deposit
5,791
Balance to be
incurred
Prestige Share
48297= C
Cost
1,52,697
RECEIVABLES PROF I LE | ONGOING PROJECTS
Net Cash Flows of Ongoing Projects (A+B-C)= ₹ 67,260
Partner Share
Value NA
Area 11.98
REVENUE
GENERATING
PROJECTS
47

PRESTIGE GROUP | Presentation | March 2017
S T O C K B R E A K U P As on 31st Mar 2017
Areas are in Million Sqft
Values are in Million ₹
Category Area Value
Premium & Luxury Projects 2.11 22,787
Mid Income Projects 6.48 40,249
Commercial Projects 0.44 2,850
Completed Projects 0.54 4,038
Total 9.57 69,924
48
PRESTIGE GROUP | Presentation | March 2017
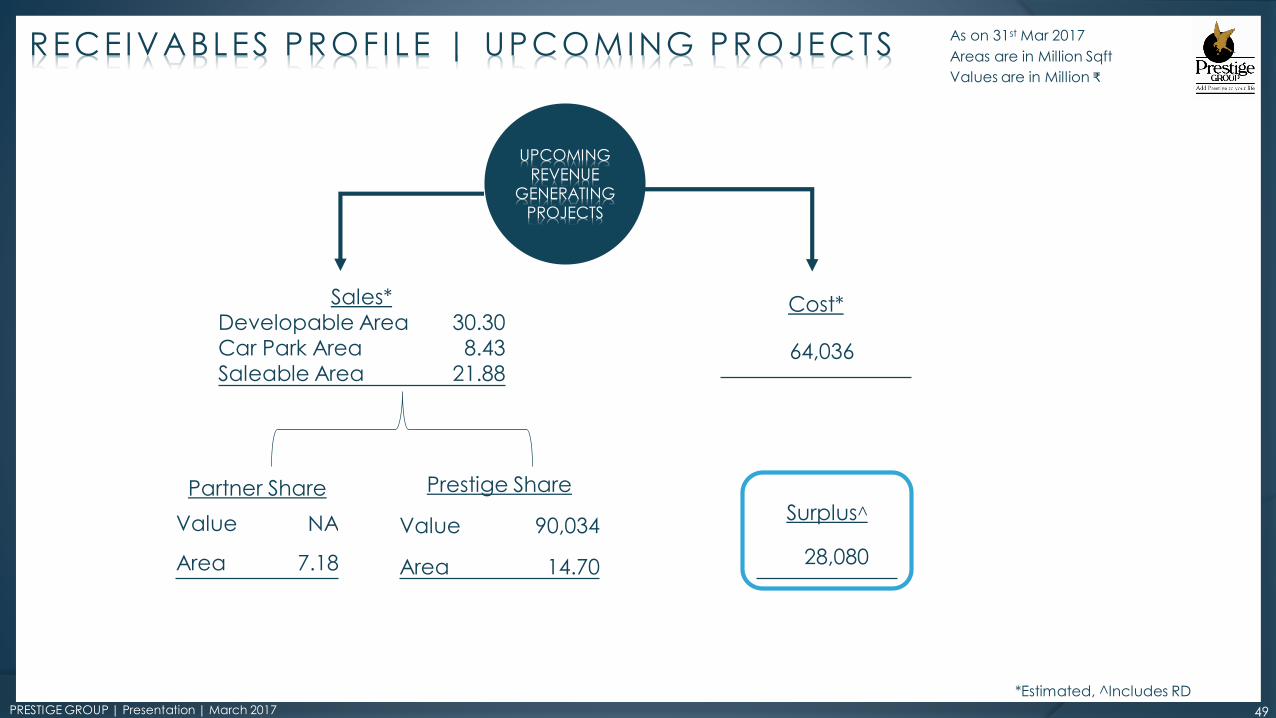
Sales*Developable Area 30.30 Car Park Area 8.43 Saleable Area 21.88
Cost*
64,036
Partner Share
Value NA
Area 7.18
Prestige Share
Value 90,034
Area 14.70
Surplus^
28,080
As on 31st Mar 2017
Areas are in Million Sqft
Values are in Million ₹
RECEIVABLES PROF I LE | UPCOMING PROJECTS
*Estimated, ^Includes RD
UPCOMING
REVENUE
GENERATING
PROJECTS
49

PRESTIGE GROUP | Presentation | March 2017
R E N T A L I N C O M E As on 31st Mar 2017Areas are in Million SqftValues are in Million ₹
*Estimated
OFFICE SPACE
Leasable Area
8.07Leasable Area
2.96
Leasable Area
11.04
Prestige Share
Leasable Area
7.41
Prestige Share
Leasable Area
2.14
Prestige Share
Leasable Area
8.54
Gross Rental
Income p.a
4,675
Gross Rental
Income p.a
2,834*
Gross Rental
Income p.a
8,172*
Prestige Share-
Income p.a
4,322
Prestige Share-
Income p.a
1,880*
Prestige Share
Income p.a
6,097*
UPCOMING
22.08
18.09
15,680
12,299
TOTALUNDER
CONSTRUCTIONOPERATING
50

PRESTIGE GROUP | Presentation | March 2017
R E N T A L I N C O M E
RETAIL
Leasable Area
2.86Leasable Area
1.93
Leasable Area
1.34
Prestige Share
Leasable Area
1.22
Prestige Share
Leasable Area
0.90
Prestige Share
Leasable Area
0.61
Gross Rental
Income p.a
3,019
Gross Rental
Income p.a
1,785*
Gross Rental
Income p.a
1,832*
Prestige Share
Income p.a
1,415
Prestige Share
Income p.a
763*
Prestige Share
Income p.a
774*
OPERATING
UNDER
CONSTRUCTION UPCOMING
6.12
2.73
6,636
2,952
TOTAL
As on 31st Mar 2017Areas are in Million SqftValues are in Million ₹
*Estimated
51

PRESTIGE GROUP | Presentation | March 2017
H O S P I T A L I T Y I N C O M E
HOSPITALITY
Total Keys
617
Prestige Share
Keys
405
Gross Operating
Income p.a
1,294
Gross Operating
Income p.a
2,134*
Prestige Share
Income p.a
878
Prestige Share
Income p.a
2,134*
OPERATING UNDER
CONSTRUCTION
1,559
1,347
3,428
3,012
TOTAL
Total Keys
942
Prestige Share
Keys
942
As on 31st Mar 2017Values are in Million ₹
*Estimated
52

PRESTIGE GROUP | Presentation | March 2017
INDEX.
1. ABOUT PRESTIGE
2. OPERATIONAL HIGHLIGHTS
3. FINANCIAL HIGHLIGHTS
4. PROJECT PORTFOLIO & UPDATE
5. RECEIVABLES PROFILE
6. AWARDS & RECOGNITIONS
7. PROJECT STATUS
8. GUIDANCE VS ACHIEVED
53


PRESTIGE GROUP | Presentation | March 2017 55
Q 4 F Y 1 7 A W A R D S & R E C O G N I T I O N
Best Construction Projects | CIDCVA
Prestige White Meadows, Trinity Centre, Prestige Summer fields, Silversun, Jade Pavilion

PRESTIGE GROUP | Presentation | March 2017 56
Q 4 F Y 1 7 A W A R D S & R E C O G N I T I O N
Premium Villa project of the year - Prestige Summerfields Shopping centre of the year - Forum Koramangala
Best innovative shopping centre - Forum Fiza Mall

PRESTIGE GROUP | Presentation | March 2017
INDEX.
1. ABOUT PRESTIGE
2. OPERATIONAL HIGHLIGHTS
3. FINANCIAL HIGHLIGHTS
4. PROJECT PORTFOLIO & UPDATE
5. RECEIVABLES PROFILE
6. AWARDS & RECOGNITIONS
7. PROJECT STATUS
8. GUIDANCE VS ACHIEVED
57

PRESTIGE GROUP | Presentation | March 2017
P R O J E C T S N A P S H O T S | R E S I D E N T I A L P R O J E C T S
PRESTIGE SUNRISE PARK KINGFISHER TOWERS
PRESTIGE PINE WOOD PRESTIGE WEST WOODS PRESTIGE ROYALE GARDENS
PRESTIGE AUGUSTA GOLF VILLAGE
58

PRESTIGE GROUP | Presentation | March 2017
P R O J E C T S N A P S H O T S | R E S I D E N T I A L P R O J E C T S
PRESTIGE MISTY WATERS PRESTIGE LAKESIDE HABITAT
PRESTIGE SILVER SPRINGS,PRESTIGE IVY TERRACES PRESTIGE GULMOHAR
59
PRESTIGE FALCON CITY

PRESTIGE GROUP | Presentation | March 2017
CESSNA- B11
P R O J E C T S N A P S H O T S
CESSNA- B9
CONRAD HOTEL
SHERATON HOTEL
60
FORUM MYSORE MALL
FORUM SHANTINIKETAN MALL

PRESTIGE GROUP | Presentation | March 2017
INDEX.
1. ABOUT PRESTIGE
2. OPERATIONAL HIGHLIGHTS
3. FINANCIAL HIGHLIGHTS
4. PROJECT PORTFOLIO & UPDATE
5. RECEIVABLES PROFILE
6. AWARDS & RECOGNITIONS
7. PROJECT STATUS
8. GUIDANCE VS ACHIEVED
61

PRESTIGE GROUP | Presentation | March 2017
G U I D A N C E V S A C H I E V E D Value in ₹ MillionVolume in Mnsqft
62
ParticularsTarget for Full Year
(FY17) Achieved As of FY17 % Achieved
New Sales Value 35,000 - 40,000 24,585 70%
Turnover 40,000 - 45,000 48,617 122%
Collections 40,000 - 45,000 41,232 103%
Launch Volume 10 - 12 1.98 20%
Completions 10 - 12 12.74 127%
Leasing Volume 1.50 - 2.00 1.26 84%
Exit Rental Income 6,000 - 6,250 5,717 95%
Debt Equity Ratio
Consolidated 1.00 - 1.25 1.11
Standalone 0.60 - 0.75 0.52

PRESTIGE GROUP | Presentation | March 2017 63
Particulars Target for FY18
New Sales Value 35,000
Collections 42,500
Launch Volume 10.00
Completions 12.00
Leasing Volume 2.50
Exit Rental Income 6,750 - 7,000
Debt Equity Ratio
Consolidated 1.15
Standalone 0.56
F Y 1 8 G U I D A N C E Value in ₹ MillionVolume in Mnsqft
PRESTIGE GROUP | Presentation | March 2017
This presentation has been prepared by Prestige Estates Projects Limited (“Company”) solely for
providing information about the Company. It contains certain forward looking statements
concerning Prestige Estates Projects Ltd’s future business prospects and business profitability, which
are subject to a number of risks and uncertainties and the actual results could materially differ from
those in such forward looking statements. The risks and uncertainties relating to these statements
include, but are not limited to, risks and uncertainties, regarding fluctuations in earnings, our ability
to manage growth, competition, economic growth in India, ability to attract and retain highly skilled
professionals, time and cost over runs on contracts, government policies and actions with respect to
investments, fiscal deficits, regulation etc., interest and other fiscal cost generally prevailing in the
economy. The company does not undertake to make any announcement in case any of these
forward looking statements become materially incorrect in future or update any forward looking
statements made from time to time on behalf of the company.
D I S C L A I M E R
64

PRESTIGE GROUP | Presentation | March 2017
Venkata K. Narayana
Executive Director, Finance & CFO
Phone: +91 -80 – 25001280
E-mail: [email protected]
Registered Office
Prestige Estates Projects Limited
The Falcon House,
No. 1, Main Guard Cross Road,
Bangalore –560 001
Phone: +91 -80 –25591080, Fax: + 91 –80 -
25591945
Website: www.prestigeconstructions.com
T H A N K Y O U
65