Embed Size (px)
Citation preview

__i_̧iiiiiiiiii_iliiiiiiiiiiiiiii.....__ _!ii_iiii_ii_iiiiiiiiiiiiiiiiii!iiii

_?_!i_i!_!i_iii_iii!iii_iiiiiiii!iiiiiii_i_iiiiiiiiiiiiiiiiiiiiiiiiiiiiiiiii!i___iii_i_ii_i_i_iiiiiiiiiiiiiiiiiiiiiiiiiiiiiiiiiiiiiiiiiiiill
he numerical simulation of precipitationhelps scientists understand the complex
mechanisms that determine how and why
rainfall is distributed across the globe.
Simulation aids in the development of forecast-
ing efforts that inform policies regarding the
management of water resources. Precipita_on
modeling also provides short-term warnings for
emergencies such as flash floods and mudslides.
Just as precipitation modeling can warn of an
impending abundance of rainfall, it can help
anticipate the absence of rainfall in drought.
What constitutes a drought?
A meteorological drought simply means
that an area is getting a significantlylower amount of rain than usual over
a prolonged period of time.
An agricultural drought is based on thelevel of soil moisture.
As we learn more about what drives precipitation, we can anticipate extreme fluctuations in rainfall, leading to droughts and floods.
57

i!i_i!_i,i!ii_!'i!_ii_iiii_ii _.... •
iiiiiiiiiilii_
Precipitation is a vital link in the hydrological cycle that moves water through land, sea, and ain
A hydrological drought focuses on
lower precipitation levels that reducebodies of water on the surface, such
as lakes and streams.
A socioeconomic drought takes intoaccount human activities, such as theconstruction of dams and terrain
shaping, that alter the distribution ofsurface water.
A numerical model for drought prediction is
shaped by the drought criteria that are selected.
The meteorological definition of drought focuses
primarily on the amount of precipitation. The
agricultural and hydrological definitions require
model components not only for precipitation but
also for soil moisture absorption and evapora-
tion of water. The socioeconomic view of
68

iiiiiiiiiiiiiiiiiiiiiiiiiiiiiiiiiiiiiiiiiiiiiJiiiiiiiiiiiiiiiiiiiiiiiiiiiiiiiiiiiiiiiii_Ee_p[_t[O..Niiiiiiiiiliiiiiiiiiiiiiiiiiiiiiiiiiiiiiiiiiiiiiiiiiiiiiiiiiiiiiiiiiiiiiiiiiiiiiiiiiiiiiiiiii_iiiiiiiiiiiiiiiiiiiiiiiiiiiiiiiiiiiiiiiiiiiiiiiiiiiiiiiii!iiiiiiiliiiiiiiiiiiliiiii!iliiiiiiiii!ii!iiiiiiiiiiiii!iiii@iiiIii_!@i_iiiiiiii i iiiiil!iiiiiiii_iiiii_i_i_i_i_i_i_i_i_i_i_i:_i_i_i__i_!_i_i_i_i_i_i_i___________________________________.............._ _:ii iliiiiiiiii!ili!iiii!ii!iiii!i!iiiiiiiiiiiiiiiiiiiiiii!iiiiiiiiiiiiiii!iiilliiiiiii!!iiiili!iiii!ii!!iiiiiii!iiiiiiiiii!i!ili!i!!ii!iiiiiii_'_'_i'i'i'_'_'ii_'_i_'_'
Monsoons
and August means _e end of the long d_ season... A monsoon that is either too strong or too weak
may lead to flooding or drought. _!b help predict monsoon streng_ and.to understand the interac,
tion between monsoon and other atmospheric phenomena, we must understand why monsoons
exist, what accounts for the circulation field of a monsoon, and why monsoon onset is:abrupt.
The two types of monsoon are summer and winten Despite their names, boO'monsoons take place
during_ ...........the July-August. season. The main difference .is in their location, The su er monsoon
takes place more than 10 degrees north of the Equator, where the season_is summer.. Likewise, the
winter monsoon is located south of the Equator, where July is in the middle of winter.
The summer monsoon is a con_nental_size convective system &aracterized by a l_ge preapita-
tion region. This region is identified as an off-equator_aI inter t con nce zone (ITS)' The
strongest summer monsoons r near southern Asia. Monsoons also r near Australia, North.
and Sou_ America, and Africa.
In a northern summer ;monsoon, the prevailing winds at the low levels are from the sou st. At
that does not occur elsewhere in the tropics.. . , -.
Just as low-level Winds run southwesterly in the nor,hem summer monsoon, they run sou t-
erlv in the southern winter monsoon. Ancient mariners depended on this seasonal &ange of pre-
vailing wind to.sail be_'een India and. Africa.
in the monsoon onset process, the shi_ from near the Equatorto more than 10 degrees away
in days. Compared With the movement of the Ea:rth,s flit toward the Sun, this change is rapid.
Like any Iarge-scaI.e drcutation, the monsoon is highly influenced by the Cofiolis force. TNslforce,
wN.ch is created by the Earth,s rotation, es rd the right of wind dir_on in the Northern
Hemisphere and toward the left of wind air.on in the Southern Hemisphere. Atthe low levels,the air mass flows toward an I in the Northern Hemisphere from the other side of the Equator,
"iNe wind direction, which is influenced by the Coriotis force, enters the northern hemisphere from
the southeast. After the air mass crosses the Equator, the direction changes to a southwesterly flow:
Wind flow also comes .from the north of the .GCZ, but its strength, is much weaken
At upper levels, the: airflow must return in the opposite direction. The circulation .field and the con-
vective heating in the I'tCZ precipitation region::interact; yet, neither causes the other.
59

0ooo00i oi0ooi
drought, with its dependence on human action,
may be the most difficult version to quantify in a
simulation.
Accurate precipitation modeling can also
improve understanding of other environmental
issues. For example, rain droplets absorb certain
airborne pollutants and remove them from the
atmosphere when they fall to the ground.
Therefore, models of atmospheric composition
can benefit by incorporating a precipitation
component.
As scientists studied global precipitation, they
noted a correlation between the amount of rain-
fall in particular areas of the world and other
weather conditions. For example, in certain
regions, droughts are strongly associated with
the warm or cold phase of the E1 Ni_o-Southern
Oscillation cycle. Indeed, evidence links global
patterns of sea surface temperature (SST) to
regional precipitation patterns across the
decades. However, as evidenced in the second
research profiles that follows, SST explains only
a portion of precipitation variability.
Precipitation simulations are usually compared
to actual rainfall measurements to test their accu-
racy. These measurements can be derived from
rain gauges at specific points on the ground.
Remote sensors based on radar and satellite
instruments are a more practical means of col-
lecting data to estimate rainfall over larger..
regions.
References
Browning, K. A., and Gurney, R. J. (Eds,), Global
Energy and Water Cycles, Cambridge University
Press, 1999
Collier, C. G., World Meteorological
Organization Operational Hydrology Report
No. 46: Precipitation Estimation and Forecasting,
2000
Linacre, E., and Geerts, B., Climates and Weather
Explained, Routledge, 1997
Sorooshian, S., "Hydrologic forecasting,"
Encyclopedia of Earth System Sciences, Vol. 2,
Academic Press, 1992
Trenberth, K. E. (Ed.), Climate System Modeling,
Cambridge University Press, 1992
Wilhite, D. A. (Ed.), Drought Volume I"A Global
Assessment, Routledge, 2000
6O

ili_ii!i!¸ • ............................i__i!i!iiiiiiilLiiiiiiiiiiiiiiiiiiiiiiii!ililiiiiiiiii
Research Profile-The Role of Landmass in MonsoonDevelopment ...............
Investigator: _ " _Winston Chao, NASA Goddard Space Flight Center, Climate and Radiation Branch _
Since the 17th century; a fundamental belief has
prevailed that the basic cause of a monsoon is
the contrast in surface temperatures between the
continents and the oceans. Research using
general circulation model (GCM) experiments
demonstrated that this belief should be changed.
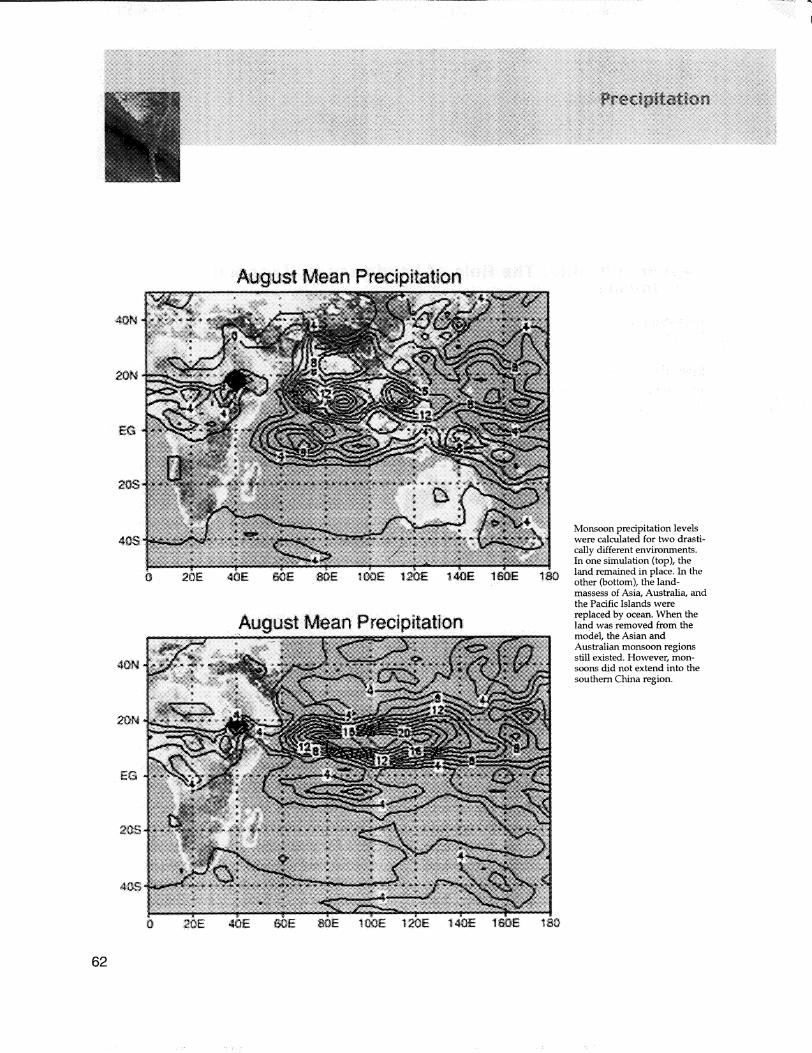
In an experiment in which the researchers
replaced the landmasses of Asia and Australia
with ocean, the simulated Asian and Australian
monsoons remained largely intact. The figures
on page 62 show the monsoon precipitation
averaged for the month of August in a 4-year
model integration. The upper panel shows the
control experiment with the continents intact.
For the lower panel results, ocean replaced the
continents.
Further experiments showed that in the Asian
monsoon, the change resulting from the replace-
ment of continents with ocean was caused more
by the removal of topography than by the
removal of land-sea contrast. Whereas land-sea
contrast played a minor modifying role in the
Asian summer monsoon, it played an important
role in the African and South American summer
monsoons. However, that role was not irreplace-
able. If an ocean with a high enough SST
replaced Africa or South America, the monsoon
continent.
To understand why monsoons exist is to under-
stand why the ITCZ exists in particular
off-Equator regions during the summer. In an
aqua-planet model with zonally uniform SST, the
ITCZ is zonally uniform and located at the tropi-
cal latitudes where SST is high. The solar energy
absorbed by the surface at these areas heats the
air above and controls the location of convective
precipitation.
The SST is only one factor that determines the
location of the ITCZ. Another influencing factor
is the Earth's rotation, which pulls the ITCZ
toward _o different latitudes at around
13 degrees north and south of the Equator.
Therefore, ITCZ is often observed at both
locations,
When researchers varied the distribution of SST
in the simulation, the ITCZ was no longer
zonally uniform but concentrated somewhat to
the west of the longitudes where SST was
highest. The model then gave a precipitation and
circulation field that was very close to real-world
observations. Therefore, researchers concluded
that landmass is not a necessary condition for
monsoons.
61
August Mean Preci pitation, ................" ................................................................._:_-_:_-_-_-_............................................,_...............;,;_,,,,w,_,,,_...................:_._._......._=,:._`:_:_::_:_:_:_;_:_:_:_:_:_:_:_:_:_:;i_:;_:_:__ii`
•:_ :_,.:...'":::_.... "" :::::ii.... ..,_,_i_i_'.<..=:,!,i:_i:__>...#ii:_" ._:_:::!:_ii:::__:_ii'_ ...... "i!!_i!!!::_' :t='""_>..""_i_i__,_...... _!::_i:!_.::.!" _i_i_" _:.::!:,_._
iii_ii:_;:_`_.............::_iii_ii_::
20: _,_ii_i:_::::_.........',_ii_:_:::_........ '::::::::::::::::::::::...............ii!iii_....• .....................
iiii:!:ii!ii::::ii::i_::ii:ii:::_i:i:!_! _!:!
:8...............................20E::...............................40E:::::::........:::::::_E:::_:::::::::....=====================:::_E•...........................:i_E::_::..................................::_:E:::::.....................:-:::::_'E_..............I:_E::"::::....................:_':!:!:_
AUgUSt":' " Mea_ _:e[ecip|ta|._o'"": nl
:i _:_ii:iiil_ i
.... i iiiii._::...i::::i;_: ::::::::::::::::::::::::::::::::::::.............. >::_s:iN::::1
........ ==========================I__..: ::::::::::::::::::::::::::_! :_iii_iliii_iii:i!iiiii_ii_i_iiiilii%J!i
: :::::::::::::::::::::::::::::::::::::::::...............::::i..... ::_:_::::_.'>":::*::._:_i
0 20E: 40E
:_:::_:_._iiilii_iiiiii::::::i:iiiliiiiilil::_:_:_':.................iiiii!:._:_:_ii:iiiiiiiiiii!&._:_i:!_iiiiiiiiii:iii:iii_i_:ii_i:iiiii:::::_i:ii::_i'_..........====================================.......,..":_ii:iii_iiiii:i:::iiiiiiilii|:::_:_::::_i_:::_:_:_:_:_._:_:_::::_:::_.4."_:::..... =======================================:::::::::::::::::::::::::::::::::::::::::::::::::::....... ::@_i:_" ._f" =======================
_:_:_>..'_::_{_:_#.;_i:_:_:_i:_:_'_J_::_:_:_:_i::l:::::_:_I:_I:1::: ::::::::::::::::::::::::::=====================================:_:::i:>..:_i:_:_..::_:_..::_: .::_?:: .::&: :i:::::::::_::ii:...,:._::li_
• ...............................>::iNiii:: ::'_iiii!!_i!ii:!'_".::iI_:_iN.. "_:_:" .,_N::_....::%: '_::::::?::i:__:. :_::i::iI_.....:_iilii:Z_I::::_i_I.. ._ii:il_i:::
:_.. ._,:.:.. . :.._..::>..,........... .....
iiii:_i!:_....
i
Monsoon precipitation levelswere calculated for two drasti-
cally different environments.In one simulation (top), theland remained in place. In theother (bottom), the Iand-massess of Asia, Australia, andthe Pacific Islands were
replaced by ocean. When theland was removed from the
model, the Asian andAustralian monsoon regionsstill existed. However, mon-soons did not extend into the
southern China region.
62

..... _i.......1 i _i i ii ¸ i!i ii_iiii!i!i!i! ii i!i i̧
_i!!i!!!!!!!!i!!i!!i!i!ii!!!!!!!!!i!!!!!i!!!!!!!!!!!i!i!!!!i!!!!!!!!!!!!!!!!i!!!!!!!!i!!!!!i!!!i!i!!!i!i_!!_ _ !i_ !_!!iiii_iliiiiii!!ili!i_! _! _!i !!_! i!_ !!!!!!!!i!!!i!!!!!!!i!!!i!!!i!!!i!!!!!!!!!!!i!!!i!!!i!!!i!!!!!!!!!!i!i!!!!!!!!!!!!i!!!!!i!_i!ii_ii_ ii!!ii_!_i__i!!!_!_i!il_ii!ii!i_!!i!!!!!!!!!i!!!!!!!!!!!i!!!!!!!!!!ii!!!!!!!i!!!!!!!!!i!!!i!!!i!!!i!!!!!!!ii!!!!!!i!!i_!!!_!i!!!!!!!!!i!!!_!i!!!!i_!!!!!!!!!!i!i!!!!ii!!!i!!!_i!i!!!!!!!!i!!!i!!!i!i!!!!!!i!!!!!!!!!!i!!!i!!!!!!!!!!!!!!!!!!!i!i!!!ilii!!!!!ii!!i!!!!!!!!!!!!iiii!!i!!!!!!!!!i_ii_i!!!!i!!!!iii!!i!!!i!!!i!!!i!!!!illi!iii_!_i_i!i_!_!iIi!i!_i__!_ii_ii_ii_i_i!i!!i!if!!_ii!_!!!i!iii!i!!i!!_ii!_!!!!ii!!!!!!i!!!i!!!!!!!i!!!i!!!i!!i!!!!!!!!i!!!!!!!!!!!i!!!!!!!ii!!!!!!!iii!i!!!i!iii!_!i_!ii!i!!!!!!!i!!!ii!!!i!!i!!!!ili!iiiii!ii!:_:_:_:::_:::::_:::_:::_:_::_i:::_:_:_::_::::::::::_:_:_:::::::::::__:::_:::::_::::_:::_::_::::::::'_:
ii i i !iliii!iiiiiiiiiiiiiiiiiiiiiiiii!iiiii!iiii!iiii!iiiiiiiiii!iiiiiiiiiii!iiiiiiiiiliililiiiiiiiiiiiiii!ii!iiiiiiiiiiiiiiiiiiiiiiiiiiiii!i ____!ii__!i!iiiiiiiii!_!__i!i_i_!!i!ii_ii_i_i__iiiiii__ii__iiiiiii_!ii!iiiiiiii_iii_i__iiiiiiiiiiiiiiiiii_iiiii_iiiiiii_iiiiiiiiiii_iii_ii__iiiiiiiiiiiii_!iiii!i!_i!!iii
The research project also showed that the
monsoon process is similar to the flipping of a
light switch. When a switch is pushed gently
and persistently, it flips from one stable state to
another very quickly. Likewise, the ITCZ is
pushed toward the poles by the seasonal merid-
ional movement of the peak of the SST. This
movement is countered by another force that is
produced by the Earth's rotation. When the latter
force finally gives way, the ITCZ suddenly jumps
away from near the Equator, and monsoon onset
Occurs.
Chao's numerical experiments with an atmos-
pheric GCM have demonstrated the monsoon i
onset process. The circulation field associated
with the ITCZ determines the equatorial surface
winds that, in turn, determine SST near the
equator. Therefore, study of monsoons or the
ITCZ is highly relevant to the study of E1 Nifio.
The experiments used the God dard Earth
Observing System (GEOS) atmospheric GCM,
running on the NCCS Cray SV1 supercomputer.
63

• _i_ili_i!_!__iii__i_!_i/_¸ ii̧ ii_• • _: i:> _¸¸=_
!iiii!iiiiiiii
Research Profile- The Relationship Between Precipitation andSea Surface Temperature on Decadal Time Scales
Investigators:Siegfried Schubert, Max Suarez, and Philip Pegion, NASA Goddard Space Flight Center, DataAssimiilation Office
This research project examined the possibility of
a connection between SST and precipitation on
multiyear time scales. In particular, the research
focused on rainfall over the Great Plains region
of the United States during the summer months.
The researchers ran nine simulations of precipi-
tation, spanning the years 1930 through 1999,
using the NASA Seasonal-to-Interannual
Prediction Project (NSIPP) atmos _heric GCM.
They used 64 of the NCCS Cray T3E computer's
1,360 processors to conduct these 70-year runs.
The associated data was stored on the NCCS's
Sun El0000 UniTree storage system. "
A Cray support member from the NCCS helped
speed up the progress of this effort. He located a
default setting that prevented the model code
from running at full speed. He also showed the
researchers how to buffer the data output and
speed up run times even further. These efforts
reduced run times by 13 percent. Overall, the
Cray T3E calculated more than 225,000 days of
model simulation in only 700 days of computing
time, spread across the 64 processors devoted to
this project.
Each simulation run was forced with the same
set of observed SST measurements. However,
initial atmospheric conditions were different. If
the same SST data produced similar patterns of
precipitation over the Great Plains, even with
different atmospheric conditions, the results
would demonstrate a link of predictability
between SST and precipitation.
The nine runs showed different levels of rainfall;
therefore, overall this experiment did not indi-
cate a strong link between SST and precipitation.
However, the simulated results did share simi-
larities with actual rainfall records. Nearly all the
This graph lays out nine simulations of Great Plains rainfall. Theblack lines represent the individual simulation runs, and the greenline is the ensemble mean. The red and blue lines represent variousobservational estimates.
64

These color maps indicate the negative correlation between certain
meteorological measurements and calculations for precipitation
over the Great Plains region. The bottom map shows SST correla,
tion, and the top map shows the correlation for the altitude at
which air pressure reaches a measurement of 200 millibars (mb).
Because this project is concerned with the absence of precipitation,
negative correlations are mapped.
runs indicated dry conditions during the 1930s, .
followed bywet conditions in the next decade.
This result matches the infamous "Dust Bowl"
drought of the Great Depression era.
In contrast, only one of the nine simulations
replicated conditions similar to another major
Great Plains drought that took place in the 1950s.
In fact, some simulation runs produced multi,
year droughts even when no anomalies in SST
levels were present.
After they completed the simulation runs, the
researchers mapped the correlation between
Great Plains precipitation and SST. The correla-
tion revealed a decades-spanning SST pattern
across the Pacific Ocean that is linked to rainfall
variations in the Great Plains region. When the
Pacific pattern is in its warm phase, the Great
Plains region gets more precipitation than usual.
C onversel)¢ drought conditions tend to occur in
this area when the Pacific SST pattern is in a cold
phase. Several additional atmospheric GCM runs
confirmed this correlation.
Overall, the project results suggested that the
ability to predict Great Plains droughts depends
in part on the ability to predict the long-term
behavior of the Pacific SST pattern.
65