Embed Size (px)
Citation preview

AD-AG92 241 I4SSCHUSETTS INST OF TECH CAMBRIDGE DEPT OF MATERIA-ETC F/s 11/9.OLECULAR FRACTION BEH4AVIOR IN ORIENTED POLYMERS.CU)
UNCA J 80 R K POKI, D K ROYLANCE DAA629-76C-009F
ICLASSIFIED ARO-13630.3-MSX MLmonolnlfl/l//
IEEEMh ENh-EEEEMII/EI-/I-.--/-- Eu--/II-IEEE|///

11112.0
111111!25 LA
MICROCOPY RESOLUTION TEST CHART

LEVJMOLECULAR FRACTURE BEHAVIOR IN
ORIENTED POLYMERS
C
C3 Rakesh K. PopliDavid K. Roylance
June 1980
Final ReportContract Number DAAG-29-76-C-0O44 . '
Approved for public release;distribution unlimited
Prepared forU.S. Army Research Office
P.O. Box 12211
Research rrhql. Park, NC 27709

S. - - -ST T-- -- -
SECURITY CLASSIFICATION OF THIS PAGE (WSha, Date Entered) _________________
REPOT DCUMNTATON AGEREAD INSTRUCTIONS______ REPORT___________________PAGE_ BEFORE COMPLETING FORM
1. REPORT NUMBER - 2. GOVT ACCESSION NO. 3.RCPETSCTLGNME
POLECUI.AR FRACTURE PEHAVIOR IN 917-/17
ORIENTED POLYMERS, 6. PERFORMING ORO. REPORT NUMBER
7. AUT2&& S. CONTRACT OR GRANT NUMBER(e)
RakshK .Poli tDavid K./ Roylance - DAA j9-7--O4~
9. PERFORMING ORGANIZATION NAME AND ADDRESS 10. PROGRAM ELEMENT, PROJECT. TASK
Massachusetts Institute of Technology AREA & !~1 4 M~W3RS
Department of Materials Science and Engineering -
It. CONTROLLING OFFICE NAME AND ADDRESS
P.O.Box 221113. M1&TIR OF PAGES
1.MONITORING AGENICY NAME B& ADDRESSQil different from Controlinfd Office) IS. SECURITY CLASS. (of thlo report)
.. ~ *~ ~ ~ S..DECASSIFICATION/OOWNGRADING
p . ,N SCHEDUL
16. DISTRIBUTION STATEMENT (of this Report)
Approved for public release; distribution unlimited.
17. DISTRIB UTION STATEMENT (of the abetrect entered in Block ".0I different froM Report) -
IS. SUPPLEMENTARY NOTES
WHE VIEW, OPiNIIONS. ANV/OR FINDINGS CONTAINED) IN THIS REPO"T'-
ARE THO~sE CO THE AUTI-1.R(,S) AND SHOCULD 0T Vi CONSTRUED AS
AN OFFICIAL DEPARTNM>T OF THEAMYPSlOOLY.OD-CISION. UNLESS SO DESIGNATED By OTHER DOCUMENTATION.
IS. KEY WORDS (Continue an reveseA side It necesoey ad Idenil by block nambet)
polymers, fracture, deformation, degradation, chromatography, spectroscopy,nylon
2& AESTRACI (Ckoftum " Nver" 06 N nmeemp 1000tr y ~block nuin~bw)
,Fracture in polymers of fibrous morphology is accompanied by covalent bond
scission. Gel permation chromatography (GPC) was used to monitor the changes
in molecular weight distribution upon fracture in nylon 6 fibers. The bond
rupture of 2.3 x 10¹⁸ per cm3 measured from GPC is approximately five times
the number of free radicals observed on fracture using electron spin resonance
(ESR). GPC results showed that the high molecular weight component of the molec
ular weight distribution ruptures preferentially. Fourier transform infra-red
POWn
AD ,~a~ 10 EDTIO OF1 NV 6,5 NSOITEUNCASSIFIED
SECU~hTY CLASSIrICATION OF THIS PAGE (WM Dete Enteroo
t~ft' tIre

SgCURITY CLASSIFICATION OF THIS PAgE(Whkm Dea tem-
spectroscopy (FTIS) observation of virgin, fractured,ground and irradiated
nylon 6 fiber specimens provided additional evidence supporting the results
of GPC and ESR. A quantitative measure of the bond rupture could not be ob-
tained from FTIS measurements.
Some calculations for the structure of the fibrous morphology were per-
formed: (1) Calculation for the'number of tie molecules per gram. This was
found to be approximately 1 x 10²⁰ per gram in nylon 6 fibers. (2) Calculation
for the contribution of various amorphous components like cilia, chain loops
(folds), chain ends and tie chains. (3) A model for the distribution of the
tie chain lengths.
The experimental results of GPC and some of the calculations above
were used to review the morphology and the fracture behavior of the fibrous
structure. A new mechanism for the formation of submicroscopic cracks in
stressed fibers is proposed.
UNCLASSIFIEDSCUITY CLAssPICAIO,, OP Toot pAgItfW", Dqe a We.,.D

IV
CONTENTS
1. Introduction .......................................................................................................... 102. round .................... ........................................................................... ......... 12
2.1 Classical Failure Criteria ........................................................................................................ 122.2 Fracture Mechanics Approach .......................... .... 142.3 Viscoelastic Models ................................................................................................................. 152.4 Kinetic Rate Process Theories of Fracture .......................................................................... . 162.5 Molecular-Morphological Models of Fracture .................................... 24
3. Experimental Studies of Mechanocliemical Degradation ............... 363.1 Introduction .............................................................................................................................. 363.2 SR Studies ............................................................................................................................ 403.3 Infrared Spectroscopy of Nylon 6 and Polyethylene ................................................. . 453.4 Gel Permeation Chromatography ................................... 56
4. Analysis ofT li , h in Scission ......................................................................... 764.1 Model for Tic Chain Length Distribution .................................................................... . 76
4.2 Calculation for Numnber of Tie Molecules ................................................................... . 944.3 Discussion ................................................................................................................................ 96
Appendix I. Calculation for P(N,r) ................................... I08
Appendix I. Calculation for X .............................................................................. 112
Appendix II1. Calculation of Amorphous Components ....................................... 114
Appendix IV. (PC Calibration ........................................................................ 117
Appendix V. M edian Rank Plotting ..................................................................... 123
Appendix VI. Viscosity of Nylon 6 in Dilute Solutions ....................................... 126
References ........................................................................................................... 132
NTIS C'.,
A
t ~ C1j

* .. ..... ... . .. •. . ... ....
LISTOF FIGURES
Figure Title Page
1 IXcay characteristics within a population ofrandomly oriented elements. 23
2 Simulated brittle fracture events in x-y plane asa function of t'T. 23
3 IHistograms of nylon 6 free radical concentrationfrom step-strain at room temperature. 31
4 Distribution of relative chain lengths of tiemolecules (I lo) of nylon 6 fibers fromstep-strain data using Lloyd-DcVrics model. 31
5 Four phase model of the fibrous structure. 32
6 Model of highly orientcd semi-c'ystalline fiber. 33
7 Fibrillar model of the fibrous structure. 34
8 Crack coalescence mechanism -(A) radial, (B) axialdirection of the fibrous structure. 35
9 Energetic chractcristics due to rupture of nolcculesduring loading of nylon 6. 35
10 Nylon 6 fiber tensile specimen. 39
11 Stress-strain curve 1br nylon 6 fibers. 39
12 -SR spectra of irradiated nylon 6 fibers at temperature
of 298o K. 42
13 ISR spectra of irradiated nylon 6 fibers at temperature
of 2690 K. 42
14 1 SR spectra of irradiated nylon 6 fibers at tCmperatureo1 ?242" K. 43
15 I:SR spectra of irradiated nylon 6 fibers at tenperature
of 188" K. 43
4

16 Nylon 6 ESR calibration curve. 44
17 Kinetics of free radical decay. 44
is IR spectra of virgin nylon 6 fibers. 47
19 IR spectra of fractured nylon 6 fibers. 48
20 IR spectra of ground nylon 6 fibers. 49
21 IR spectra of irradiated nylon 6 fibers. 50
22 Principles of Gel Permeation Chromatography (GPC). 58
23 Schematics of a GPC instrument. 58
24 GPC calibration curve for polystyrene at 250 C. 61
25 Averaged molecular weight distribution (MWD) of virgin
and crazed polystyrene at 250 C. 62
26 Median rank plot for weight average molecular weight(Q w) of polystyrene. 64
27 Median rank plot for number average molecular weight(n) of polystyrene. 65
28 Averaged MW Ds of virgin and fractured nylon 6 fibers. 68
29 Median rank plot for weight average molecular weight(mw) for nylon 6 fibers. 70
30 Median rank plot Ir nimnber average molecular weight(Mn) for nylon 6 fibers. 70
31 Median rank plot for polydispersity V for nylon 6fibers. 71,
32 Calculation for the nimhcr of molecules ruptured pergrant in nylon 6 fibers on fracture. 72
33 )istribution for the numbder of molecules per grain invirgini and fractured nylon 0 fibers. 73
34 l)ifrere ce MWI) = MWI)of fractured nylon 6 fibers -MW 1) olf'irgin nylon 6 fibers. 74
IIS

35 I )ilTerence distrihution = Number of molccules per gramin rractured nylon 6 fibers - Nunber of noleculcs pergram in virgin nylon 6 fibers. 74
36 Typical crystalline and amorphous regions of the fibrousstrlcture. 78
37 Schemaic drawing ofra tic chain and the interfacialzone in an amorphous region. 78
38 Chain configurations not allowed in the amorphous regionof a semi-crystalline polymer. 79
39 A view of de alternating crystalline and amorphousblocks ii the fibrous structure. 79
39a Cross-scctional view of the crystal face for computermodelling. 79
40 A drawing for calculation of RSQR(ij) in the model fortic length .distribution. 87
41 Fraction or tie molecules vs. relative lengths of tiemolecules. 91
42 Cuniuitive fraction of lie molecules vs. relative1en.ils of tie moklcules. 92
43 Iiractioial change in concentration vs.lo.' 1 (Molecular Weight). 106
44 Comparison of the cumulative tie chain distributions fromI.loyd-I)eVrics motdel and theoretical mnodel. 106
45 Comparison between the stress-strain behavior predictedby I.loyd-I )eVries model and the experimentally measuredone. 107
46 Viscosity of nylon 6 fibers in dilute solution ofhexafluoro-iso-piopanol (S-I 11:11)). 128
47 Viscosity of Allied nylon 6 in dilute solution ofhexallnoro-i.s-proji),nol (S-I I FII). 128
48 Vi..osity of nylon 6 fibers in dilute solution oftetraIluoro-ethanol (S- FF). 129
49 Vi.cosity ol Allied nylon 6 in dilute solution of
6

tctralluoro-ethanol (S- FE). 129
so Viscosity of nylon 6 fiber% in dilute solution ofIiorniic acid (88%). 130
51 Viscosity of Allied nylon 6 in dilute solution of
formic acid (88%). 130
7

-. I
LIST OF'rA BLIESTable Title Page
1 IR spcctroscopy band assignment for nylon 6. 51
2 Changes in nylon 6 bands on irradiation. 52
3 Changes in nylon 6 IR bands on grinding. 53
4 Changes in the intensity of IR cnd-group bands ondrawing of polyediylkne. 55
5 Tahulation of number, weight average molecular weightsand polydispersity for virgin and crazed polyethylene. 63
6 Tabulation of number, weight average molecular weightsand polydispersity for virgin and fractured nylon 6fibers. 69
7 Contribution of crystalline and 'Various amorphouscomponents (chain ends, chain loops (tolds), cilia, andtic chains) to die semi-crystalline nylon 6 fibermorphology. 105
8 Uiavcvil Calibration equations. 122
9 Viscosity constants for nylon 6 fiber and Allied nylon 6in hexalluoro-iso-propanol, tetrafluoro-ethanol, andaqueous formic acid (88%). 131
8d

ACKNOWLEDGEMENTS
The authors wish to thank the many helpful contributions
made to this work by Ms. Jeanne Courter, Prof. E.W. Merrill,and Prof. F.J. McGarry. We are also most grateful for the
financial support and technical advice made available by theU.S. Army Research Office under Contract DAAG29-76-C-0040.
9

I. Introduction
The increased use of polymers in structural applications puts a premium requirement on the desired
mechanical properties of these materials. A basic understanding of the factors and processes governing
the stress-strain characteristics and the fracture behavior is essential in this regard. It is generally believed
that the stress-strain behavior is determined by the overall structure whereas the fracture characteristics
are controlled by the critical phenomena in the material, for cxample,the longest flaw may determine the
ultimate strength. A knowledge of the morphology and structure of the materials is essential to
understanding of its mechanical response.
The study of fracture can be approached from two frames of reference:
(1). Macroscopic: The macroscopic viewpoint treats the material as a continuum containing flaws and
other inhomogeneitics. This is referred to as Fracture Mechanics and consists in devising a functional
relationship between the properties and some parameter of the material on the basis of energy balance or
an analysis of the stress intensity factor at the tip of the crack to deal with local stressees and strains.
Fracture mechanics has very successfully provided many engineering criteria for failure and an extensive
research effort is active in the area at the present time. Such a framework, however, fails to provide
information regarding the molecular processes and interactions that govern and accompany the
macroscopic failure of the materials.
(2). Mole ula j Microscopic: The molecular approach relates observed macroscopic behavior to the
scenarios being played at the molecular level. Such an understanding is uiemendously important for the
fornmulation of a struoure-property relationship. The molecular understanding of the structurc-property
relationship will provide material scientists and engineers with an insight into the expected behavior
under various mechanical stress histories. 'Ml]is will also provide the means for design of mnaterials with
superior properties and materials tailored to specific needs.
.4 10

ISuch an endeavor towards understanding the molecular nature of fracture has been taken ip by
:1 many researchers over the past two decades. "lle application of analytical means for study of molecular
fracture in polymers was initiated with the use of Electron Spin Resonance (FSR) by Zhurkov and
colleagues to measure the covalent bond scission caused by mechanical stress. Thereafter a large number
of researchers have used ESR and other analytical methods for investigation of molecular fracture. These
studies have related the observed mechanical response to the morphological structure of the materials but
with partial success. It is an ongoing process and this research ctTort is another step in the same direction.
This research has introduced a new analytical technique - Gel Permeation Chromatography (GPQ
- for the study of changes in the molecular weight distribution on fracture. GPC has been successfully
used to determine the changes on fracture in nylon 6 fibers broken under uniaxial loading and
polystyrciee specimens where extensive damage was produced from multiple cracking. The results of
GPC and IR spectroscopic investigations of this study for nylon 6 fibers are basically in agreement with
the reported BiS measures of bond scission in the same material, and therefore allays generally
expressed doubts regarding use of IiSR. GPC studies have provided additional infornation regarding
the role of different molecular weight components of the distribution in detcnnining the fracture
behavior.
A theoretical calculation for the distribution of the lengths of tic chains in the amorphous region is
performed. This calculation gives information about the morphological structure of the amorphous
regions of the semi-crystalline polymers and this morphological infornation is employed to obtain a
description of the fricture behavior in librous morphology. A new means for the formation of
submicroscopic cracks, which have been experimentally observed using Small Angle X-ray Scattering
(SAXS), is suggested and disLussed to indicate that it provides a better explanation fbr the observed
fracture response.
II

2. Background
Strength of materials and ways to improve it have been a matter of concern for man tong since he
moved from the stone age. Over the past few thousand years among different civilizations experience
with ie use of various materials has provided the major guidelines toward obtaining better materials. A
scientific approach in this area had its beginings in eighteenth century, along with the growing interest in
other scientific disciplines such as physics, chemistry and biology. Earlier studies obtained a single
material characteristic such as critical stress, strain, energy absorbed, etc. to determine a fracture criterion.
Griffith's paper in 1920 started what has come to be known as Fracture Mechanics. Griffith's fracture
criterion was based on an energy balance between the energy required to form the new surface ahead of a
crack and a decrease in the elastically stored energy. Further investigations in the area have led to other
criteria such as critical stress intensity factor KIc. energy release rate G i J-integral, Crack Opening
Displacement, etc. Very active research in fracture mechanics is continuing at the present time.
Over the past forty years or so increasing attention has been devoted to understand the molecular
nature of the fracture process. These molecular models of fracture are referred to as 'Kinetic Rate
Process Models'; the earliest one is due to Tobolsky and Eyring, and others have been developed by
Coleman, Blucche, I lsiao-Kaush. I.loyd-l)eVrics and Peterlin. 'Ibesc different approaches to fracture
analysis are discussed in this chapter.
2.1 (lassical FI.ilnre Criteria
Classical continuuim mechanics deals with homogeneous isotropic materials. Failure criteria in this
approach are established on the basis that sonic strategic property of the material such as uniaxial tensile
strength, shear strength, strain, energy stored or applied, reach a critical value. "liese kinds of criteria
have been used to obtain Ifilure surfaces in three-dimcnsional stress space.
12

Fracture manifests itself in differcnt forms such as brittle, ductile or through plastic deformation or
some kind of mixed mode. 'ihese diffcrent fracture modes result in different failure surfaces which may
overlap and penetrate each other. Some of the principal classical criteria are the following:
1. Maximum Principals nc ory (Rankine's Theory) states that the largest principal stress
component, say s3, in the material determines failure regardless of other normal or shearing stress, i.e.,
the stability criterion is
s3 < s* where s* is a basic material property.
2. Maximum Elsi Sri lheorv (St. Venant's Theory) states that it is the largest principal strain
that determines the failure, i.e.,
e3 = 1/E 1 s 3 - v (st + s2)J < e*
3. Constant ldi Strai, ner v n istortion. Large amounts of elastic energy due to hydrostatic
pressure may be stored without causing either fracture or pcnnanent deformation. 'hc energy critcoon
is based on the assumption that the energy of distortion W detennines the criticality state of stress. For
small elastic deformation one obtains:
6F * W/(I +v) = (s i - s2)2 + (s2 - s3 )2 + (s3- Sl) 2 ( 2(s*2 .
4. Coulomb Yigl Criterion assumcs a critical yield stress T* which is pressure dependent in any
plane and decribes the faillure mode.
(s3 -s)<T* = To+ 1SN
The latter two criteria have received the most experimental support. The above criteria do not have
explicit time-depcndence, but this may be obtained by considering that the critical value of the
parameters are themselves time-dependent. Also, these filure criteria fail to take into account the
complete stress state, thereby neglecting sore of die stress eflects.
13

2.2 Fracture Nechauics Approach
Real solids have flaws, voids, cracks or other inhornogencities which distort a homogeneous applied
stress field. The continuum mechanical approach which derives its criterion for crack stability from an
energy balance consideration is a fracture mechanics approach. Griffith (1) fi'acture mechanics, the
earliest approach in this direction, was based on the balance between tie energy required to produce the
new surface ahead of a crack and a decrease in the elastically stored energy. Griffith rurther proposed
that the elastically stored energy is not distributed uniformly throughout the specimen but is
concentrated in the neighborhood of small cracks. Fracture thus occurs by spreading of cracks which
originate in the pre-existing flaws. The crack growth by a length dC is governed by the equation
- dU/dC = Y C(dA/dC)
For an elliptical crack of length 2C, stressed at right angles to the major axis of the crack, the tensile
strength Sb of the material is given as
Sb = [2YI/] 5
wherc E is tie Young's modulus.
This shows that the observed macroscopic strength is much smaller than the theoretical strength of
die flawlcss specimen. "lie problem has been generalized to three dimensions and alternative
rormulations like the one due to Irwin for stresses in a planar crack for plane strain and plane stress have
been devised. For an infinite plate with a central crack or length 2C subjected to a uniform stvs, the
Griffith and Irwin formulations are equivalent. Another fracture mechanics critical criterion is that
fracture occurs when the strain energy release rate G (decrease in strain energy per unit increase in crack
length) reaches a critical value Gc.
txcept in the case of glass, the values for surface energy are greatly in exce.s of those calculated on
the basis or separaling planes of atoms to form the fracture surrace. '"Iis led Orowan and others to
14

propose that the surfacc-frce energy may also include a term arising from the plastic work done in
deformation adjacent to the fracture plane as the crack propagates.
Various extensions and improvements in fracture mechanics over the years have been made. Some
of the important ones are the i-integral and the Crack Opening Displacement.
The J-integral uses a parameter, J, derived from non-linear elastic behavior which bears the same
function as does G in linear elastic theory and a critical value for J culminates in the fracture of the solid.
The Crack Opening Displacement (COD) criterion is based on the consideration that a critical COD
is needed to determine whether the fracture is brittle or ductile. A correlation of (COD)critial to either
Gcritical or Kc values of fracture criteria is lacking.
An active research in the use of fracture mechanics for different materials is being pursued, but
some polymeric materiqis do not conform to linear fracture mechanics and other approaches such as the
J-integral or COD have not been successful either.
2.3 Viscoclastic Models
'li)ese models, based on the studies of Smith (2), Bueche and Halpin (3,6) assume that for polymers
(crosslinked rubber), the viscoelastic behavior could be reduced according to the time-temperature
superposition principle for strcss, strain-rate and temperature corcsponding to their states. If the failure
criterion refers to the the unique molecular state (load-carrying capabilities), then the plot of reduced
stress at break against the reduced strain at break should lead to a master curve, representing the failure
envelope. Smith's results describe remarkably well the experimental behavior and the reduced shift
factors obtained correspond to WI. equation for superposition of low strain linear viscoelastic behavior
of the amorphous polymers. Bu.che has theoretically derived such a failure envelope based on
vistcelastic behavior for the polymers.
These 1nodels, however, do not allow the prediction of failure envelope or conversion of data
A 15

between different modes of excitation (uniaxial, biaxial, and multiaxial). They recogni/:e the molecular
origin or the viscoelastic behavior or a material, but do not refer to the discrete quantities, anisotropy of
the molecular properties or distribution of molecular stress or strain, i.e., the solid is essentially treated as
a continuum.
2.4 Kinetic Rate Process Theories of Fracture
As opposed to continuum mechanical theories, molecular rate process theories of fracture recognize
the presence of discrete elements fonning the material body. The deformation and breakage of thee
elements determines the fracture of the structural material. The basic fracture events are controlled bythe thermally and stress-activated primary or secondary bond rupture; the accumulation of these
micro-events leading to formation of cracks, which upon reaching a critical value, cause specimen failure.
Sonic of the rate process models have also taken into account the morphology of the material. A few of
the characteristic aspects of these generalized, non-morphological rate process fracture theories are
(liscussed here.
TobolskvF-vrine MoLel: 'lobolsky and Fyring (4) proposed that the breaking of polymer threads
under uniaxial loads was due to the breaking of the secondary bonds at stress anld temperature dependent
rates. h'le rate of ,xcrease of N number of such bonds per unit cross-sectional areas under consiant
stress fo is given as
dN/Ndt = kT/h exp{-AF/Rl } * 2 sinh~fF/ 2NkT}
., is the mean separation between the equilibrium positions of the minimum force potential.
Thliread lifetime is obtained by integrating this equation from an initial value of N, namely NO, to a
final value of zero; that is, the thread breaks when the number or remaining bonds is iero. lhe above
equation takes into consideration the possibility of a reverse reaction in which the bond would be
16

repaired. for large values of stresscs, when the repair of bonds is insignificant, die equation is
dN/Ndt = kT/hexp{-8F/RT*exp{fPV2NkT)
According to this model, the logarithm orlifctime is related almost linearly to the applied stress.
This work laid the foundation for the kinetic theory of fracture which has been furthcr worked on
subsequently by a larger number of researchers.
Coleman Mod: Coleman (5) applied a reaction rate model to the rupture of polymeric threads
subjected to constant l)ads, to loads increasing linearly with dine and to sinusoidal applied loads. His
model differs from the l-yring approach in that Coleman assumes that bond slipping (not bond rupture)
is the basic mechanism of failure and that the microstructure can tolerate maximum distortion of g = go"
I, keeping with this mechanism of bond slippage, the number of bonds stay constant at its initial value
No.Coleman's differcntial equation is
dg/dt = kT/h expf-A/R'l2 sinh {sV2NokT }
where g is the strain.
The solution in integrated form looks like
* kT/h * expI4I/Rr =- gb/ cxp{-s)/2NokT}
I'xperimental rupture times obtained from Tobllsky-I'yring model and Coleman model give very
similar values ror the rupture time.
Ihiche- I lalniniM(sJc: '111 limited viscoeLastic extensibility or rubber strands. a-cording to the
theory proposed by Ikieche and I lalpin (6). determincs the fracture of the clastorncr. According to theb
author, under a constant load the .p4'ilncn elongates and %mall tears (10" cm. long) within the
Slecimcn arc initiated. A very highly strained thin filament (10- 100 Au) exist at the tip of a tear. '1The
17

stress on filament is S*K where S is applied stress and K, the stress intensity factor, is of the order of l02
- i0 3. The filament creeps and ruptures on reaching a critical breaking elongation. On rupture of
filament, the tear will propagate further through a distance the thickness of die filament. Idealizing the
propagation process to be stepwise in nature, the new material at the tip takes a finite time to fracture.
Thus, the rate of tear propagation is determined by the creep curve of the clastomer.
The sample as a whole ruptures when the tear has propagated through q filament lengths. Here q is
of die order of 104 - i0 7. i" the sample as a whole breaks in time Tb, each filament requires only time
Tb/q to break. The material at the tear tip is required to undergo a very rapid viscoelastic response in
comparison to the response of the sample as whole. This theory does not take into consideration any
change of stress distribution with growing crack length or the decrease of Tb/q. the time necessary to
fracture one filament. According to Kausch, a group of q filanients, subject to the statistical condition
tat the fracture of' one filament may start once the preceding filament was completed, has an average
lifetime, Cl'b>' ofqt' and a Poisson distribution of Tb.
Plb)dTb = drb/t'(q - 1) {Tb/t)q * exp (-1b/t')
Zhurkov Model: Independently, Zhurkov (7) in USSR and Buche (6) in US, expresscd the idea
that primary (chemical) bond breakage plays a significant role in the fracture of polymers. 71urkov in
1965 showed that die lifetime Tb for 50 different solids (metals, polymers, alloys and non-metallic
crystals) tinder constant load can be exprcsed by reaction rate equation of the form
Tb = To exp J(Uo - galRT} (1)
The three parameters in the above equation were associated as: To being 10"13 per second,
independent of the structure and chemical nature of the solid in question and equal to the reciprocal of
18

the natural oscillation frequency of the atoms in the solids; Uo, the activation energy for bond scission:
and g the activation volume, a structure-sensitive parameter related to the internal stress distribution.
Zhurkov believed that this correlation was not fortuitous but rather an indication that stress-aided
thermal bond dissociation is the controlling factor in the fracture, with such mechanisms as molecular
flow playing secondary roles. This themiofluctuation model, as expressed by Zhurkov, involves the
breakage of bonds tinder the influence of an applied stress at a rate which varies exponentially with the
magnitude of the stress.
Of even greater importance, Zhurkov demonstrated the atomistic nature of polymer fracture by
measurement of the radicals formed during bond rupture using ESR. Radical formation was found to
increase exponentially with the magnitude of the applied stress, and furthermore, the stress coefficient
for radical formation was identical with the stress coefficient measured for the time to break (i.e., g/RT).
This bears out the assertion that the polymer bond rupture is some sort of thennally activated
strcss-aided process and the fact that the sample's lifetime under load obeys a similar relationship to the
stress as the bond ruptures helps confirm the importance of the bond rupture process to macroscopic
polymer fracture. This, however, did not explain the time-dependent nature of radical fonnation. Also.
this intcrpretation did not take into account the distribution of molecular stresses which vary not only
over the bond IXpulation, but alu) with time to account for morphological change occuring in the fiber,
e.g., the rupture ofa significant number of load-bearing tie chains during loading to fracture.
Also, Zhurkov found departure fnn eqlation (I) for low values of stress, noting that as the stress
diminished, experimental lifetimes became infinitely large. The existence of a bomd repair reaction was
lffered s the possible explanation for this behavior. An alternative explanation would be established by
postulating a critical stress below which the defivrmation could be insufficient to have an effect on
activation energy, 'Ibe existence of such a critical stress has been established in fatigue studies of metab
and many polymers.
19

I!liao'KaLus'h Mldl: 'I'hc polymeric materials studied by experimcntal methods like I3SR were
essentially highly drawn fibers and filns which had a highly anisotropic structure. The fracture theory of
Hlsiao-Kausch (8,9) takes ito account the state oforientation ora polymeric solid. The theory combines
the kinetic concept of Zhurkov or Ilucche and the anisotropic nature of the solid.
Thc mathematical model for analysis is a matrix or identical rod-like oriented elastic elements. The
fracture theory is based on the assumption that the mechanical properties of the solid arc predominantly
detemmincd by he state of orientation and the properties of elastic elements. The kinetic aspects arc
introduced in this model through the assumption that the clement can undergo breakage. Probability for
failure is determined by the axial stress upon the element and that immediate redistribution of load
occurs once the element has nptured. 'Te state of stress in the vicinity of a point in the solid may be
represcnted by the lime-dependent stress tensor sij
$ij = OP( f, e) * f0, , t) *(0, f, t) ei ejdO (2)
where # is the longitudinal stress acting along a group or parallel elements, a function of orientation
(0, #) and time t; r. the fraction of unbroken elements is function of orientation and time, and P is the
density of probability distribution function of orientation.
The limc-dependent nature of the fracture process can be formulated utilizing the statistical theory
of reaction rate. The rate orchange of fris given as
dl/dt = kr(I- f-kbf (3)
where the rate of relrmation of broken elements is
kr = Wrexp I -(U/R'I') -gr"t)j
and the rate of bond npturc. kb, is
20

kb = Wb cxp { -(U/Ri) + gb#(t))
wr and wb are respective frcqucncics for forming and breaking process. Eqs. (2) and (3) have been
evaluatcd for a complctcly oriented and an unoricntcd network under constant uniaxial stress so. The
time taken for the breakdown of the solid is given as (neglecting the term for reformation of broken
elements)
koT b = Ei(- gb*/Rl)* C
where
-Ei(- y) = f dz exp(- z)/z
'P is the initial stress carried by elements of orientation e = 0 and C is a slowly varying function the
limits ofwhich are cxpressed by
1 ( C ( 1 + 0.63gb l./RT
"he lower limit refers to a completely oriented network, the tipper one to a randomly oriented one.
KaStII (10) has calculatcd the effect of network orientation on defect accumulation and strength.
It turns out that the range of orientation angels within which the elements break preferentially is narrow.
'T1he increase in strength resulting from improved uniaxial orientation is limited. 'his is illustrated in
Figure 1 for a randomly oriented network where the initial distribution is independent of 0. Elements
oriented in the direction of uniaxial stress (cos 0 = I) experience the largest initial stress and break
preferentially. The angular distribution of fRcos o, t) is shown for three different stages of defect
development, namely, after Q I, t) had dropped it) 0.5 and zero and for the point of impending failure
21
-- . . ., s - ,. e d - -- .",
. . - -. ,,_ ,., ., . - ,. _,

where the numerical calculations were terminated because breakage of the remaining elements occurs at
a very high rate. The calculations as rcprcscnted in Figure 1 show that almost one-half of the loading
period has to pass before one-half of the most heavily stressed elements is broken. More than 90 % of the
loading period has to elapse before all the elements within a small angular section are broken. At this
stage the majority of the elements present are still unbroken. The step from the second to the third stage
of defect accumulation is rather short (6% of the loading time) and from there to network failure,
practically negligible.
Gotlib. Dobrodunmov. FI'yashevil and Svetlov Model: (11, Ila). The first ruptures in a large
assembly of initially equally stressed solids will occur at random. The breakage and retraction of a
particular element, however, leads to an increase in the axial stress of those elements to which it is
coupled (through primary or secondary forces). As a result, the probability of rupture of stress-coupled
elements will be higher than for others.
The rupture events will continue to occur at random for an initial period. With their growing
number, chances are increasing that rupture events occur in an immediate vicinity of each other. This
signals the end ot the fracture initiation phase and the beginning of crack growth.
This process was numerically simulated by the above-mentioned authors for a set of elastically
connected elenent, . ith different elastic constants in two perpendicular directions. At small load, a
large number of isolated (random) defects appear until a crack forms through accidental accumulation of
few defect points and starts growing. At higher loads, a small number of defect points initiate a crack and
very little damage is done to the remainder of the specimen during fracture initiation. This is shown in
Figure 2. 'T'his model deals with elastic elements and the only means for relieving local stress are through
a rupture of bonds. Ihercfore, this model, as it stands, is only applicable to brittle glasses, where plastic
deformation does not take place in fracture initiation.
22

!1
Figure 1 Decay Characteristics within a populationi of randomly oriented elements(9,10).
I TIME=0.38 0.60 0.6331.C1.
*1 0.5. a* 0/RT= 251-i
'I . U_ 10 1.0 1.0
0 0.5 1.0 1.0 1.0
- Distb 7ti6n-o Eement s
Figure 2 :Simulated brittle fracture events in x-y planeas a function of t/T(t-time to complete failure)( ).
Bt ,RT
0
a ,.$s .
10 R
7LZWEJIZ.20
t- 0.3T 0.5T 0.7T 0.9T
23

i
2.5 NMlolccular-MorlliologiciI Models of Fracturc
I _- DeVric Model: h'lc ESR (12) and viscometry (13) evidence for bund rupture in nylon 6
shows a sinall fraction of tie available tie chains breaking on fracture. One of the most interesting and
intuitive experiments perforned to study the molecular fracture processes is due to Kausch (14) and
Lloyd (15). A full-length discussion of these and other experiments is available in Kausch's book (16); a
short summary is presented here.
The experimcnt consisted in step-strain loading of the nylon 6 fiber specimens located in the
microwave cavity of an ESR spectrometer. The concentration of free radicals after each increase in strain
step was recorded, until the specimen was pulled out of the ESR cavity as a result of macroscopic
fracture. Trhe histograms of free radical concentrations as a function of the applied strain are shown in
Figure 3. An analysis of these and other experimental results which formed a basis for mathematical
interpretation of the results of Figure 3 are:
- stress relaxation or creep is not caused by slippage of fibrils or microfibrils.
- chain scission occurs in tie seginents: generally tic segments interconnect adjacent crystal blocks within
a microhihril, but more distant or interfibrillar ties also have to be considered.
- eventually, breaking tie segments arc solidly held, most probably by the crystal blocks; although the
clamping extends over 2 to 5 int. in the crystal block, the tie segments are treated as if they had a
well-defined end to end distance Io and contotir length L
- chain scission occurs if the axial stress .reaches chain strength.
- the large value of molecular stress concentration (ratio off sto s of the order of 50 or 80) (Rcf.17, 18,
19) follows from the fact that individual (highly rigid and clearly extended) chains are subjected to
comparatively large strains of intra- or interfilrillar amorphous regions they span.
Consider a fairly extended tie-segment of contour length L, end to end distance I.o, and elastic
modulus ,k* Fiach segment spans an arbitrary number of anorphols regions i = nai - I of crystalline
24
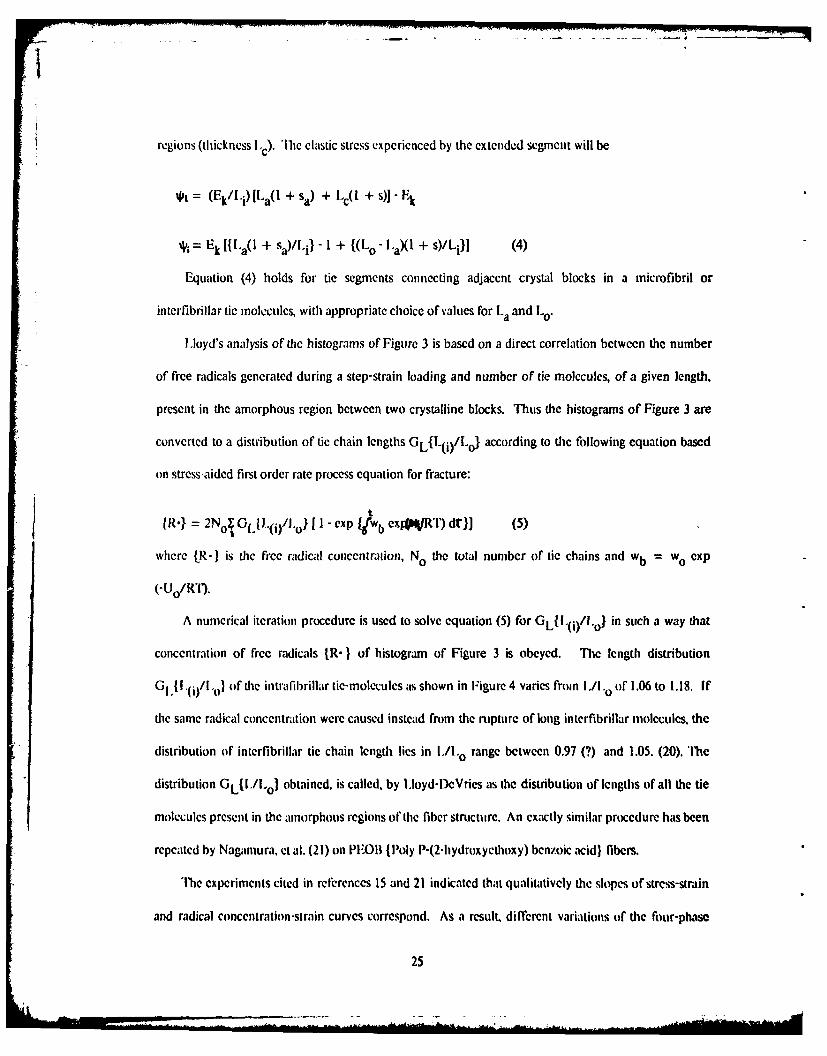
regions (thickness 1.c). Thc elastic strcss cxperienced by the extendcd segment will be
= (Ek/-i)[La(l + sa) + Lc(l + s)]- k
4L= Ek {la(I + Sa)/li} -1 + {(Lo- laXl + s)/Lil (4)
Equation (4) holds for tie segments connecting adjacent crystal blocks in a microfibril or
interfibrillar tic molecules, with appropriate choice of values for La and Lo.
lloyd's analysis of the histograms of Figure 3 is based on a direct correlation between the number
of free radicals generated during a step-strain loading and number of tie molecules, of a given length,
present in the amorphous region between two crystalline blocks. Thus the histograms of Figure 3 are
converted to a distribution of tie chain lengths GL{L(i)/Lo} according to the following equation based
on stress-aided first order rate process equation for fracture:
IR} = 2NOT GIL(i)/J.o I I- exp fJwJb cxtF(R'l) drl] (5)
where {R -} is de free radical concentration, No the total number of tie chains and wb = wo exp
(-U0 /RT).
A numerical iteration procedure is used to solve equation (5) for GL{l.(i)/Lo} in such a way that
concentration of free radicals {R-) of histogram of Figure 3 is obeyed. The length distribution
G1{l.0)/.Lo) of the intrafibrillar tie-molecules as shown in Figure 4 varies from Ill1. o of 1.06 to 1.18. If
the same radical concentration were caused instead from the rupture of long interfibrillar molecules, the
distribution of interfibrillar tie chain length lies in I./L.o range between 0.97 (?) and 1.05. (20). The
distribution GL{I/loI obtained, is called, by I.loyd-DcVries as the distribution of lengths of all the tie
molecules present in the amorphous regions of the fiber structure. An exactly similar procedure has been
repeated by Nagamura, et al. (21) on PEOB {Poly P-(2-hydroxyethoxy) benzoic acid) fibers.
The experiments cited in refkrences 15 and 21 indicated that qualitatively the slopes of strcss-srain
and radical concentration-strain curves correspond. As a result, different variations of the four-phase
25

=7
model as shomn in Figure 5 have been used by lloyd (15, 22), Nagamura, et al. (21) and Klinkcnberg
(23) to explain the strcss-strain curves of fibers used. The tic chains in the amorphous regions were
dividcd into three classes according to their contour lengths: Class I indicates tie chains already broken at
macroscopic strain s; Class I tic chains fully extended; Class III tie chains which are long and not fully
extended; and the distribution of lengths of all the tic chains being given by function GIfL/Lo. Once
the strain-dependent widths of the fractions are obtained from G1 {I/L o} and appropriate moduli are
assigned to individual phases, a stress-strain curve is obtained. A gaussian distribution GL{I./1 Io1 for tie
chain lengths was used.
A fit of observed and calculated stress-strain curves was obtained if the number of tie chains was
taken to be larger than die observed number of free radicals by a factor f of 20 (Ref. 23) and 40 (Ref. 21).
The possible explanations for such a discrepancy are: (1). The number of broken chains is systematically
larger than the number of free radicals, e.g., due to a Zakrevskii mechanism (24) or a decay of the free
radicals. (2). TUK breakage of N chains in a volume results in preferential unloading of fN extended
chaiins. This could be explained on the basis of microtibrillar morphology (25, 26), or an tnloading of
chains duc to temperature rise in the neighborhood of a broken chain or a group ofchains (34, 35).
Some of the lim itations of this model are:
- the observed amount of hond scission is too small to explain the observed stress-strain behavior.
- 1o attempt is tlmadc by the authors to explain how lacroscopic fracture can result from scission of only
1% of the available tie chains.
- it is assumed that the distributiotn of frce radicals observed also reprecsents the distribution of the tic
chain lengths.
- a mechanism for the formation of submicroscopic cracks is not proposed.
Peterlin's ndcrolibrillar model attempts to take some of these factors into consideration.
Micnrtihril Model of Iracture: The microfihbril model has been strongly advocated by Peterlin (25,
26

26) to explain the fracture and strength of the fibrous structure. A doubt has been cast on the model for
drawing process as a result of new experimental evidence from neutron scattering ofrpolyethyleie lainclia
by Flory and others (27). An alternative explanation of the cold drawing process and the details of the
resulting fibrous structure are still lacking, though many of the features of the drawing process and
fibrous structure may still be very much similar to Peterlin's model.
According to the microfibrillar model of fibrous structure (25), the highly drawn crystalline polymer
consists of densely packed, highly aligned, vcry long and thin microfibrils bound into long and somewhat
skewed fibrils. These features are schematically shown in Figures 7 and 8. A typical dimension for the
microfibril has been ascribed as IOU in length and about 100 A0 wide. In each microfibril, looped
(Folded) chain crystalline blocks alternate in axial direction with amorphous layers, bridged by a large
number of tie molccules. The fraction of tie molecules is between 10 and 30 % of the chains in the crystal
lattice (28). The tie molecules connect not only subsequent blocks (intrafibrillar tie molecules) of the
microfibril but also blocks ftrther away and blocks of adjacent inicrofibrils (interfibrillar tie molecules).
'he total fraction of 'taut chain molecules' determines the axial elastic modulus of fibrous material. ihis
tiaction is estimated to be of the order of 2 - 5 % of the total tie molecules.
The large surface-to-cross-section ratio means an easy lateral transfer of axial forces and hampers
any large-scale local deformation or the microfibril. "1'le dense packing of microfibrils prevents any
large-scale lateral movement of the crystalline blocks, and die longitudinal connection by tie Molecules
prevents large axial displacements. If the stress cannot be relieved through sliding of microfibrils or
fibrils (i.e., creep) or separation of adjacent structural elemenits. it may do so by crack jumping through
an amorphous region of the inicrofibril structure rul)turing all the tie chains in its path. )ifferent
possible mcclattisms foir inicr-ccrack nucleation and propaga ion are shown in Figure 8.
The formation o" microcracks has been supported by observations of Zhurkov (31, 32) using SAXS.
The site and density of inicrocracks obtained appear to be in close agreement with the expected values
27
_, ., NO

for a microfibrillar modcl. Peteilin (33) has also hypothcsied from similar results on various fibrous
materials a critical volume fraction for tie microcracks forming a criterion for macroscopic fhilure.
1l1w effects of stress irregularities as proposed by Peterlin to explain the observed response of the
fibrous structure is not adequate:
- the voids do not prevent the build-up or large elastic strains in the fibers, as evidenced by scissioning
of chains and the appearance of deformed lR bands.
- if the chain scission in regions adjacent to the stress irregularities is the mechanism for failure and the
stress-strain response, how is it possible that during second stressing (i.e., after the load has completely
been relieved once) the stress-strain behavior is the same?
- if the chain scission would occur preferably adjacent to microtibril ends, further widening of these
existing microcracks would then invariably accelerate chain scission.
- microfibril ends are free to undergo shear defrionation.
- existence of microfibril ends in nylon 6 fibers has not been observed from TEM studies.
- drawing of semi-crystalline polymers is a matter of controversy at the present time.
KatIsch's Model: Another approach to molecular fracture process, based on the energetic
consideration of the stressed tie chains and their surroundings has been proposed by Kausch (34, 35).
"arlier work along milar lines was done by Godovskii, et ;l1. (36), who determined the mechanical work
ilput and the heat evolved in a cyclical loading - unloading of nylon 6 of a draw ratio of 5.5. It was
observed that the difn'rence in mechanical work &A and the heat evolved AQ between the first cycle and
the second or any subsequen( t cyclical stressing was the same. AA and
AQ as functions of applied stress are shown in Figure 9. 'l'he difterence in mechanical work performed
AA and the heat evolved AQ between the first and the second cycle (&A = SA -6A2 ,AQ .;-6Q -SQ2) was
takenit as the increase in internal energy 'AU'. The internal energy 'AU' was asribed to the energetic
characteristics of those chain iniolecules stretched and ruptured during the first loading cycle. The
28

i
extension of these moleculcs involves the expenditure of work, stored as elastic potential energy; a part of
it is used as chemical energy fbr bond breakage and a large part is evolved as heat due to dissipation of
the mechanical energy by two 'halves' of the ruptured molecule. According to Godovskii, the energy
characteristics were not affected by plastic e'ects (structural re-arrangements and conformational
transitions of nacromolecules) as evidenced by analogous experiments on nylon 6 of different degrees of
orientation, though Kausch suggests the possibility of an internal energy due to local rearrangements
triggered by chain scission.
A mathematical treatment due to Kausch is presented. The total elastic energy in a segment of
length L, cross-section q and elastic modulus Ek amounts to
W k = qL/2E-k (6)
For a nylon 6 segment of 5 nm. length with q = 0.189 nm.2 , 'b = 21GN/m 2 and Ek = 200 GN/m 2,
give a value of P i0- 18 J per segment or 600 kJ/mole for the elastic energy stored in a chain at breakage.
The contribution of elastic forces that hold the highly stressed tie-segment ends within the crystal
lamellac is 190 kJ/mole for each segment at the rupture stress. "lius an energy of 870 kJ/mole liberated
at the moment of chain .cission has to be dissipated as heat. If this energy released were to be confined
within the volume of the segment and its two ruptured ends, it would constitute an energy density of
Wtotal/l 1. = 764 Mi/inr. 'Thus chain scission event is like a micro-explosion.
The local temperature rise AT in the neighborhood of the broken segment will depend upon the
mu|ber N of segments on which the energy of the breaking segnent is distributed. Using the fiollowing
values for nylon 6 (37) - a heat capacity cp = 1.47 cal/gm.°K and a density of the amorphous region P=
1.084 giu./cm. , one obtains
AT = 1764/(N *P* cp) * MJiin) = (479/N)°K (7)
29

This temperature rise not only increases the mobility of the chains the region but aIsO) resilts in a
decrease *b'tie strength of the Nc affected tic chains, which can be obtained by difflercntiating the
equation
b() = {Uo - RT loge(woTb)}/ 8 (8)
All, = {" R loge(worb)}AT/0
Using O= 5.53*106m3 and Wo b = (1013 sec "1 I see) = i013,
A +b = (- 48*AT) MN/m 2 = (- 23/N ) GN/m 2 (9)
As mentioned earlier, a qualitative agreement is observed between the slopes of stress-strain curve
and free radical-strain curve. A quantitative correspondence requires that 20 to 40 times as many tie
chains experience breaking stress as are the numbcr of free radicals observed. A local temperature rise
due breakage or a tie chain segment facilitates the extension of kinked chains due to annihilation of kinks
mnd therclb're the chain will be unloaded without breaking. Within this framework one would have to
assume that (lie breakage of one amorphous segment at maximum load (*break) leads to conl'tnniational
changes in the surrounding segments of the same inicrofibrillar region, resulting in load decreases of 40
Vbrcak" According to Kaus'h. there are more than 2000 surrounding segments (of 5nui. length in any
amorphous region 400 n1n1I in cross-section) and the value of 40 *break is thus reasonable.
Kausch's approach, though it presents an alternative explanation of Lloyd - I)eVries result, is very
speculative at this moment. Some experimental evidence in this direction is desired. Furtherinore,
Kausch mentions that there are 2000 segments per 400 nm. 2 cross-section. 'I'his is the number of
segments in a crystalline block and not in the amorphous region where the numnber is generally expected
to be simaller by an order of magnitude.
30
... . .. . - --.. . -. . . .... ". . . . . . . .". .. . . . . . .. . ..-. . . . n M al.. . ... .. i . . . . . n . . ll I . . . . . 1 . .

Figure 3 : Histograms of nylon 6 free radical concen-tration from step-strain data at roomtemperature'"
120.
10.
SPINS/CM3
xi015) 60-
40-
20-
4 8 12 16
STRAIN (%)
Figure 4: Distribution of relative chain lengths oftie molecules (L/Lo) of nylon 6 fibers fromstep-strain data using Lloyd-DeVries model.
S6
° -Ix
-4
0.04 0,08 0,12 0.16 0.20
Loge (L/Lo)
31

Figure 5 Four phase model of fibrous structure(a) crystalline phase (b) taut (extended)tie chaims (c) non-extended tie chains(d) matrix (loops, cilia, chain.'ends).
a
32

FIGURE 6
end ofmicrofibri 1
Lo
LL
interfibrillarI.molecule microtibrill
Model of highly orlented,semlcrystalline fiber,
33

p
IFigure 7 Fibrillar model of the fibrous structure.
*I/ Jl~I ii'
.1 Iii /~II q\/ j~III
I(t ~1~1II '1II
ii I
1
.1~ 1~4 w
34

Figure 8 Crack coalescence along (a) radial, (b) axial direction.
In the former case a microfibril is broken with all thetie molecules ruptured in at least one amorphous layer B,no or very few molecules (interfibrillar tie molecules are
ruptured in the latter case( ).
B A
I I
I
I I
Figure 9 Energetic characteristics due to rupture of moleculesduring loading of nylon 6. A) Mechanical work spent in
elastic extension of macromolecules; Q) heat evolvedafter the rupture of the stressed molecules; U) energyexpended directly on rupture of molecules .(36).
7.5
AA AQ
5.0
"2.5
40 60 90 kg/=s
35

3. Experimfental Studies of Mechanochenical Degradation
3.1 Introduction
"'lic action of an applied uniaxial tension on a covalent bond R-R results in a decreased binding
energy of the chemical bond and therefore the probability for bond scission increases. If the applied load
is large, a covalent bond rupture would certainly occur generally in a honiolytic manncr; this being the
energetically favored mode. Zhurkov, ct al. (7), using ESR, observed such a homolytic bond scission in
nylon fibers stretched to failure. This led Zhurkov (7) to propose a stress-aided thenno-fluctuation
mechanism of fracture based on Tobolsky-Eyring (38) type kinetic rate processes. Zhurkov postulated
that fracture accompanied by bond scission can be broken down into three phases:
(1). Excitation of ihe bonds being broken (2). Breakage of excited bonds by thermal fluctuations
(3). Accumulation of ruptured bonds resulting in the loss of stability in the body with its eventual
breakdown.
'lie studies towards formulating a correlation mentioned in the last statement has been an active
arct for research ever since.
Verma (39), Becht and Fischer (40) demonstrated that die observed free radicals are forned in the
amorphous regions of the fibrous material. The amount of bond rupture as observed by FSR (12) is of
the order of 5 x 10¹⁷/ci 3 for the nylon fibers. Considering a chain of 20Ao2 cro%-section. there are 5 x
1014 molecular chains crossing a cn 2 of the cross-sectional area. Therefore the number of scissions
generated by a planar crack is much smaller than the observed number detected by I-SR. This implies
that a global bond scission occurs throughout the volume of the fibrous material. This has been
expcrimentally Ncrifiel by Crist (13) who detennined the bond scission/cm3 for difTerent portions along
tie length of a fractured fiber using viscosity average molecular weights and fIound it to be unifonnly
same all along the fractured fiber. It is generally believed that die crystallites in the fibrous morphology
36

act as crack stoppers and extensive hydrogen bonding in polyamides inhibits interchain separation,
forcing the crack to pass through relatively weak tic chain regions and cause covalent bond scission. In
other materials such as polycthylcnc where intermolecular forces arc weaker, the crack propagation is
easier along the fiber direction and fewer tic molecules are expected to break. This has been observed
experimentally. A postulated crack propagation mechanism is schematically shown in Figure 8.
The observed free radical concentration of 5 x 10¹⁷ /cm 3 in nylon 6 represents 2.5 x 10¹⁷/cm. 3 of
rptured tie molecules. This is only 0.25 - 0.50 % of the 1*1020 - 5 x 10¹⁹ /cm 3 of the tie molecules
estimated to be present in nylon 6. Therefore, in spite of the global nature of the bond scission process, as
large as 99.5 % of the tie molecules are unaffected by macroscopic fracture. Prevorsek has shown that the
strength of the two segments of the fractured specimen are the same as of the original specimen. This
will be discussed firther in a later section.
The nylon 6 fibers used for ES1R and other studies are the same as used earlier by
Roylance-DeVries, Lloyd-DeVries and Park-DeVries at the University of Utah. These fibers, supplied
by Allied Chemical Company, were produced in a melt spun, hot draw process and were highly oriented
as received. Their conmercial application would have been for use as high-strength tire yarn. 'lhe nylon
6 used had a single filament diameter of 0.01118 inch with 136 filaments plied together in each yarn. The
density of these fibers were determined by a density gradient column its 1.139 gm./ml. Crystallinity of
37.5 % was obtained using crystalline and amorphous density of 1.230 gm./ml. and 1.084 gm./ml.
respectively. Crystallinity of 50 %, from X-ray diffraction, was obtained by Park. A differential scanning
calorimetry analysis (l)SC) indicated a melting temperature of 496oK for the fibers. Park (41) had
determined a long period of approximately 97 A0 from small angle X-ray scattering data. Also,
'processing temperature' of 155()C was obtained by plotting long period, density, shrinkage and
orientation angle as a lunction of annealing temperature. 'lliese parameters showed an abrupt change at
155 0 C.
37

1
Nylon properties can be significantly affected by moisture: preliminary investigations suggested a
decrease in the mass of fibcr specimens by I to 2 % upon dessicating for a minimum of 7 days. All the
nylon specimens for the analyses in this study were dessicated for at least seven days.
A tensile specimen of nylon 6 fibers for obtaining fractured material and the stress-strain response
was prepared by winding the fiber yarn on a solid bar to the desired number of yarn strands. The ends of
- liber yarn were tied, te yarn removed from the bar, tied at four places and bonded between the ties with
epoxy as shown in Figure 10. After the epoxy had cured, a pre-determined number (eight out of initial
twenty) of strands were cut and removed from the center portion of the specimen. Such a tensile
specimen behaves essentially like a notched solid tensile bar. The specimen so prepared was again
dessicated for seven days and thereafter fractured on the instron testing machine at an extension rate of
0.127 cims. (0.05") per minute. ''his corresponds to an engineering strain rate, for a specimen of 10 cms.
length, of 1.3 % per minute. The stress-strain (41) curve is shown in Figure 11.
38

Figure 10 Nylon 6 fiber tensile specimen (dimensions and
configuration).
4 cm 10 cm. 4cm
epoxy bonded
Figure 11 Stress-strain curve for nylon 6 fiber tensilespecimen at room temperature(25
0c).
960.
720.
STRESS:. (14Pa)
480-
240 V
i0 20 30
STRAIN (%)

3.2 l'S11 Studies
Electron Spin Resonance (FSR) has been extensively used to study mechanical fracture in nylon 6
fibers and other materials by Zhurkov (42) at the loffe Physical Testing Center, DeVries (43) at the
University of Utah and at a few other places. ESR, a very sensitive technique for the study of free
radicals, has a major shortcoming regarding the count of free radicals observed versus the actual number
of bond scissions incurred upon fracture. I11le ESR count of bond scissions is suspect on two grounds:
First, the free radicals decay with time. Therefore, the number of free radicals observed at any time
is the number produced during the original scission event minus the number that has decayed since. The
decay kinetics of free radicals have been used to obtain the actual number of scissions incurred (44) on
fracture. The decay kinetics have been studied here to understand the nature of decay characteristics and
obtain an activation energy for the decay process.
Second, the free radicals may undergo secondary radical reactions, as proposed by Zakrevskii (24a,
24b). to produce as many as a few hundred bond scissions without any increase in the radical
concentration. These results are further discussed in the next two sections on Infra-red and GPC studies.
Free Radical Kinetics: The secondary free radicals of nylon 6. for which the FSR spectrum is shown
in Figure 12, are obtained according to a mcchanism proposed by Zakrcvskii and others (46). The
observed 'SR speciruin at room temperature has been interpreted to result from two secondary free
radicals: (I) C 12- CO - NIl - CII - C[1 2 -, and (II) -Ci! 2 " ClO - NI] - C1" 2 -. Radical 11 is less stable at
higher temperatures as evidenced by comparing the spectra in Figures 12, 13, 14, and 15 which show a
relatively decreasing intensity of the inner peak at higher temperatures. 'llic kinetics of free radical (I)
have been investigated here.
The frec radical decay may be a second or first order process governed as to whether recombination
of fiee radicals or reaction with the environment is the primary mode of transformation. Nylon 6
secondary radicals are observed to decay according io a first order rate process.
40

The concentration of free radicals is a double integral of the arca under the ESR spectrum. A direct
correlation exists between the concentration of free radicals and tie peak height of the spectrum as
shown in Figure 16. Thc rate of change of free radical concentration for a first order rate process is
dN/dT = -KN (10)
i.e., loge N(t) = loge N o - Kt (11)
and, = 1/K (12)
where T is the average lifetime of the free radical.
According to the theory of absolute reaction rate,
T= exp (Uo/RT) (13)
i.e., logL, c logeTo + Uo/RT (14)
wiere U is the activation energy for tie free radical decay mechanism.
Ikluation (11) provides K, the slope of a plot of loge N(t) against time t from lFigure 17. K is
evaliated at temperatures of 298°K and 269oK. Using equation (14), from the slope of the curve for
log, against If1', the activation energy 'U o ' of I I kcal/mole is obtained. 'Iits is obtained fron tie daw
available at two temperatures only, so some error in the value o)tained is possible; but 'U0' of 11
kcal/mole is in the range of activation energy values generally observed for a diffnsion-controlled
proce css.
A half-life of' 260 and 33 minutes is observed for the free radical I at temperatures of 269oK and
298oK. respectively.
41

Figure 12 ESR spectra of irradiated nylon 6 fibers& 13
Time = 20~ minutesFREE RADICAL DECAY AS A FUNCTION 3-NTEMPERATURE =298
OF TIME. 40*60'
0TEMPERATURE =2690 K
42

Figure 14 ESR spectra of irradiated.nlof 6 fibers
TEMPERATURE =242 0K
Figure 15 ESR spectra of irradiated avlon 6 fibers
TEMPERATURE 188 0K
43

f -.--. ~ -- -0
Figure 16 Nylon 6 ESR calibration curve at 2980K
100
100
Relative Number of Spins
50 100 150 200
Figure 17 Kinetics of free radical decay..
2.5
~2.0 29K(peak 1)
2690K (peak 2)
298 K (peakk 2
1.0
40 80 120 160 minutes
Time for Decay
44

3.3 hinrared Spectroscopy of Nylon 6 and Polyethylene
*I
'flic scission of molecular chains leads to free radicals and eventually free radicals upon decay form
new stable molecules.
One of the possible mechanisms for free radical decay is suggested below.
SECONDARY RADICAL. REACTIONS
SCISSION
.'-, -CO-NH-Cl 2 ICH2 -CH2 ,,-1 2 C. +
CH2
ABSTRACTION FROM ADJOINING CHAIN
.- H2C. .- CH3
,.,v- FIH '-'-12C-61i-tI2 C
I)lSiPROPORTIONATION - NEiW SCISSION
,-,.-!12C-Cli 2C -- -0- *--IIC=tI2C + .C11 2
'lie new end groups fined are mostly of die type: melhyl, vinyl, aldchyde, carboxyl, ester, etc.
'llcse end groups generally have characteristic II bands. Ilierefore an increase in lie intensity of any of
these bands or the fonnauion of a new band may be detected provided the concentration of the newly
foirmed end groups is large.
Assuming one-to-one correspondence between the fice radicals and the resulting enl groups
foirmed, a coacentration of 5 x 10¹⁷/gml. is expected upon fracture in nylon 6. No new band in the IR
*45
-I
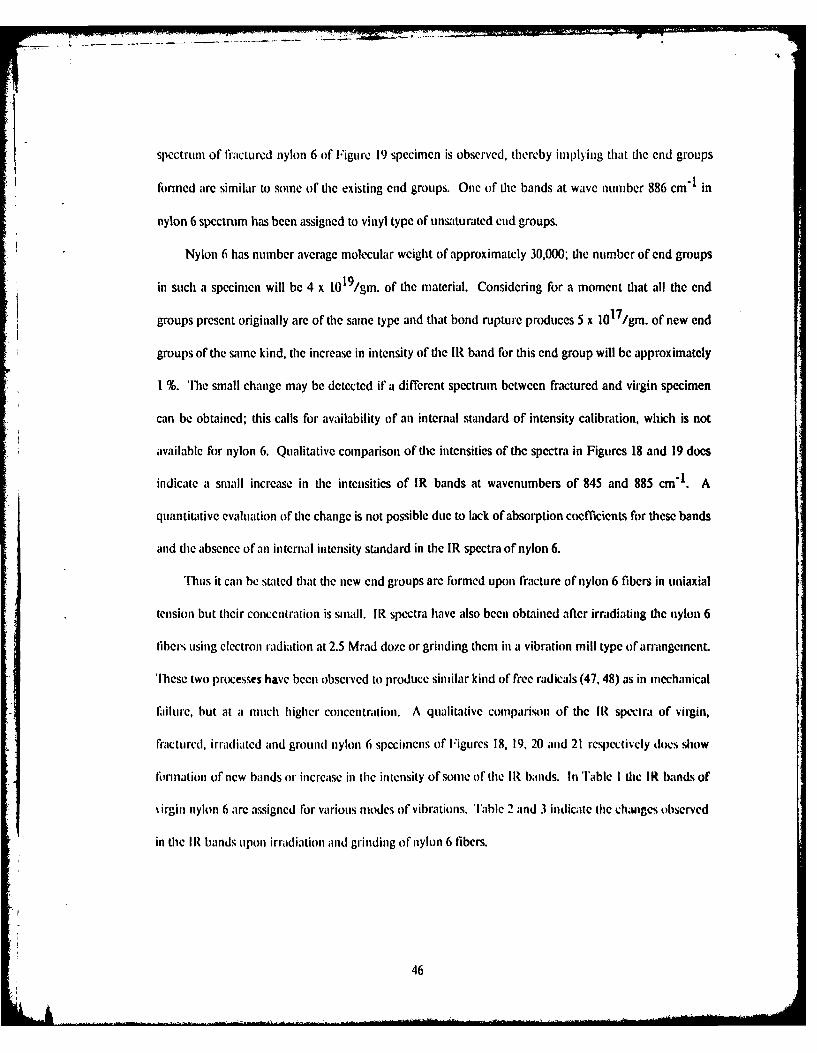
spectrum of fractured nylon 6 of Figure 19 specimen is observed, thereby imiplying that the end groups
formed arc similar to some of the existing end groups. One of the bands at wave number 886 cm'1 in
nylon 6 spectrum has been assigned to vinyl type of unsaturated end groups.
Nylon 6 has number average molecular weight of approximately 30,000; the number of end groups
in such a specimen will be 4 x 10 9 /gm. of the material. Considering for a moment that all the end
groups present originally are of the same type and that bond rupture produces 5 x 10¹⁷ /gm. of new end
groups of the same kind, the increase in intensity of the IR band for this end group will be approximately
1 %. 'lhe small change may be detected if a different spectrum between fractured and virgin specimen
can be obtained; this calls for availability of an internal standard of intensity calibration, which is not
available for nylon 6. Qualitative comparison of the intensities of the spectra in Figures 18 and 19 does
indicate a small increase in the intensities of IR bands at wavenumbers of 845 and 885 cm- l . A
quantitative evaluation of the change is not possible due to lack of absorption coefficients for these bands
and the absence of an internal intensity standard in the IR spectra of nylon 6.
Thus it can be stated that ie new end groups are fbrmed upon fracture of nylon 6 fibers in uniaxial
tension but their concentration is small. IR spectra have also been obtained after irradiating the nylon 6
fibers using electron radiation at 2.5 Mrad doze or grinding them in a vibration mill type of arrangement.
These two processes have been observed to produce similar kind of free radicals (47, 48) as in mechanical
failure, but at a nmuch higher concentralion. A qualitative conipari.on of the IR spectra of virgin,
fractured, irradiated and ground nylon 6 specimnens of Figures 18, 19, 20 and 21 respectively does show
formation of new bands or increase in the intensity ofsonic of the IR bands. In Table I die IR bands of
\irgin nylon 6 are assigned ror various modes of vibrations. Table 2 and 3 indicate the chumges observed
in the IR bands upon irradiation and grinding of nylon 6 fibers.
46

IN
-4
-44
too000a
U .
00-4 O0
C44
0%'-44
- 00
0
'447

-
i Uo C.)
0CC~4
000-4
004.'.4
(A
G)
00'.4-4
'.4
1.4
4)o 0tU 01.4 4'
'44 -
44 00 0
* '.14)043
CA
00H 'B-4
a.'-4
431.4
a.'
00
-400'.4
000'.4
004.1,,
0
'.4
48

co 0
00
0
r4
4.649

-4
C
o C
C0(N(N
000-4
00.1 'V
000o 0 -
-4(N
4.'
0'.4 0'.4 'V
-40
1b4 0o
(N'U'.4
U
0- 0
-4
-4(N
0'.0
00~* 0-.4
-400(NM
C
00'a.
50

Table 1.
Nylon 6 Band Assignment for IR Spectroscopy
Wave Number Characteristics Assignment
3300 S, broad N-H stretch
3185 sh
3070 W, broad free N-H stretch (also couldbe due to unsaturation)
2965 sh assym. CH3 stretching (PE)
2935 S assym. CH2 stretching
2900 sh symm. CH3 stretching (PE)
2867 M symm. CH2 stretching or sum
CH3 stretching
2850 sh sym. stretching in methylene
1655 sh
1640 S amide I - -c=O stretching
1545 S amide II, NH def.
1478 W
1464 W CH2 bending (PE)
1417 W
1375 M & broad Ch def., CH2 twisting- Also sym.
1335 VVW sh def. of methyl groups
1285 W def. of methylene groups
1262 M
1215 W
1202 W
1179 M & Broad skeletal motion inv. CONH group
1125 sh broad
1103 M
1025 W broad CONH in plane?
950-970 VW CONH in plane
928 VW CONH in plane vibs.
890 CH3 rocking
888 RR'C-CH2
908 RCH-CH 2 (PE)
Note: S strong W weak VW very weak sh shoulder M medium
VW very, very weak
51
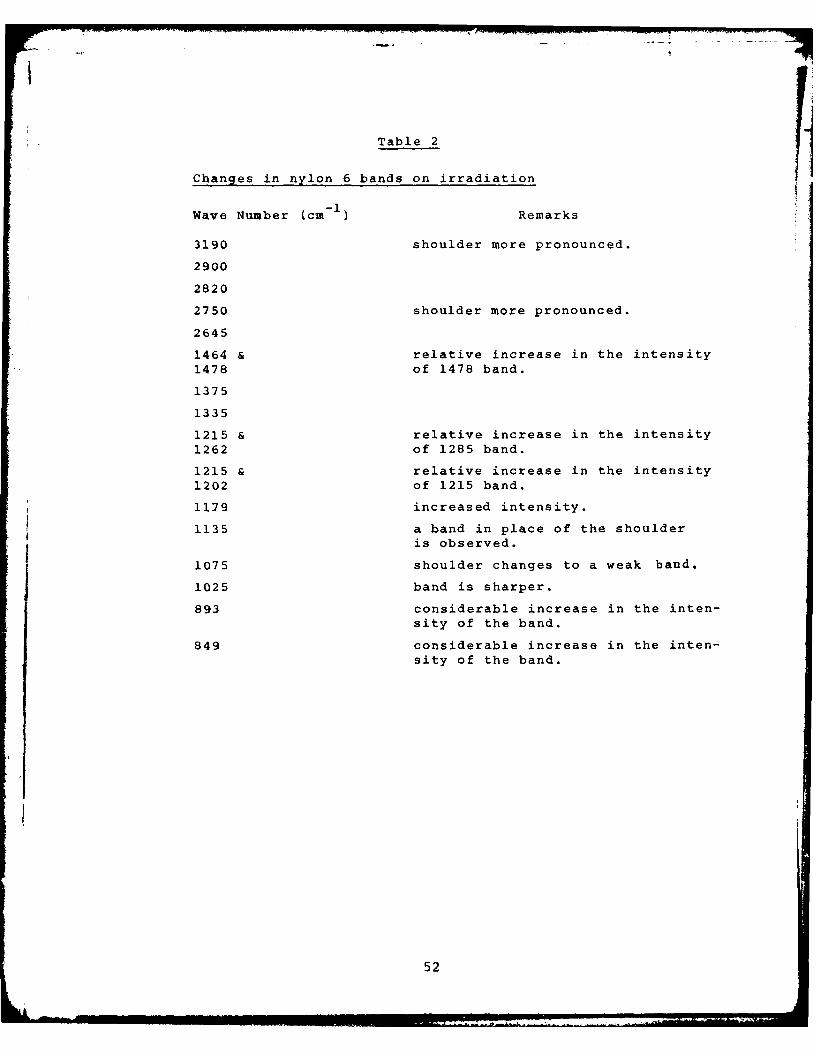
Table 2
Changes in nylon 6 bands on irradiation
-1Wave Number (cm - ) Remarks
3190 shoulder more pronounced.
2900
2820
2750 shoulder more pronounced.
2645
1464 & relative increase in the intensity1478 of 1478 band.
1375
1335
1215 & relative increase in the intensity1262 of 1285 band.
1215 & relative increase in the intensity1202 of 1215 band.
1179 increased intensity.
1135 a band in place of the shoulderis observed.
1075 shoulder changes to a weak band.
1025 band is sharper.
893 considerable increase in the inten-sity of the band.
849 considerable increase in the inten-sity of the band.
52

Table 3.
Changes in Nylon 6 Baads on Grinding
Wave Number (cm-l) Remarks
3190 shoulder in fractured nylon is more pro-
nounced
2900 slight increase in intensity
2820 new development of a shoulder
2750 increase in intensity of the shoulder
2645 new shoulder development
1735 ?
1464 & 1478 change in relative intensity of bands
increase in intensity of 1478
1375 intensity of 1375 band (?)
1335 disappearance of shoulder
1285 & 1262 increase in intensity of 1285 band relative
to 1261
1215 & 1202 increase in relative intensity of 1215 band
1179 seems the intensity has increased
1135 a band is seen in place of a shoulder
1025 band is much sharper
893 intensity of band has increased849 intensity of band has increased
53

Similar experiments were performed to observe the accumIIulaition of' end groups onl fracture of
drawn PE fihuns. I R bands at waveninmhcrs of 1303 cin' mid 18941 cml- due to -ClI l2 vibrations in
amiorphous (49) and crystalline phase respectively have becf) uIsMdas internal intensity standard. PE used
has a nu1.mber average Molecular weight of 20.000 and weight avcraige nmolecular weigh[ of 80,000. This
corresponds to approximately 3 x 10 end groups per grant of PE material. If a bond scission of
approximately 9.9 x 1O'8/crn 3 , ats proposed by /hurkov, Zakrevskii (24a, 24b) were to take placc, the
intensity of IR bands corresponding to various end groups will increase by 30 %. Such a change in the
intensity should be easily obsersable, but thle experiments lperfonned by the author here to obtain the
difference spectrum between fractured and drawn PE filmns, using bot-h 1303 cm' or 1894 cm' batnrds as
internal standards, failed to indicate any changes in the end group concentration. Similar observations
have been made by De~ries (50) at the University of Utah.
Assumllinlg thalt a I % change in the intensity of IR b)ands dueC to end groups is the miinimumn
detectable lim it for the IR technique, these negative results would mean that the number of end groups
florined onl fraicture in l'I is less than 3 x 101 /gim TIherefore, a secondary radical reaction ats proposed
by Zhurkov and /akrevskii (24a, 24b), leading to thle formation of thle submicroscopic cracks is not
fealsible, since it requires that each Free radical must rupture 4000 or- so additional covalent bonds before
it decays.
A comparison of thle %. inyl end groups (R-CI I :Cl Intniiso undrawn and drawn (draw ratio
f 15) %as lpcrlormned amid the results are shown in) fable 4. AI lie intensity of thle %inly] end group shmkcd
an increase inl concentration of the order of'3 %, which tcorresjponds to alploox ilitely 9 x 10¹⁷ scisios
pr gran 1 occutring inl the draw process. IThese resulIts Ilend su Ipport to I 'It Wy (SI) sigg.1c~litl tn a g. md iF g
bond scis';ion acconmpanying dl%raig of thle sNicstliepyerlml.
54

HI
EoU
0 0
4-))
4- 0 0
00 HU)
o !P
0 • •$4 0
o H
iti U
(0
0)0
to 0 OCh-
E-4 p.1!1:7 s4$- 44
0 0
4l) U)
4U4 0
c) '-4
4) 0
im
>0) 440(
U) 0)55

3.4 Gel Permeat ion Chiromatography
3.4.1 Introduction
A major cffir of this study as stated in the thesis proposal, was to bc devoted to monitoring tie
effccts of fractuirc on nioiccular weight distribution (MWDi) using Gel Permeation Chromatography
(GPC). Fracture, being a criticality phenomenon, is determined by the largest flaw present in the
material and gencrally affccts the material in a local region near thc fracture Surface without affecting in
any significant mnanner the overall state of die material. An exception to this behavior is the fracture in a
highily drawn fibrous morphiology. As a result, the expected change in MWD for most materials will be
insignificantly small to be observed by GPC, but a repeated fracture or extensive crazing (cracking) of the
material by some mieans might produce a detectable shift in MWD.
Nylon 6 fibers, where a significant bmnd scission has been reported front ISR studies, was the major
case for. thie inmestigation of MWIDs. This being the First reported study of the kind investigating die
fracture in nylon fibers uising GPC, a major effort has gone into developing the details of thie technique.
Fliernore, it was also shown (Iluring preliminary work that at change in MWI) in glassy polymers like
polystyrene can be observed, provided an extensive damage is done by producing a high craze (crack)
density. T[he polystyrene work is presenited in] the 'Preliminary Work' subsection.
3.4.2 Priiiciples of GPC
Gel Permeation, or- sizec separation, is a forin Of liquid cli ronmatography in which the solute
molecuiles arc separamted ats at result of their permeation into a solvent-filled matrix in (lhe columni pack ing.
L arge i nolcoicls may he excluded fr-oi sonic or all of the porous mat rices of the pack ing by %~irtue of
thleir pliysic,1l sue. [h'ley Clutc from (the columlln beflore smlller- nmlectiles m loich ~aC theC oppomituiy to
perilcate in to a grecc per~centage oC the sol cut- filled matrix. In j~sty ragcl (I 06 to 10 1) A0 pole ,Si/e) or
56

any other system of columns, there are cxperimcntally dctermincd size limits between which the
separation occurs. Those molecules with molecular size equal to or larger than the largest pore size will
clute at the same point, known as the Void Volume Vo in GPC. Also, there exists a point of total
permeation, i.e., a volume where all molecules of a given size and smaller will clute at exactly the same
place. ibhis is known as thc total permeation volume or Vt. The difference between V0 and Vt is called
Vi, the interstitial distance volume, and is the volume where separation takes place. For a given set of
columns V. and Vt are fixed quantities; therefore, the total volume, and the hence the total time
required for an analysis are fixed. The separation process, Vol Vi, and Vt are depicted in Figure 22. IFigure 23 is a schematic diagram of the GPC instrument.
57

Figure 22 Principles of Gel Permeation Chromatography.
5 THE PERMEATION PROCESS'n
n4
3 0 O
n Exclusion 1
MolecularSize
2 Selective Permeationn
1n %
Elution Total PermeationVolume (Ve)
I V
Vt 1
Figure 23 Schematic of GPC instrument.
__ Solvent
High-pressure of samplepumping system containing the polymer
PackedColumn
RI Detector
0
conc.
58

3.4.3 Preliminary Work
Fracture in glassy polymers is believed to occur through secondary bond rupture such as sliding of
molecules past each other. The role of primary covalent bond has never been too clear and only a small
amount of bond scission, if any, is expected.
A high density of cracks in a thin polystyrene specimen was obtained by bending it back and forth.
The virgin and highly crazed (cracked) specimens and polystyrene standards of narrow molecular weight
distribution (12w/w' n < 1.1) dissolved in chloroform to prepare approximately 0.125 % concentration
solution for GPC analysis. GPC analysis of polystyrene standards is perfonned and die elution volumes
plotted against die molecular weights to obtain a calibration curve for polystyrene as shown in Figure 24.
(More details of calibration procedures are discussed in Appendix IV.)
Nine molecular weight distributions (MWI)s) for the virgin and crazed (cracked) polystyrene
specimens are obtained and the data stored in digital form on the computer. These data arc then used to
obtain the number and weight average molecular weights as shown in Table 5 for tie virgin and
fractured specimen. Also, averaged virgin and crazed MWl)s from these data are obtained and plotted in
Figure 25.
Figure 25 clearly shows that MWI) shifts towards lower values on fracture. Number and weight
a~erage molecular weight data in Table S are further analyzed for changes according to median rank
plotting in Figures 26 and 27. Median rank plotting t-statistics procedures are described in Appendix V.
Furlhcrmore, a t-slatistic test olthe MIMw and N values oflable 5 indicated that one can state with
95 % confidence timat Pw has decreased upon crazing and failure. A similar statement for M. is not
possible due to tie higher scatter in the 1nI measurements.
'I hese observations can only be explained oi tie basis of covalent bond rupture ol higher molecular
weight (longCr) ITolcCIICs which will AlRt q w much morc strongly than Mn"l Some error il tile
determninatioii of Nin may also ha:Ie resulted from the presence of a low molecular weight component
59

(sonic kind of processing aid in the specimen and not part of tie MWI) shown). This does interfere with
a precise measurement of the concentration for low inolccular weight part of the distribution, which will
have strong influence on ie calculated Mn"
60

0Figure 24 GPC calibration curve for polystyrene at 25 C.
0
6.0
0
00
4U .0
.2 0 54 4 l
Elto oue(
U)1

Figure 25 Averaged molecular weight distribution (MWD) of virginand crazed (fractured) polystyrene at 250C.
0.03
0.02
0
Virgin
0 0.01
Crazed '
2.5 3.0 3.5 4.0 4.5 5.0 5.5 6.0 6.5
Log 0 (Molecular Weight)
Note Total concentration for each of the MWD is 1.0 am.
62

4-.4
..cA 0n If4 0n 0- 0 0 IV) 0 ON)
4) mon w.ru
a .4
.-4 $4 IV 0n 0n r- U0 10 0
V§ P-4 U) 0' ' 10 IQ %0 N.
Xz 1.46 1
P-41 0 1
$4 co %0 0 - 0 0 c0 N o 0 M
0-4
4.
w 4)
(n 0 1 0 0n 0n CN N 0oN4 N) % t m %0 1D %D ON 0 1"
-. P4- D OD 0 rI . -
4
w 4)
10 N m~ ON %0 10 %0 0' NI) U M N m 0 0 0 N4 P-4 0-
'-4 4JF4 0 0 %0 0 N M IAI x
0.63

Figure 26 Median rank plot for weight average molecularweight (Mu) of polystyrene.
98
90 A
so -Crazed A0
S70 -A 0
S60 -0
~ 50 Unc razed
> 400
30'230 0
120 4/ 0
2
1.4 1.8 2.2 2.6 x 10 5
Mw
64

0
-4
to 0
00
C.)
00
4
0044)
'4J
0 0 4.,
C-4
c 4
. 4 LA
0o 0 0 000 0 0 0NOD fl- t0 LA qt (n
65

3.4.4 GPC of Nylon 6 Fibers
The nylon 6 specimens used for GPC analysis arc virgin and fractured nylon 6 fibers. 'Ihe fractured
specimen is obtained by breaking, a tensile nylon 6 fiber specimen or ie kind in Figure 10, in a uniaxial
tension mode. -lexafluoro iso-propanol is the only solvent for nylon 6 at room temperature and which is
also compatible with rstyragel GPC columns, but nylon 6 exhibits a polyelcctrolytc behavior for dilute
solutions in tlFIP. Such a behavior has to be suppressed for a meaningful analysis of the MWD from
GPC. This is done through the use of a 0.1 molar solution of sodium triftluoroacetate in HFIP as the
mobile phase replacing pure lIFIP. This mobile phase will be called as 'S-HFIP' for future reference.
The nature of polyclectrolyte behavior, its effect on size separation by GPC and suppression of
polyclectrolytc effect through the use of S-FIP, and other data are presented in much greater detail in
Appendix VI.
The calibration curve of Figure 24 for narrow (Mw/Mn < 1.1) polystyrene standards cannot be used
to obtain MWI) of nylon specimens. Narrow molecular weight standards for nylon are not available and
neither are polystyrene standards soluble in S-I II IP for getting a universal calibration curve. In absence
of these commonly used means of calibration, a third approach in which known number and weight
average molecular weight of a broad nylon 6 specimen are used to fit a linear calibration curve is adopted
here. This and other calibration procedures are described in detail in Appendix IV.
The shift in the MWl) upon fr'acture in nylon 6 is expected to be small, similar to the polystyrene
behavior: therefore, repeated analysis of the same specimen were perlbrnmed. In this case six MWI)s fbr
each of the virgin and fractured nylon 6 specimens are obtained. The data are then analyzed in the same
manner as of polystyrene described in the previous section. Averaged MWI)s of virgin and fractured
nylon 6 specimens are plotted together in Figure 28 fbr conmarison. The number, weight average
Iolectilar weights and polydispersity Ior virgin and fractured MWl)s are twbulated in Table 6. These are
plotted according to niclian rank plotting in Figures 29, 30 and 31. l[he plots of Figures 28, 29 and 30
66
LLt-1 _

clearly show the decrease in molecular weight averages and the shift in MWD towards lower molecular
weights on fracture. The rupture of large molecules on fracture suggests that the decrease in weight
average molecular weight 1w will be greater than the decrease in number average molecular weight 1R n '
Thcreforc, polydispersity = NINY/M will also decrease on fracture. The changes in 1Aw and R n being
small, a large shift in polydispcrsity is not expected as is also evident from Figure 31. Figure 33 plots the
difference between averaged MWDs of virgin and fractured specimens of Figure 28 and shows that the
molecules belonging to higher molecular weight component rupture during fracture. This presents a
positive proof of the assumption made in calculating the amount of bond rupture from decrease in
viscosity average molecular weight by Crist (13), and Becht and Fischer (40).
Figure 32 shows the number and weight average molecular weights for the averaged virgin and
fractured chromatograms of Figure 28. It shows that the an approximate number for bond scission per
gram ( 3gp) is 2.8* 1018. A more accurate number for 19gpc is obtained from a calculation of the number
of molecules per grain in virgin and fractured specimens as shown next.
Figures 33 and 34 are obtained, according to the following equation, from average MW1) of virgin
and fractured specimens and prcsent N(i), the number of molecules per gram of nylon 6 versus molecular
weights MWDs of virgin and fractured specimens.
N(i) = jw(i) * ,.023* 1)23J/MW(i) (15)
where w(i) is the concentration of molecular weight MW(i) in one gram of nylon 6. The total
number of molecules per gram tbr virgin and firactured nylon 6 ibers are calculated to be 19.8 x 10¹⁸ and
22.4 x 10¹⁸, rcspectivcly. Th1u1s the number of chains scissions per gram ( g ) in nylon 6 is 2.6 x 10¹⁸ per
gram. Considering the density of 1.14 per gram, this will give bond scission per cm3 (Agc) of 2.3 x 10¹⁸
for nylon 6.
67
lo

Figure 28 Averaged molecular weight distribution (MWD) of virginand fractured nylon 6 fibers.
0.04
0.03
0.02
Virgin
0.01
Fractured
3.4 3.9 4.4 4.9 .5.4 5.9
.ogl0 (molecular weight)
Note Total concentraion for each MWD is 1.0 gm.
68

$4I
0P-4 b1r..0 C
> C4 C4 ('4 ('4 (4 C4
r-4 $
:j0 0 I 0 0(N) 7 (D CVN CN 4
w 0 0000--4 2.4
0 w 0 0r 0N 0 0T
0 bJ0 WH
-i0 0 0 0C 0as ()0 *,- 0.O
-t4 '.0 '.0 r- -T.
.. 0 *rl a a a4 aean
pU C) 0- C( ,(
1- '.o V-0 () '0 (V) 04
0 044.
0 0# 0 054 ao o a a a a
DO (4 mN (N (D (0
-4e -tL
0469

.CC
.-4 410, u
-4 '
0.-
~4 )
$4 W 0
$4
d2)
(D U.
0U
_44
.. 4
700

Figure 31 M redian rank Dlot for polydispersity.
o VIRGIN)FRACTURED
99
95
90
80 x
~60 x350
4L3 XO
.30E2U
10 x5
2.b5 2.15 2.25 2.35 2.45
Polydispersi ty
71

- K >1
4)
044C
00
4
M. 04 0 -
14 IV -1$44) 14 4) 44
44 :Br 0 0> 0 0
4 14 N 0 V-
El 0 tpU4
$4
-4 .0 4J$4r- 00~.
ElI $40 44
0~
r-4
04N
$4 4 $4 H)El4) _0 V
>C N0 $4- El)
V 0 n I-~H H4V $4Hr- $4 a
0N 0v u. w$4 4El El I x
44 r-IH N%0 z 0 0 D
01 0H (A 0 I1I 1
444.0
0*9* 0U4.4 0
fn $4
.9 0 .
(94 44 El
0u 0)44 U44Er P l $4 0
72

Figure 33 Distribution of number of molecules/gm. in virgin andfractured nylon 6 fibers.
X10 1 7
7. .2
15.4
$4
0
3.6
'4
%4
1. Fractured
3.9 4.4 4.9 5.4 5.9
LOG 10(molecular weight)
73

Figure 34 :Difference MWD =MWD of fractured nylon 6 fiber-MWD of virgin nylon 6 fiber
'.4
4W.44
00
4-4
U -0.003.II
444

Figure 35 Difference distributionNumber of molecules/gm. in fractured nylon 6
x1016 fibers -Number of molecules/gm. in virginX1 nylon 6 fibers.
10.00 4J-40U0 to
-4o C 7.2520
54Q)
A -4 4
:)4 1.6
.
U -1.2
3.9 4.4 4.9 5.4 5.9
Log, 0 (molecular weight)
75

4. Analysis of Ti Chain Scission.
4.1 Model for Tie Chain Length Distribution
The microstructure of highly drawn polymers, different in details from one polymer to another,
consists essentially of alternating crystalline and amorphous regions. The amorphous regions consist of
chain loops or folds at the interphasc between crystalline and amorphous block, tie chains bridging the
amorphous rcgion connect adjacent crystalline blocks, chain ends and cilia. The tie molecules have
different lengths which is a factor determining the mechanical properties of these materials. The tie
molecules in the amorphous regions (15, 52) bear the load and as a result rupture under stress.
A model to obtain the density distribution function for tie chain lengths has been developed. The
model calculations are performed Ibr a basic element of semi-crystalline polymer consisting of two
crystalline blocks and an amorphous region separating them, as shown in Figure 36. As an
:pproximation, die real polymer chain is replaced by an equivalent model chain on a cubic lattice. die
free energy F of Ie element under consideration consists of the energy contribution from crystalline
blocks, the amnorphous regions, and tie interfacial zone between them. The energy F is given as
F I -Nu*N) ,1:0 + IVNt I: .(N) + kTEv, log(vm/v) + 2vT- Y" (16)
where
M : Total number of model chain units present in the element.
N Number of tic chains of N units.
F° c Free energy per unit of thc chain in the crystalline block.
I 1(N): IFncrgy of a tic chain of N units.
v : I(ital number of tic chains prteeit in an amorphous ,gions.
Y : Suria.'c energy per iic chain coming ofl the crystal stimface.
76

Y" Total surface energy ofchain folds or loop.
The first term in cquation (16) is the energy or crystallinc blocks, the second term cnergy of tie
chains and third the configurational energy of the tie chains, and die last two terms are the surface energy
of thc interfacial zone.
77

Figure 36 A typical crystalline and amorphous regionof the fibrous structure.
Figure 37 Schematic drawing of a tie chain and theinterfacial zone in an amorphous region.
X~ 0
(XA!YAZA)
(X B Y BZa d
x= d
78

Figure 38 A representatice chain configuration not allowedin the amorphous region of a semi-crystallinepolymer.
Figure 39 Three-dimensional view ofof alternating crystallineand amorphous blocks inthe fibrous structure.
Figure 39A Crossectional view of
the crystal face forcomputer modelling.
Face A 0 0
Face B
79

'llbe Lie Uchdain length distribution is obtained from dhe consideration that free energy U is minimium
Tlhecrorc, thc equation to bc solved using Lagrange multipliers is:
SF= 0 (18)
subject to the condition
Sv=6Ev,4= 0 (19)
Solving these, one obtains
0(N) =Vt4/ = exp {-AF 1 ,(N)/k'1'/ Ecxp {-AFN/'l (20)-
where a F1 01) =f ,j(N) - NFIC-0 (21)
Free energy 4F1_(N) consists ofanl enthalpy and an entropy term.
A F1 N) =All II_(N) - II&S1 I(N) (22)
!nhilyI m: Il heeidhalpy term Al 11,(N) is the enthalpy of' melting N crystalline umnits and a
tem Lildle to chains inl the interfacial zone (53, 27), which hlave both1 trals, and gaulche con Fonn11atiOns.
Ail 1(N) = N(AiI 1> +YtN) (23)
where <Al1() is thle Inch centhalpy per unlit of the mlodel chainl inl thle crys(Alline phase.
It is e xpeclIed th at thle Clhaimns em ie rginll from mmcrystal blocks as tie chia ins will be somellcwa more
colls(lanmlcd ill (lime imterfaciial /lne [hall ill a perlflectly alololphous slate (anld will probably hawe more tralls
80

conformations than in the melt or amorphous state). As a simplification procedure, we assume that all
the tie chain constraints are confined to a small interfacial zone as shown in the Figure 37. It is also
assumed that the intcrfacial energy Ytis independent of tie length of the tic chain; in other words,
YO(N) =Y.
'herefore,
AHFL(N) = N <A 10> + Y (24)
Entrony Term: Sl(N), the entropy, for a chain of length L and number of units N, forming a tie
molecule is different from a chain of N units in die melt, since the ends of the chains are fixed to the
crystal and die volume available to the chains is limited to die volume confined between the two
crystalline blocks. SL(N) is solved for by arranging the model chain on a primitive cubic lattice of lattice
constant Xa' subject to die above conditions. The entropy of a chain of N tnits having end to end distance
r is given by
SI(N,r) = S't(N) + k loge{Z*(N,r)} (25)
"here S't(N) is the entropy contribution arising from inner vibrations of the chain and Z (N,r) is the
tnimber of configurations availablc to the chain the presence of other chains. The quantity S't(N) for a
chain or N units in the prcscnt situation (amorphous phase) is the same as in the melt, but Z (N,r) is
different.
According to Zachian and Peterlin (54), for a chain fixed at two ends,
Z (N,r) = W(N - l,r)*Z'(N I- I)*a3 (26)
where W(N + lr)*a3 is the probability that the end of the model chain lies within the volune a it
a distance r from the other end. Z'(N + 1) is tie number ofconligurations of a chain of N + 1 units with
81

both ends free and in infinite space.
According to Chandrasckhar (55), the numnber of conformations of the shortened chain in the
volume limited by crystal faccs is given by the number of conformations in the infinite space minus the
number of conformations of the chain which partly touch or cross either or both of the crystal faces. In
other words, the conformations subtracted will be the ones for which the chain will cross from
amorphous into at least one of the crystalline regions for a short hop before returning to the amorphous
region. Such a representative chain configuration is shown by the dotted line in Figure 38.
The mathematical formulation for this is due to Gaylord (56). The probability of a chain of end to
end distance r between two perfectly reflecting infinite walls (an approximation to the real finite size of
crystal face) separated by a distance d is given as
W(I I,r) = E [W(x I - x2 - 2md, y, z) - W(x 1 .+ X2 - 2md, y, z)] (27)
where (x1 , Y , zl ) and (x2 , Y2 z2 ) are the coordinates of the chain ends and
y =y -y 2 Z =z - z2.
Such a representative chain is shown in Figure 37.
Since the chain in the interfacial zone has only one conformation, the shortened chain of (N - 2)
unit lengths connecting points I and 2 has the same number of conformations as the whole chain of N +
2 units. For calculation purposes, the interacial zone has been chosen to be of length 2a, i.e., A, = 2a
(about 4.9 AO). lherefo e, a tie molecule of N + 2 units will cflfctively act, for the purposes of
conformation calculation act, as a model chain of N - 2 units.
From equations (26) and (27)
Z(N +2,r) = E Z'(N-I) IW(N-1,r(m)) - W(N- 1, r'(m)) *a3
MI=-CO
-'f(N-)*lN(N,r) (28)
82

where
P(N,r) = £ {W(n-,Ijm)) - W(N-I, r'(n))}*a3 (29)
From equations (25), (26), (27), (28), and (29), it follows that,
SL(N+2,r) = S't(N+ 2) + k loge{Z*(N+2,r)}
= S't(N+2) + k log,{Z'(N-i)} + k logfP(N,r0l
According to Flory (57), for a chain of N units on a cubic lattice,
Z'(N) 6
,Ibus,
SL(N+ 2,r) = S't(N+2) + k loge{Z'(N+2)} - 3k loge6 + k loge{P(N,r)} (30)
The entropy ofa chain of N + 2 units in the melt is given by
SI(N+ 2) = S't(N+2) + k loge{Z'(N+2)} (31)
'Ilirefore,
SI(N+2,r) = SII(N+2) - 3k loge6 + k logelP(N.r)}
let the entropy ofa chain of N + 2 units in die crystal be S (N + 2) and
SII(N 42)- Sc(Nt- 2) = (N + 2) <ASO>
<AS()> is the etropy of melting a unit length of chain of the crystalline block.
SI(N±2,r)-Sc(N+2) = A&SI(N+2)
83

= (N+2)(ASo> + klogII(Nr)} -3kloge6 (32)
Therefore,
AFL(N + 2) = AHL(N + 2)- TASL(N + 2)
= (N+2)< AHo> (T1 0 - ')/lm° - kT log,{P(Nr)} + 3kT loge 6 (33)
The calculations for the function P(Nr) based on Gaussian pi~obability function W arc given in
Appendix 1.
Thus,
G(N+2) =VN/V = {exp(-AFL(N+2)/kT)}/ {exp(-AFL(N+2)/kT)} (34)
where
AFL(N+2)/kl = {(N+2)<AHo>)} * {(T'm°- "l/)Tlmo I}
Ioge{P(Nr)} + 3logc6 (35)
and, to a first approximation as shown in Appendix I, logeP(N.r) is given as
loge{P(N,r)} = -0.4158 - 1.5loge(N-1) - {.5/a 2 }[(RSQR + 4a2)/(N-1)] +
logclsinhl6(d-2a)/(N-1)a} *cxp 1,-3(d-2a) 2/2(N-l)a 2}
sinh{6(d+2a)/(N-I)a) * exp {-3(d+ 2a)2/2(N-t)a 2}I (36)
where
RSQR = y2- +z2 (37)
The probability G(N) cur a lic chain of length N units, according to cquations (34), (35), and (36) is
a finction of die material parameters (M I0>, Tin, , I, d and other parametersA, RSQR, a characteristic
of the model. X has been assigned value of 2a, based on expected length and e used values for the size
84

of intcrfacial zone by other researchcrs (27). '1lie length 'a' of thc unit model chain is calculated from
comparison of the melt entropy of the model chain with that of real chain. This calculation is described
in a later section on parameters.
In order to evaluate the density function G(N) from equation (34), one needs to obtain AFL(N) as
given by equation (35). The loge P(N,r) term in equation (36), as the argument of P(N,r) suggests, is a
function of N, the number of model chain units and the distance r between chain ends of the tie
molecule. r is given as
r2 = RSQR + (d - 4a)2 (38)
where RSQR defined here is used for evaluation of loge [P(Nr)].
A tie molecule in the amorphous region of an element of polymer structure as shown in Figure 39
can have an infinite possible values for r depending upon the location of end points of A and B in the
surfaces I and 2 respectively. For the present purposes of calculation of G(N), each of the
crystalline/amorphous boundary surface has been divided into 100 elements. Since the microfibril has
cylindrical cross-section, the element in Figure 39 is assumed to be cylindrical (the diameter of the
cylinder is taken to be 80 A0 ); (20, 21). Each of the cylinder surface is divided into 8 rings of width 5 A0
each as shown in the F:igure 39a.
i'ach ring is subdivided into elements or equal areas, such that areas of elements in different rings
are very nearly the same. Fach of these elements are assigned co-ordinates R and 0. R for an element is
the average of the outer and inner radii of the ring to which the element belongs. Considering a ring of
N clemcnis, the 9 co-ordinate or'thcj th clement in the ring will be j x 360/NI where j = 1, 2 ....N. 0 =
0° co-ordinate for each ring lies on the some radius line of die circular cross-section. 'llice 0 value
increases anti-clockwise. The N values for the eight rings, :;tarting from the outermost, were chosen as 24,
20. 18. 14, 10, 8, 4, and 2, respectively.
HAving assigned (R,B) co-ordinates to each element on both faces I and 2 of the crystalline block,
85

consider a tic mnoleculc connecting thc ith clement on tie face 1 with jth clemnent on face 2. In ordcr to
evaluate log, P(N~r) from equation (16), thc RSQR for this tic molecule has to bc obtained.
Thc RSQR (ij) from tie law of cosines and Figure 40 is given as
RSQR(ij) = RI(i)l 2 + {R20)} - 2[Ri(i)*R2(j)*cosI9I(i) - 0201)I (39)
86

Figure 40 A drawing for calcualtion of RSQR(i,j) in the modelfor tie chain length distribution.
eRQ (i,j)
(j)i ,O(i)
87

4.1.1 Model Paramieters
'l'he chosen values for the parameters of the model for the nylon 6 fiber materials are:
Crvstallinitv: The crystallinity of 37.5 % for nylon fiber is obtained from density measurements using,€
3Amorphous Density (34) 1.084 gm./cm = Pam
Crystalline Density (34a) = 1.230 gm./cm3 = Per
Crystallinity Xc = 100 * (P- Pam)/(Pcr - Pain)
Density of nylon 6 fiber P = 1.139 gm./cm 3
Crystallinity of 50 % is obtained from X-ray data.
Length " Crystalline and Amorphots Blocks: The length of crystalline (Lc) and amorphous (la) blocks
of 60 A0 and 30 A0 were determined by Prevorsek (20) and Park (32) using WAXS and SAXS.
MeltinTemperat ire: Melting temperature (TO) of 4960 K for the nylon 6 fiber specimen is determined
using Differential Scanning Calorimetry (DSC).
Proccssini, TenmoeratLre: "llis was determined by Park (32) in his thesis work for these materials by
anncaling the nylon 6 fiber at different temperatures. The processing temperature is taken as the
minimum annealing temperature at which the morphology, i.e., long period and orientation angle, show
a sudden change. This was found to be 428 0 K.
i)iameter of the Microfibril: This diameter was determined by Prevorsek (21) from his study of WAXS
to be 80 A0 .
othalpof Fusion: Fnthlalpy of Ision per mole of monomer for nylon 6 is 5400 calories. (34b).
Lattice Mol Unit l.ngth: The model unit length 'a' is obtained by comparing the melt entropy of a
model unit with the melt entropy per covalent length linkage in nylon 6.
Melt entropy per model unit, according to equation (11) for a cubic lattice is = k * loge 6 = 1.79
k/unit°K. Nylon 6 monomer is or length 8.62 A0 and has 7 covalent linkages. Ihercfore, average
88

covalent linkage length is 1.23 A° . Melt entropy per linkage is obtained using 5400 calories per mole as
the enthalpy of die monomer and 4960 K as tie melting temperature. This gives a value of 0.78 k/° K
for melt entropy per linkage.
The nelt entropy per model unit is less if one takes into account the close packing of the
macromolecules and therefore the competition for space in reducing the number of conformations.
Hence, as a first approximation, one model unit is equivalent to two covalent linkages in the real chain.
'Ibus the length of a model unit length 'a' is chosen as 2.46 A0 .
4.1.2 Calculation of G(N)
RSQR (ij) is evaluated according to the eq. (39) for: i = 1,2,3 ....... 100, and j = 1,2,3 ....... 100. For
each RSQR (ij), logeP(Nr) from equation (36) is used to obtain
AIL(N) and Gi j (N) for the relevant range of N values using equations (35) and (34) respectively. The
Gi j (N) for all possible i and j is then averaged to obtain the density distribution finction G(N) for the
tie molecule population of die e!ement of Figure 32.
(Note.: In actual computation on the computer, only a half of the elements for one of the surfaces
corresponding to those with 0 co-ordinates between 00 and 1800 have been used. This reduction in
computation is possible since the two halves of this surface are identically symmetric with respect to the
other surface.)
A plot of (L) against the length L/L 0 is shown in Figure 41 for a crystallization temperature T of
4280 K or 155 0 C. .O is die minimum lie chain length possible and will be equal to the width of die
amorphous region in semi-crystalline nylon structure. Figure 42 shows cumulative G(.) against L/Io
plotted on a normal probability paper. 'IliK latter half of this curve is a straight line, indicating that these
tie chain lengths obey Gaussian statist ics. Figure 42 also indicates that short tie chains, generally referred
to as 'taut lie chains' have a concentration of 2 - 5 % of the total tie chains. This fractional number for
89

- - -
taut tic chaiins is ill Iceasonlably good agreement with the expected inmber of' Lim tic molecules.
90

u0
-4 0 1A 4
(a-o r4b r 4UO 4j1 -4
4-' -(0 14j.~ 0
o- 0) %D~ '
0 4j
E-4W 4 4.~.-4
4 J4 4 N-
4- 0'.0
ucn 00 -4 -
= c =~~-
Q.) -'.4
-L=0
-:4-' C4
L- (L) -
0 I
4L)C 0
0
U--
60*0 LOO .0o s0Colo 10*0
saifl3alow ail JQ uoflloDj
91

Figure 412: Cumulative fraction of tie molecules versusratio of tie chain length to minumum tie chainlength (L/L0).
99.99
98
400 K -
a)3503 428 K90
.so
4 70
4-J
0)
30 -4064-
230
4-
20
0.1
1.0 3.0 5.0 7.0 9.0
L/L0
92

4.1.3 Critical lleview
The model for calculation of the tie chain length distribution has been obtained on the
minimization of free energy in a thermodynamic equilibrium situation. This might seem inappropriate
since the characteristics of amorphous stte are established during crystallization, a kinetic process.
Consider an amorphous polymer melt in equilibrium at certain temperature Tl is cooled down to
another temperature T2 above the melting temperature. The chains in this case will start rearranging
themselves as soon as the melt is cooled, towards a new thermodynamic equilibrium state of temperature
T2 . Given enough time for chains to rearrange, the thermodynamic equilibrium configurations of chains
at temperature T2 will be obtained; but now consider the other possibility that T2 is below nieling
templerature and enough time is not given for a complete rearrangement before the melt was quenched.
The molecular state in which the solid will be locked is an equilibrium state between temperatures T1
and ' 2 . An exactly similar situation exists during crystallization where the chains in the amorphous
region are striving toward thennodynamic equilibrium state at the temperature of the environment, but
this rearrangement is impeded by crystallization. Therefore the thermodynamic equilibrium theory used
to obtain the nature of amorphous state will only provide am approximation to de actual state of affairs.
Keeping this in mind, the tic chain length distribution have also been calculated at temperatures about
750C above and below the measured processing temperature. The crystallization kinetics in nylon 6
being slow, it is expected that the tic chain length distribution will be close to that calculated for the
processing temperature, but almost certainly within the extremes of other temperatures for which the
distributions are calculated and shown in Figures 41 and 42.
I ooking back into the calculation of the tie chain length distribution, one observes absence of any
Consideratien for the effects of drawing on the derived tie chain length distribution. Such effects will be
small and will result in small increase in the concentration of the taut tie chains. Some increase in
concentration of the interfibrillar tic molecules may also occur. [hese changes will be small as follows
93.7

from the cold drawing process of nylon 6, where i lamclla may break up, but the amorphous material
between the successive broken lamella is not tcrribly altered. This has been shown to be the case for
nylon 6 fibers which are melt spun; the draw direction being the fiber direction as established during
crystallization. The long period of these fibers does show a very small change on drawing (21). Thus the
tie chains connecting adjacent crystalline blocks are not modified in any major way as a result of drawing.
The exception is the formation of new interfibrillar tie molecules during drawing, and the calculated
distribution is not applicable to this. Therefore the width of the tie chain length distribution in the drawn
material will be approximately the same, as obtained from the model presented in this study.
4.2 Calculation for Number of fie Molecules
The calculation here for obtaining the number of tie molecules present per a gram of the nylon 6
material is derived on the basis of following assumptions and assertions:
1) The probability that any molecule present in the polymer can contribute to the fonnation of a tie
chain is independent of the length of the molecule provided it is above a certain minimum required
molecular length (I.miin). The minimum required molecular length will be the length of two crystalline
blocks plus the length of an amorphous region.
2) Ihe number of tie molecules resulting from a given polymer molecule is directly proportional to the
length of the molecule.
3) The average length or the polymcr lCculC 1. required to form a tie molecule is the length of a
crystalline block Lc plus all average length for (he tie molecule I,1,
1. Lc + I ,
where
94

and G (L.(i)) is the density distribution fuinction for the length of the tie molecule as obtained in the
previous section.
4) "l1ie molecular chains that return to the same crystalline block (chain loops, switch board concept) or
chain fold, represent molecules that do not cross over from one crystalline block to another and therefore
do not contribute to the tie chain population. The reduced number of tic molecules obtained due to the
formation of loops or chain folds can be taken into account by including a factor X. The factor X is the
fraction of the chains in the crystalline block that contribute to formation of tic molecules. Note: w(i) is
the fractional weight in grams of a molecular weight species MW (i) such that the total weight of the
specimen under the chromatogram is one grain. N(i) is tie number of molecules present of molecular
weight MW (i) in one gram of the specimen.
5) Divide the mulecular weight axis in Figure 28 into a certain number of segments, say M (100 in our
case). The ordinate w(i) in Figure 28 can be changed to N(i) according to following manipulation:
N(i) = [w(i) * 6.023 x 10² 3 /MW(i)
6) Calculatc the extended length IL(i) of the molecule for the molecular weight segment of MW(i). The
Ilngth l(i) is
1.(i) :- N 1 IW(i) L.cngth (cx tended) of monoimier}/Molecular Weight of Monomer Unit
iFor nylon 6,
L(i) :: {MW(i) * 8.62 A°}/113.16
7) 'l he total numbcr of tie molecules resulting from a segment of molculecs of molecular weight NI W(i) is
given by
95

/ A~g I q MASSCW. TTS NST OF TCH CA BRDGE DEPT OF MATER A .- TC F/B 11/9
MOLECULAR FRACTION BEHAVIOR IN ORIENTED POLYMERS. U)JUN 80 R K POPLI D K ROYLANCE DAA$29-76-C-OOVG
UNCLASSIFIED AR013630.3-MSX
:,

1111. 1 E5 2. 2
11111.!2 11IIJI' .MIICROCOP RES TIN T
MICROCOPY REOUINIS CHR

NT(i) {Ni) L (i) X }/L
8) Calculate NT(i) for each segment for i =12 ........ M.
The total number of tic molecules 'NT' is
rT = T r(i)
The total number of tic molecules per gram has been found to be 1 * 1020 per gram, which is in
agreement with die generally expected value.
4.3 Discussion
GPC measurements on nylon 6 show a bond scission '0' of 2.3*10 18 /cm. 3 . This is in excellent
agreement with 0 of 3.3h1018/cm. 3 measured by Crist (13) from decrease in the viscosity average
molecular weight assuming random scission of chains and Mw/M n = 2 for nylon 6. These observations
of GPC and visconictry are also in close agreement with the number of free radicals detected by FSR.
The observed ration of' 0Sgpc/free radicals' of approximately 5 very likely rcs.lts from the decay of
reactive free radical species, as suggested by Chapiro (60). The confinnation of these results by GPC is of
significance since the results of viscoinetry and FSR are questionable due to the inherent uncertainties of
the latter two tcchniqucs for such an analysis. The importance of an accurate value for ipe cannot be
underestimated because to a large extent the acceptance of a fracture model has been based on its
3prediction of the bond scission per cm. ; this being the most direct experimental evidence available at
this time for fathoming the molecular nature of the fracture processes in highly drawn fibrous materials.
Zhurkov and Zakrevskii (24a, 24b) proposed a mechanism for submicroscopic crack nucleation
from their studies of free radicals and of newly formed end groups. According to their observations, a
single free radical undergoes secondary radical reactions to produce as many as 4000 bond scissions
>4 96

before it decays. GPC observations of bond scission of 2.3"1018 per cm 3 in nylon 6 and IRmeasurements of bond scission in fractured PE filIn of less than 3*1017 per cm. 3 cannot possibly be
explained on the basis of Zhurkov-Zakrevskii mechanism. Viscomctry data of Crist (13) and IR
observations of De Vries (61) reinforce the observations made in this study. Therefore, the experimental
observations of Zhurkov and his colleagues can only be attributed to some peculiar characteristics of
their polyethylene specimens.
GPC observations of Figures 28 and 34 show that the higher molecular weight component is
preferentially ruptured during fracture. The statistics of mechanically induced scission are thercfore
biased in favor of larger molecules. This would seem to follow logically from the consideration that a
longer molecule generally has a greater probability of participating in the formation of a tic molecule.
The positive and negative portions of Figure 34 have been summed over seperately to obtain the number
of molecules per gram that have ruptured and the ones that have formed. These numbers are 1.35*1017
and 2.7*10 18 per gram respectively. The ratio of 20 (of number formed to those ruptured) means that a
single long molecule, on an average, may be ruptured as many as 20 times. How is this achieved? It is
generally believed that the tie molecules in the amorphous regions are the ones to nipture. Therefore,
the observed behavior can only be explained if a long molecule. were to form a large number of tie
iolecules. (Consider a molecule of molecular weight 500,000; the contour length of such a molecule is
38000 A0 . If only one tenth of the molecules in the crystalline block were to form tie molecules, one
obtains 40 or so tic chains resulting from such a polymer molecule.) Such behavior would suggest a
switch-board rather than a folded-chain model of the crystal morphology.
Comparison of the concentration or the number of molecules per gram as a function of molecular
weight tro virgin and fractured specimens of Figures 28 and 33 presents %me interesting aspects
regarding the role of different molecular weight coniponents. In Figure 43, the fractional change in
concentration (ratio of change in concentration at a given molecular weight to the concentration of virgin
97

specimen of that molecular weight) is plotted. 'Ihis plot shows a maximum decrease in fractional
concentration at molecular weight 3*105, but the fractional concentration increases from zero at
molecular weight of 5.5*104 to a maximum fractional increase or 0.24. The change in the number of
molecules per gram at any molecular weight 'X', is resultant of the two effects of the amount added due
to rupture of higher molecular weight 'Y' onto X, and the amount lost from rupture of 'X' into lower
molecular weight species. It has not been possible to deconvolute these two effects to obtain an absolute
conversion of each molecular weight species from its initial concentration. Such a deconvolution, if
possible, will be helpful in providing the statistics of the scission of molecules in nylon 6.
Earlier mentioned observation of the preferential rupture of the high molecular weight molecules
into a number of small segments was explained to suggest that a large molecule forms a great number of
tie molecules. If the relative concentration of the high molecular weight component be increased, an
increased number of fie molecules will be formed. Therefore, assuming fracture obeys the same statistics
as before, a grcatcr number of tie chain ruptures will be observed on fracture. This will slow down the
crick propagation mode, thereby increasing the lifetime of the solid under stress. The greater number of
tie molecules also implies a higher fracture strength and an increase in the total energy absorbed before
macroscopic failure occurs.
This hypothesis can be checked from a comparison of the fracture behavior of two fibers of nylon 6
of similar morphology, with same number average molecular weight but different weight average
molecular weights.
'!11e plot of Figure 4.1 has a maximum in die fractional concentration decrease at a molecular weight
of 3* 105. The significance of this maximum, die molecular weight at which it occurs, and its role in
dcermining die fracture prol)crlies is not understood at (his time.
Amornhoms Mooholog'v: The mechanical behavior of drawn polymers is determined essentially by
the nature of amorphous coitent and. in p;articular, the fraction of taut tie mole.cules (or, continued
98

crystallites through amorphous regions (62, 63, 64)). Peterlin (65) indicated a taut tic molecular fraction
of 1 - 4 % derived from the elastic modulus and tensile strength, whereas etching of the polyethylene
specimen with nitric acid provided for an amorphous tic chain content of 20 - 30 %. McCrum (66)
estimated a concentration of only 0.25 % for tic chains (taut, apparently) to explain the anisotropy of the
relaxation. Fischer (67) indicated about 1 % of the material in the cross-links. Ward (62) reports a
maximum crystalline content of 0.6 for PE from the ratio of apparent lattice modulus to crystal modulus,
implying that 40 % of the material in amorphous region is in disordered phase. The contribution of taut
tie chains to the disordered phase in this case is not known. Nagou (63) has obtained from their
experimental results on highly drawn polypropylene a concentration of taut tic molecules of
approximately 2 % in a total concentration for the amorphous phase of 25 %.
A calculation perfonned by the author (details are given in Appendix III) for nylon 6 fiber
specimens of 50 % crystallinity obtains the concentrations of chain loops (folds), chain ends, tie chains,
and cilia. ilic results of this calculation are presented in Table 7. Some of the amorphous content of tie
molecules might be accounted by interfibrillar tic molecules (69), connecting adjacent microfibrils or
distant crystalline blocks within a microfibril. The contribution of the intcrfibrillar to the amorphous
material has not been resolved. Fron ITable 7, if the tie chain contribution of 0.254 gram were used up in
obtaining the interfibrillar tic molecules (which are generally taut) and taut tie molecules only, the
resulting modulus of the fiber based on Takayanagi's approach (71) will be much higher than the
observed value. "'liercfore, one concludes that only a small fraction of the amorphous tie chains exist as
taut tic chains and a major fraction comprises the tic molecules in non-extended conformations.
Non-extendcd tie molecules do not contribute significantly to the modulus of the fiber, except for
the small entropic effect. l lowever, void formation requires rupture of all the tie chains in that
cross-section. As a result, all the non-extended tie chains in that cross-section are also ruptured. ihe
rupture of the non-extended tie chains requires large local strains which will be present only in the
99

vicinity of a flaw.
Thereforc, any fracture model must include the contribution of the non-cxtended tie chains to the
number of molecules ruptured and to the formation of the microflaws.
A theoretical calculation described earlier gives tie distribution of the tie chain lengths and the
results of this calculation are presented in Figure 41. The cumulative distribution plot of Figure 42 gives
an approximate value of 2 - 5 % for the fraction of taut tie molecules. This number is in good agreement
with the fraction of taut tie molecules calculated by researchers from other studies discussed earlier.
A comparison of the tie chain length distribution of Lloyd - DcVries model with the theoretical
distribution of the tie chain lengths calculated shows that the difference in the width of the two
distributions along the axis (72) of 'IL o' is large. The Kausch's experimental results are between 1.07
and 1.18 whereas the theoretical model values vary from 1.03 through 6.0 or so. The initial portion of
the cumulative tie chain length distribution from theory and the distribution of tie chain lengths of
Kausch's observations are plotted in Figure 44. This plot suggests that the distribution of tie chain
lengths obtained from experimental ESR observations of Kausch may have resulted partly from the taut
tie molecules component of the theoretically calculated distribution. The apparent suggestion is that
I.loyd - DeVrics distribution does not represent the distribution of tie chain lengths but possibly reflects a
contribution from i:*,. distribution of taut tie molecules only. This seems reasonable in light of the fact
that Lloyd - l)cVris distribution has been obtained from a histogram of the free radical obtained on
fracture which is a result of the presence of taut tie molecules and the not-so-obvious effects of the
variation of strcss-intensity factor in the vicinity of the submicrocracks.
A major probelm wih the l.loyd - I)cVries model is that the experimentally observed chain rupture
of (5* 1017 per cm.3 of free radicals from ESI) 2.3* 1018 per cm. 3 from GPC is only a small fraction of
the 5"1019 - 1*1020 per cm. 3 of the tie molecules present in nylon 6. Another problem with loyd -
I)eVrics model is the presence of i nhomogencities through submicrocrack fornnation which have been
100

observed by Zhurkov fromi SAXS of tie loaded fibrous specimcns of nylon, po)lyCthylCnC, and other
materials. Lloyd - DVries model makes no provision for the fbnnation of submicroscopic cracks.
Notwithstanding the other drawbacks of Peterlin's model, submicroscopic crack formation follows
directly as a result of the retraction of the microfibril ends. The formation of microcracks also enables a
logical explanation for the rpture of only a small number of tie molecules. Lloyd-DeVries model can
easily explain the observed stress-strain behavior, of Figure 45, if the number of tie chains experiencing
the stress is taken to be about 20 times the number of free radicals observed (23).
A new approach for the formation of the microcracks in the fibrous morphology is suggested here:
The fibrous structure is assumed to consist of an almost continuous fibril of alternating crystalline
and amorphous regions. The long period and the cross-section of the fibril is typically of the order of 100
A0 and (100 Ao) 2 respectively. The major question to be addressed is, what is the nature of the weak
region where the submicrocracks can be initiated? Considering the amorphous regions, the number of
tie chains are not Lhe same in every amorphous block. An amorphous block of (100 AO) 2 will have, on an• AO2
average, about 50 tie chains or so, assuming a cross-section for the tie chain of 20 A0 and that only
one-tenth of the chains in the crystalline lattice will fonn tie molecules. "llius the number of tic chains in
the amorphous regions being statistically distributed, few of these regions will have a greater number of
tic moklculs than the average of 50, wherc;Ls some others will have a much smaller number of tie chains.
The amorphous regions with a small number of tie chains are relatively weak and tie stress experienced
by the individual chains will be higher than for the chains in other amorphous regions. As a result, the
tic chains in weak amorphous regions break and a stbmicrocrack is initiated. Comparing the
experimentally observed submicrocrack density with the approximate iiumber of aOrphlos regions
present, it turns out that an tipper limit for the amorphous regions cla.sificd as weak will be one out of
every hundred amorphous regions present.
'I he main features of ihis model, which is similar to Lloyd - I kVries model in many respcos, are:
101

j (1). Consists of alternating regions of crystalline and amorphous blocks.
(2). In loading, the tic molecules and, in particular, the taut tic molecules in almost every amorphous
region experience the stress.
(3). The stress experienced by the tie molecules in the weaker regions, where fewer tie chains are
available, is considerably higher.
(4). These weaker regions and sometimes the adjacent amorphous regions open up as microcracks due to
the rupture of the tie chains.
(5). All the tie chains in the weaker regions, their neighborhoods that open up as microcracks, and some
of the taut chains in other amorphous regions are ruptured on loading the specimen to failure.
(6). Macroscopic fracture occurs when accumulation of a large number of microcracks at a site produces a
large critical crack.
This model does not require the rupture of all the tie chains present as is the case with Lloyd -
I)cVrics model. Further, many more taut tie chains than ,.hose ruptured experience the stress. (It is not
possible to calculate this number presently.) '11ierefore, the discrepancy of a ratio of 5 between the
number of tie chains needed to obtain the stress-strain behavior based on L.loyd - DcVries model as
shown in Figure 45 and the number of tic chains ruptured can possibly explained.
The amorphous regions in the fibrous structure are strained commensurate with the modulus of the
amorphous blocks, when stresed. "The weak amnorphous regions, as mentioned above, will experience
large local strains. rherefore, all tihe tie chains in these regions will break and the amorphous region will
open up as a submicrocrack. 'Ie firmation of submicrocracks will cause redistribution of the applied
kad. The amorphous material in die immediate vicinity of the inicrocrack will be tinder higher stress
due to the redisiribution o load and the stress intensity concentration effect in front of'a crack tip. As a
result, some of the chains (particularly, the extended tie chains) in the neighborhood of the
submicrocracks are also ruptured. "Ile propagation of cracks in these neighboring regions will be to
102

some exten inhibited by presence of other crysuilline and strong amorphous blocks. The strong
intermolcular hydrogcn bonding betwccn fibrils and molecules of nylon 6 prevents any major slippage
of fibrils past each other. Therefore, every (almost) region will be under stress and some of the taut tie
molecules will be close to their breaking stress.
Within experimental error of observation, the stress-strain behavior of the fibers loaded to a stress
below the fracture stress is unchanged from the first cycle to the second cycle of loading. The modulus of
the fibers is believed to be governed by the taut chain molecules present. Therefore, a comparison of the
stress-strain behavior between the first and the second cycle suggests that the concentration of taut tie
chain molecules is practically unchanged in loading of fibers. The majority of the broken chains will be
formed in the weak regions and their vicinity. Only a very small fraction of the taut tie chains in all the
remaining amorphous regions are expected to break.
This is further verified from observations of no additional chain rupture during the second load
cycle. This follows from the consideration that all the weak regions, their neighborhoods, and the tie
molecules present in these regions and few of the taat tie chains in other amorphous blocks have been
ruptured in the first loading cycle. During the second cycle, these regions open up without any
additional chain rupture; some of the taut tie chains may be close to their breaking stress and a few may
break, but their number is very small. If the highest load in the second cycle is applied for a long time,
additional bond rupture due to breaking of taut tie chains or further propagation of the defects may be
seen. The breakage ora large nImber of taut tie chains will be expected to result in lower modulus.
Two halves of the broken fiber have the sanc fracture strength as the original fiber. It seems likely
that the breakage concentration of the tie chains of the order of 2 % or so of all the amorphous chain
segments does not weaken the polymier network decisively. Subsequent loading of the fiber does not
produce additional detectable chain scission (as observed from I.SR); but a small chain scission will be
cxpccted on the basis of the morphology of the fibrous structure. In fatigue where the damage
103

accumulates over a large nutiibcrorrepeatwd loadings, a dctinitive dccrew~e in die fracturc strength of the
fiber is observed.
104

-4 4
W _4
0
4o 04 Li44 04
10
440 1.041
aI.
10

Figure 43 :Fractional change in concentration vs.
0.2 Log 10 Cmolecular weight).
0.5
0 0
0 0
4)0
-0.32-3.9~ 4.4 4.9 5.4 5.9
Log10 (molecular weight)
Figure 44 Comparison of the cuzumulative tie chain distri-bution from Lloyd-DeVries model and theoreticalmodel.*
0.041 - Theoretical0 Lloyd-DeVries
modelo 0. 0:1
.4.
4)00.0
1 00.02
(U0
0.04 0.08 0.12 0.16 0.16
Log e L/Lo
106

SpibIS/CM2 (Xl012) STRAIN ()STRESS (KSI)SpINs/c113 (,X10 1 7)
-01)U-I.
U' cO 0
J-4
0' 0 ~ 0
0 L0
rH IVt
:00
-3 !I H
C
zI.
tySpINS/CM 3 (X,01 7) STRAIN (Z.) STRESS((KSI)FN a- 0l% oo 0 U
IV.
P4 0Ih I
0
W t"
0 0 W
I I0
IVI
t'z-
C 107

Appendix I - Calculation for P(N,r)
P(N,r) = {W(N - 1, r(m)) - W(N - 1), r'(m))}*a3
P(N,r)/a 3 =WN - l(xA-- 2md, y, z))- W(N- 1, (xA +1- 2md, y, z))
Let IP'(N,r = P(N,r)/a 3
Assuming that gaussian statistics arc appropriate for the description of tic chains in the amorphous
regions of the semi-crystalline polymer,
W(r) = {3/2n<r2>o} 3/2 * cxp { - 3r2/2 <r2>0}
where r2 = x2 +.y2 + z2
For a gaussian chain ofN - I units,
<r2>, = (N-1)a2
I"(N,r) = r3/2<2 exp{3((xA -- 2d)2 - y2 + z2)/2<r2>
M=C[x f It - 3A-X m)0
- exp {- 3((xA +A - 2rod) 2 + y2 + 2)/Xr2>oIj
Let RSQR = y2 + z2
P'(N,r) = {3/2rr2 >03/ 2 * cxp (- 3RSQR/2<i 2 >o)*
fIcxp I - 3((xA - 2,id) 2 +;2 + 4mndA- 2xAA)/ 2 (r2>o
- CxIp I - 3((x A - 21nd)2 +t2 + 4mdA+ 2xAk)/2<il>o}J
'l'hcni,
P'(N.r) = {3/2w<r 2 >0 13/ 2 * cxp {- 3RSQR/2<r2>o) * cxp (- 3,.2 /2<r 2 >)*
c + 3(%A" 211)2/20-2> o} * lexpf( 3/2)*2,(xA- 21nd)/<r2>o1
Jos

CXi- 3/2)*2(xA -211d)/<r2>,}] m)/r>
F(N~r) t3/2d) 2 /2 *ex (RS0})2<2
'exf 3xA- 3(21n d)2/2 3>0 * n 3xA-2i/r21
where C ={3/2 ,r~r2)0}31 2 exp ( -3(RSQR + 2 )/2(r2)0 )
Consider the summation
-ccE =+ P'(N,r)I,, 0 + I
Also consider
E expf- 3(xA -2nd) /2(r2>0} fA~A 2md)/<r 2> I
Changing die variablc in n,-
-AE cxp[- 3(xA + 211d) 2/2<r2>,) * sinh[3AMxA + 2nd)/(r 2>o}
= expl- 3(xA + 2md) 2/2(r2>.} * sinht 3X(xA + 2rnd)/(r 2>0}
Also, l"(N~r)Imo = 2 CcxpU RxA~f(O 2
P'(N,r) = 2 C (cxp (.3xA 2/2<r 2>.) *sinli (3AxA /<r2>.),
+ !cxp[- 3(xA - 2m1d) 2/2(r2)(1) * siflh{3A(xA - 2n)<2.M= I
- xp(- 3(xA + 2mid) 2/2<r 2>.) * sitih{3A(xA. + 21nd)/(r 2> 0)1
109

For tic molecules, XA = d - A
Thus, for tic molecules, the previous equation is
P'(N,r) = 2C [exp (- 3(d -X)2/2r 2 >.) * sinh (3A(d .?4/(3>o~)}
+E [expl- 3( -A+ (1 - 2m)d)2/2( 2>d) sinh{3Ak( - A+ (1 - 2m)d)/<r2>0 1
-expl- 3((l + 2m)d - A)2/2<r 2)0} - sinh(3A((1 + 2m)d -.\)/(r2>.)]
Considering the summation in above equation explicitly,
E exp f- 3(X+ d)2/2>o * sinh f - 3A(A+ d)/<r2>0}
-exp {- 3(3d .. 2/2<1.>Oj * sinh I 3X(3d -. )/(r 2>d)
+ exp f- 3(3d +A 2/2 2)0 * sinh I - 3A(d +W<r20 }
-exp {- 3(Sd -) 2/2<r 2>0} * sinh I 3A(Sd -)/(12>oI
..........................
In the summation the zeroth and first order terms are significant and others drop out very rapidly with
* increasing m. Thus, .o a first order approximation,
1P(N,r) = 2 C [fcxp (- 3(d . )2/~2 >d - sinh (3A(d -.%)/<r2 ,)1
+ cxp I-3(X + d)2/2(r2 01 *sinh {.3A(A + d)/(r2 >0 N
Or, P'(N,r) =2 1f3/2i%(r 2> 0)" cxp (-3(RSQlt +Ak2)/2(r 2)0 ) - [(cxp (-3(d -A)/2<r2>)
sinh (3A(d -A)/(r 2 )0)1 - exp [-3( A+ d)2/2(r 2 )0 }
sinh [ 3A(A+ d)/<r2>0 1
Also, substituting <rk 0 (N - 1)a2
INN,r) = Pr(N~r)a 3 -2 (3/2w(N -1)13/2 *cxp (-3(RSQR +A2)/2(N - I)a2)'
110

ffcxp (-3(d -A)2/2(N - l)a2) *sinh (3A(d -)/(N - I)a2)1
exp (- 3(A + d)2/2(N - I)a2l * sinh 1 3A(,\+ d)/(N - 1)a2H1
Taking logarithms,
log0P(N~r) = 1og 02 + 3/2 1ogc[3/21v(N - I)} - 3(RSQR +A)2(N - 1)a2)
+ log,, j{cxp (- 3(d -W12(N - 1)a 2) -sinh (3A(d A)/(N - 1)a2)1
.1 -exp f- 3( A + d)2/2(N - I)a21 sinh f 3A(A+ d)/(N - I)a 2jJ
Using A = 2a,
log,,P(N,r) =-0.4 158 - 1.5 log0 (N - 1) - 1.S(RSQR + 4a2)/(N - i)a2
+log,, [exp( - 3(d - 2a)2/2(N - 1)a2) * sinh (6(d - 2a)/(N - I)a)
cxp( - 3(d + 2J)2/2(N - 1)a2) *sinh (6(d +2a)/(N - 1)a)]

Appendix II -Calculation for X
Crystallinity = Z (fraction)
Length of crystalline block = Lc
Average length of de molecule =LA
Average length of loop or fold =Lf
Consider 1 gin. of the polymer. lien Z gin. is the weight ofcrystalline component.
Total number ofcrystalline chains per gram = N, say.
Then, Z = N*Lc*w (40)
where w is the weight of unit length (AO) of the polymer chain.
Amorphous Region:
LA*W*N*X + Lfw*N*(l-X) = I- Z
I.A*X + Lf- LfX = (- Z)/wN
From equation (40), wN = Z/LC
Thereforc, (LA .f)x = (I - Z)*LC/Z- Lf
i.e., X = {(1- ZXLc - Z l0 ,f)l/Z[.A- -0
Crysuallinity Z = 0.500
le = 60A
LA = 120 A0
Lf= q
112
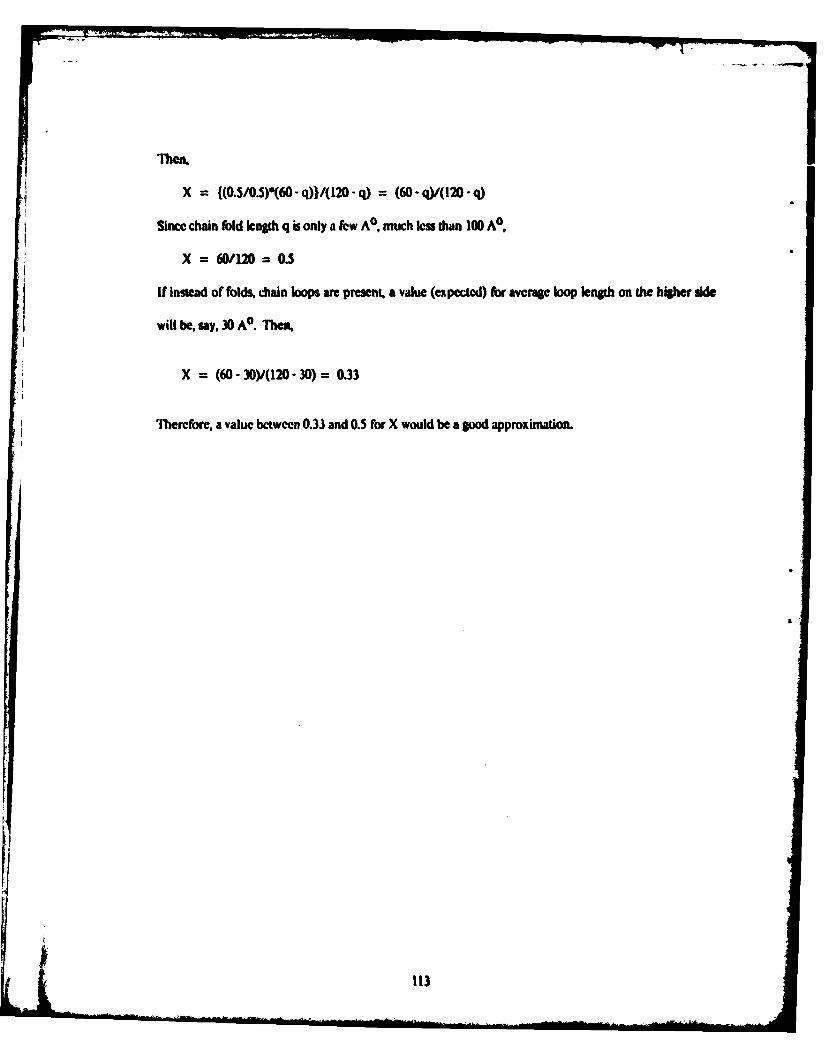
X = (O.S/0.S)"60 - Q))/(120 - ci) =(60 - ca)(120 - ci)
Since chain rold length q is only a few AO, much less thun 100 AO,
X = 60/120 = 0.5
If instead of folds, chain loops ame present, a value (expected) for average loop length on the higher side
will be, say, 30 A0. Then.
X = (60 -30Y/(120 -30) = 0.33
* I Therefore, a value between 0.33 and 0.5 for X would be a good approximation.
113

Appendix III - Calculation of Antorplous Components
Length of nylon 6 repeat unit = 8.64 AP
Mass of nylon 6 repeat unit = 113 n.molc
Therefore, mass of nylon 6 repeat unit per AP of Length
= 113/(8.646.02251023)
= 2.17 * I0"23 gmJAO
Crystallinity of nylon 6 (density measurement) = 50.0%
Therefore, mass of amorphous component per gram of nylon 6 specimen = 0.50 gin.
Clain Eql Contribution:
Number average molecular weight of nylon 6 = 30.000.
Number of chain ends per gin. of material = (2"6.023"1023)/30,000
= 4.02,1019"/t.
Tlie thickness of the amorphous region in nylon 6 has been determined experimentally as 30 A0 .
As an approximation, assume the average length for a loose chain in the amorphous region with chain
cnd (as shown in the figure below) to be 30 A0 .
Crystallite
Average length = 30 A0
Crystallite Ilf
Total mass due to chain cnds/gm. of nylon 6 = 4.02"1019"X02.17"10"23
= 2.62*10"2gm.gm. of nylon
Qhaiq J f1 Contribution:
114

From dimensions for the crystal structure (58, 59) of nylon 6, the average cross-section of a chain in
the crystalline region is
=19.1 A 02
Long period of nylon 6 specimen fiber = 90 AO
Number ofcrystallite chains/gm. of the material = 1/(19.1"90"10"2) = 5.S"1020/gm.
It takes two crystallite ends to form a tie molecule or chain loop (fold), but each chain has two ends.
Therefore, one crystallite chain forms a tie molecule or chain loop (fold).
Number of tie molecules and chain loops (folds)/gm. of nylon 6
- (Number of crystallite chains/gm. - (Number of chain ends/2))
= 5.8*1020 . 2.01*1019
= 5.6* 10 2 0 /gm. of nylon 6
Estimates (25, 28) for ratio of tie chains to crystallite units present have varied from 1/10 to 1/3 or
even 1/2 as in the calculation in Appendix I!. A value of 1/10 will be used, which might overestimate
contribution of chain loops (folds) to the amorphous region.
Number ofchain loops (folds)/gm. of nylon 6 = 5.6"1020"9/10 = 5.04*10 20 /gpn. of nylon 6.
The average length for a chain loop (fold) in an amorphous region of thickness 30 A0 may be taken
as, on a higher side, as 20 A (5A).
Thus, mass of chain loops (folds) per gim. of nylon 6
= (5.0"10 20 /gm. of nylon 6) 0 (2.17*10.23 gm./A ° ) * 20 A0 (or, 5 A° )
= 0.22 (0.055) gmgm./m of nylon
Thus a higher estimate for mass of chain loops (folds) will be 0.22 (0.055) im. per gm. of nylon 6
material.
J Corif f.ili1:

GPC analysis of nylon 6 specimen did not indicate presence of any low molecular weight additive or
any other species. The lowest molecular weight concentration seen in the main molecular wcight
distribution was about 2000. This, will be incorporated into the crystalline lamclla formed during
crystallization. Therefore, we do not expect any substantial contribution from cilia to the amorphous
region. In light of this observation and the lack or any other definite information in this regard, this
contribution will be assumed to be zero.
T Cbain Contribution:
Since the amorphous region consists of tie chains, cilia, chain loops (folds), and loose chain ends.
the contribution due to tie chains will be the difference between the amorphous material present and the
sum of contributions due to cilia, chain loops (folds) and chain ends.
lie chain contribution/gm. of nylon 6
= 0.500 - 0.22 - 0.0 - 0.026
= 0.254 gm./gm. of nylon 6
"Mus tie chains contribute substantially to the amorphous region.
On this basis, one can also estimate the average tie chain length, assuming a concentration for tie
molecules at 1010 20 per gin. of nylon 6 material.
Average tie chain length = (0.254 gm./gm. of nylon 6)*(AO/2.17*10 "23 gm.)*(gm. of nylon
6/1,1020)
= 117 A°
116

Appendix IV -GPC Calibration
GPC is a polymer fractionation technique which depends upon molecular size in solution. Very
large molecules will have sizes in solution greater than the size of the gel pores and will be confined to
solvent between the particles. The small molecules have access to solvent both inside and outside the
particles and will be retarded in their progress through a column.
From an analytical GPC fractionation one seeks information on molecular weight distribution
(cumulative and differential) as a function of molecular weight M. These normalized distributions are:
W(M) = dC(M)/dM = (dC(V)/dV)*(dV/d IogM)*(d logeWdM)
where dC(V)/dV = h(V) is the ordinate of chromatogram. For the calculation of W(M) one needs to
know the relationship
logM = RV) (41)
which is dependent on polymer type, its structure, and interaction with the solvent.
The calibration procedure consists of obtaining the relationship of equation (41) experimentally or
theoretically for various polymer and solvent combinations.
These calibration procedures can be divided into two major classes:
(1). Direct calibration: This procedure requires fractions of known molecular weight for the polymer
under analysis.
(2). Indirect calibration: "Ibis does not require narrow fractions of polymer under analysis, but needs a
relation between solute size in solution and molecular weight, assuming that molecular size in solution is
the controlling separation parameter.
I2ira Method: If fractions with M w/ARt ( 1.1 are available for the polymer under consideration,
then gel permeation chromatograms arc obtained for each of the fractions in a solvent for the given
117

system. From the chromatograms, eluion volume (the peak retention volume) for the different
molecular weight fractions are obtained and from a knowledge of the molecular weight of the
corresponding fraction, a plot of logeM against clution volume V is made. Generally, a linear plot for a
large-molecular-weight range described by the following equation is obtained:
logM = a- bV
This calibration plot can be used in conjunction with the gel permeation chromatogram of the unknown
polymer to find W(M)
Narrow calibration standards for polystyrene are the only ones available commercially. For other
polymers well-characterized, narrow molecular weight distribution fractions are exception rather than the
rule. Also, in the few cases where available, it does not cover a wide elution volume range.
Universal Calibration: Calibration curve (IogeM versus V) obtained from direct methods for narrow
molecular weight polystyrene samples cannot be expected to hold for other polymers, particularly it the
material under consideration is stncturally different.
It is therefore desirable to find a way of transforming a primary calibration curve (as obtained for
PS) in such a manner that it can be used with structurally different polymers. One such approach is
commonly known a 'Universal Calibration'. These methods are based on the assumption that GPC
separation is controlled by molecular size parameters that relate to the viscosity of dilute solution of these
polymers. The suggested parameters are hydrodynamic volume V. unperturbed radius of the molecule,
and size of the molecule in solution. 'llie cquations and parameters plotted are as in Table 8. These
calibration parameters differ only in their response to variations in solvent power.
The clution volume VC in GIC is directly proportional to these parameters. Thus, validity of these
different approaches can be confirmed by plotting MteM, [qJM/4(C), or <1 .2o>1n against elution volume
for a wide range of flexible, random coil polymers (linear or branched) in good solvents.Il
Ii!

At low molecular weights, the gaussian distribution of chain lengths as used in the above-mentioned
equations is not valid. Therefore, wide variation from these relations may be expected. One is generally
intersted in relative values for two polymers, so the deviations may not be as striking as they sound.
Using the universal calibration parameters, one obtains from different equations the following
expression (for a given solution volume):
loge { 1%Mp} = loge {InlI 5Mps}
or, loge IN ]Mp/ +p(e)} = loge {?'psMps/+ps(E)}
A molecular weight calibration for a polymer P can thus be established by using molecular weight
calibration for polystyrene, provided the dependence of [r% and []p on clution volume can be
established. If the intrinsic viscosity of each of the fractions separated by an analytical GPC from the
polymer being analyzed is determined with a viscometer, M can be obtained from the above equation.'pAlternatively, th,. equations in the table above can be combined with the Mark-Houwink equation:
[1] = KMa
to obtuin the following set of relationships:
(I). logeM p = {(l +1ps)/(l + %pl logeMps + {(log, Kps/Kp)/(1 +9)1
(2). ogeM p = {(1 +Mps)/(] + ) logeMps + f(logc Kps/K p)/(I +y)}
(3). logeMp = IogeM ps + loge {<1.2 0>/MIps{M/<l.2o>} p
'Thc relationships in Table 8 for calculating polymer molecular weight calibration curves from a basic
polystyrene calibration are valid in good solvents. Relations (1), (2) and (3) above are derived by
equaling [n]M, [riM/4c), or <12o>1/2 for two polymers at a given retention volume and combining with
Mark-tlouwink equation.
119

Mark-Houwink constants for certain polymer-solvent combinations are listed in the literature but
must be used with caution since many of the reported constants are only valid over a short molecular
weight range. Deviations at low and high molecular weight ends are particularly striking.
It has been generally observed that none of the universal calibration paramcters give valid
calibration predictions if the appropriate Mark-louwink exponent is less than about 0.65.
Enmirical Calibration: The calibration procedure used here is based on a linear relationship
between logl 0(molecular weight) and the elution volume V.
V = C1 -C2 logl 0(M) (42)
The constants C. and C2 in the linear calibration of equation (42) are obtained using a number and
weight average molecular weight of one broad molecular weight distribution of a standard nylon 6
specimen. The constants C. and C2 are determined in a manner described below, using an iteration
procedure on the computer.
From equation (42),
M = 10{(C1 - V)/C 2} = 10(C"C 2) * 10( V/C2)
Or, M = C*i0( - V/C2) (43)
where C 10(C1/C2)
Number average and weight average molecular weights Mn, Mw are, respectively,
11 = fw(i)/{gw(i)/M(i)j = W/Ew(i)/C*10(- V(i)/C 2)}
Mn = CW/{jw(i)* 0(V(i)/C2)} (44)
and W = w(i)
F w W = {1w(i)M(i)}/.w(i) = {Zw(i)'C*10('V(i)/C 2 )}/W
1W = (C/W)* Zw(i)* 10( V(i)/C 2)} (45)
lividing equation (45) by (44)
120

1~Iw/M n = {Ew(i)*10( "V(i)/C 2) 1 f w(i)*O(V(i)/C2)1/W 2 (46)
Define
A = M.w/mn- {t w(i)*10( -V(i)/C 2)l{E w(i)*10(V(i)/C 2 )}/W2 (47)1 1
According to equation (46), the C2 value that describes the calibration of equation (42) will make
'A' zero. This is achieved using an iterative procedure on the computer. 'Ihe outline for the procedure is
to choose a representative 'C2 ' value; 'A' is calculated according to equation (47). A new 'C 2' is chosen
depending upon the sign and the magnitude of 'A'. 'A' is calculated, compared and new less than a
certain minimum spccificd valuc is obtained. This 'C2' is the constant for the equation (42). Once 'C2' is
known, equation (44) or (45) can be used to obtain 'C'. Then,
C1 = C2 log 10C (48)
For the nylon 6 iber specimen die calibration.equation obtained according to this procedure for M w and
Mn of 69,760 and 30,200 is
Ve = 52.52 - 4.75 logl 0(M) (49)
Equation (49) has been used to calculate tie MWr)s of nylon 6 in this study.
121

0A4A0 . ,4
.0V
-CI
-4400
-e C,.,o
0 0
0 3.
,I
1221

Appendix V - Median Rank Plotting
Consider a parameter whose actual value is 'a'. Supposing N experimental measurements have
becn performed to estimate the parameter. These N measured values of the parameter will generally be
scattered around the actual value 'a' according to a gaussian distribution f(z), with a standard deviation
determined by the experimental error.
2i(z) = (I/ 21) 0 S*exp{ - ((z - a)/2U)2}
F(Zn) = f(z)dz Normal Probability Plot
F(Z n ) F(Z n )
f(z)
z -. z __ _ _ _ _ _ _ _ _
Figure A Figure B Figure C
Figures A and 11 are plots of function R(z) and the cumulative function F(z) on a linear plot. Figure C is a
plot of the cumulative finction F(z) on a normal probability function paper. "'lic characteristics of the
lattcr plot are such that if 11z) is gaussian, F(z) will be a straight line plot on the normal probability
function paper.
In an actual analysis a finite number of data points are available. The data are processed through
following steps to obtain tie median rank plot:
I. Rank the N measured data points z(i) in order of increasing magnitude, i.e., rank /(i) such that
...< . ..(2) < z(3) < ............ < 7(N)
123

2. F(z) axis: Assign F(w(i)) according to the following equation
F(z(i)) = (100/2N) + (100/N)*(i - 1)
fori = 1.2 ...... N.
For example, for N = 5
z F(z)
Z(1) 10
z(2) 30
z(3) 50
z(4) 70
z(5) 90
t-stafisticstet
The statistical test compares two similar experimentally measured parameters and gives a measure of the
probability that the two observed parameters have the same value.
t-statistics test starts with a hypothesis that the difference between the 'actual mean value', say U1
and U2 of two parameters under consideration is zero, i.e.,
Hlypothesis: Ho = U1 - U2 = 0
sample used to obtain these were to be infinitely large. Let x I and x2 be the observed means for the
finite sample. S(x I-x2) is the standard deviation for the sampling distribution of the differences between
the sample means:
S2(X. 'x2) = [(N 1 - I)SI 2 + (N2 - 1)S22 )/(N ! + N2 - 2)1 * [(N 1 + N2)/(NIN2)1
124

where S1. N1 and S2, N2 arc the stundard deviation and the size or each sample individually.
Next, tgivcn by the following equation is calculated.
= {(xI - x2)/S(Xl - x2)}
Having calculated ta.,a& is obtained from set of tables for t-statistics. The ' value so obtained gives a
probability of '2' that the hypothesis 110 can be rejected, Le., U1 = U2 . For example, an 'V' value of
0.03 implies that the probability of making an error in rejecting. the hypothesis U1 - U2 is 0.06. The
probability of that U1 = U2 is 0.94.
125

Appendix Vi -Viscosity of Nylon 6 in Dilute Solutions
Polyamides (PA) show polyclcctrolyte behavior in dilute solutions with many solvents (57. 72). A
possible mechanism for the formation of ions in 100% anhydious formic acid has been proposed (72):
-CONH- + HCOOH = = (-CONH 2-)+ +2oa + Coo-
Addition of water to formic acid suppresses such behavior and the mechanism proposed is that
water preferentially is able to take H + ions, thereby -CONH- remains neutral.
A similar electrolyte behavior has been observed for nylon 6 in hexafluoro iso-propanol (HFIP).
GPC analysis of nylon 6 in HFIP resulted in some very late elting distribution of molecules (beyond the
clution volume where all molecular weight components are expected to have eluted out). This indicates
another separation mechanism besides the size exclusion of polymer molecules. A rather likely
mechanism might be an ionic interaction between column material and the polymer molecules. It has
been suggested that addition of sodium trifluoroacetate salt in I-11-P to a concentration of 0.1 molar
suppresses the polyelectrolvte effect (73) and the polymer chain has a random chain configuration in
solution. The GPC analysis of nylon 6 in such a solution showed an expected molecular weight
distribution. Therefore, a 0.1 molar sodiuln trifluoroacetate solution in I iFIP has been used for all
subsequent GPC analysis. This mobile phase will be referred to as SI 11IP for future reference.
The hypothesis of a random coil configuration for nylon 6 in S-IIFIP has been checked by
measuring the viscosities of nylon 6 polymer solutions using Ubeholde capillary viscometer. Plots of
inherent viscosity (loge Tlr)/C and reduced viscosity rtsp/C against the concentration C of solution are
made for thrce different nylon 6 specimens in Figures 46 and 47. Frowm these plots the intrinsic viscosity,
the constants 'k 1and 'k2' for I lmggins and Kracmcr equations arc obtaincd as shown in Taible 9.
126

SSP[/C In) + k1[2C -HugginsEquation
()Ogeo,)/C =[rd - k2Hq2C -_Kraemer Equation
These determinations of intrinsic viscosity, constants k, and k2 arc also made for other solvents: (a)
0.1 molar sodium trifluoroacetate in tetra fluoro-ethanol 2, 2, 2 (S-TFE); (b) aqueous formic acid
containing 88 % formic acid. The results of these analyses arc shown in Figures 48 through 51. The k
and k2 values measured for nylon 6 in S-HFIP and S-TFE are not typical of a polymcr in good solution.
Therefore, nylon 6 does not have a random coil configuration in dilute solutions of S-HFIP and S-TFE.
Thic values of the constants k. and k2 in aqueous formic acid are of the order expected for a polymer in
good solvent, and k1 - k2 = 0.5 implies a random coil configuration for nylon 6 in this solvent.
It is possible that S-IIFIP and S-TFE will act as good solvents for nylon 6 if the concentration of
sodium trifluoroacetate were increased. This is not feasible due to the limited solubility of the salt in
I IFIP and TFE. The behavior of nylon 6 molecules in S-IFIP and S-TFE is neither of a random coil nor
of a polyclectrolyte (in which case the viscosity of polymer solution increases greatly at low
concentrations). Thus one can state that nylon 6 possibly has a rod-like chain configuration in S-tFIP
and S-TFE. It is believed that the observed molecular weight distribution will not be affected since the
calibration equationm is obtained by fitting the known number and weight average molecular weight of a
nylon 6 specimen to its MWD obtined from GPC analysis.
Another interesting aspect of viscosity results is he difference between kI and k2 for S-IIFIP and
S-IT'FE being consistently close to 0.6.
127

Figure 46 :Viscosity of nylon 6 fibers in dilute solutions.
1.65
1.550
00
1.45.
4 8 .12 16 xl-2gm./lOO ml.CONCENTRTIONl
Figure 47 :Viscosity of Allied nylon 6 / in dilute solution.0
1.65.
1.55-
*4 a 12 1.6 x10⁻² gm./100 ml.CONCENTRATIO01
128

c:040 -
-4 4J0 4 "1 0
.-4 4'-4
'-I
01.40 E-4
0-4 P z00
aN 00 41 0
0
0 q>44
-p4 14 0
0000
o o
0
*14 m
___ 129

00
01
1 .4so*t 40 C
4,4
j..400

in I
*1 1
00
0 -
0-
0s 0
I45010
41 0 v-4
404 It c
04
r"41
414
4131

1. Griffith, A. A., il. Trans. iuad 3.g A221, 163 (1920).
2. Smith, T. I-, Stedry, P. J., L AnWL JyL, 31, 11, 1892 (1%2).
2b. Smith, T. L, J AML EL. 35, 1, 27 (1964).
3. Bueche, F., Halpin, J. C., L AmD!. 30,1492 (1959).
4. Tobolsky, A., Eyring, H.,!. em Pys., 11, 125 (1943).
5. Coleman, B., J. PoWL. &L., 20,447 (1956).
6. Bucche, F., Halpin, J. C., L Auni. EII. 35,1. 36 (1964).
7. Zhurkov, S. N., JAL L Frcture. 1, 311 (1%5).
8. Hsiao, C. C., L ADA Ph , 30, 1 (1959).
9. Kausch, H. H., Hsiao, C. C., L AngL ebyx. 39,4915 (1968).
1O. Kausch, H. H. Polymer Frature. Springcr-Verlag. New York. 61 - 62. (1979).
11. Gotlib, Y. Y., DNbrodumov, A. V., Er'syashevich, A. M., Svetiov, Y. F. i a i i:5jIJj U 15. 555 (1973).
I a. Dobrodumov, A. V., E'syashevich, A. M.,.Sovie Physi- 5j" S=, 15, 6, 1259 (1973).
12. Roylance, 1). K., Ph. D. thess- unpublished. University of Utah (1968).
13. Stoeckel, T. M., Blasius, J., Crist, B., L Slk c& L.- L 16,485 (1978).
14. Kausch, H. II., Bccht, J., Rh I gii A= 9. 137 (1970).
15. Lloyd. B. A. Ph. D. thesis- unpublished, University of Utah (1972).
16. See reference 10, pp. 141 - 150.
17. Zhurkov, S. N., Vettcrgcn, V. I., Korsukov, V. F, Novak, I. I., Fractur, poper 4/47 (1%9).
I. Wool, R. P.,. L SAL. 13, 1795 (1975).
132

19. Roylance, D. K., DeVries, K. L., PolTcn &tts, 9,443 (1971).
20. Sce reference 10, pp. 148.
21. Nagamura, T., Fukitani, K., Takayanagi, M., L PLA.& ki: hYL 13, 1515 (1975).
22. M~Vrics, K. L., Lloyd, B. A., Williams. M. L., L. AMI, &2. 42,4633 (1971).
23. Klinkenbcrg. D., Ph. D. dissertation, Technischc Hlochshule Darmstadt (1978). Referred toin refcrence 10.
24a. Zakrevskii, V. A., Korsukov, Y. Y., Polymer Science USSR, 10, 1064 (1972).
24b. Zhurkov, S. N., Zakrevskii, V. A., Korsukov, V. E., Kuksenko, V. S., Soviet Phys. gjiSjae, 13, 7, 1680 (1972).
25. Peterlin, A., JL Mitjil ScL, 6,490 (1971).
26. Peterlin, A., Textile Rs& L 42, 20 (1972).
27. Yoon, D. Y., Flory, P. J., Polyer. 18, 509 (May 1977).
28. Petcrlin, A., L _qL L, A - 2, 7,1151 (1969).
29. Peterlin, A., L Microtnolecular &L B7, 705 (1973).
30. Pcterlin, A., InL L F tur. 11, 761 (1975).
31. Zhurkov, S. N., Kuksenko, V. S., n.L L Frcture, 11,629 (1975).
32. Kukscnko, V. S., Slutsker, A. I., L Macromnolecular &Li- hy.L, B12 (4).487 (1976).
33. Pcterlin, A.7 1o rne. I S&L., 18, 14,1062 (1978).
34. Sce refcrcnce 10, pp. 196 - 198.
35. Kausch, 1-. If., JL £owiL an Deformation, ld andW Fractur polmers, Cambridge,27.1. (April, 1979).
36. Godovskii, Y. K., Pipkov, V. S., Slutsker, A. ., Tomashevskil, E, E., Slonimskii, G. L.,Sovie Eby. -Jo" 5=t. 13, 8, 1919 (1972).
37. Van Krevclcn, I). W. I riic 2f Polyme Elscvicr Publishing Co. New York. pp. 72(1972).
!S
I.133
38. Toboisky, A., Eyring, H., ., C Phys., H, 125 (1943).
39. Vcrma, G. S. P., Peterlin, A., Polvinc Preprints, 10, 1051 (1969).
40. Bccht, V. J., Fischer, H., Kolloid l Z. ovmere 240, 766 (1970).
41. Park, J., Ph. D. thesis - unpublished, University of Utah (1972).
42a. Bresler, S. E., Zhurkov, S. N., Kasbckov, E. N., Saminskii, E. M., Tomashevskii, E. E.,Soviet I Phys.4, 321 (1959),
42b. Zhurkov, S. N., et al., Sovict P hvSoli State, 9, 986 (1965).
42c. Zhurkov, S. N., . L ract 1, 311, (1965).
42d. Zhurkov, S. N., Tomashevskii, E. E., Proc. Conf. _g th a is Pf Yield andEracture Oxford University Press, London, pp. 200 (1976).
43a. DeVries, K. L., Roylance, D. K., Williams, M. L., Presentation at the Sixth ICRPGmeeting, Pasadena, California.
43b. See reference 12.
44. See reference 10, pp. 156.
45. 7.akrcvskii, V. A., Baptizmanskii, V. V., Tomashevskii, E. E., Soviet Eb : Solid Stat, 10,6, 1341 (1968).
46. Zakrevskii, V. A., Korsukov, V. E., Polymer &Li. I=, 14, 1064 (1972).
47. See reference 12.
48. Zak revskii, V. A.. Tomashevskii, E. E., Baptizmanskii, V. V., Sove Ply.& Solid Ste. 9, 5,1118 (1967).
49. Koenig, J. L., A12licd Spersimon. 29,4,293 (1975).
50. DcVries, K. I.. (Private communication).
51. Mlory, P. J., Yoon, 1). Y., Naur, 272, 16, 226 (1978).
52. Kausch, 11. I!., i)Vries, K. L., .J , F r, 11,727 (1975).
53. I lofftman, J. D., 5 Transactions, 315 (October 1964).
134

54. Zachrnan, It. G., Pcwerli n, A., J~ Macrornolectilar Sci. - lal B3(3), 495 (1969).
5S. Chandrasekhar, S., _Rcv_, Mod. Phys., 15, 1, 1(1943).
56. Gaylord, R. J., Lohsc, D. J., L~ Ch~M Eby&. 65, 7, 2779 (1976).
57. Flory, P. J., Princinlcs gf Polvmcr Chcmistry, Cornell University Press, Ithaca, New York,(1953).
58. Prevorsek, D. C., Hlarget, P. J., Shrmia, R. K., Reimnschussel, A. C., L. Macrornolecular 'j.* - Phys., B38(1 - 2), 127 (1973).
59. Prcvorsek, D. C., Kwon, Y. D., Sharma, R. K. J. Material &cf, 12, 2310, (1977).
60. Chapiro, A., Discussion in the paper - Peterlin, A., F= 22nd Noibcl Symposium Sweden,pp. 235 (June, 1972).
61. Sec reference 50.
62. Clernents, J., Jakeway, R., Ward, I. M., Polymer, 19, 63,9 9(1978).
63. Clcencnts, J., Jakeway, R., Ward, 1. M., Longman, W., Polymer 20, 295 (1979).
64. Gibson, A. G., Davies, G. R., Ward, 1. M., Polymer, 19, 683 (1978).
65. Peterlin, A., LEL.sILS&iL A -2,7,1151 (199).
66. Buckley, C. P., Gray, R. W., McCrum, N. G., L P IL, B, 7, 835 (1969).
67. Fischer, E3. W., Godder, H., Piesczeh, W., L EPxA LL C, 32, 149 (1971).
68. Nagou, S., Azumna, K., JL Micronocuar Si.: Pbhy&, B16 (3), 435(1979).
69. Perkins, W. G., Porter, R. S., L. Material Sc. 12, 2355 (1977).
70.T'Iakayanigi, M., Imada, K., Kajiyama, 1'.. L Poly. 'S i C, 15, 263 (1966).
71. Bccht, J., DeVrics, K. L., Kiusch, 1-1. H., FiQ romcan Ei1hinerL,. 7, 105 (197 1).
72. Schaefgcn, J. R., Trivisonno, C. F., L Ain. £:h=m. , 73, 4580 (1951); 74, 2715 (1952).
73. Eckniannis, J., Waters Associates, Medford, Mass. (Private communication).
135