Embed Size (px)
Citation preview

Revised 05/22/2017
2016-2017 Community Based Accountability Measures
I. Fine Arts
Performance
Measure Not Applicable Unacceptable Acceptable Recognized Exemplary
1 Participation of students in fine art
courses, classes.
Less than 40% of students are enrolled in Fine Arts
courses / classes.
41% to 49% of students are enrolled in Fine Arts
courses / classes.
50 to 59% of students enrolled in Fine Arts courses
/ classes.
60% or more of students enrolled in Fine Arts
courses / classes.
2 Percent of students continuing Fine Arts
compared to preceding year.
Less than 50 % of
students are continuing Fine Arts
51% -70 % of students are continuing Fine Arts
71%-80% of students are continuing Fine Arts
Greater than 81 % of students are continuing
Fine Arts
3 Fine Arts UIL or comparable Competition Participation
Less than 5% of participating Fine Arts
students involved in UIL or like competitions.
6 to 10% of participating Fine Arts students
involved in UIL or like competitions.
11 to 15% of participating Fine Arts students involved in UIL or like competitions.
16 to 20% of participating Fine Arts students involved in UIL or like competitions.
4 Fine Arts UIL or comparable
Competition Outcome
Did not participate in UIL Fine Arts Competition
6 or more students earned district
acknowledgement
4 or more students earned regional acknowledgement
2 or more students qualified for state
5 Exhibition /
Performance opportunities
Less than the acceptable number of opportunities
Primary - 5 Elementary - 7
Middle School - 8 High School - 12
opportunities
Primary - 10 Elementary - 14
Middle School - 16 High School 24 opportunities
Primary - 15 Elementary - 21 Middle School
- 24 High School 36 opportunities
6 Opportunities to participate in special events
Ex: cultural development, field trips, guest speakers,
artists, , musicians
Less than the acceptable number of opportunities
3 opportunities 4 opportunities 5 opportunities
7
PERCENT OF STUDENTS CONTINUING FINE
ARTS FROM GRADES 7-8
Less than 50 % of students are continuing
Fine Arts
51% -70 % of students are continuing Fine Arts
71%-80% of students are continuing Fine Arts
Greater than 81 % of students are continuing
Fine Arts
Page 1-MS 2016-2017

Historically, the five main Fine Arts were painting, sculpture, architecture, music and poetry, with performing arts including theatre and dance. Today, the fine arts commonly include additional forms, such as film, photography, conceptual art, and printmaking.
Fine Arts
1. Participation of students in fine art courses, classes. 58.69%
Beginner Band - 58, 7th Grade Band 28, 8th Grade Band - 36, Total = 122 REDUCTION OF 9 FROM THE END OF LAST YEAR
6th Grade Choir - 0, 7th Grade Choir 12, 8th Grade Choir 16, Total = 28 INCREASE OF 8 STUDENTS FROM THE END OF LAST YEAR
6th Grade Piano 14, 7th Grade Piano 0, 8th Grade Piano, Total = 14 REDUCTION OF 1 STUDENT FROM END OF LAST YEAR
6th Grade Art 98, 7th Grade Art 51, 8th Grade Art 40, Total = 189 INCREASE OF 30 STUDENTS FROM END OF LAST YEAR
News Crew = 18
Yearbook = 7
Total Fine Arts Participants = 378
2. Percent of students continuing Fine Arts compared to preceding year. 83.6
3. Fine Arts UIL or comparable Competition Participation. 45.3
4. Fine Arts UIL or comparable Competition Outcome.
Choir - 28 1st division medals (solo & ensemble); 5 students placed in All-Region Choir Choir - 7 students earned Superior at Solo & Ensemble Contest Choir - 4 students were recognized as overall Outstanding Soloists at UIL All 27 Choir students participated in the UIL Choral Contest 7th and 8th Grade Choir earned straight 1s (Superior) for performance at UIL
Page 2-MS 2016-2017
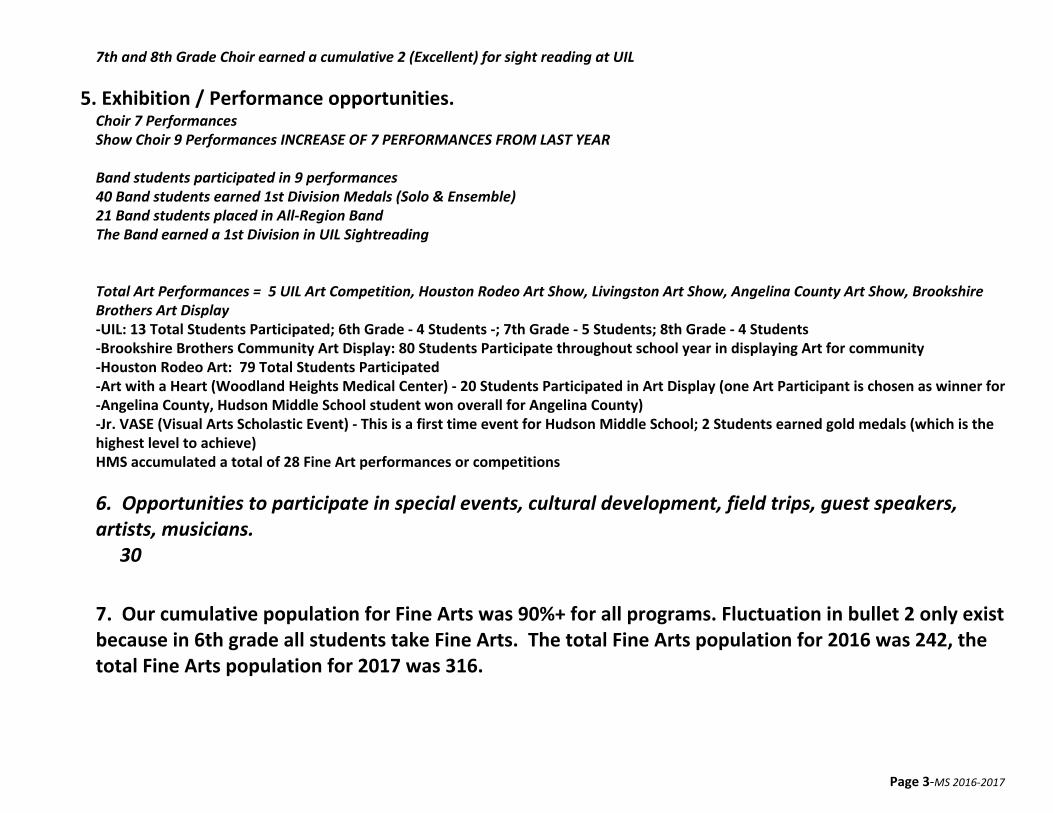
7th and 8th Grade Choir earned a cumulative 2 (Excellent) for sight reading at UIL
5. Exhibition / Performance opportunities.
Choir 7 Performances Show Choir 9 Performances INCREASE OF 7 PERFORMANCES FROM LAST YEAR
Band students participated in 9 performances 40 Band students earned 1st Division Medals (Solo & Ensemble) 21 Band students placed in All-Region Band The Band earned a 1st Division in UIL Sightreading
Total Art Performances = 5 UIL Art Competition, Houston Rodeo Art Show, Livingston Art Show, Angelina County Art Show, Brookshire Brothers Art Display -UIL: 13 Total Students Participated; 6th Grade - 4 Students -; 7th Grade - 5 Students; 8th Grade - 4 Students -Brookshire Brothers Community Art Display: 80 Students Participate throughout school year in displaying Art for community -Houston Rodeo Art: 79 Total Students Participated -Art with a Heart (Woodland Heights Medical Center) - 20 Students Participated in Art Display (one Art Participant is chosen as winner for -Angelina County, Hudson Middle School student won overall for Angelina County) -Jr. VASE (Visual Arts Scholastic Event) - This is a first time event for Hudson Middle School; 2 Students earned gold medals (which is the highest level to achieve) HMS accumulated a total of 28 Fine Art performances or competitions
6. Opportunities to participate in special events, cultural development, field trips, guest speakers, artists, musicians. 30
7. Our cumulative population for Fine Arts was 90%+ for all programs. Fluctuation in bullet 2 only exist because in 6th grade all students take Fine Arts. The total Fine Arts population for 2016 was 242, the total Fine Arts population for 2017 was 316.
Page 3-MS 2016-2017
II. Wellness and Physical Education
Performance Measure
Not Applicable Unacceptable Acceptable Recognized Exemplary
1 PE students participating in fitness programs on
campus (any course earning PE credit)
<50% of students
participate <50-70% of students
participate 70-90% of students
participate 90-100% of participate
2
Character education is offered to students
<50% of students
participate <50-70% of students
participate 70-90% of students
participate 90-100% students
participate
3
Students have access to exercise opportunities
other than the required PE
Campus rarely provides additional opportunities
Campus occasionally provides opportunities
Campus generally provides opportunities
Campus consistently provides opportunities
4
Campus offers opportunities to promote
healthy choices Rarely Occasionally
Generally Somewhat Planned
Consistently Throughout the year
Page 4-MS 2016-2017

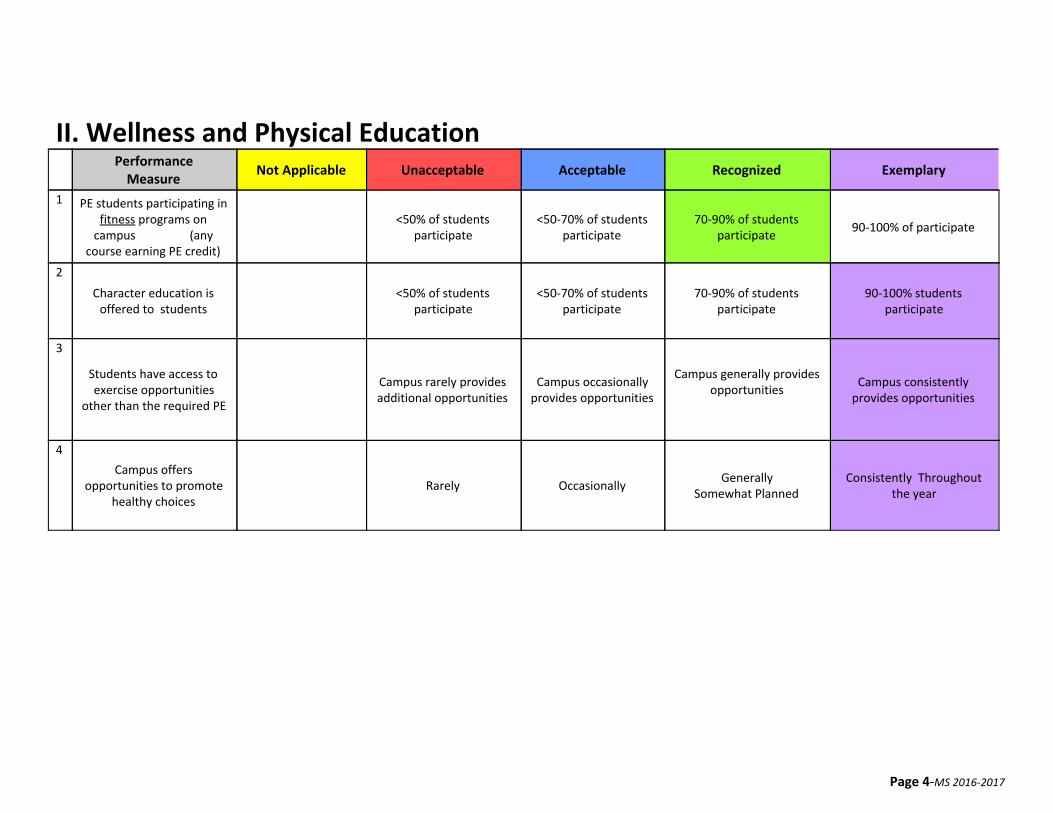
Wellness and Physical Education
1. PE students participating in fitness programs on campus (any course earning PE credit) 77% In PE/Athletics
2. Character education is offered to students 100% of HMS students are exposed to guidance lessons presented by Mrs. Peterson, Mrs. Rollins and all PE teachers. Seventh grade technology students have lessons from Covey’s 7 Habits of Highly Effective Teens.
3. Students have access to exercise opportunities other than the required PE. HMS selected (generally). ● Youth Cross Country Program
● 3 Different Fun Run Activities
● Open Gym / Fall
● Youth Basketball
● Youth Baseball/Softball
● Cheer Team - Competition Base Camp
● Dance Team - Competition Base Camp
● Tennis, Basketball, Soccer - Summer Sports Camps
● Youth Track Meet
● Middle School Cross Country teams - Optional summer practices with high school teams
● Offering Softball Camp - ages 6-14
4. Campus offers opportunities to promote healthy choices. HMS selected (consistently). ● Hudson Gets Fit Health Fair
● Health Matters
● Vision Screening
● Hearing Screening
● Scoliosis Screening
● Commit for Life blood donation
Page 5-MS 2016-2017
● My Pac School Based Clinic
● School Physicals
● Heart Awareness through CHI St. Lukes
● ADAC Presentation / Survey - Towards No Tobacco Unit
● Tobacco Survey by Texas Department of Health
● Worth the Wait Sex Ed Program
● 7th Grade Immunization Shot Clinic
● Jump Rope For Heart
● 6th, 7th, and 8th Grade Field Day
● Say What Group
● Say What Group off Campus Activities
● Purchased P.E. Uniforms for all P.E. students - teaching responsibility
Page 6-MS 2016-2017
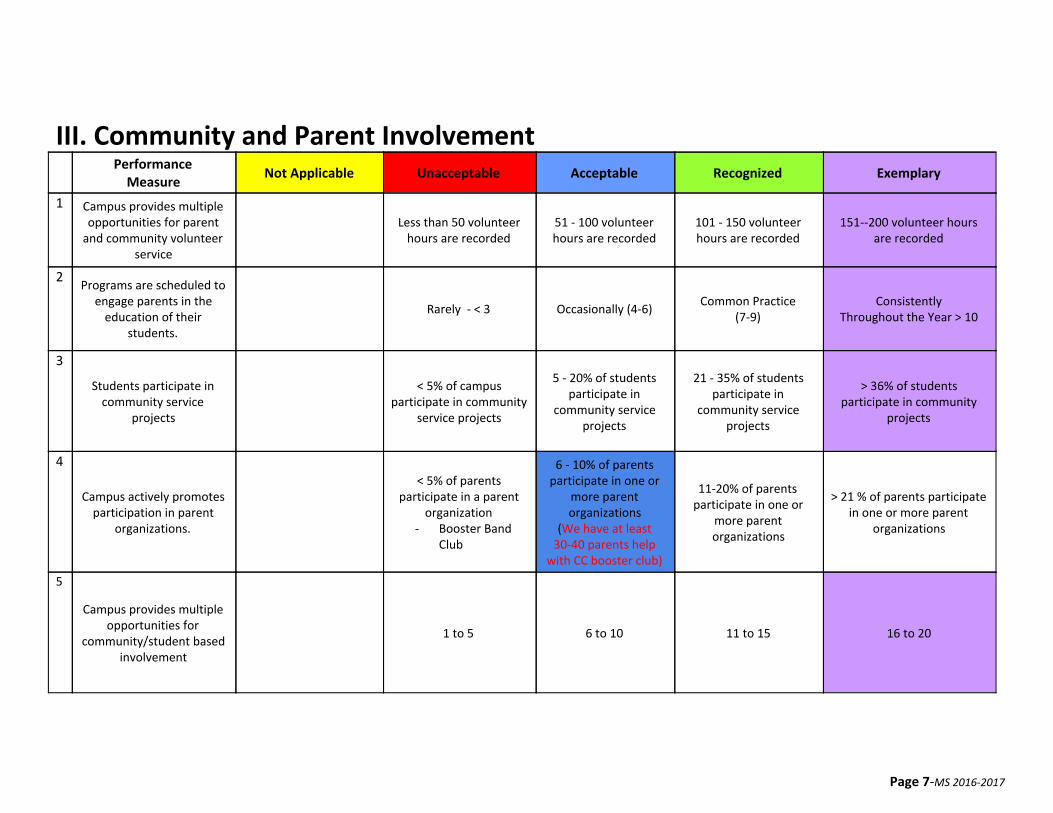
III. Community and Parent Involvement
Performance Measure
Not Applicable Unacceptable Acceptable Recognized Exemplary
1 Campus provides multiple opportunities for parent
and community volunteer service
Less than 50 volunteer
hours are recorded 51 - 100 volunteer hours are recorded
101 - 150 volunteer hours are recorded
151--200 volunteer hours are recorded
2 Programs are scheduled to
engage parents in the education of their
students.
Rarely - < 3 Occasionally (4-6) Common Practice
(7-9) Consistently
Throughout the Year > 10
3
Students participate in community service
projects
< 5% of campus participate in community
service projects
5 - 20% of students participate in
community service projects
21 - 35% of students participate in
community service projects
> 36% of students participate in community
projects
4
Campus actively promotes participation in parent
organizations.
< 5% of parents participate in a parent
organization - Booster Band
Club
6 - 10% of parents participate in one or
more parent organizations
(We have at least 30-40 parents help
with CC booster club)
11-20% of parents participate in one or
more parent organizations
> 21 % of parents participate in one or more parent
organizations
5
Campus provides multiple opportunities for
community/student based involvement
1 to 5 6 to 10 11 to 15 16 to 20
Page 7-MS 2016-2017

Community and Parent Involvement
1. Campus provides multiple opportunities for parent and community volunteer service.
Total Hours = ● Junior Achievement, Reeder = 42 hrs, 6 Volunteers, Cox = 32 hrs, 6 Volunteers ● Career Mentoring = 59 Hours 13 Career Mentors ● Heart Awareness / Memorial Health = 20 ● ADAC = 10 ● CHI = 10 ● Campus Fundraiser Field Day = 84 ● Special Olympics = ● Junior Achievement Career Day = 80 hours ● Texas Virtual College Fair = ● Virtual Career Sessions = 8 ● Career Guest Speakers = 10 ● Art Club Field Trip - ? ● Art Club Fundraisers ? ● Book Fair =
2. Programs are scheduled to engage parents in the education of their students. ● 6th Grade Orientation ● Report Card Night ● Three ESL Parent Breakfasts x 3 ● ESL Rewards Trip ● 6, 7, 8th Grade Awards Ceremony ● Band Parent Night ● Pep Rallies ● 5th Grade End of Year Tour ● AVID Parent Meeting for Dual Credit, STEP & Associates Degree Path ● Hydroponics Program
Page 8-MS 2016-2017
● 6th Grade Holocaust Project ● Veteran’s Day Program ● Band/Parent Night ● Band Meeting (8th Grade Parents Only) ● Hudson Gets Healthy Night ● Virtual Learning Guest Speaker ● Parent/Volunteer Form
3. Students participate in community service projects. Cumulative HMS student service volunteers
90+%, before considering for multiple participation opportunities. Meaning the vast majority of the
HMS student population make service related activities a priority. ● Hudson Helps = 45 students, 675 volunteer hours Hudson Helps Hours Logged ● Special Olympics = 35 ● CIA = 60 to 70 Students attended one day a week (began in September) ● Art Club = 38 ● Alley Cat Recycle = 25 ● Christmas Shoe Giveaway = 422 ● AVID Mentorship Program = 54 Students mentoring peers of lower grade levels. . ● BAND MARCHING IN LUFKIN CHRISTMAS PARADE
4. Campus actively promotes participation in parent organizations
● Parent/Community Volunteer 47 = Hours for HMS (278.5 hours)
Page 9-MS 2016-2017

5. Campus provides multiple opportunities for community/student based involvement opportunities. HMS has 24 documented community/student based involvement opportunities. Link to Hudson Helps Service Organization
● Special Olympics Bowling ● Zoo Boo ● Hudson Gets Healthy ● Peavy ESL Night ● CISC(Christian Information Service Center) ● CASA Tour of Home ● Santa’s Workshop - Lufkin State Supported Living Center ● Harold’s House - Angelina Alliance ● Salvation Army ● Buckner Family & Children's Services ● Kurth Animal Shelter ● Alley Cat Recycling Pick Up
● Art Club - United Way fundraiser ($350.00 raised) ● 2 Canned Food Drive ● Coke Tabs for Ronald McDonald House ● Toy Drive ● Christmas Shoe Giveaway ● Christmas Food Drive ● Special Olympics ● 6th Grade Orientation ● Report Card Night ● 3 x ESL Parent Breakfast ● ESL-Read 180 Reward Party ● 6th, 7th, & 8th Grade Awards Assembly ● Band Parent Night ● Pep Rallies ● Academic Pep Rally / fire HD 8 Give-away ● Angelina County Science and Tech Fair Real World Relevancy Essay Contests (VFW Patriot Pen and Daughters of American
Revolution) ● 6th Grade Projects - Parents visiting to view projects
Page 10-MS 2016-2017
● Booster Clubs
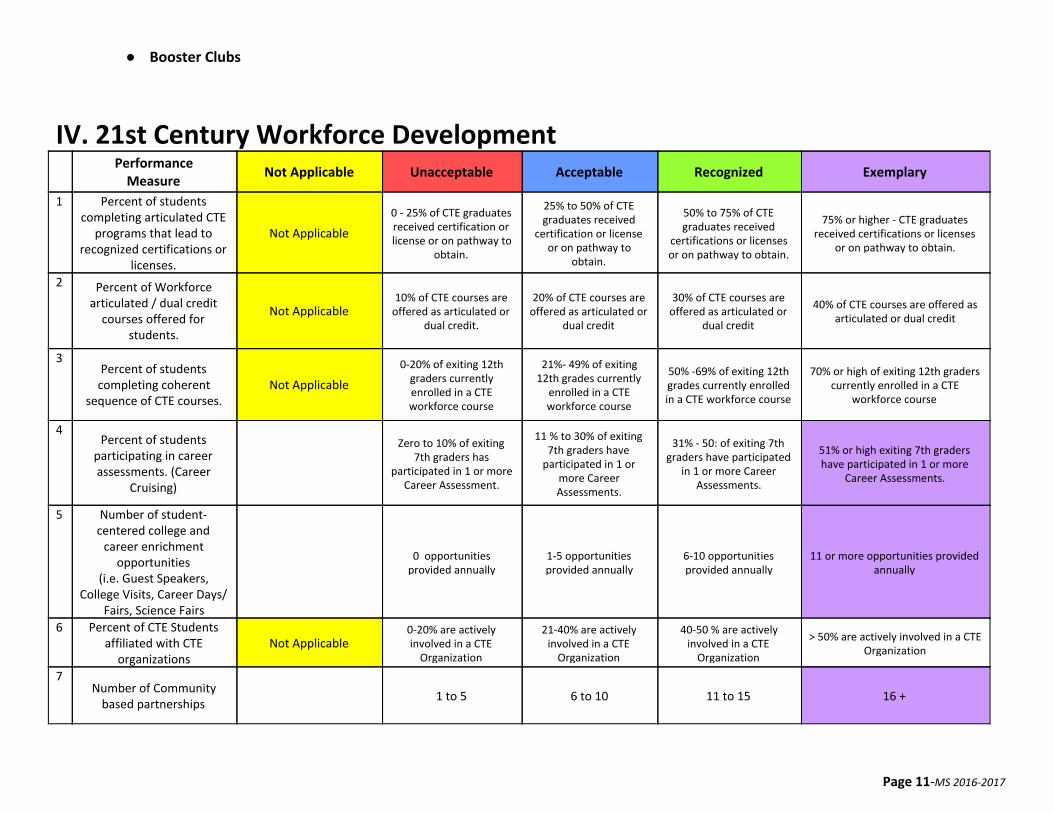
IV. 21st Century Workforce Development
Performance Measure
Not Applicable Unacceptable Acceptable Recognized Exemplary
1 Percent of students completing articulated CTE
programs that lead to recognized certifications or
licenses.
Not Applicable
0 - 25% of CTE graduates received certification or license or on pathway to
obtain.
25% to 50% of CTE graduates received
certification or license or on pathway to
obtain.
50% to 75% of CTE graduates received
certifications or licenses or on pathway to obtain.
75% or higher - CTE graduates received certifications or licenses
or on pathway to obtain.
2 Percent of Workforce articulated / dual credit
courses offered for students.
Not Applicable 10% of CTE courses are
offered as articulated or dual credit.
20% of CTE courses are offered as articulated or
dual credit
30% of CTE courses are offered as articulated or
dual credit
40% of CTE courses are offered as articulated or dual credit
3 Percent of students completing coherent
sequence of CTE courses. Not Applicable
0-20% of exiting 12th graders currently enrolled in a CTE workforce course
21%- 49% of exiting 12th grades currently
enrolled in a CTE workforce course
50% -69% of exiting 12th grades currently enrolled in a CTE workforce course
70% or high of exiting 12th graders currently enrolled in a CTE
workforce course
4 Percent of students
participating in career assessments. (Career
Cruising)
Zero to 10% of exiting 7th graders has
participated in 1 or more Career Assessment.
11 % to 30% of exiting 7th graders have
participated in 1 or more Career Assessments.
31% - 50: of exiting 7th graders have participated
in 1 or more Career Assessments.
51% or high exiting 7th graders have participated in 1 or more
Career Assessments.
5 Number of student- centered college and
career enrichment opportunities
(i.e. Guest Speakers, College Visits, Career Days/
Fairs, Science Fairs
0 opportunities
provided annually 1-5 opportunities provided annually
6-10 opportunities provided annually
11 or more opportunities provided annually
6 Percent of CTE Students affiliated with CTE
organizations Not Applicable
0-20% are actively involved in a CTE
Organization
21-40% are actively involved in a CTE
Organization
40-50 % are actively involved in a CTE
Organization
> 50% are actively involved in a CTE Organization
7 Number of Community
based partnerships 1 to 5 6 to 10 11 to 15 16 +
Page 11-MS 2016-2017

21st Century WorkForce Development
1. Percent of students completing articulated CTE programs that lead to recognized certifications or licenses. N/A
a. Microsoft Certifications? (possible through Principles of Information Technology curriculum)
2. Percent of Workforce articulated / dual credit courses offered for students. 43%
a. Principles of Information Technology 26
b. Art I and Art 2 7
c. Concepts of Engineering and Science 26
d. Algebra 1 46
e. Biology 19
f. Spanish 1 & 2 (by test)
3. Percent of students completing coherent sequence of CTE courses. N/A
4. Percent of students participating in career assessments. Mrs. Rollins provided Career guidance to 100% of the 7th grade student population.
● ● Creates an ID for each student ● Inventory Assessment ● Research on Careers and Colleges ● Students must complete a College research exercise ● Students are provided a list of possible careers and what those careers entail. ● Then the students complete an interest inventory as well as an assessment on their personal learning style. ● Students explore Naviance video interviews of professionals in careers of interest.
Page 12-MS 2016-2017
5. Number of student- centered college and career enrichment opportunities (i.e. Guest Speakers, College Visits, Career Days/ Fairs, Science Fairs). HMS had a total of 15 College / Career enrichment opportunities and 36 Junior Achievement mentoring sessions related to career readiness as well as additional Junior. Achievement related AVID.
● 4 Career Mentoring Days ● Junior Achievement, Reeder = 6 = 27 Hours ● Junior Achievement, AVID = 36 Hours ● Career Day = 1 ● Science Fair = 1 ● Robotics Competitions = 2 ● Robotics Educational Mentorship = 1 ● College Field Trip = 2 Stephen F Austin State University and Baylor University ● College Virtual Field Trip = 25 total Guided Information trips ● Girls Smart Trip to SFA = 1 ● AVID Guest Speakers = 3 ● AVID College Path Parent Information Night = 2 ● Junior Achievement Career Day - 1 Day - 48 group sessions
6. Percent of CTE Students affiliated with CTE organizations. N/A
7. Number of Community based partnerships. HMS has 24 businesses/education partners. ● Lockheed Martin ● Brookshire Brothers ● Marco’s Pizza ● Angelina County Extension ● First Bank and Trust ● Hudson City Hall ● Buckner Place ● District Judge ● General Electric ● Pinkerton Creative Web Designs ● US Forest Service ● Texas Forest Service ● Sams ● DPS
Page 13-MS 2016-2017
● Shoe Carnival ● ADAC ● Junior Achievement ● Angelina Arts Alliance ● Hudson High School Culinary Department ● Simple Simon’s Pizza ● Broaddus ISD ● Cracker Barrel ● Taco Casa ● Morales’ Cafe
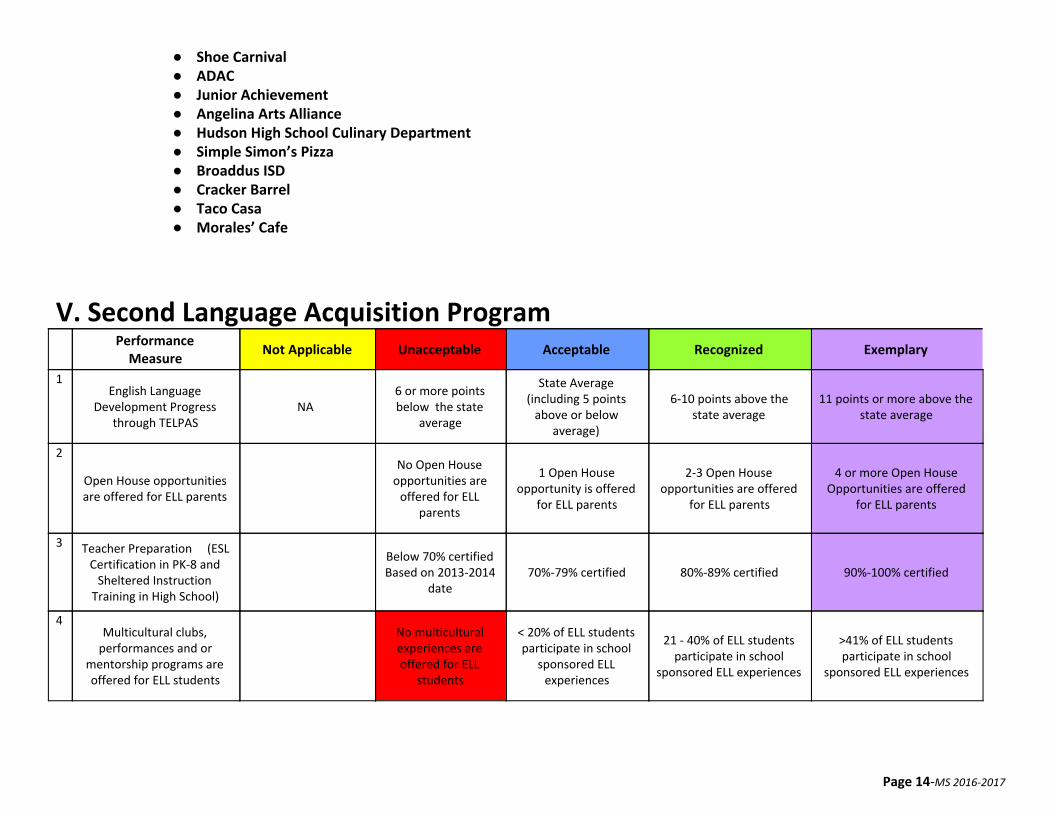
V. Second Language Acquisition Program
Performance Measure
Not Applicable Unacceptable Acceptable Recognized Exemplary
1 English Language
Development Progress through TELPAS
NA 6 or more points below the state
average
State Average (including 5 points
above or below average)
6-10 points above the state average
11 points or more above the state average
2
Open House opportunities are offered for ELL parents
No Open House opportunities are
offered for ELL parents
1 Open House opportunity is offered
for ELL parents
2-3 Open House opportunities are offered
for ELL parents
4 or more Open House Opportunities are offered
for ELL parents
3 Teacher Preparation (ESL Certification in PK-8 and
Sheltered Instruction Training in High School)
Below 70% certified Based on 2013-2014
date 70%-79% certified 80%-89% certified 90%-100% certified
4 Multicultural clubs,
performances and or mentorship programs are offered for ELL students
No multicultural experiences are offered for ELL
students
< 20% of ELL students participate in school
sponsored ELL experiences
21 - 40% of ELL students participate in school
sponsored ELL experiences
>41% of ELL students participate in school
sponsored ELL experiences
Page 14-MS 2016-2017
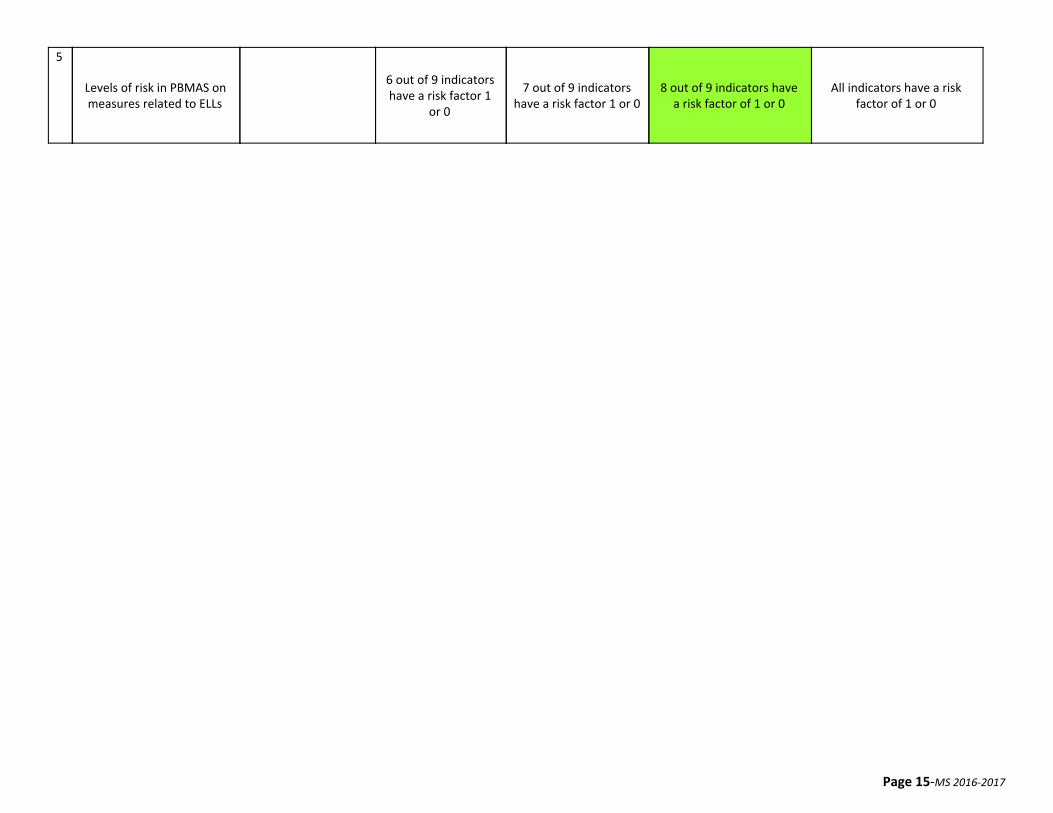
5
Levels of risk in PBMAS on measures related to ELLs
6 out of 9 indicators have a risk factor 1
or 0
7 out of 9 indicators have a risk factor 1 or 0
8 out of 9 indicators have a risk factor of 1 or 0
All indicators have a risk factor of 1 or 0
Page 15-MS 2016-2017
Page 16-MS 2016-2017
Page 17-MS 2016-2017
Page 18-MS 2016-2017

Page 19-MS 2016-2017
Page 20-MS 2016-2017

Second Language Acquisition Program
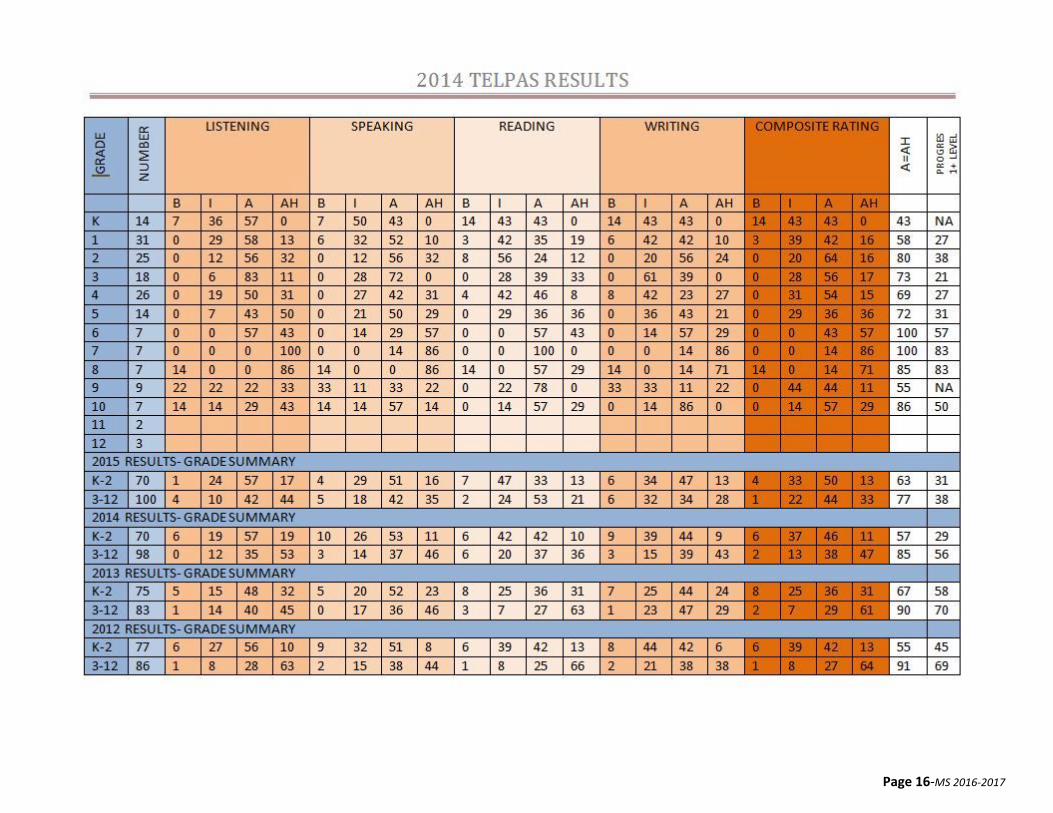
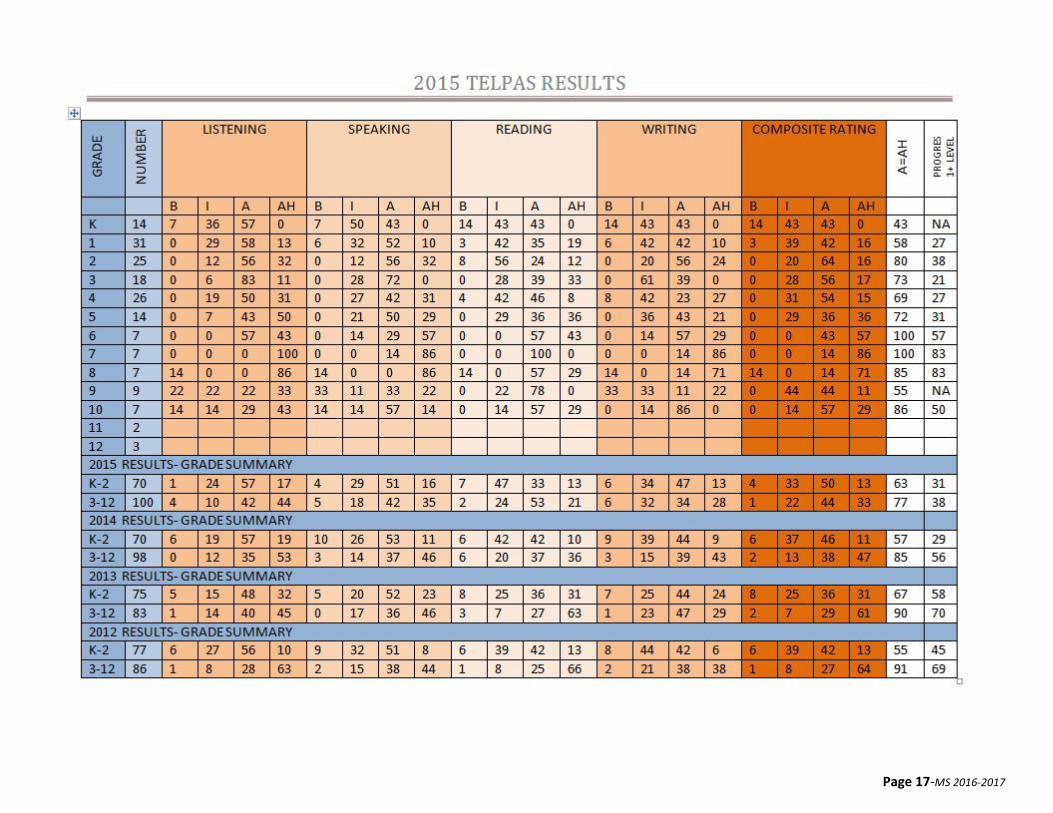
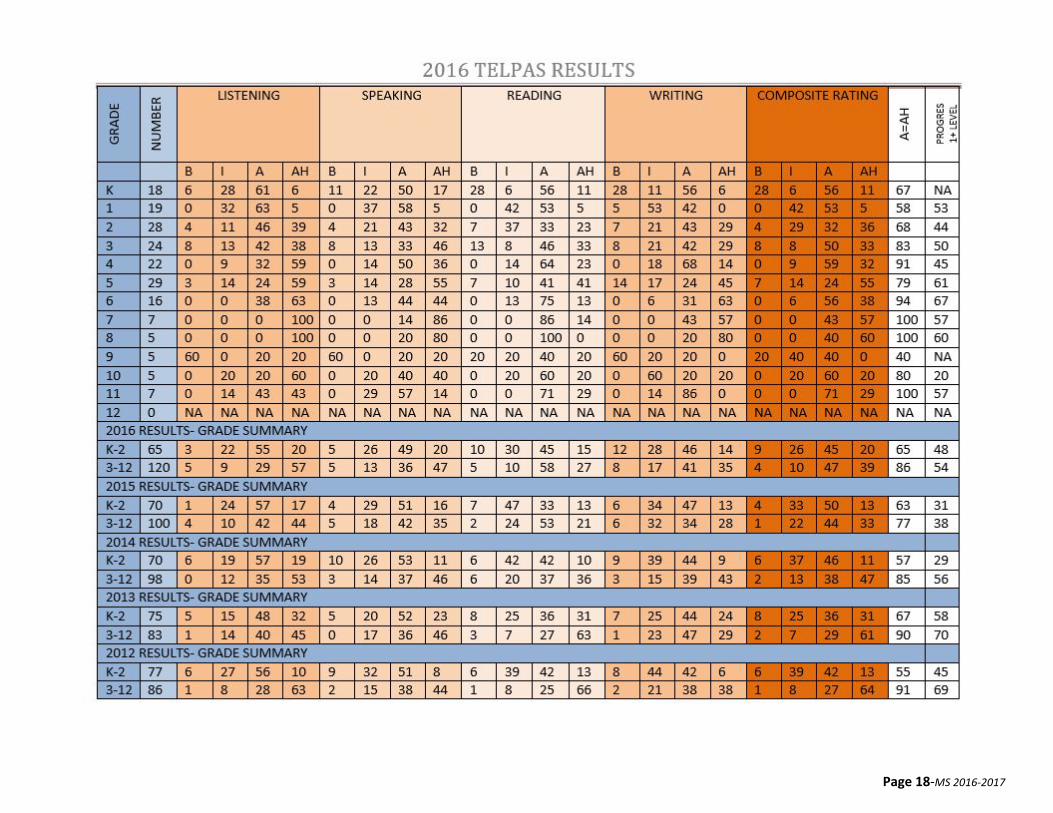
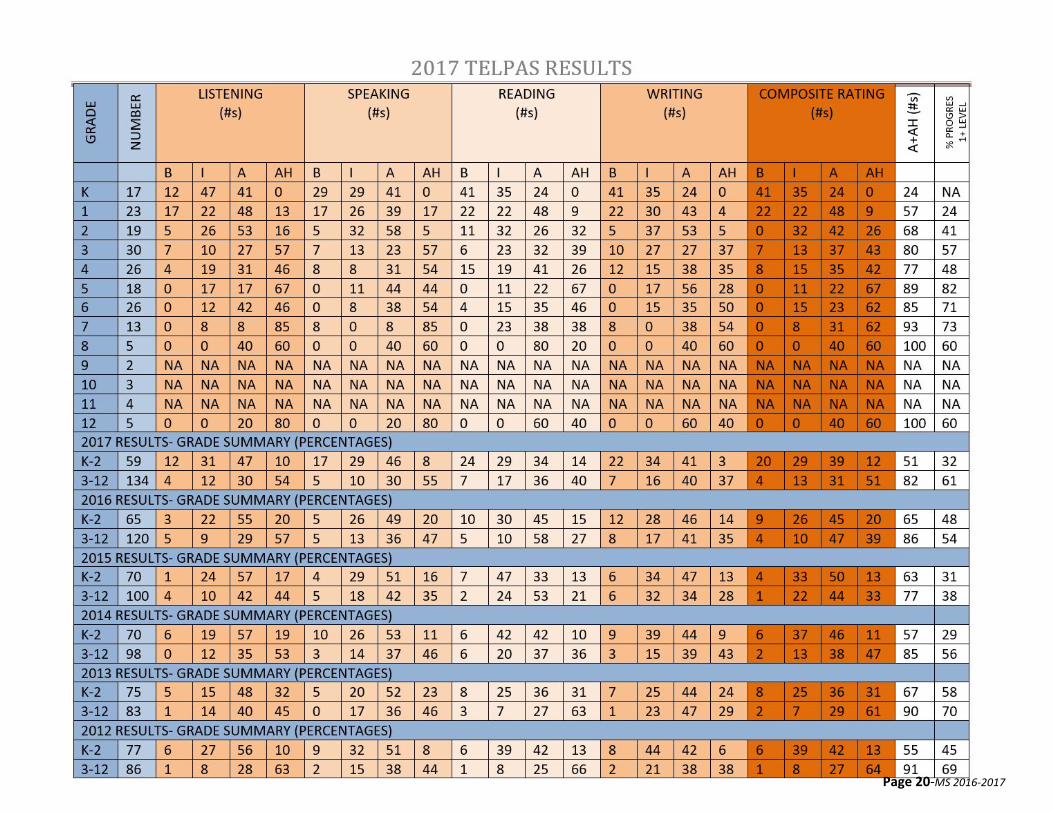
1. English Language Development Progress through TELPAS.
2013 State 66.3% HMS 96.29%,
2014 State 79.16 HMS 95%
2015 State 98% HMS 95%
2016 State % HMS 98%
2017 State 78.6% HMS 92.6%
2. Open House opportunities are offered for ELL parents. ● Parent Breakfast Meetings = 3
● Parent / Student Lunch = 1
● ESL Awards Luncheon / Parents available to attend = 2
● Lexile Reward = 1
3. Teacher Preparation (ESL Certification in PK-8 and Sheltered Instruction Training in High School). ● 100% of our teachers that teach ESL students are ESL certified.
4. Multicultural clubs, performances and or mentorship programs are offered for ELL students. ● Reading Counts 13/22 Google Hangout with La Lengua staff?
● iPass 3 / 22 Business speakers from Hispanic and Vietnamese businesses?
● ESL Foundation Acceleration Program 15 Key pals with other multicultural classrooms
● Rosetta Stone 22/22
● Student led multicultural club
● Rewards Trip 12/22
● ESL Read 180 10/22
● ESL Breakfast - 3
● ESL Reward Pizza Party
Page 21-MS 2016-2017
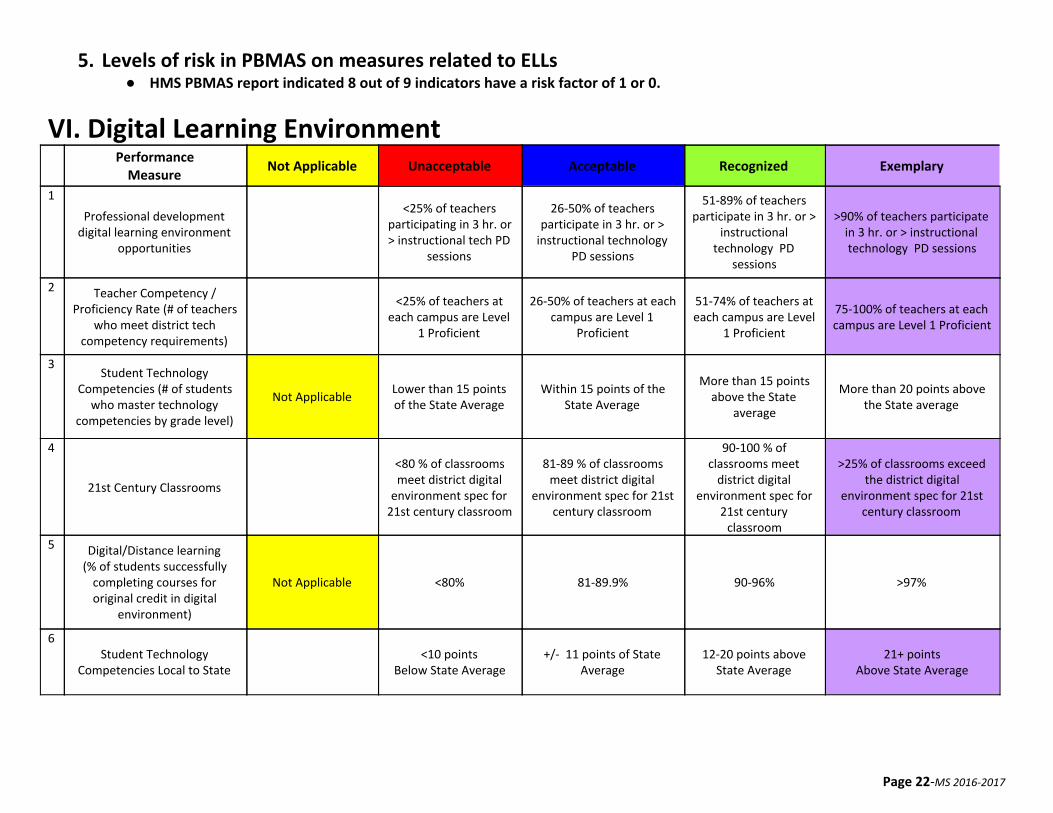
5. Levels of risk in PBMAS on measures related to ELLs ● HMS PBMAS report indicated 8 out of 9 indicators have a risk factor of 1 or 0.
VI. Digital Learning Environment
Performance Measure
Not Applicable Unacceptable Acceptable Recognized Exemplary
1
Professional development digital learning environment
opportunities
<25% of teachers participating in 3 hr. or > instructional tech PD
sessions
26-50% of teachers participate in 3 hr. or >
instructional technology PD sessions
51-89% of teachers participate in 3 hr. or >
instructional technology PD
sessions
>90% of teachers participate in 3 hr. or > instructional technology PD sessions
2 Teacher Competency / Proficiency Rate (# of teachers
who meet district tech competency requirements)
<25% of teachers at
each campus are Level 1 Proficient
26-50% of teachers at each campus are Level 1
Proficient
51-74% of teachers at each campus are Level
1 Proficient
75-100% of teachers at each campus are Level 1 Proficient
3 Student Technology
Competencies (# of students who master technology
competencies by grade level)
Not Applicable Lower than 15 points of the State Average
Within 15 points of the State Average
More than 15 points above the State
average
More than 20 points above the State average
4
21st Century Classrooms
<80 % of classrooms meet district digital
environment spec for 21st century classroom
81-89 % of classrooms meet district digital
environment spec for 21st century classroom
90-100 % of classrooms meet
district digital environment spec for
21st century classroom
>25% of classrooms exceed the district digital
environment spec for 21st century classroom
5 Digital/Distance learning (% of students successfully
completing courses for original credit in digital
environment)
Not Applicable <80% 81-89.9% 90-96% >97%
6 Student Technology
Competencies Local to State
<10 points Below State Average
+/- 11 points of State Average
12-20 points above State Average
21+ points Above State Average
Page 22-MS 2016-2017
7
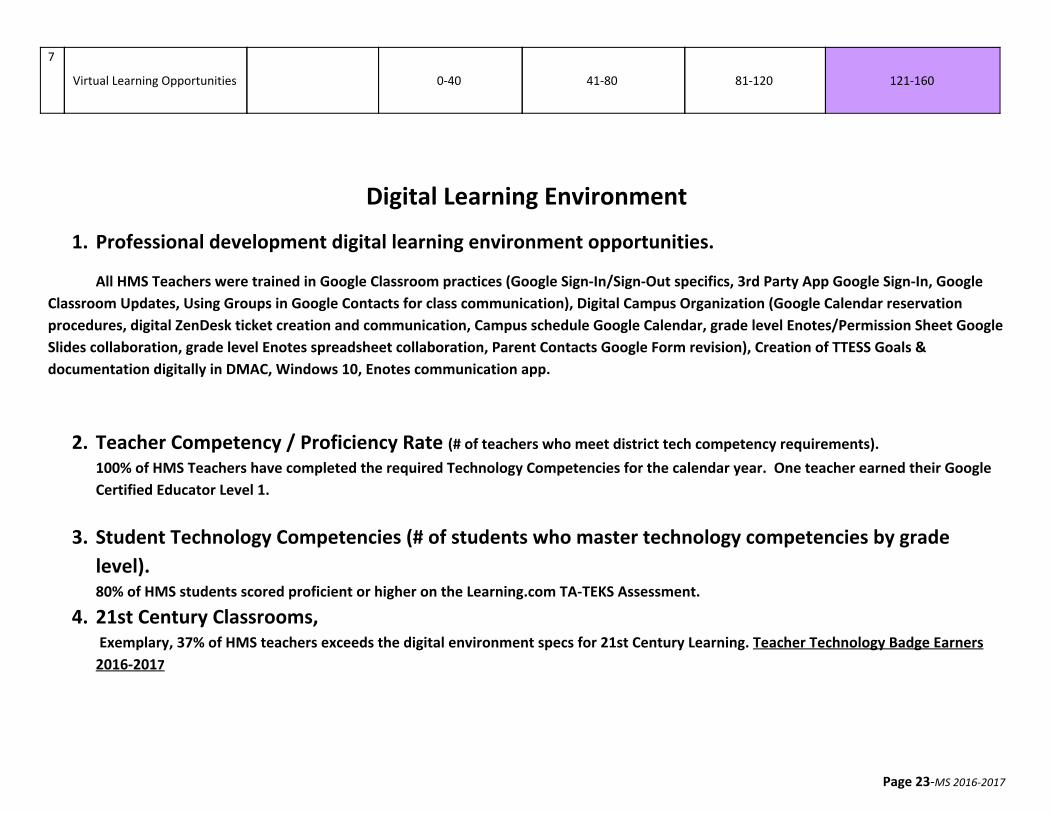
Virtual Learning Opportunities 0-40 41-80 81-120 121-160
Digital Learning Environment
1. Professional development digital learning environment opportunities.
All HMS Teachers were trained in Google Classroom practices (Google Sign-In/Sign-Out specifics, 3rd Party App Google Sign-In, Google
Classroom Updates, Using Groups in Google Contacts for class communication), Digital Campus Organization (Google Calendar reservation
procedures, digital ZenDesk ticket creation and communication, Campus schedule Google Calendar, grade level Enotes/Permission Sheet Google
Slides collaboration, grade level Enotes spreadsheet collaboration, Parent Contacts Google Form revision), Creation of TTESS Goals &
documentation digitally in DMAC, Windows 10, Enotes communication app.
2. Teacher Competency / Proficiency Rate (# of teachers who meet district tech competency requirements). 100% of HMS Teachers have completed the required Technology Competencies for the calendar year. One teacher earned their Google
Certified Educator Level 1.
3. Student Technology Competencies (# of students who master technology competencies by grade
level). 80% of HMS students scored proficient or higher on the Learning.com TA-TEKS Assessment.
4. 21st Century Classrooms, Exemplary, 37% of HMS teachers exceeds the digital environment specs for 21st Century Learning. Teacher Technology Badge Earners
2016-2017
Page 23-MS 2016-2017

PD Sessions Offered This Year - New Google Sites, Playposit Updates, Creating Multimedia Flashcard with Tiny Cards, Scratch Coding, Publishing
ENewsletters with Google Sites, Pixel Art in Google Sheets
Badge Earners 2016-2017
5. Digital/Distance learning (% of students successfully completing courses for original credit in digital
environment).
(Sandra Wagner-7th-Grade Technology)--Mr. Crenshaw suggested that the 7th grade Computer Applications class be counted as high
school credit.
a. 8th grade - Principles of Information Technology for high school credit
456 digital class slots were utilized by HMS students during the 2016-2017 school year. This equates to 70.1% of HMS students.
6. Due to EOC assessments, TSI assessments, and newly created drone racing competition our advanced
students were not available for this assessment which drastically skewed our percentile ranking when
compared to state and global results. Without question our students would have performed in the
exemplary range as their previous score was at 89%.
100% of HMS 8th graders completed the TCEA Posttest 16/17 - TA-TEKS Assessment. As a group they achieved a rating of proficient with a score
of 333.
INSERT CHART HERE
7. Hudson Middle School completed a total of 154 virtual learning opportunities during the 2015-2016
school year. UIL competition for middle school technology students Link to Google Hangout Sheet
HMS completed a total of 134 virtual learning opportunities during the 2016-2017 school year. Virtual Learning Activities Documentation Sheet
Page 24-MS 2016-2017
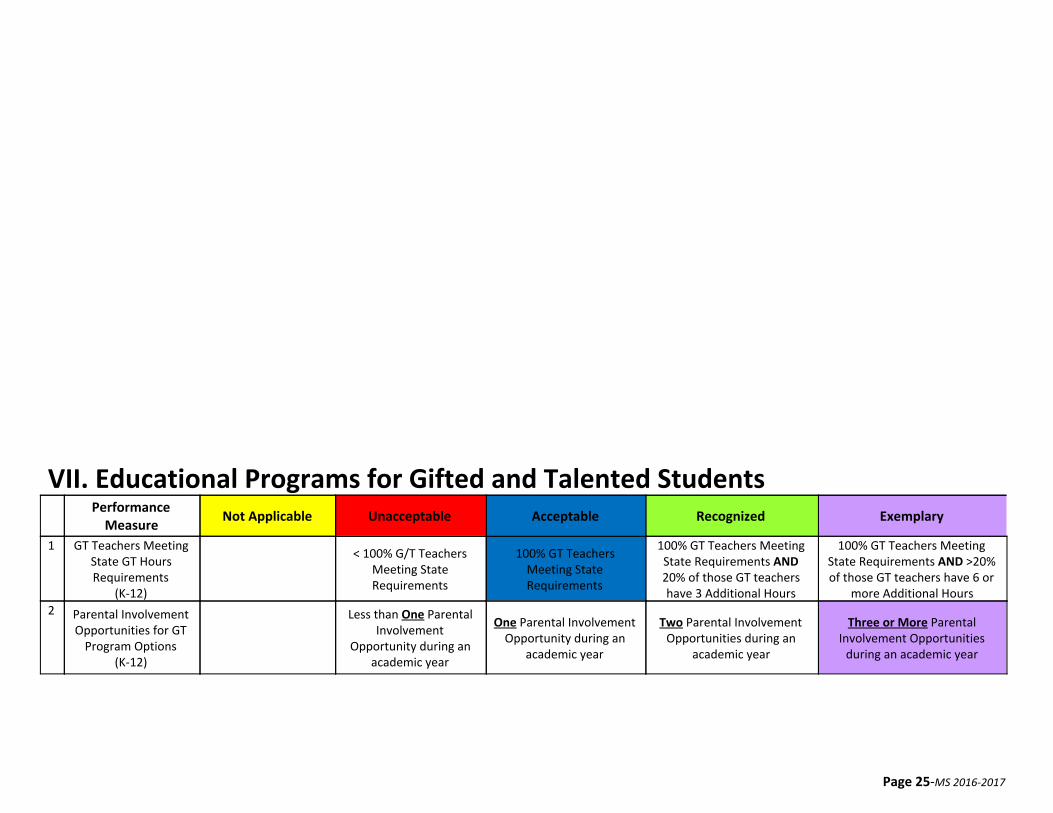
VII. Educational Programs for Gifted and Talented Students
Performance Measure
Not Applicable Unacceptable Acceptable Recognized Exemplary
1 GT Teachers Meeting State GT Hours Requirements
(K-12)
< 100% G/T Teachers
Meeting State Requirements
100% GT Teachers Meeting State Requirements
100% GT Teachers Meeting State Requirements AND 20% of those GT teachers have 3 Additional Hours
100% GT Teachers Meeting State Requirements AND >20% of those GT teachers have 6 or
more Additional Hours 2 Parental Involvement
Opportunities for GT Program Options
(K-12)
Less than One Parental Involvement
Opportunity during an academic year
One Parental Involvement Opportunity during an
academic year
Two Parental Involvement Opportunities during an
academic year
Three or More Parental Involvement Opportunities
during an academic year
Page 25-MS 2016-2017
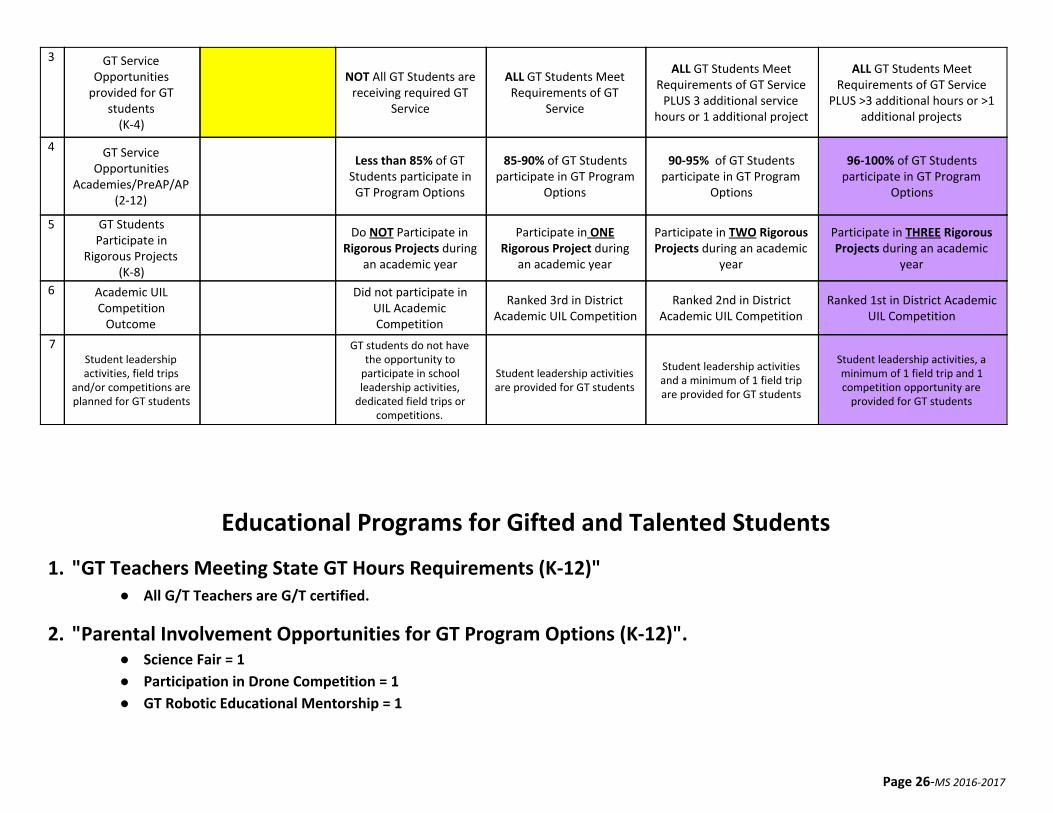
3 GT Service Opportunities
provided for GT students
(K-4)
NOT All GT Students are
receiving required GT Service
ALL GT Students Meet Requirements of GT
Service
ALL GT Students Meet Requirements of GT Service
PLUS 3 additional service hours or 1 additional project
ALL GT Students Meet Requirements of GT Service
PLUS >3 additional hours or >1 additional projects
4 GT Service Opportunities
Academies/PreAP/AP (2-12)
Less than 85% of GT
Students participate in GT Program Options
85-90% of GT Students participate in GT Program
Options
90-95% of GT Students participate in GT Program
Options
96-100% of GT Students participate in GT Program
Options
5 GT Students Participate in
Rigorous Projects (K-8)
Do NOT Participate in
Rigorous Projects during an academic year
Participate in ONE Rigorous Project during
an academic year
Participate in TWO Rigorous Projects during an academic
year
Participate in THREE Rigorous Projects during an academic
year
6 Academic UIL Competition
Outcome
Did not participate in UIL Academic Competition
Ranked 3rd in District Academic UIL Competition
Ranked 2nd in District Academic UIL Competition
Ranked 1st in District Academic UIL Competition
7 Student leadership activities, field trips
and/or competitions are planned for GT students
GT students do not have the opportunity to
participate in school leadership activities,
dedicated field trips or competitions.
Student leadership activities are provided for GT students
Student leadership activities and a minimum of 1 field trip are provided for GT students
Student leadership activities, a minimum of 1 field trip and 1 competition opportunity are
provided for GT students
Educational Programs for Gifted and Talented Students
1. "GT Teachers Meeting State GT Hours Requirements (K-12)" ● All G/T Teachers are G/T certified.
2. "Parental Involvement Opportunities for GT Program Options (K-12)".
● Science Fair = 1
● Participation in Drone Competition = 1
● GT Robotic Educational Mentorship = 1
Page 26-MS 2016-2017

● Guess Who’s Coming to Dinner Parental Participation (Advanced History) = 3
3. "GT Service Opportunities provided for GT students (K-4)". ● Academic UIL = 1
● Science Fair = 1
● GT Robotic Educational Mentorship = 1
● Robotics Program = 26 Students
● Robotics GT Mentoring Program
● All HMS GT students are enrolled in advanced curriculum
● All HMS GT students are exposed to a minimum of 8 projects per year
● HMS Robotics Program
● 3D Printing Class
● G/T students participation in Hudson Helps Service Activities
4. "GT Service Opportunities Academies/PreAP/AP (2-12)". ● 100% of HMS GT students participate in GT Program Options.
● High School Accredited Course Offerings = Algebra, Biology, Principles of Information Tech, Concepts of Engineering, Art 2
5. "GT Students Participate in Rigorous Projects (K-8)". ● Energy Investigation / Prezi
● Science Fair Project
● Children of the Holocaust Project / Presentation QR code
● Research the the economic growth & development of various South American countries, graph indicators such as life expectancy, gross domestic product, poverty rate and literacy rate, and use this data to draw conclusions about a country’s level of economic health.
● World Religions Brochure
Page 27-MS 2016-2017
● Biography Presentation / presented info through PPT, original book jackets, oral presentations w/costumes and prompts
● “The Clay” Boat Construction Project The Hour of Code
● Body Systems and Disease Research Project
● Recycling in the Ecosystem (Composting)
● Colonization Project: research, timeline, journal, Venn diagram, advertisement, and table
● Famous Texan Project: research, digital resume, business cards, speech writing, and presentations
● Self-Sustaining 3D Island Project made from recycled items
● Children’s books containing literary devices
● Formal Poetry Project Adv ELAR 7th Grade
● Formal Research Project Adv ELAR 8th Grade
● Student Created You-Tube tutorials
● Native Americans in Texas research project with 3D model
● Texas Times – student created newspaper
● Texas History Museum
● Algebra-High school course
● Geometry Map Project
● Real Life Ratio and Rate Project with Google Presentation
● Math Vocabulary Publication with Real Life Applications for each term
● Graphing Project
● Researched “PI” and presented to class
● Created Review Games and Implemented
● Heritage Booklet
● Biography Presentation
● Boat Construction –Boats built to specific requirements
● The Hour of Code- Introduction of computer coding
● Body Systems and Disease Research Project
● Recycling in the Ecosystem
● Guess Who’s Coming to Dinner
● Bill of Rights Video Creation/Presentation
● The 13 Colonies Project
● Student Interviews- Use of Classroom Technology
Page 28-MS 2016-2017

● Poetry Project
● Writing Portfolio
● Researched Alaska for novel study- presented to class
● Research Prezi project using foreign currency and American made products
● Scavenger Hunts for math with Algebra Concepts and Extensions for Eighth Grade TEKS with Real World Applications
● Alternate Exam as a Real-World Application Project Using Math Concept
● Inventions Project: PowerPoint/Prezi/Google presentation reflecting knowledge of 5 scientific or technological inventions
● Atomic structure research: student built a 3-D model of an atom and completed a blog which enabled them to collaborate and
share with their peers.
● Real World Relevancy Writing Essay Contests (VFW Patriot Pen and Daughters of American Revolution)
● My Odyssey Project involving formal research writing and Glogster.edu presentations using several database resources
● Students were provided an opportunity to explore the contributions of various scientists to the development of the cell theory
then write a blog or journal entry from the point of view of that scientist describing his thoughts and feelings as he made his
discovery.
● After researching biomes, students described the current adaptations of an organism to survive in its current ecosystem, then
they moved the organism to another type of ecosystem. They described the new adaptations needed and drew the organism in
its new habitat with its new adaptations.
● Hydroponics Project
● Energy Resources project - development of a new city with energy resource options based on environment and needs
● Solar System and Space Exploration project - in-depth presentation of student-selected topic within the unit TEKS
● Earth’s layers project - 3 dimensional or virtual representation of the layers of the Earth
6. Academic UIL Competition Outcome ● For the 13th year in a row HMS ranked 1st in academic UIL
7. Student leadership activities, field trips and/or competitions are planned for GT students ● Hudson Helps Field Trip
● UIL Field Trip
● Science Fair
● Robotics Competition
● GT Mentoring Field Trip
Page 29-MS 2016-2017
● Band Field Trip
● In addition, all grade level participate in an end of the year field trip
● Hydro Day (STEM Program) at SFASU
● Art Club - group leaders for 3 day field trip
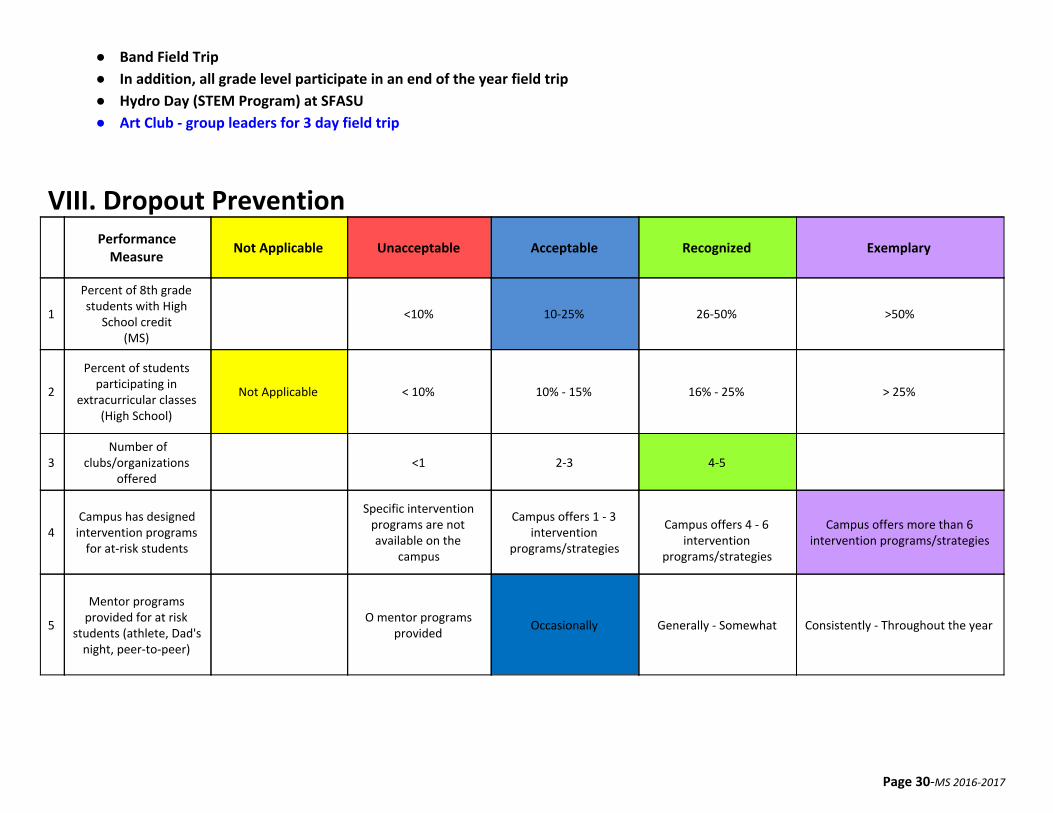
VIII. Dropout Prevention
Performance Measure
Not Applicable Unacceptable Acceptable Recognized Exemplary
1
Percent of 8th grade students with High
School credit (MS)
<10% 10-25% 26-50% >50%
2
Percent of students participating in
extracurricular classes (High School)
Not Applicable < 10% 10% - 15% 16% - 25% > 25%
3 Number of
clubs/organizations offered
<1 2-3 4-5
4 Campus has designed intervention programs
for at-risk students
Specific intervention programs are not available on the
campus
Campus offers 1 - 3 intervention
programs/strategies
Campus offers 4 - 6
intervention programs/strategies
Campus offers more than 6 intervention programs/strategies
5
Mentor programs provided for at risk
students (athlete, Dad's night, peer-to-peer)
O mentor programs
provided Occasionally Generally - Somewhat Consistently - Throughout the year
Page 30-MS 2016-2017
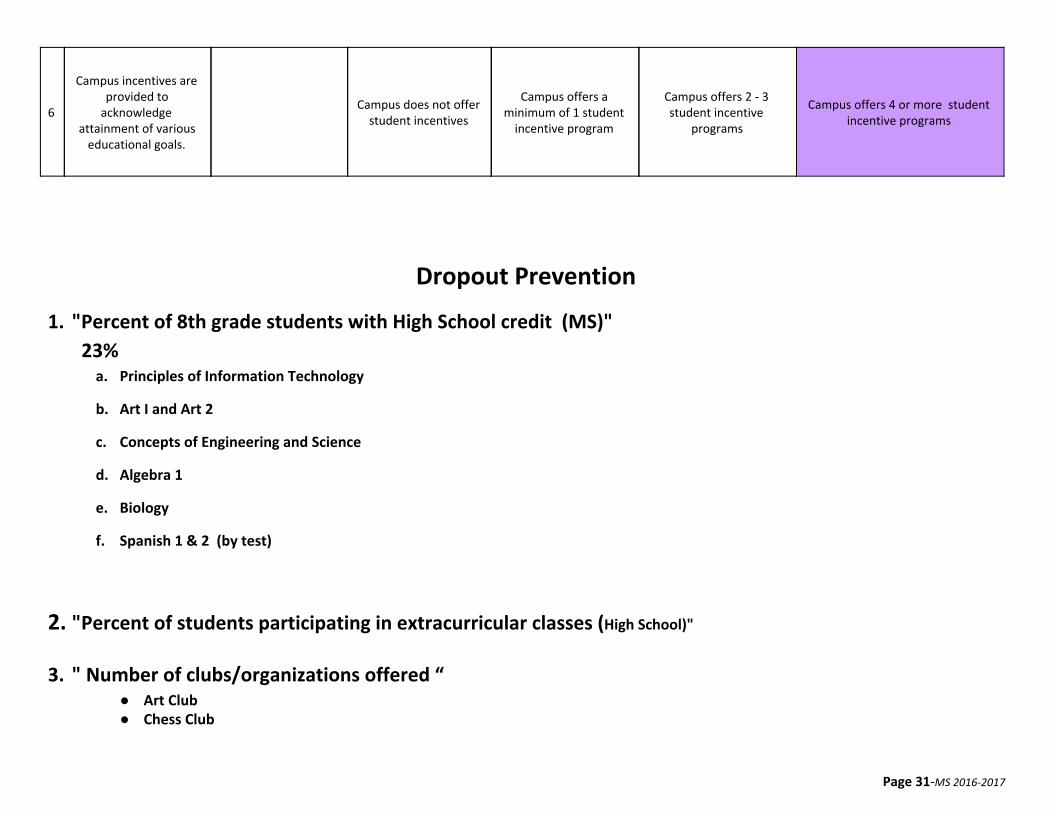
6
Campus incentives are provided to
acknowledge attainment of various
educational goals.
Campus does not offer
student incentives
Campus offers a minimum of 1 student
incentive program
Campus offers 2 - 3 student incentive
programs
Campus offers 4 or more student incentive programs
Dropout Prevention
1. "Percent of 8th grade students with High School credit (MS)"
23% a. Principles of Information Technology
b. Art I and Art 2
c. Concepts of Engineering and Science
d. Algebra 1
e. Biology
f. Spanish 1 & 2 (by test)
2. "Percent of students participating in extracurricular classes (High School)"
3. " Number of clubs/organizations offered “ ● Art Club ● Chess Club
Page 31-MS 2016-2017

● CIA ● Hudson Helps ● After school Choir ● Bass Club ● Say What Group
4. Campus has designed intervention programs for at-risk students ● Why Try, Local and DAEP ● Special Ed Group and individual Counseling ● IPass x3 ● Read 180 x3 ● ESL Read 180 ● Foundation Acceleration Program ● AVID ● Angel Tree ● Rosetta Stone ● Field Day End of Year Carnival
Mentor programs provided for at risk students (athlete, Dad's night, peer-to-peer
● Career Mentoring ● Why Try, ● Hudson Helps ● JA in a Day ● Hoodie Give Away ● Provide support for Career Cluster project from local professionals ● Spanish Credit by Exam
5. Campus incentives are provided to acknowledge attainment of various educational goals.
Page 32-MS 2016-2017
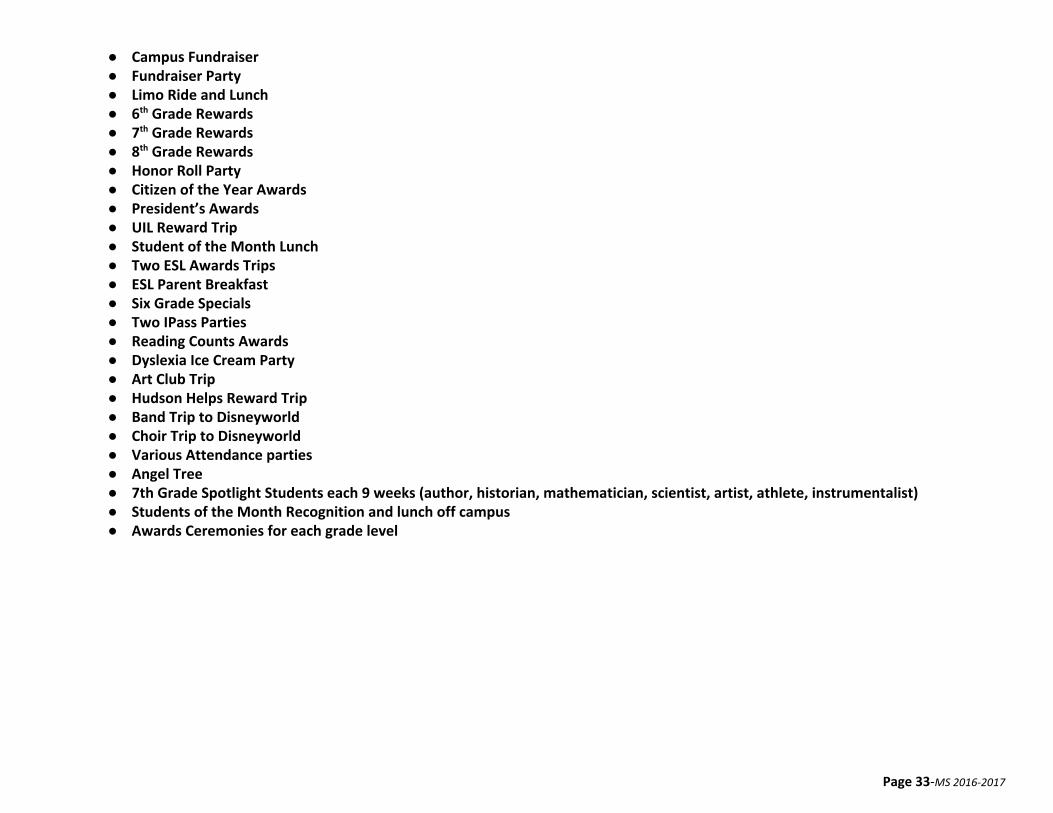
● Campus Fundraiser ● Fundraiser Party ● Limo Ride and Lunch ● 6th Grade Rewards ● 7th Grade Rewards ● 8th Grade Rewards ● Honor Roll Party ● Citizen of the Year Awards ● President’s Awards ● UIL Reward Trip ● Student of the Month Lunch ● Two ESL Awards Trips ● ESL Parent Breakfast ● Six Grade Specials ● Two IPass Parties ● Reading Counts Awards ● Dyslexia Ice Cream Party ● Art Club Trip ● Hudson Helps Reward Trip ● Band Trip to Disneyworld ● Choir Trip to Disneyworld ● Various Attendance parties ● Angel Tree ● 7th Grade Spotlight Students each 9 weeks (author, historian, mathematician, scientist, artist, athlete, instrumentalist) ● Students of the Month Recognition and lunch off campus ● Awards Ceremonies for each grade level
Page 33-MS 2016-2017