Embed Size (px)
Citation preview

Cleared, 88PA, Case # 2017-241, 24 Jun 2017
USAF Operational Based Vision Assessment (OBVA) Lab
“I can see clearly now!”

I n t e g r i t y - S e r v i c e - E x c e l l e n c e
Headquarters U.S. Air Force
OBVA Color Cone Contrast TestHigh Definition (CCT-HD)
Research & Development
Steven C Hadley MD, FACSColonel (Ret), USAF, MC, CFS
Command Pilot-PhysicianChief, OBVA lab
Aerospace Ophthalmology Consultant to USAF Surgeon General Asst. Professor of Surgery, USUHS School of Medicine
12 Sep 2017

Cleared, 88PA, Case # 2017-241, 24 Jun 2017
CCT-HD Research & Development65th ICASM 2017 Rome, Italy
OBVA Laboratory711 HPW/FHOH
Steven Hadley, MD1
Marc Winterbottom, PhD1
James Gaska, PhD1
Logan Williams, PhD1
Steven Wright, OD1
Charles Lloyd, PhD2
1711 HPW/USAFSAM2Visual Performance LLC
Integrity Service Excellence
711 HPW/USAFSAM

Cleared, 88PA, Case # 2017-241, 24 Jun 2017
• The views expressed are those of the author and do not necessarily reflect the official policy or position of the U.S. Air Force, the Department of Defense, or the U.S. Government
• This work was supported by U.S. Air Force contract FA8650-12-D-6280 to Wyle Laboratories and was funded by the 711 HPW/USAFSAM
• There are no off label use of medications discussed
Disclaimer
Cleared, 88PA, Case # 201x-xxxx, xx Mon 201x.

Cleared, 88PA, Case # 201x-xxxx, xx Mon 201x.
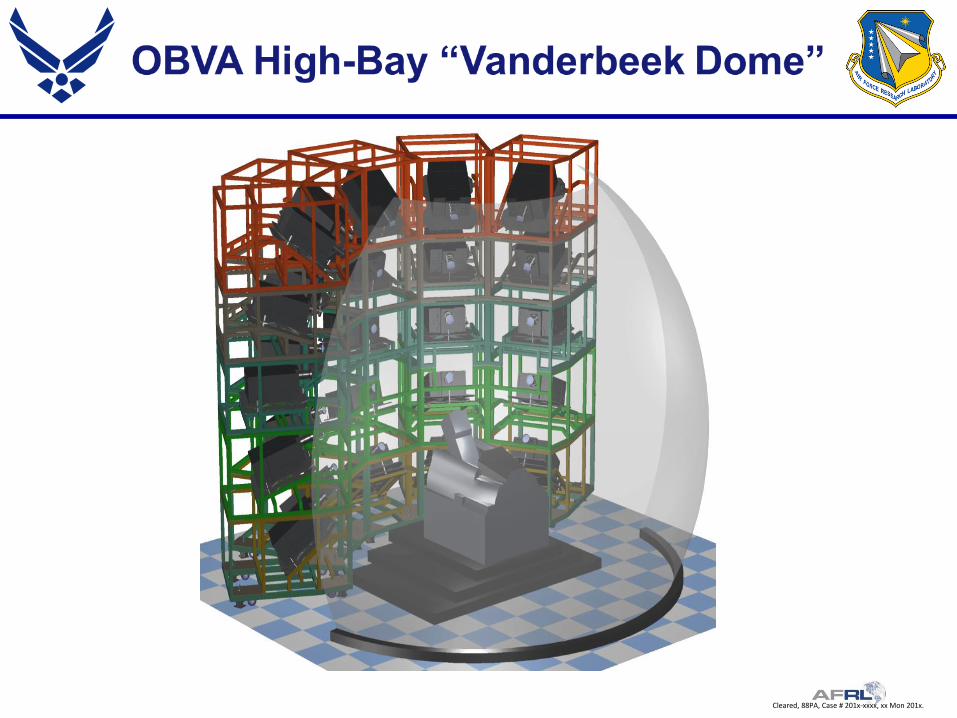
OBVA High-Bay “Vanderbeek Dome”
• Barco Sim10 Projectors: 150M pixels
• Scalable warping and blending

Cleared, 88PA, Case # 201x-xxxx, xx Mon 201x.
OBVA Laboratory Research
OBVA KC-46 remote vision system simulation. Photo by USAFSAM media department.
OBVA high-bay simulation facility. CAD drawing generated by OBVA personnel.
F-35 HMDS. Source: DIMOC.
Unmanned aerial vehicle ground control station color
displays. Source: DIMOC.
Simulated color-coded situation awareness display. OBVA Lab image.

Cleared, 88PA, Case # 2017-241, 24 Jun 2017
Operational Based Vision Assessment (OBVA) Laboratory
• Using simulation environment & laboratory vision tests:
– Provide quantitative data defining visual performance capability that will prove useful during air combat, contribute to success of the mission, and help ensure survivability
– Operational based vision standards and waiver criteria
– Evaluate correction, enhancement, protective technologies
– Uncover strategies (training, engineering) to improve vision performance and possibly counter deficiencies
– Establish platform-specific vision standards
– Modernize aircrew vision screening

Cleared, 88PA, Case # 2017-241, 24 Jun 2017
“A color defective who, for reasons of his own, hides his defect might do well, but a color defective who insists that he ‘knows all colors,’ that he is ‘perfectly o.k.’ is a menace. Of course, he sees all colors in his own way and in his own way ‘knows all colors’ – all his colors. But he must realize that he sees them not the way the rest of us see them, that we are in the majority and that tests, traffic lights, neckties, decorating schemes, wire codes were made to serve us, not him.” Arthur Linksz, MD “An Essay on Color Vision”
Where it startedFlight Environment Demands - Color Vision
Used with permission Douglas J. Ivan, MD; USAF COLOR VISION TESTING STRATEGY AND METHODOLOGY AsMA COLOR VISION WORKSHOP, 2007

Cleared, 88PA, Case # 2017-241, 24 Jun 2017

Cleared, 88PA, Case # 2017-241, 24 Jun 2017

Cleared, 88PA, Case # 2017-241, 24 Jun 2017
Displays- Past, Present and FutureIncreasingly Color-Demanding Environment
P-51 KC-135R/T
F-35

Cleared, 88PA, Case # 2017-241, 24 Jun 2017

Cleared, 88PA, Case # 2017-241, 24 Jun 2017

Cleared, 88PA, Case # 2017-241, 24 Jun 2017

Cleared, 88PA, Case # 2017-241, 24 Jun 2017

Cleared, 88PA, Case # 2017-241, 24 Jun 2017
Motivation for OBVA research
Chart on front door of
F-35 flight surgeon
office in a USAF flying
squadron.
Photo by Dr Steven Hadley
Motivation for OBVA research “To insure the USAF vision tests are
predictive of operational performance,
operationally accurate and precise, while
providing reproducible results for
qualification, standards and policy
decisions”
Steven Hadley MD, USAF Pilot-Physician (retired), Chief USAFSAM/OBVA

SCAMMING PIPsColor Vision Caper – 1994

Cleared, 88PA, Case # 2017-241, 24 Jun 2017
PIP I PIP II PIP III F2
96% 78% 65% 88%
PIP I Sensitivity
Percent of Color Defectives That Fail TestPIP I Passing Criterion: 12 of 14 correct
USAF Pilots & Aircrew (n=1329)
PIP I PIP II PIP III F2
78% 47% 53% 76%
USAF Pilots Applicants (n=1279)
Fail to detect 22%!

Cleared, 88PA, Case # 2017-241, 24 Jun 2017
Previous Available Color Tests
• Historically, color vision assessed using:
– Color plates, hidden images
– Arrangement of colored caps
– Color matching
– Lanterns
• Numerous limitations:
– “Test preparation”
– Plates fade over time
– Special lighting required
– Reliability
– All lanterns allow CVD to pass

Cleared, 88PA, Case # 201x-xxxx, xx Mon 201x.
Introduction
All USAF pilot candidates required to
pass strict color vision standard to
maintain flight safety– No color deficiency allowed
– US Army and US Navy permits mild to
moderate color deficiency
– Commercial airlines, most other Air Forces
effectively permit mild deficiency
In 2011, the USAF introduced a new
computer-based color vision
screening test - the Rabin cone
contrast test (RCCT)– Replace pseudoisochromatic plate (PIP) tests
– Demonstrated to very reliably screen for color
deficiency (Rabin et al, 2011; Hovis, 2016)
Dvorine PIP test. OBVA Lab photo.
Rabin CCT L, M cone test letters. OBVA Lab image.
Cleared, 88PA, Case # 2017-241, 24 Jun 2017
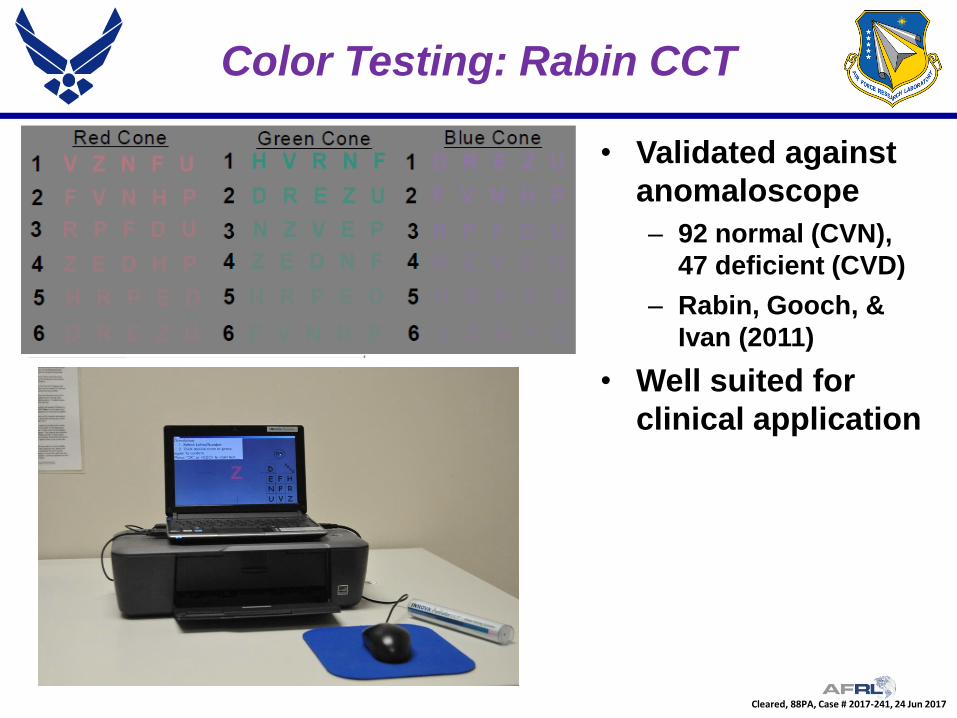
Color Testing: Rabin CCT
• Validated against
anomaloscope
– 92 normal (CVN),
47 deficient (CVD)
– Rabin, Gooch, &
Ivan (2011)
• Well suited for
clinical application
Cleared, 88PA, Case # 2017-241, 24 Jun 2017
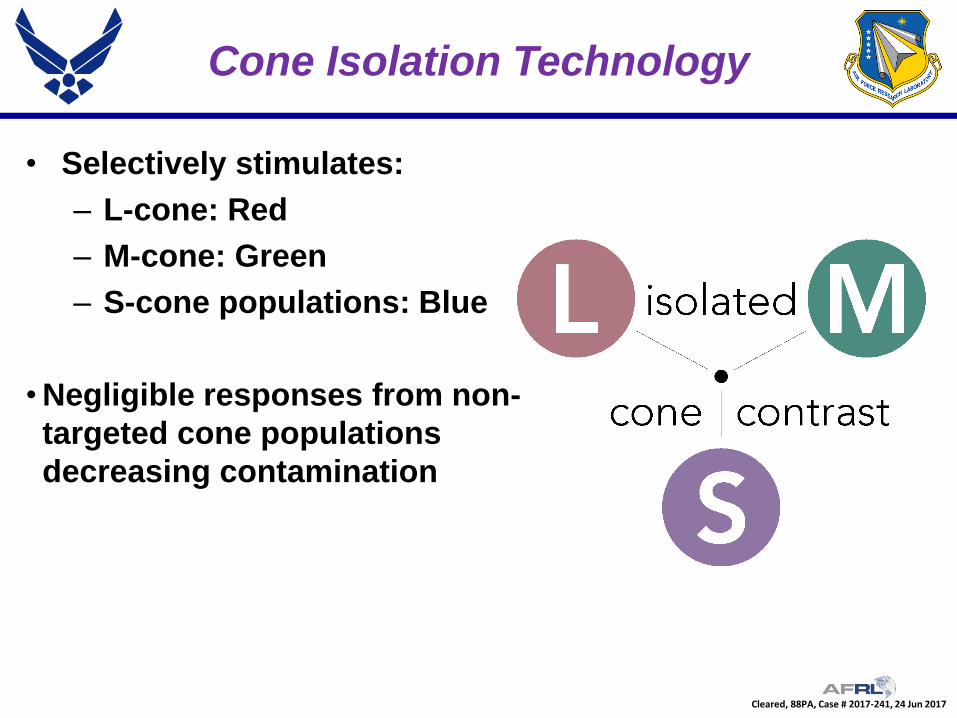
Cone Isolation Technology
• Selectively stimulates:
– L-cone: Red
– M-cone: Green
– S-cone populations: Blue
•Negligible responses from non-
targeted cone populations
decreasing contamination

Cleared, 88PA, Case # 2017-241, 24 Jun 2017
Team Aerospace Begins Here!
N
V
R
E
U
ZZ
Automated CCT Single letter
presentation
Different (random)
sequence each time
CCT validated against anomaloscope. Can ID CVD anomaloscope may miss
Very effective at identifying, classifying color deficiency
Huge advancement over previous standard (PIP plates)
Color Testing: Rabin CCT
Extremely sensitive and specific to identify color normal and quantify color deficiency

Cleared, 88PA, Case # 2017-241, 24 Jun 2017
1. Single subject identified color deficient by anomaloscope; however, all other testing identified subject as normal.
2. Single subject identified as color normal by anomaloscope; however, all other testing identified as color deficient.
3. 17 subjects additionally identified as having a Tritan (Blue cone) defect, not confirmed on any other testing.
Cone ContrastTest
(CCT Staircase)
Colour Assessment and Diagnosis (CAD)
Computerized Color Vision Test
(CCVT)
Oculus Anomaloscope
Subjects evaluated98 Total Subjects
48 Color Normal, 50 Color Deficient (based on test battery)*
Sensitivity(Color deficiency correctly diagnosed)
100.0%(50/50)
100.0%(50/50)
96.0%(48/50)
96.0%(48/50)
Specificity(Normal color vision correctly diagnosed)
100.0%(50/50)
100.0%(50/50)
96.0%(48/50)
98.0%(49/50)
Nature of deficiency correctly diagnosed (i.e. deutan vs. protan)
100.0%(50/50)
94.0%(47/50)
78.0%(39/50)
96.0%(48/50)
Wright et al “Comparison of Digital Color Vision Tests” AsMA 2015

Cleared, 88PA, Case # 201x-xxxx, xx Mon 201x.
Rabin CCT - Negatives
Interface is poor, slow, introduces luminance changes
Bailey-Lovey letters accepted, but introduces
variability, problematic response method
Display chromaticity dependent on viewing angle
–Testers can move head around to improve score
Does not produce reliable results in low normal/mild
CVD (mCVD at 12 test points has +/- 18 points-terrible
test/retest reliability)
–Test-retest reliability a problem for borderline CD
Color calibration works but is limited to 5 contrast
levels
Ceiling effect: Historically almost all normal measure
100 (80% male; 95% female)

Cleared, 88PA, Case # 201x-xxxx, xx Mon 201x.
OBVA CCT-HD
To support USAF, more precise color test needed
– Operational Based Vision Assessment (OBVA) Cone Contrast Test
(CCT-HD)
• Described in previous report (Gaska et al, AsMA 2016)
– IPS (in-plane switching)
– Precise calibration to obtain lower contrast, 0.25% cone contrast
steps
• Spectraradiometer (Maya 2000 Pro, Ocean Optics)
• CIE 2006 LMS functions
– Landolt C optotype, 4 AFC to reduce response variability
– Well-accepted adaptive threshold procedure (Kingdom & Prins,
2010)
– Photopic adapting luminance

Cleared, 88PA, Case # 201x-xxxx, xx Mon 201x.
In Plane Switching (IPS)
Low Sensitivity to Viewing Angle
IPS LCD displays
provide limited
changes in
brightness and color
irrespective of the
viewing angle
Directional stability
critical to produce
accurate low
contrast cone
isolation, without
which, precision of
testing may suffer

Cleared, 88PA, Case # 201x-xxxx, xx Mon 201x.
CCT-HD Improvements over RCCT
Current implemented improvements–Vastly reduced color shifts via IPS / PLS display
technology
– Improved sensitivity through unique calibration
techniques (custom curves and dithering pixel shader)
–Built on well understood and peer-reviewed
psychophysical methods. (Psi, Quest, UpDown
Staircase, Method of constant stimuli)
–Removed the variability in difficulty across trials by
using a single (mostly) spherically symmetric optotype
(Landolt C).
–Removed the need for the subject to look away from
stimulus location in-between trials.

Cleared, 88PA, Case # 2017-241, 24 Jun 2017
CCT-HD Cone Isolation Technology
• Derived from a series of
complex calculations to
create specific target and
background colors of
declining contrast
•Displayed on selected
monitor / graphics card
systems with …
•Advanced calibration for:
•precision color rendition
•minimal luminance cues

Cleared, 88PA, Case # 2017-241, 24 Jun 2017
CCT-HD Design Criteria
•Detect abnormalities and
characterize the contrast
sensitivity of both the
color and achromatic
mechanisms of the human
vision system
•Increase the reliability and
efficiency of these metrics
widely used in medical and
occupational environments

Cleared, 88PA, Case # 201x-xxxx, xx Mon 201x.
CCT-HD Evaluation, Normative Data
USAF Flying Class I (FCI)
pilot candidates were tested
using the CCT-HD and Rabin
CCT (RCCT) during their
medical pilot screening
Administered CCT-HD either
binocularly or monocularly
Some participants repeated
the test to examine test-
retest reliability
Approximately 1,100-2,200
FCI candidates tested
Cleared, 88PA, Case # 201x-xxxx, xx Mon 201x.
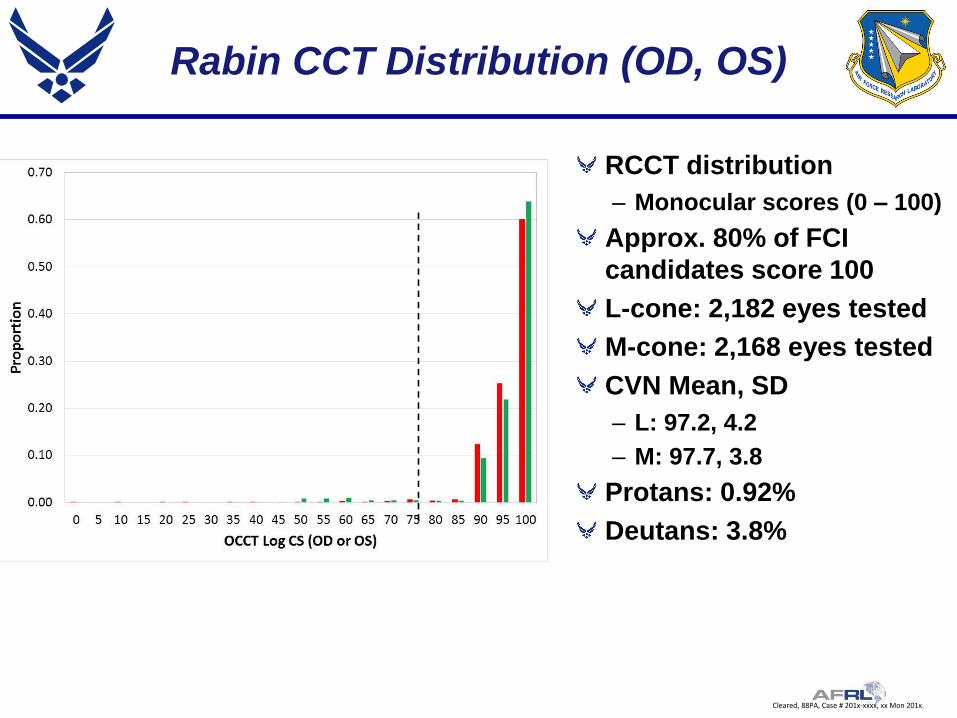
Rabin CCT Distribution (OD, OS)
RCCT distribution
– Monocular scores (0 – 100)
Approx. 80% of FCI
candidates score 100
L-cone: 2,182 eyes tested
M-cone: 2,168 eyes tested
CVN Mean, SD
– L: 97.2, 4.2
– M: 97.7, 3.8
Protans: 0.92%
Deutans: 3.8%

Cleared, 88PA, Case # 201x-xxxx, xx Mon 201x.
CCT-HD Distribution (OD, OS)
CCT-HD distribution
– Monocular log contrast
sensitivity
Sensitivity of CVN
individuals revealed with
CCT-HD
L-cone: 1,091 eyes
M-Cone: 1,084 eyes
CVN Mean, SD
– RCCT Criterion: 1.65
– L: 2.08 (0.83%), 0.11
– M: 2.02 (0.96%), 0.10
Protans: 0.73%
Deutans: 3.8%
3.7 SD

Cleared, 88PA, Case # 201x-xxxx, xx Mon 201x.
CCT-HD Distribution (OU)
CCT-HD distribution
– Binocular log contrast
sensitivity
– Binocular testing not
possible with RCCT
L-cone: N = 499
M-Cone: N = 500
CVN OU Mean, SD
– RCCT Criterion: 1.65 +
0.15 (binocular
summation)
– L: 2.21 (0.62%), 0.11
– M: 2.15 (0.70%), 0.10
– Binocular summation
• Log 0.13 = 1.36
3.5 SD

Cleared, 88PA, Case # 201x-xxxx, xx Mon 201x.
Benefit of CCT-HD -- No Ceiling Effect• M cone test results distribution• The bottom horizontal axis identifies contrast sensitivity and the top horizontal axis shows the
equivalent CCT scores. • The pass/fail criterion (1.65 logCS, 75 CCT score) is shown by the solid line.• The maximum measurable contrast sensitivity in for the RCCT ( 1.9 logCS, 100 CCT score) is
shown using the dotted line.• Contrast Sensitivity values to the right of the dotted line (~ 86% of normal observers) cannot
be measured using the RCCT
RCCT scores all these results at 100% due to ceiling effect
CCT-HD Distribution (OU)

Cleared, 88PA, Case # 201x-xxxx, xx Mon 201x.
RCCT Test-Retest (OD vs. OS)
N = 1,091N = 1,098

Cleared, 88PA, Case # 201x-xxxx, xx Mon 201x.
CCT-HD Test-Retest
N = 81
N = 79
N = 77
N = 76

Cleared, 88PA, Case # 201x-xxxx, xx Mon 201x.
OBVA Collaborative R&D
International, industry, academic (and tri-service?) collaboration
– Enhanced mutual reliance, cost sharing, augmented data collection
– Technology transition and development

Cleared, 88PA, Case # 201x-xxxx, xx Mon 201x.
Conclusions
CCT-HD provides capability to characterize color
sensitivity for normal/supranormal individuals
Enables binocular testing
Improved reliability
Enables OBVA research examining relationship between
color vision and operational performance– Color-coded displays
– PAPI light identification
– UAV GCS color coded displays
Enable USAF to obtain baseline color vision data to
support human performance optimization, earlier
diagnosis of disease/injury– Meet new requirements by AF/SG and Major Commands (AETC, ACC)

Cleared, 88PA, Case # 2017-241, 24 Jun 2017
KC-46A refueling F-35A
Steven C Hadley MD, Chief, OBVA lab; USAF Surgeon General Consultant for Aerospace [email protected] or [email protected]
Questions?