Embed Size (px)
Citation preview

Flood and Water Quality
Targeted, Temporary Restoration of Functions: Paying Upland
A. Manale
ABSTMCK Floods have caused billions of dollars in damage to populated areas associated with river systems in recent years. Runoff associated with floods has resulted in deterioration of down- stream water qwlity. The threat offlooding may be known weeks if not months in advance. Such nonstructural means as temporary storage of runoff on agricultural land in the upland areas of the watershed during periods when flood risks are high, may provide ecological benejts through reduced sediment runofl soil carbon loss, and loading of nutrients to surjace waters, at the same time diminishing the threat of downstream flooding. Local or regional resource man- agers or insurance industry consortia could establish contracts with farmers to store runof by the temporary plugging of ditches, drainage systems, and similar practices until the flood threat has passed. In return, farmers would be paid an amount covering the loss of potential net revenue and the opportunity cost Pom use of the land for the period of runoff storage. Highly detailed topographic maps would be used to estimate storage capacity on a fa rmer i j eh and hydrograph- ic data would be used to estimate the volume of water fiom a precipitation event that must be stored in order to avert downstream flooding. When meteorological data suggest that a flood is imminent or that an extreme precipitation event is like&, the contractual agreements would be initiated. Case studies in select watersheds in Iowa show how the policy might lessen the social and environmental cost offtood.
Keywords: Agricultural conservation, economic incentives, floods, nonstructural flood mitigation, nutrient runofl upper basin storage, water quality
n the ten years ending in 1993, aver- age annual flood damages in the Unit- I ed States have been estimated to ex-
ceed $3 billion (Interagency Floodplain Management Task Force 1994). The Corps of Engineers estimated that the Midwest Flood of 1993 alone caused some $16 billion in damages. Further- more, the rate of annual damages caused by flooding is on the rise with flood dam- age costs in fiscal years 1995 and 1996 amounting to $5.1 and $6.1 billion, re- spectively (FEMA 1997). If global warm- ing continues and extreme weather events occur more frequently, as predicted (whether or not as a consequence of an- thropomorphic activities), the social cost of events associated with extreme precipi- tation can be expected to increase in lieu of mitigatory actions that reduce the im- pact of extreme weather events (Karl 1999; UMAC 1999; and Watson et al. 1996).
Andrew Manale is a senior program anahst in the U. S. Environmental Protection Agency i National Center for Environmental Economics, Warhington, D. c.
In response to the 1993 Midwest Flood, the President established the Fed- eral Interagency Floodplain Management Committee to make recommendations to the administration on changes in current policies, programs, and activities of the federal government that would reduce risk and achieve environmental enhancement in the floodplain and related watersheds.
One of the key strategic goals for effec- tive floodplain management identified by the committee was the preservation and enhancement of the natural resources and functions of flood plains. As further noted by the committee, the federal gov- ernment should If. . . where appropriate, restore and enhance bottom land and re- lated upland habitat and flood storage" (Interagency Floodplain Management Task Force 1994, p 67). Committee members envisioned a future flood man- agement strategy in which "[upland of the floodplain,] federal-state-tribal-local programs to improve the treatment of lands, control new runoff, and restore wetlands would reduce the flows during
frequent floods and shave the peaks off larger events" (p 67). Absent from the re- port's review of the literature are studies of the costs and benefits of nonstructural means for flood abatement in the Upper Mississippi. Also absent was a discussion of policies for implementing a program to manage runoff from upland areas.
Drainage has greatly reduced the water storage capacity of large amounts of crop- land. Over 60% of the depressions in the closed drainage areas of Iowa, Minnesota, and Illinois are tiled or open ditch drained (USDA 1982). Subsurface tile drainage systems lower the water table and remove water from depressional areas. Open ditch drains constructed to act as outlets for removal of excess water serve as direct conduits to streams and eliminate a high percentage of the surface storage of the depressional areas (Person 1935). In Iowa, over 95% of the wetlands have been lost, nearly all losses occurring between the 1780s and the mid 1980s (Virginia Carter 1997).
Extensive wetland restoration or large scale construction in prime agricultural areas can be very expensive. There is, of course, the cost of the purchase of the land or the easement to the land and the establishment of the necessary hydrologic conditions. Each restored or constructed hectare of wetland in Iowa, for example, can easily cost $9,876 and more (De Laney 1995; Alexander 1996). In addi- tion, there are the costs associated with the loss of agricultural production, higher food prices, and the loss of revenue to local communities. It is this latter con- cern that has led the United States De- partment of Agriculture (USDA) to limit by policy the percentage of cropland (no more than 10%) that can be retired in any one county through the Conservation or Wetland Reserve Programs.
The higher peak flows resulting from the conversion of wetlands and other changes to the landscape also contribute to such water quality problems as in- creased loading of such nutrients as nitro- gen and phosphorous from fertilizers ap- plied to cropland (C. Hunt 1997). The average annual concentration of nitrate in the Lower Mississippi, for example, has increased two-fold since the 1950s (Turner and Rabalais 1991) and has con- tributed to the degradation of water qual- ity for recreation, aquatic wildlife habitat, and drinking water (Orie Loucks 1995). Over 31% of the nitrogen flux to the Gulf of Mexico originates from the Upper Mississippi (USDA 1996). In ad- dition, major rainfall events, particularly
285 J O U R N A L O F S O I L A N D W A T E R C O N S E R V A T I O N
Copyright ©
2000 Soil and Water C
onservation Society. All rights reserved.
w
ww
.swcs.org
55(3):285-295 Journal of Soil and W
ater Conservation

in late winter, cause most of the loading of phosphorous and sediment to surface waters (Goolsby 1993; The National Re- search Council (NRC) 1993). The excess nutrients transported through the Missis- sippi contributes to the hypoxic zone in the Gulf of Mexico, an area of over 6000 mi2 (roughly 15,000 mi2)near where the Mississippi and Atchafalaya Rivers flow into the Gulf, where there is not enough oxygen in the water to support normal fish populations.
Donald L. Hey and Nancy Philippi (Hey and Philippi 1997) have argued that land can be managed to provide the hnc- tions, such as temporary water retention and filtration, once naturally provided by wetlands. "We should be able to find suf- ficient land to create nodes within our drainage system where excess runoff can be stored and used for other purposes." They also suggest that ". . . the key to successfully implementing these solutions is in the strategic placement and scale of wetland restoration by reference to needs for flood damage reduction . . . By low scale engineering techniques . . . the flood storage capability of these soils can be greatly expanded" (p 68).
An alternative and complementary ap- proach that can be pursued in conjunc- tion with a long term policy of strategic wetland restoration is a voluntary pro- gram of temporary water storage on agri- cultural lands. For example, in the water- shed of the Upper Mississippi, upland areas, particularly those areas that histori- cally contained large amounts of wet- lands, could potentially store significant amounts of runoff. During periods of high precipitation or in the late winter or early spring, the water storage function (surface impoundment and soil satura- tion) of converted wetlands can be tem- porarily restored by plugging drainage ditches and tile drains for the period of the events.
In select areas studied by investigators in the closed flow systems within the northern prairie portion of the Upper Mississippi River Basin (Wiche 1990), up to roughly 386,000 m3 (809.6 ac fi-' mi2) of water per square kilometer could po- tentially be stored (i.e., water covering an acre of land at a depth of 15.2 in). Tem- porary water holding areas can be achieved through the use of simple struc- tures like berms to hold back water or tile drain control devices to manage subsur- face drainage and potential aboveground water storage (Don Pitts 1999). Flash- board risers at the lower end of fields, for example, have been shown to retain water
on the fields during the spring or winter, keeping nutrients from running off the fields to adjacent waters and protecting water quality (USDA 1996). After the threat of flooding has abated, the tempo- rary structures or plugs can be removed, releasing the water and restoring potential water storage capacity .
We use hydrograph data and data on flood storage volumes generated by the U. S. Geological Survey in Iowa City (Buchmiller 1998) to examine the feasi- bility of a policy that pays farmers to store water on their land during periods of extreme flood risk. Feasibility of the policy is defined not only in terms of the storage capacity of depressional areas that can, with relatively simple manipulations, be made to store water, but also the ex- pected benefits of contracting with farm- ers to allow their upper basin land to be temporarily flooded relative to what oth- erwise would be lost to damage caused by floods. We assume that farmers would be willing to use their land for water storage if they could be assured of roughly the same profit from the land as they could expect from its use in crop production.
How do the expected benefits of avert- ing flood damages, taking into account the costs and uncertainties of a nonstruc- tural means to flood prevention, compare to the status quo? The agricultural land that we considered includes depressional areas that may have once been wetlands but also non wetland crop and pasture land that can be made temporarily to store water through the use of simple structures.
Study Area, Methods, and Analysis
The method for hydrographic analysis of floodwater discharge and volume, and the Geographic Information System (GIS) analysis (U.S. Department of the Interior 2OOO)of potential storage volume and hectares of land potentially available for water storage are described in Buch- miller et al. (1998). Flood storage is de- fined as the potential storage capacity of upland depressional and other areas that with lowscale engineering techniques could be made to store water and hence to reduce the peak flow runoff associated with flooding events.
We derive our estimates of flood stor- age costs using estimates of hectares of land that would be necessary to store the flood discharge volumes. These estimates, though plausible because they are based upon past discharge events, must not be construed as the absolute minimum nec- essary land area to prevent actual flood events of various magnitudes that may occur. Because the intent of this paper was to explore the feasibility of a policy option, not to explore its implementional requirements, we used conservative as- sumptions regarding costs and benefits which, as indicated in the tables, tended to overestimate number of acres, and hence, the dollar cost. Finally, we esti- mate benefits from federal and local flood damage estimates and from actual outlays to farmers that were made under federally insured crop insurance and agricultural crop damage assistance.
Figure 1 : Iowa study areas (shown in patterns) in relation to 8-digit hydrologic units.
T H I R D QUARTER 2 0 0 0 286
Copyright ©
2000 Soil and Water C
onservation Society. All rights reserved.
w
ww
.swcs.org
55(3):285-295 Journal of Soil and W
ater Conservation

Table 1. Locations, dates, and volumes of selected floods in Iowa. Gaging 8-Digit Drainage Flood Events Flood Water Volume (in cubic meters, exceeding indicated RI) Station HUC Area
(hectares) 10 25 50 100 200 500 Crow Creek part of 4,610 Bettendorf, 611 6/90 662,121 197,280 18,865 0 0 0 at Bettendorf 070801 01 Iowa River 07080207 part 723,668 several communities 125,766,000 37,359,900 10,159,920 59,924 0 0 at Marengo of 07080208 on the Iowa R., 7/19/93 Clear Creek part of area 25,409 Coralville, 611 6/90 6,054,030 2,453,670 648,558 0 0 0 near Coralville 07080209 & 7/6/93 2,268,720 0 0 0 0 0 S. Skunk R. part of 81,558 Ames, 7/9/93 11,146,320 4,833,360 2,256,390 604,170 0 0 near Ames 070801 05 & 811 6/93 8,877,600 3,809,970 1,590,570 305,784 0 0 Squaw Creek part of 52,409 Ames, 6/17/90 2,355,030 691,713 15,289 0 0 0 at Ames 070801 05 & 7/9/93 19,604,700 10,529,820 6,904,800 4,377,150 2,133,090 358,803 Beaver Creek part of 92,725 Johnston, 711 0/93 18,741,600 10,048,950 521 5,590 1,972,800 224,406 0 near Grimes 071 00004 Raccoon River 07100007 891,247 W. Des Moines & 125,766,000 69,417,900 38,099,700 16,892,100 4,216,860 0 at Van Meter most of Des Moines, 711 0193
071 00006
at 38th St., 10230001 Sioux City
Perry Creek most of 16,861 Sioux City, 5/19/90 81 7,479 151,659 0 0 0 0
Most of the watersheds chosen for this study-the exceptions are Perry, Clear, and Crow Creeks-fall within the Des Moines Lobe, the most recently glaciated region that once contained a very high in- cidence of depressional, palustrine wet- lands (Figure 1). Table 1 lists the gaging station, the eight digit Hydrologic Unit Code (HUC) for the basins, the size of the drainage area upstream of the gaging station, recent flood events, and flood volumes exceeding various recurrence in- tervals (RI). HUC information was in- cluded because most economic data are only available by HUC. Figure 1 also shows the locations of the watersheds and their relation to the HUC. Figure 1 re- veals that some of the HUC areas were larger than the drainage basin and that some of the larger basins contained more than one HUC area. The lack of con- gruity between the study area and HUC may create some bias when data from HUCs are used to draw inferences to study area watersheds. This problem was addressed by using the most conservative assumption that would produce either higher cost estimates or lower estimates of benefits. The runoff had to have originat- ed from within the watershed and hence could be reduced by means of landscape management practices. Furthermore, the floodwater runoff must not be affected by dams or diversions.
The eight stations provided estimates of the volumes of water that were dis- charged during recent flood events in the respective watersheds and the likelihood that flood events of similar magnitude would occur, or the RI. The probabilities
are based on statistical analyses of 10 years or more of historical records at each gaging station.
For Crow Creek, which constitutes part of the much larger watershed, with eight digit USGS identification H U C 07080101, the gaging station is located at the bottom of a drainage area that covers 4,610 ha (11, 380 ac). O n June 16, 1990, a runoff event occurred that caused flooding at Bettendorf, during which a peak discharge of 218.2 m3 (7,700 ft2) of water per second passed the gaging sta- tion. The likelihood that a flood event of such magnitude will recur is once every sixty years. The volumes of flood water from this particular flood event exceeded a 10, 25, and 50 year RI at 662,121, 197,280, and 18,865 m3 (537, 160, and 15.3 ac fi-l), respectively. Depending on the level of flood protection available to the town, the above amounts provide a very rough estimate of the volumes of water that would have had to be stored upstream of the gaging station to have re- duce flood peaks and therefore flood damage for this particular event.
Since the volumes in excess of an RI can vary-sometimes greatly-we cannot generalize from these volumes for RI ex- ceeding all hture flood events. The town of Coralville was flooded twice in the past seven to ten years, once on June 16, 1990 and the second time on July 6, 1993 with flood discharges of 289 m3 (10,200 fi3) per second with a recurrence interval of 90 years and 191.6 m3 (6,760 fi3) with a recurrence value of 25 years, respectively. The total volume of water that would have had to be stored to have prevented a
flood with a 90 year RI is 6,054,030 m3 (4,910 ac fi-l), assuming that there was protection for at least a 10 year frequency event. For a flood that has a 25 year RI, the volume would be 2,453,670 m3 (1,840 ac fi-1) . To do so requires an his- torical analysis of how large the variability is with regard to flood RIs and floodwater discharges. Nevertheless, it does give us a rough and reasonably robust estimate of peak discharge volumes between RIs that can be used for assessing the feasibility, in general, of mitigation options.
Notice that the volumes in the example floods are volumes in excess of the RI at the gage. In order to prevent a flood in excess of the RI, that amount of water needs to be prevented from reaching the gage site at exactly that time, which is not a trivial feat. This has usually been ac- complished by designing diversion chan- nels or large dams for flood control. In our example, in lieu of natural or tempo- rary structures to direct flow, excess ca- pacity in terms of land would have to be contracted for in advance of an anticipat- ed high discharge event to account for the uncertainties regarding time and flow.
The Geographic Information System (GIS) procedure that was developed to identify hypothetical potential flood stor- age areas classified each cell within each watershed into four slope criteria accord- ing to differences in elevation among its eight neighboring cells: less than 2.%, 5.%, 7.%, and less than lo.%. Polygonal areas of less than 4 ha (10 ac) were arbi- trarily removed from the analysis on the assumption that these were too small to be considered as part of a comprehensive
287 J O U R N A L O F s o r L A N D W A T E R C O N S E R V A T I O N
Copyright ©
2000 Soil and Water C
onservation Society. All rights reserved.
w
ww
.swcs.org
55(3):285-295 Journal of Soil and W
ater Conservation
flood management strategy. Furthermore, polygonal areas that intersected streams identified as second order or greater were removed from the analysis based on the assumption that these areas were not up- land areas but were floodplain areas that might be inundated during a flood event. The remaining polygonal areas within each watershed were then summed ac- cording to slope criteria.
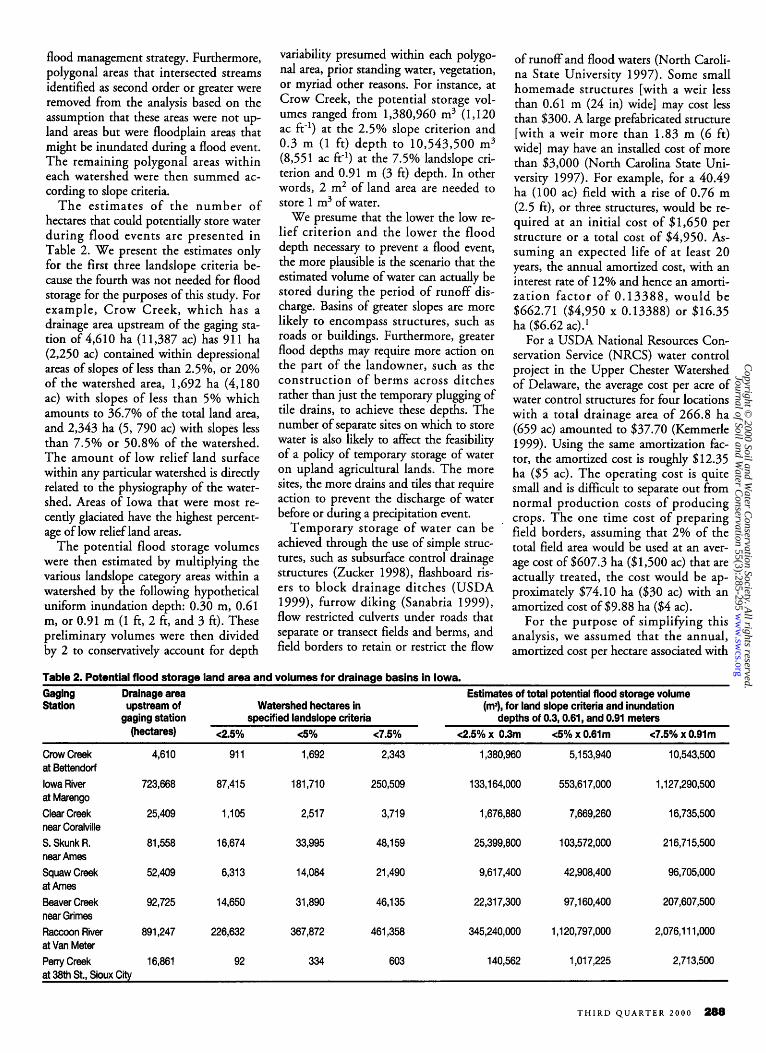
The estimates of the number of hectares that could potentially store water during flood events are presented in Table 2. We present the estimates only for the first three landslope criteria be- cause the fourth was not needed for flood storage for the purposes of this study. For example, Crow Creek, which has a drainage area upstream of the gaging sta- tion of 4,610 ha (1 1,387 ac) has 91 1 ha (2,250 ac) contained within depressional areas of slopes of less than 2.5%, or 20% of the watershed area, 1,692 ha (4,180 ac) with slopes of less than 5% which amounts to 36.7% of the total land area, and 2,343 ha (5 , 790 ac) with slopes less than 7.5% or 50.8% of the watershed. The amount of low relief land surface within any particular watershed is directly related to the physiography of the water- shed. Areas of Iowa that were most re- cently glaciated have the highest percent- age of low relief land areas.
The potential flood storage volumes were then estimated by multiplying the various landslope category areas within a watershed by the following hypothetical uniform inundation depth: 0.30 m, 0.61 m, or 0.91 m (1 fi, 2 fi, and 3 fi). These preliminary volumes were then divided by 2 to conservatively account for depth
variability presumed within each polygo- nal area, prior standing water, vegetation, or myriad other reasons. For instance, at Crow Creek, the potential storage vol- umes ranged from 1,380,960 m3 (1,120 ac ft-') at the 2.5% slope criterion and 0.3 m (1 ft) depth to 10,543,500 m3 (8,551 ac fi-l) at the 7.5% landslope cri- terion and 0.91 m (3 fi) depth. In other words, 2 m2 of land area are needed to store 1 m3 ofwater.
We presume that the lower the low re- lief criterion and the lower the flood depth necessary to prevent a flood event, the more plausible is the scenario that the estimated volume of water can actually be stored during the period of runoff dis- charge. Basins of greater slopes are more likely to encompass structures, such as roads or buildings. Furthermore, greater flood depths may require more action on the part of the landowner, such as the construction of berms across ditches rather than just the temporary plugging of tile drains, to achieve these depths. The number of separate sites on which to store water is also likely to affect the feasibility of a policy of temporary storage of water on upland agricultural lands. The more sites, the more drains and tiles that require action to prevent the discharge of water before or during a precipitation event.
Temporary storage of water can be achieved through the use of simple struc- tures, such as subsurface control drainage structures (Zucker 1998), flashboard ris- ers to block drainage ditches (USDA 1999), furrow diking (Sanabria 1999), flow restricted culverts under roads that separate or transect fields and berms, and field borders to retain or restrict the flow
of runoff and flood waters (North Caroli- na State University 1997). Some small homemade structures [with a weir less than 0.61 m (24 in) wide] may cost less than $300. A large prefabricated structure [with a weir more than 1.83 m (6 ft) wide] may have an installed cost of more than $3,000 (North Carolina State Uni- versity 1997). For example, for a 40.49 ha (100 ac) field with a rise of 0.76 m (2.5 fi), or three structures, would be re- quired at an initial cost of $1,650 per structure or a total cost of $4,950. As- suming an expected life of at least 20 years, the annual amortized cost, with an interest rate of 12% and hence an amorti- zation factor of 0.13388, would be $662.71 ($4,950 x 0.13388) or $16.35 ha ($6.62 ac).'
For a USDA National Resources Con- servation Service (NRCS) water control project in the Upper Chester Watershed of Delaware, the average cost per acre of water control structures for four locations with a total drainage area of 266.8 ha (659 ac) amounted to $37.70 (Kemmerle 1999). Using the same amortization fac- tor, the amortized cost is roughly $12.35 ha ( $ 5 ac). The operating cost is quite small and is difficult to separate out from normal production costs of producing crops. The one time cost of preparing field borders, assuming that 2% of the total field area would be used at an aver- age cost of $607.3 ha ($1,500 ac) that are actually treated, the cost would be ap- proximately $74.10 ha ($30 ac) with an amortized cost of $9.88 ha ($4 ac).
For the purpose of simplifying this analysis, we assumed that the annual, amortized cost per hectare associated with
Table 2 Potential flood storage land area and volumes for drainage basins in Iowa. Gaging Drainage area Estimates of total potential flood storage volume Station upstream of Watershed hectares in (ma), for land slope criteria and inundation
gaging station specified landslope criteria depths of 0.3,0.61, and 0.91 meters (hectares) <2.5% <5% 4 . 5 % ~2.5% x 0.3m ~ 5 % x 0.61m 4.5% x 0.91 m
~ ~~~ ~~~ ~
Crow Creek 4,610 91 1 1,692 2,343 1,380,960 5,153,940 10,543,500 at Bettendorf Iowa River 723,668 87,415 181,710 250,509 133,164,000 553,617,000 1 ,127,290,500 at Marengo Clear Creek 25,409 1,105 231 7 3,719 1,676,880 7,669,260 16,735,500 near Coralville S. Skunk R. 81,558 16,674 33,995 48,159 25,399,800 103,572,000 21 6,715,500 nearAmes Squaw Creek 52,409 6,313 14,084 21,490 9,617,400 42,908,400 96,705,000 at Ames Beaver Creek 92,725 14,650 31,890 46,135 22,317,300 97,160,400 207,607,500 near Grimes Raccoon River 891,247 226,632 367,872 461,358 345,240,000 1,120,797,000 2,076,111,000 at Van Meter Perry Creek 16,861 92 334 603 140,562 1,017,225 2,713,500 at 38th St., Sioux City
T H I R D Q U A R T E R 2 0 0 0 288
Copyright ©
2000 Soil and Water C
onservation Society. All rights reserved.
w
ww
.swcs.org
55(3):285-295 Journal of Soil and W
ater Conservation

installation and maintenance of simple structures or practices to enable tempo- rary water storage is $17.00. The actual amount is likely to be lower if one takes into account the direct benefits to farmers from controlled drainage and reduced sur- face runoff, and different, less conservative assumptions regarding the interest rate (lower) for amortizing the upfront costs.
We used the Conservation Reserve Program’s (CRP) average annual rental rate for the respective counties, minus the value of the land if it were used for graz- ing, as the starting point for estimating the revenue lost from foregoing crop pro- duction. The CRP is a federal program that contracts with farmers to retire crop land for ten year periods in return for an annual payment. Highly erodible land, wetlands and their associated upland areas, and lands important for the protec- tion of water quality are eligible for inclu- sion in the program. The CRP rental rate for the fifteenth (1 997) sign-up serves as a good indicator of what farmers demand for temporarily retiring land that could otherwise produce an agricultural crop. Where a watershed extends across a num- ber of counties, the average rental rate for all the counties is used. Acceptance of the land into CRP precludes most agricultur- al activities, including grazing, on land that is inconsistent with the natural re- source benefits that the land is expected to provide. On the other hand, this proposed program of paying for temporary water storage would allow grazing and other al- ternative uses of the land. The average cash rental rate for use of lands for grazing for the period 1992 to 1996 in Iowa was $77.93 ha ($31.56 ac) (USDA 1997).
The assumption implied by our choice of the CRP rental rate as a conservative estimate of the opportunity cost of tem- porary use of cropland for water storage is that producers are profit-maximizers and risk-averse. If the rental rate is high enough, they prefer a guaranteed pay- ment to an uncertain higher return for producing a crop. It is used as a good proxy high estimate of the cost of com- pensating farmers for temporarily using their lands for water storage, against which we compare the benefits of averted flood damages.
Under a program of contracting for temporary upper basin storage, costs would not accrue until owners of agricul- tural lands are alerted to take an action to retain water on their lands and a severe precipitation event occurs that results in the loss of revenue from the land. The opportunity cost to farmers can range
from nothing-if the action resulted in a delay in planting that did not result in a yield or expected revenue loss from the crops produced on that land-to a total loss of the crop and hence no profit. In the latter case, the opportunity cost that the government would have to pay farmers to enlist their land into the program would include both the cost incurred in putting in a crop that was subsequently lost and the loss of expected profit from the crop.
The CRP payment covers only what farmers expect for foregone profit from not growing a crop. Since it does not in- clude the cost of producing a crop, it does not necessarily represent a worst case estimate of outlay for using land for tem- porary runoff retention. We can fairly and reasonably assume, in the event of an extreme weather occurrence, that most land falling within our depressional areas would normally be eligible to receive fed- eral assistance from the U.S. Department of Agriculture’s Catastrophic Crop Insur- ance and Noninsured Crop Disaster As- sistance Programs2 agricultural assistance.
The programs provide an indemnity payment of 60% of the expected market price of the crops that would have been harvested from the land, which roughly represents the out-of-pocket expense to the producers of having put in the crop. If crop or disaster insurance coverage would continue under a contract for temporary runoff storage, then only the loss of po- tential profit for production of a crop on the affected land would have to be cov- ered by the flood mitigation program.
Manipulation of drainage or runoff for water storage could, under current rules of the crop insurance program, disallow crop insurance payments. In this case, ei- ther the rules governing federal crop in- surance indemnification and disaster as- sistance (just regarding to land covered by water storage contracts) would have to be changed or the contract agreement would also have to cover production costs when no other crop could be grown. Neverthe- less, in either case where the land is or is not under a water storage contract, the cost to the federal government for crop insurance or disaster assistance, on the one hand, or incurred costs in planting under a contract for water storage, on the other, is likely to be similar.
Furthermore, the activation of the con- ditions of the contract for temporary upper basin water storage would, under most circumstances, not result in the total loss of crop production for the year. In many, if not most cases, temporary water storage would not preclude its sub-
sequent use for agricultural production. The return on the land for agricultural production for that year would be expect- ed to be less, though not likely zero, as under the payment conditions of CRP. If temporary runoff storage occurs during the spring, the delay in spring planting may simply mean the planting of soy- beans rather than corn, a crop that re- quires a longer growing season. Alterna- tively, if water storage occurred after planting, the land may still allow for hay production or livestock grazing after seed- ing with a cover crop.
By entering into a contract for water storage in the event of extreme weather events, producers are, in effect, ensuring themselves against profit loss at little ad- ditional expense. The actual inducement for landowners to participate in the pro- gram, since it comes at little cost to them, need only be a fraction of the CRP rental rate. How much per unit of land short of the CRP rental rate depends largely upon: 1.) the landowners’ perception of the cost of installing and maintaining the devices; 2.) the time and effort necessary for maintaining and operating the prac- tices or devices for temporary upper basin storage; and 3.) what remaining profit farmers or landowners think they can make from draining the fields and pro- ducing a crop or agricultural commodity in what remains of the growing season. Since the intent of this study is to exam- ine the feasibility of a policy option, not to make the best prediction of the cost of actual implementation of a program in a specific area, we use the more conservative values that are more likely to overestimate rather than underestimate actual costs.
Most communities are not built in a 10 year flood plain, and hence, do not need protection against floods of 10 year recur- rence intervals. Nevertheless, some com- munities may need protection against a 25 year (or less frequent) flood event because the cost of removing structures to higher ground may be prohibitively expensive. Floods greater than 100 year events may represent an acceptable risk. Hence, the amount of land needed for storage and, consequently, the cost of the program de- pends upon the desired level of risk reduc- tion. In this analysis, we assume that com- munities want enough risk reduction to prevent, at the lowest cost, flood events of a given likelihood (or RI) or, stated alter- natively, to contain flood volumes that equate to or exceed the RI that corre- sponds to their most recent flood.
Table 3 indicates preliminary estimates of the floodwater volumes greater than the
289 J O U R N A L O F S O I L A N D W A T E R C O N S E R V A T I O N
Copyright ©
2000 Soil and Water C
onservation Society. All rights reserved.
w
ww
.swcs.org
55(3):285-295 Journal of Soil and W
ater Conservation

Table 3. Flood storage costs. Gaging Floodwater volume in Estimated # of Percentage of Hectares potentially Rental rate Estimated cost Station cubic meters greater hectares needed water-shed available at indicated per hectaret
than indicated RI for storaae* acreane lowest relief criterion
Crow Cr. 197,280 (25) $ 259 5.6% 911 (2.5%) $193 $ 49,919 Iowa R. 37,359,900 (25) $49,086 6.8% 87,480 (2.5%) $167 $ 8,173,309 Clear Cr. 2,453,670 (25) $ 3,224 12.7% 3,722 (7.5%) $157 $ 505,007 S. Skunk 2,256,390 (50) $ 2,965 3.6% 16,686 (2.5%) $190 $ 563,261 Squaw Cr. 6,904,800 (50) $ 9,072 17.1 % 14,094 (7.5%) $188 $ 1,704,810 Beaver Cr. 521 5,590 (50) $ 6,853 7.4% 14,661 (2.5%) $160 $ 1,094,561 Raccoon R. 38,099,700 (50) $50,058 5.6% 226,632 (2.5%) $158 $ 7,933,692 Perry Cr. 151,659 (25) $ 200 1.1% 334 (5%) $134 $ 26,882 * Assumes an average depth of 0.15 m of water storage per hectare and a doubling of the number of hectares to address uncertainties of flow and timing. t Assumes average CRP rental rates for the counties covered by the watershed.
indicated RI discharges that would have to be retained if discharge events similar to those in 1990 and 1993 were to occur in the future, as well as the amount of land to retain these volumes and estimates of the cost for the use of the land. If we assume that twice as much land is needed to store a given volume of water at a targeted depth of inundation because of prior standing water, vegetation, or myriad other reasons (i.e., 2 m2 of land area are needed to store 1 m3 of water), and we as- sume a doubling of this land area is neces- sary to compensate for uncertainties in flow and timing-a reasonable assumption that serves this discussion of policy, but one which would have to be tested in actu- al implementation of the program-we ar-
rive at an estimate of the amount of land for upper basin water storage to achieve protection against all but flood events of 100 year and greater frequencies. These es- timates of land areas vary from 1.1% of the watershed for Perry Creek to 17.1% for Squaw Creek upriver from Ames.
The cost associated with temporarily storing water on, these lands (not includ- ing the cost of the control structures) would range from a low of $134.42 ha ($54.44 ac) in the Perry Creek watershed to $192.74 ha ($78.05 ac) for Crow Creek. The cost per extreme precipitation event would range as high as $8,173,728 to provide protection against flood events with an RI of 25 years or greater in a wa- tershed of 723,668 ha (1,787,460 ac)
such as in the Iowa River watershed, to $26,882 for a small watershed, such as the Perry Creek watershed with a drainage area of 16, 861 ha (41,646 ac).
The net benefit of a program of tem- porary upper basin is measured in terms of the value of averting flood damages minus the cost of achieving the greater level of protection. With perfect hind- sight and, consequently, knowledge of the likelihood of an extreme weather event, the choices are clear, as shown by the data on damages in Table 4.
Presented for all floods are data on fed- eral outlays (by county) for Federal Emer- gency Management Administration (FEMA) disaster assistance for clean up and reconstruction, federally subsidized
Table 4. Outlays for crop insurance, disaster payments, CRP and FEMA clean up, and infrastructure costs. ci-
Federal crop insurance Agricultural disaster estimated CRP hectares Total annual
Flood year Flood year in county@es) CRP cost infrastructure costs (by county)’ (public and Gaging station 1990 1993 1990 1993 1997 incounty(ies) 1990 1993 1990-1997 residential)
FEMA approved flood clean up and costs outlay for counties covered* payments*
Crow Creek $381,611 __ 41.3 $1 1,257 $2,024,244 $954,464 Scott co. (Bettendorf)
Iowa River $36,288,412 $42,616,610 3,608.1 $847,657 $3,022,052 $3,349,886 Iowa, Benton, Tama, Poweshiek, Hardin, Marshall, Grandy, Franklin, Wright, Hancock Co.
Clear Creek $478,333 $5,676,349 $413,015 $7,995,535 4724.3 $1,103,129 $507,370 $5,784,765 $6,638,222 Johnson, Iowa Co. (Johnson)
South Skunk $13,613,155 $1 1,692,717 132.8 $35,416 $1 0,446,973 $1 1,943,415 $1 0,482,880 Story, Hamilton Co. (Hamilton, Story, (Story, Boone, (Ames, 1993)
Squaw Creek $1,176,937 $1 0,183,073 $43,065 $8,506,000 349.1 $92,030 $335,049 $1 0,446,973 $1 1,943,415 $1 0,482,880 Boone, Story, (Story) (Boone) (Hamilton, Story, (Story, Boone, (Ames, 1993 Hamilton Co. Boone Co.) Hamilton Co.)
Beaver Creek $4,753,088 $6,491,855 509.9 $123,470 $22,060,198 $24,522,714 Polk, Dallas, Boone Co. Raccoon River $28,568,549 $25,129,549 2800.6 $626,756 $5,258,898 $6,331,157 $197,353,000 Sac, Dallas, Guthrie, Greene, Carroll, Calhoun, Webster, Pocahontas, Buena Vista Co. (Des Moines,
Perry Creek $573,613 $355.542 2385.0 $509,572 $1,079,095 $3,412,916 Plymouth, Woodbury) Woodbury Co. *Information is only available by county and therefore must be considered only a rough approximation of the disaster outlays by study area watershed.
Boone Co.) Hamilton Co.)
1993)
T H I R D Q U A R T E R 2 0 0 0 290
Copyright ©
2000 Soil and Water C
onservation Society. All rights reserved.
w
ww
.swcs.org
55(3):285-295 Journal of Soil and W
ater Conservation
catastrophic crop insurance, and non in- sured agricultural disaster assistance. Data on uninsured or private flood costs to res- idences and businesses were not available for all watersheds and flood events. For most counties for the 1990 and 1993 floods, the bulk of the damages occurred to agriculture. Because the data are pre- sented by county, the monetary benefits of upper basin storage are only approxi- mated for the watersheds studied. Fur- thermore, since some of the watersheds share counties, total estimated county costs associated with flood damages are accounted for more than once in these in- stances. We include data on CRP land and its costs for purposes of comparison with federal outlays for agricultural land retirement in the indicated counties.
If risk managers could perfectly predict weather events and estimate exactly (or at least within reasonable bounds) the amount of land needed to retain peak dis- charge, they need only compare the cost figures in Table 3 with the damage esti- mates in Table 4 to determine the benefit of contracting for upper basin storage. For the Crow Creek watershed, the $50,000 cost of temporary water storage to reduce the risk of flooding for a one in for 25 year runoff event represents merely a fraction of the nearly $3 million in flood damages, as occurred in 1990. The cost of nonstructural flood risk reduction for Ames, Iowa to protect against 50 year frequency flood events amounts to $563,200 for the South Skunk and roughly $1.7 million for Squaw Creek. The averted damages amount to at least $21 million.
Finally, an expenditure of roughly $8 million for temporary upper basin storage in the Raccoon River Watershed could possibly avert nearly $208 million in flood damages to Des Moines and its resi- dential environs. In only one example, the Iowa River watershed, might con- tracting for water storage not make eco- nomic sense because the contracting cost would exceed $8 million, yet the benefits, in terms of flood damage averted, only amount to slightly more than $3 million. This ratio may change, however, with data on residential and unreimbursed private costs associated with historical flooding.
Unfortunately, risk managers must make decisions under uncertainty since neither can weather be predicted with sufficient accuracy to avert the issuing of false alarms to plug drainage ditches and store water, nor can the magnitude of precipitation events be precisely estimat-
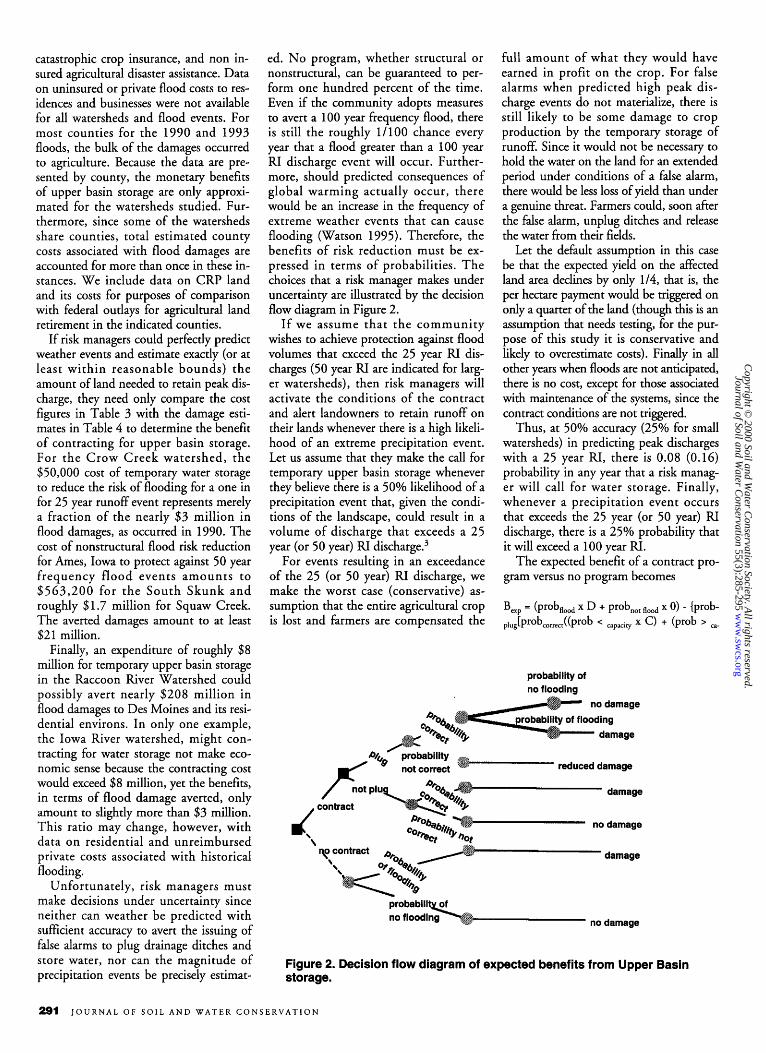
ed, No program, whether structural or nonstructural, can be guaranteed to per- form one hundred percent of the time. Even if the community adopts measures to avert a 100 year frequency flood, there is still the roughly 1/1OO chance every year that a flood greater than a 100 year RI discharge event will occur. Further- more, should predicted consequences of global warming actually occur, there would be an increase in the frequency of extreme weather events that can cause flooding (Watson 1995). Therefore, the benefits of risk reduction must be ex- pressed in terms of probabilities. The choices that a risk manager makes under uncertainty are illustrated by the decision flow diagram in Figure 2.
If we assume that the community wishes to achieve protection against flood volumes that exceed the 25 year RI dis- charges (50 year RI are indicated for larg- er watersheds), then risk managers will activate the conditions of the contract and alert landowners to retain runoff on their lands whenever there is a high likeli- hood of an extreme precipitation event. Let us assume that they make the call for temporary upper basin storage whenever they believe there is a 50% likelihood of a precipitation event that, given the condi- tions of the landscape, could result in a volume of discharge that exceeds a 25 year (or 50 year) RI di~charge.~
For events resulting in an exceedance of the 25 (or 50 year) RI discharge, we make the worst case (conservative) as- sumption that the entire agricultural crop is lost and farmers are compensated the
f i contract
full amount of what they would have earned in profit on the crop. For false alarms when predicted high peak dis- charge events do not materialize, there is still likely to be some damage to crop production by the temporary storage of runoff. Since it would not be necessary to hold the water on the land for an extended period under conditions of a false alarm, there would be less loss of yield than under a genuine threat. Farmers could, soon after the false alarm, unplug ditches and release the water from their fields.
Let the default assumption in this case be that the expected yield on the affected land area declines by only 1/4, that is, the per hectare payment would be triggered on only a quarter of the land (though this is an assumption that needs testing, for the pur- pose of this study it is conservative and likely to overestimate costs). Finally in all other years when floods are not anticipated, there is no cost, except for those associated with maintenance of the systems, since the contract conditions are not triggered.
Thus, at 50% accuracy (25% for small watersheds) in predicting peak discharges with a 25 year RI, there is 0.08 (0.16) probability in any year that a risk manag- er will call for water storage. Finally, whenever a precipitation event occurs that exceeds the 25 year (or 50 year) RI discharge, there is a 25% probability that it will exceed a 100 year RI.
The expected benefit of a contract pro- gram versus no program becomes
probability of no flooding
reduced damage
damage
no damage
damage
no damage
Figure 2. Decision flow diagram of expected benefits from Upper Basin storage.
291 J O U R N A L O F S O I L A N D W A T E R C O N S E R V A T I O N
Copyright ©
2000 Soil and Water C
onservation Society. All rights reserved.
w
ww
.swcs.org
55(3):285-295 Journal of Soil and W
ater Conservation

where: probplug = the probability in any year that the risk manager will activate contract conditions to store runoff
PrObflot plug =
pro flood =
the probability in any year that the risk manager will not activate contract condi- tions to store runoff the probability that a pre diction is correct the probability in any year that an extreme precipita- tion event will result in a peak discharge that exceeds the 25 year (or 50 year) RI the probability in any year that an extreme precipita- tion event will not result in a peak discharge that ex- ceeds the 25 year (or 50 year) RI the probability in any year that an extreme pre- cipitation event will result in a peak discharge that ex- ceeds the upper basin water storage capacity given con- tracts are activated the probability in any year that an extreme precipita- tion event will not result in a peak discharge that ex- ceeds the upper basin water storage capacity given con- tracts are activated
D = downstream flood damage (not including damage to agricultural crops)
C = expected cost of a program of contracting for upper basin storage.
Results In seven of the eight watersheds (Table
5), the expected benefits are positive given the assumptions described, suggest- ing that a risk manager, desiring to re- duce public and private costs associated with floods, could save money by con- tracting for upper basin storage. Only in the Iowa River watershed would contract- ing not necessarily make strict economic sense unless we make assumptions regard- ing the magnitude of private or unin- sured flood costs. By setting equation (1) to zero and solving for D, downstream flood damage, we find that contracting for upper basin storage becomes positive in the Iowa River watershed, if flood damages to be averted amount to at least $13.6 million. Deciding upon a lower
Table 5. Expected bend@ of temporary upper basin storage.
Gaging station Expected benefits Crow Creek $ 85,864 Iowa River ($ 318,025) Clear Creek $ 138,194 S. Skunk River $ 195,219* Squaw Creek $ 166,677* Beaver Creek $ 193,238 Raccoon River $ 1,827,772 Perry Creek $ 30,498 * Overestimation of benefits is due to
impossibility of breaking out separate flood disaster costs that are aggregated by county.
level of risk reduction, such as protection against a precipitation event that can re- sult in a 30 year RI peak discharge, serves to reduce the magnitude of D required to less than half of this amount and make temporary upper basin storage economic even for this watershed.
These results may underestimate the expected benefits of upper basin storage if a program of planned water retention on agricultural land also serves to reduce outlays for crop insurance and agricultur- al disaster assistance. The total volume of water in the watershed during an extreme precipitation event is likely to be retained on fewer hectares at greater depths rather than being spread out more thinly on a greater amount of land. Retaining runoff on upland agricultural lands also serves to reduce runoff and thus, reduce the likeli- hood of agricultural damage in the lower reaches of the watershed.
Without a detailed hydrological mod- eling analysis which is beyond the scope of this study, we cannot precisely estimate what the reduction in flood related agri- cultural damage would be from upper basin storage. Nevertheless, we do know that upper basin storage need only reduce agricultural costs by a small percentage to have a large impact on expected benefits. In the Iowa River watershed, for example, a 10% reduction in agricultural damage, or $8 million, would cause expected ben- efits to become positive since reductions in expenditures for agricultural damages on noncontract hectares would accrue whenever upper basin storage on contract land was triggered.
Discussion The results of the analysis of eight wa-
tersheds in Iowa suggest that a program of storing runoff in upper basin depres- sional areas to lessen the risk of floods, under a variety of reasonable circum- stances, lead to tangible savings to social welfare by preventing downstream flood
damages to communities. In addition, the reduction in peak runoff rates leads to re- duced sediment loss and decreased load- ing of such nutrients as phosphorus and nitrogen to surface water, which could re- sult in improved surface water quality (Zucker 1998; Person 1936; National Research Council 1993). Inclusion of in- tangible and other tangible benefits, such as those that would accrue to wildlife habi- tat or drinking or surface water quality, would tip the scales even further.
Upper basin storage complements a program of targeted land retirement that together have as a goal the prevention of floods and protection of water quality. The first part, as has been suggested by others (e.g., Hey and Phillippi; Con- stance Hunt; De Laney), involves the strategic targeting of the Wetland Reserve or Conservation Reserve Programs to- ward lands that can be restored to wet- lands and that can intercept intermittent late winter or spring runoff. Retiring the amount of land sufficient to retain the volume of water corresponding to the av- erage discharge from late winter or spring precipitation events would create a buffer between intensively managed cropland and surface waters. Though these lands may help in attenuating peak discharge during major rainfall events, their major role would be in reducing the loads of nu- trients and sediment to surface waters in normal years. In dry years or after flood storage benefits have been achieved, the land can be used for grazing or other uses consistent with their conservation plan.
Targeting the Wetland Reserve Pro- gram or the Conservation Reserve Pro- gram to lands that provide tangible eco- nomic benefits to local communities serves to offset, if not outweigh, the fed- eral cost of the program. In watersheds with already high concentrations of the 395,000 ha (975,000 ac) of restored wet- lands under the Wetland Reserve Pro- gram, protected under the Conservation Reserve Program, or in large sites over 405 ha (1000 ac), can be expected to have consequential impacts that will re- quire confirmation in a future study. In addition, state and federal funds-over $40 million of federal funds just in the past two years-expended for the pur- chase of floodplain easements to restore natural floodplain functions, should be expected to affect the frequency of flood- ing events over time.
All of the watersheds studied have a high percentage of hydric soils on crop- land. Though we cannot report the exact percentage because hydric soil informa-
T H I R D Q U A R T E R 2000 292
Copyright ©
2000 Soil and Water C
onservation Society. All rights reserved.
w
ww
.swcs.org
55(3):285-295 Journal of Soil and W
ater Conservation

tion is generally not available on water- sheds smaller than eight digit hydrologic units (only in the cases of Iowa River and Raccoon River watersheds is there close coincidence with the boundaries of the respective eight digit hydrologic units). Table 6 data suggest that from 16% for the smaller watersheds soils to almost 50% of the larger watershed soils are hy- dric and may have once been wetlands. For example, the Crow Creek watershed is part of the larger watershed designated as hydrologic unit 7080101 and 16% of this eight digit hydrologic unit consti- tutes agricultural land on hydric soils, amounting to roughly 26,649 ha (65,823 ac). Only 5,771.25 ha (14,255 ac) of palustrine wetlands (temporary wetlands typically found in upper basin land- scapes) remain, while 78% of the water- shed has agricultural cover. The water storage and denitrification functions of many of these hectares of hydric soils that formerly constituted wetlands could be restored if the hydrologic conditions were reestablished.
In some counties, existing CRP land could be retargeted to provide water stor- age in addition to wildlife, soil erosion, and water quality benefits. No new land would need to be retired. In the counties that encompassed Perry Creek, there were (in 1997) 2,385 ha (5,890 ac) devoted to CRP (Table 4). Yet only 810 ha (2000 ac) strategically targeted upstream in the Perry Creek watershed could provide sig- nificant protection against 10 year fre-
Table 6. Watershed characteristics.
quency runoff, assuming that three times the amount of land is necessary to retain the desired volume of runoff at the given depth.
Targeting CRP lands for flood storage benefits is already occurring in the Devils Lake Basin in North Dakota. Local, state, and federal agencies are collaborating in efforts to prevent the further rise of Spirit Lake, a lacustrine wetland in a closed wa- tershed with no natural drainage in nor- mal rainfall years, in order to avoid fur- ther flooding to the adjacent city of Devils Lake. The Texas Agricultural Ex- periment Station at Blackland Research Center estimates that the continuous for- age cover generally required of CRP land has resulted in 36% less runoff than from cropland under small grain rotations typi- cal for the area (Paul Dyke 1997).
Reducing the risk of highly costly, in- frequent flood damage would involve contracting with owners of land that con- tained depressional areas or land that can, with minor modifications, retain runoff. Contracts would require that landowners temporarily plug drainage ditches for the duration of extreme flood risk.
Contracts may in fact differ by location to also allow for the retention of spring runoff that frequently carries nutrients that would otherwise be discharged to surface water bodies. In exchange for retaining water on their lands, producers are com- pensated for their opportunity cost of not growing an agricultural crop or producing a crop of lower monetary value. Commu-
Hydric soils Hectares with Percent area Gaging station/ on cropland ag. cover on Wetlands having hydrologic unit (YO of watershed)* hydric soils* hectares ag. cover*
(palustrine)"
Crow Creek 16 part of 70801 01
26,649 5,771.25 78
Iowa River 42A4.4 165,564/61,884 4909.4/18,329.5 95/95 all of 07080207 & part of 07080208 Clear Creek 21 part of 07080209 S. Skunk River 31 part of 070801 05 Squaw Creek 31 part of 070801 05 Beaver Creek 51.2 part of 071 00004
69,903 9,744.7 95.6
127,737 285.5 94.8
127,737 285.5 94.8
197,964 100.0 90.4
Raccoon River 18.6b0.1 46,332/270,661.5 3,835.8/7,952.6 94.7/94.4 all of 07100007 & most of 07100006
most of 10230001 * Hectare figures relate to those in the eight-digit hydrologic unit (HUC). Where study water
Perry Creek 18.7 69,984 4,299.1 93
sheds represent only a portion of the HUC, figures are likely to exceed actual values.
nities that follow a policy of restricting de- velopment in areas subject to greater than one in 50 frequency flood events could set a goal of providing sufficient upper basin storage through contracts to prevent runoff events that exceed the 50 year threshold.
The cost to landowners of the minor modifications may be offset in large mea- sure by technical and financial assistance available through existing federal cost share and technical assistance programs, such as the Environmental Quality In- centive Program (USDA 1999b). The potential water quality benefits would justify the use of the funds for this pur- pose. The modifications, such as the con- trol structures in controlled drainage, could be implemented as part of a farmer's regular maintenance program for tile drains. An additional offset for the cost of the structures and practices would be the economic benefit that accrues in normal years, when there are no extreme weather events and hence need to store water above ground that could adversely af- fect crop production. Studies by the USDA NRCS suggest that a system of water table management, utilizing the same structures for upland aboveground water storage, can result in a positive net return on the capital investment (Zucker 1998).
Owners of land containing depressions or poorly drained soils, such as hydric soils, may already be receiving federal as- sistance in the form of federally subsidized crop insurance or agricultural disaster as- sistance. These lands could be covered by a contract that stipulates that the farmers would be compensated not just a portion of their costs associated with producing a crop, but also a bonus that corresponds to the profit that they otherwise would have received had a crop been harvested. The contract would require, however, that drainage ditches and other water con- veyances be plugged during the duration of flood events as a prerequisite for the bonus. These landowners would be paid for "harvesting" water for the years in which extreme weather events occur.
Storing runoff in depressional areas or areas that can be made to retain large amounts of water might actually reduce the total cost of crop insurance and disas- ter assistance, and thereby pay for the cost of the water storage bonus by de- creasing the total land affected by flood runoff. Alternatively, the bonus may come in the form of higher federal sub- sidy of the premium for crop insurance.
Finally, communities may prefer a pro- gram of prevention that serves, in effect,
293 J O U R N A L OF S O I L A N D WATER C O N S E R V A T I O N
Copyright ©
2000 Soil and Water C
onservation Society. All rights reserved.
w
ww
.swcs.org
55(3):285-295 Journal of Soil and W
ater Conservation

as an insurance policy to having to ex- pend considerable funds whenever there is a significant likelihood of flooding and consequent damages. By paying con- tractees an annual fee that is commensu- rate to the expected benefit, risk man- agers can reduce flood risk at a reasonable expense while providing an incentive to agricultural landowners to manage the landscape in such a way as to provide sig- nificant ongoing environmental benefits.
Conclusion The results of this study suggest that a
program of contracting with owners of upper basin agricultural land for tempo- rary storage of runoff from extreme pre- cipitation events can provide flood pro- tection and improved water quality at a reasonable cost. The contracts could stip- ulate that farmers would be compensated for any or, alternatively, a specific per- centage of the loss of expected income, perhaps on a five year or longer period.
The total cost is likely to be consider- ably below the expected outlays for flood damage related expenses. And unlike a program of wetland restoration alone where, under saturated soil conditions and low storage capacity, wetlands con- tribute minimally towards reducing peak floodwater discharge, temporary upper basin storage can renew storage capacity in anticipation of imminent extreme pre- cipitation events. After the threat of flooding has passed, the stored runoff can be discharged to surface waters to create new storage capacity. A combined pro- gram of temporary storage on agricultural land and strategic restoration of wetlands can help at least partially restore the eco- logical integrity of watersheds.
A policy of encouraging upper basin storage would have secondary benefits, which may not be easily monetizable. These include retaining nutrient enriched spring runoff for a sufficient amount of time to cause denitrification and reduced nitrate loading to surface water bodies.
The value of this measure is clear in consideration of the need to reduce total nutrient load to the Gulf of Mexico to ameliorate its hypoxia problem. Another is providing wildlife habitat at critical spring and early summer flyover and nesting peri- ods. Retaining water on the land for longer periods in the late winter and early summer serves to recharge ground water, raise surface water flows in summer months, and reduce the risk of droughts. The need for greater flood and drought mitigation measures is likely to become greater if the current predictions of global
warming and greater fiequency of extreme weather events are realized (Watson 1996).
This analysis does not provide suffi- cient information to indicate definitively the amount of land for storing runoff that would have prevented the actual floods that occurred in the watersheds indicated. Additional information on time of travel is needed, as well as the level of protec- tion for the frequency of flood events that a community could withstand without material damage. However, it does sug- gest that there are sufficient hectares of upper basin depressional storage capacity to mitigate, if not prevent, flooding events, and that storing water through temporary restoration of wetland func- tions could serve as a cost effective alter- native means towards flood mitigation.
Though there has been no examination of the costs and difficulty of administering the program or those of design and engi- neering, this problem is not likely to be insurmountable if the program were to be assumed under the aegis of the U.S.D.A.’s Natural Resource Conservation Service N.R.C.S. The NRCS, whose mission is to provide assistance to agricultural produc- ers to achieve a variety of conservation ob- jectives, has both the expertise and the technical assistance material for the rela- tively simple structures and practices that would be necessary to implement a pro- gram of temporary upland water storage. In fact, all of the practices are either cov- ered in its National Engineering Hand- book (USDA 1999) or, in the case of re- stricted flow culverts under roads that intersect agricultural lands, allow for straightforward design for the conditions of the land and water storage needs.
Hydraulics for reducing flooding through storing excess water in upland areas was not studied. Nor were intangi- ble benefits of the temporary restoration of wetland functions (e.g., terrestrial wildlife or carbon sequestration to miti- gate greenhouse gas emissions) examined. A followup study is necessary to investi- gate the specific practicality of upper basin storage in the respective watersheds, and to determine the extent to which flood water retention on specific upper basin lands could have mitigated flooding in previous years.
Finally, the problem of coordination among landowners for temporary water storage was not explored. If a storage or depressional area is transected by two or more property boundaries, all owners of the lands must agree on participation in the program. The need for consensus among landowners could conceivably lead
to higher payments for water storage as each individual landowner seeks to negoti- ate a contract that provides higher pay- ments than those made to neighbors. Al- ternatively, only potential storage area that lies within an individual producer’s land is considered or a quasi governmental struc- ture, such as a drainage or flood district would be established in the watershed that would set limits on contractual payments. Though an important problem, it deserves a separate and thorough examination be- fore a program, such as the one proposed here, is attempted in a watershed.
ENDNOTES
According to North Carolina State University Ex- tension, controlled drainage can, under many cir- cumstances, result in increased profit to farmers through reduced crop production costs. Therefore, estimating the net cost of structures for the purpose of upland storage is difficult.
According to the March 1998 USDA Farm Service Agency Farm Program fact sheet on the Noninsured Crop Disaster Assistance Program, 1998 payments are made based on 60% of the average market price of the crop. After 1999, the pertinent figure is 55%. Similarly, the March 1997 fact sheet on the Cata- strophic Crop Insurance Program states that the in- demnity payment is 60% of the expected market price. Consideration of other agricultural disaster as- sistance programs, such as the Emergency Loan h- sistance Program, may actually increase the ratio of assistance to crop market value to greater than 60%.
According to meteorologists contacted at the Na- tional Weather Service and at state agencies, quanti- tative precipitation forecasting (QPF), though still in its inhcy, can predict the quantity of precipitation in a watershed and the likelihood of flooding with a reasonable degree of accuracy and reliability-the latter quantified in a number of watersheds. The rule of thumb for predictions of the likelihood of rainfsll events exceeding a given quantity in large watersheds is 50%. For smaller watersheds, it is 25%.
Disclaimer The views and opiniom expressed in this paper are those of the author and not necessarily of the US. En- vironmental Protection Agency. Nor do the results sug- gest policies of the federal government, unless expressly indicated,
REFERENCES CITED Alexander, R.B., R.A. Smith, and G. E. Schwartz,
N.N. Rabalais, R.E. Turner, and W.J. Wise- man, Jr. 1996. Reported in the U.S. Depart- ment of Agriculture (USDA), Natural Resources Conservation Service. 1996. America’s private land: a geography of hope. Washington, D.C.: U.S. Government Printing Office. Louisiana Universities Marine Consortium #RWH. 1606.
Buchmiller, R., A. Manale, D. Eash, and C. Harvey. 1998. Volumes of recent floods and potential for storage in upland watershed areas. Report prepared for the United States Environmental Protection Agency under Interagency Agree- ment DW14937882.
T H I R D QUARTER 2 0 0 0
Copyright ©
2000 Soil and Water C
onservation Society. All rights reserved.
w
ww
.swcs.org
55(3):285-295 Journal of Soil and W
ater Conservation

Carter, V.P. 1998. U.S. Geological Survey Team. Wetland hydrology, water quality, and associated functions. Pp 35-48. In: National water summa- ry on wetland resources, WSP 2425. Compiled by J.D. Fretwell, J.S. Williams, and J. Phillips. U.S. Geological Survey Team. Available from: http://water.usgs.gov/public/nwsumNP2425/i ndex. hunl.
De Laney, T.A. 1995. Benefits to downstream flood attenuation and water quality as a result of con- structed wetlands in agricultural landscapes. Journal of Soil and Water Conservation 50 (6):620-626.
Dyke, Paul. 1997. Fax communication March 13, 1998. Texas Agricultural Experiment Station, Temple, TX.
Evans, RO., RW. Skaggs, and R.E. Sneed. Econom- ics of controlled drainage and subirrigation sys- tems. North Carolina State University Agricul- tural Extension Service Pub. No. AG-397, n.d.
Federal Agriculture Improvement and Reform Act of 1996, H.R. No. 2854.
Goolsby, D.A., W.A. Gattaglin, and E.M.Thur- man. 1993. Occurrence and transport of agri- cultural chemicals in the Mississippi River basin, July through August 1993. Denver: U.S. Government Printing Office
Hey, D.L. and N.S. Philippi. 1997. Reinventing a flood-control strategy. In: Freeman, G.E., and A.G. Frazier, (eds). Proceedings of the scientific assessment and strategy team workshop on hy- drology, ecology, and hydraulics. Collected in: Vol. 5 of Kelmelis, J.A. (ed). Science for flood- plain management into the 21st Century. U.S. Government Printing Office: Washington, D.C.
Interagency Floodplain Management Review Com- mittee. Administration Floodplain Management Task Force. 1994. Sharing the challenge: flood- plain management into the 21st Century. Wash- ington, D.C.: U.S. Government Printing Office.
Karl, T. 1999. Detection of climate change. National Climate Data Center. Available from: hKp://www.gcrio.org/USGCRP/sust.ain/karl.
Kemmerle, S. 1999. Telephone conversation with author, 8 November 1999.
Loucks, 0. 1995. Testimony before the Committee on Environment and Public Works, Subcom- mittee on Clean Air, Wetlands, Private Proper- ty, and Nuclear Safety. United States Senate. 104th Cong., 1st sess., 2 August, 1995.
Massachusetts Institute of Technology. Federal Emergency Management Agency (FEMA- MIT). 1997. Pp 1-57. Report on costs and ben- efits of natural hazard mitigation. Housed in the Mitigation Library. Available from: http://www.fema.gov/mit/.
National Research Council. 1993. Soil and water quality: an agenda for agriculture. Washington, D.C.: National Academy Press.
North Carolina State University. Agricultural Ex- tension Service. 1997. Informational pamphlet. North Carolina State University, Agricultural Extension Service: self published.
Person, H.S. 1936. Little waters: a study of headwa- ter streams and other little waters: their use and relations to the land. Study conducted for the Natural Resources Conservation Service, U.S. Department of Agriculture. Washington, D.C.: U.S. Government Printing Office.
Pitrs, D. 1999. Drainage management fact sheet: background information on the Illinois NRCS drainage management pilot project. Illinois: Natural Resource Conservation Service. Self published informational pamphlet.
Sanabria, J., J.D. Atwood, P.T. Dyke, J.R. Williams, and A.P. Manale. 1999. Extreme events of precipitation and land management
practices for mitigation of floods. In: D.L. Cane (ed). Proceedings of the American Water Re- sources Association 2000 Spring Specialty Con- ference on water resources in extreme environ- ments. Held May 1-3,2000 in Anchorage, AK.
Turner, RE. and N.N. Rabalais. 1991. Changes in Mississippi River water quality this century. BioScience 41:140-147. In: C.E. Hunt. 1997, A natural storage approach for flood damage re- duction and environmental enhancement. U.S. Geological Survey. Environmental Management Technical Center, Onalaska, WI No. LTRMP
Upper Midwest Aerospace Consortium (UMAC) . 1999. Housed under Climate and Weather > Climate Variability & Change available from: http://www.umac.org/.
U.S. Department of Agriculture (USDA). Soil Con- servation Service and Iowa State University Sta- tistical Laboratory. 1987. Basic statistics: 1982 national resources inventory. Washington, D.C.: U.S. Government Printing Office. Station Bull. No. 756.
U.S. Department of Agriculture (USDA). 1984. Soil conservation service engineering field man- ual. Chap. 8: Terraces. Washington, D.C.: U.S. Government Printing Office.
U.S. Department of Agriculture (USDA). Natural Resources Conservation Service. 1996. Ameri- ca’s private land: a geography of hope. Washing- ton, D.C.: U.S. Government Printing Office.
U.S. Department of Agriculture (USDA). 1997. Economic Research Service. Agricultural re- sources and environmental indicators. 1994 ed. Stock No. AH-705. Available from: http://www.econ.ag.gov/Briefing/arei/arei.htm.
U.S. Department of Agriculture (USDA). 1999. Natural Resources Conservation Service nation- al engineering handbook. Part 624: Drainage. Chapped. 10: Water table control. Washington, D.C.: U.S. Government Printing Office.
U.S. Department of Agriculture (USDA). 1999b. Natural Resources Conservation Service pro- grams. Conservation Operations Division (COD), Environmental Quality Incentives Pro- gram (EQIP) summary. Available from: http://www.nhq.nrcs.usda.gov/PROGRAMS/C ODIcitleqipsmry. html.
U.S. Department of the Interior. August 2000. Vol- umes of recent flood and potential for storage in upland watershed areas of Iowa. U.S. Geological Survey Fact Sheet FS-097-00.
Watson, R.T., M.C. Zinyowera, and R.H. Moss (eds). 1996. Climate change 1995: impacts, adaptations and mitigation of climate change: scientific-technical analyses. Contribution of Working Group I1 to the Second Assessment Report of the Intergovernmental Panel on Cli- mate Change. United Kingdom: Cambridge University Press.
Wiche, G.G., S.K. Jensen, J.V. Baglio, and 0. Domingue. 1990. Application of digital eleva- tion models to delineate drainage areas and compute hydrologic characteristics for sites in the James River Basin, North Dakota. Open File Report No. 90-593. U.S. Geological Sur- vey. In: Preliminary report of the Scientific As- sessment and Strategy Team. Interagency Floodplain Management Review Committee re- port to the Administration Floodplain Manage- ment Task Force. Science for floodplain man- agement into the 21st century, blueprint for change. Part V. Washington, D.C.: U.S. Gov- ernment Printing Office.
Zucker, L.A., and L.C. Brown (eds). 1998. Agricul- tural drainage: water quality impacts and sub- surface drainage studies in the midwest. Ohio
State University Extension, The Ohio State University Bull. No. 871.
97-SOO5.
295 J O U R N A L O F S O I L A N D WATER C O N S E R V A T I O N
Copyright ©
2000 Soil and Water C
onservation Society. All rights reserved.
w
ww
.swcs.org
55(3):285-295 Journal of Soil and W
ater Conservation


![Flood Risk Zonation Using GIS Techniques: District ... · Floods are causing vast socio-economic damages in the South Asian countries in the last few decades [4]. Flood problem has](https://img.dokumen.tips/doc/110x75/5e7216e783a628712b3f9d52/flood-risk-zonation-using-gis-techniques-district-floods-are-causing-vast-socio-economic.jpg)