Embed Size (px)
Citation preview

I-95 Corridor Coalition Vehicle Probe Project Evaluation – Summary of Arterial Reports 1 Vendors: HERE, INRIX, TOMTOM September 2019
Prepared for:
I-95 Corridor Coalition
Sponsored by:
I-95 Corridor Coalition
Prepared by:
Zachary Vander Laan and Elham Sharifi
University of Maryland, College Park
Acknowledgements:
The research team would like to thank Coalition member states and their
respective state highway officials for helping facilitate data collection for the
validation efforts used in this report.
I-95 Corridor Coalition
Vehicle Probe Project:
Update on Validation of Arterial Probe Data
Summary Report
I-95 Corridor Coalition Vehicle Probe Project Evaluation – Summary of Arterial Reports 2 Vendors: HERE, INRIX, TOMTOM September 2019
Table of Contents List of Figures .............................................................................................................................. 2
1. Background ......................................................................................................................... 5
Summary of previous arterial validation report findings ............................................ 5
2. Case Study Locations ......................................................................................................... 7
3. Case Study Analysis Methods ........................................................................................ 10
3.1 Traditional Validation Method ............................................................................ 10
3.2 Slowdown Analysis Method ................................................................................ 12
4. Summary of Case Study Results .................................................................................... 14
4.1 Traditional Validation ........................................................................................... 14
4.2 Slowdown Analysis ............................................................................................... 17
5. Conclusions ....................................................................................................................... 25
Appendix ................................................................................................................................... 28
List of Figures Figure 1 – VPPII case study locations used for analysis in this report. .......................................................................... 7 Figure 2 - Sample of fully captured slowdown. ..................................................................................................... 12 Figure 3- Sample of partially captured slowdown. ............................................................................................... 13 Figure 4 - Sample of failed to capture slowdown. ................................................................................................. 13 Figure 5 –AASE compliance percentages for VPPI and VPPII case studies. ..................................................... 15 Figure 6 – SEB compliance percentages for VPPI and VPPII case studies. ........................................................ 15 Figure 7 – Summary of AASE values for VPPI and VPPII case studies. ............................................................ 16 Figure 8 – Summary of SEB values for VPPI and VPPII case studies. ................................................................ 16 Figure 9 – Summary of slowdown analysis performance for VPPI and VPPII studies.................................... 19 Figure 10 - Percent of failed to capture slowdowns versus signal density. ....................................................... 20 Figure 11 - Percent of failed to capture slowdowns versus average AADT. ..................................................... 21 Figure 12 – Slowdown performance by signal density (left) and AADT (right) ranges. ................................. 24
List of Tables Table 1 - VPPI case study locations and attributes .................................................................................................. 8 Table 2 - VPPII case study locations and attributes ................................................................................................ 9 Table 3 - Example of Traditional Error Metrics ..................................................................................................... 11 Table 4 – Overall slowdown analysis results across all corridors for VPPI and VPPII case studies .............. 18 Table 5 - Statistics of failed to capture slowdowns across VPPI and VPPII case studies ................................. 20 Table 6 – Simple linear regression results for slowdown performance based on signal density. ................... 21 Table 7 – Simple linear regression results for slowdown performance based on AADT. ............................... 21 Table 8 – Distribution of VPPI slowdowns across road characteristic ranges. .................................................. 23 Table 9 - Distribution of VPPII slowdowns across road characteristic ranges. ................................................. 23
Table A. 1 –Traditional AASE and SEB error metrics for old case studies (VPPI) ................................................................ 28
Table A. 2–Traditional AASE and SEB error metrics for new case studies (VPPII Vendor 1) ............................................. 29
Table A. 3 – Traditional AASE and SEB error metrics for new case studies (VPPII Vendor 2) ........................................... 30
Table A. 4 - Traditional AASE and SEB error metrics for new case studies (VPPII Vendor 3) ............................................ 31
Table A. 5 - Slowdown analysis results on old case studies (VPPI) ........................................................................................ 32
Table A. 6 - Slowdown analysis results on new case studies (VPPII) ..................................................................................... 33

I-95 Corridor Coalition Vehicle Probe Project Evaluation – Summary of Arterial Reports 3 Vendors: HERE, INRIX, TOMTOM September 2019
Executive Summary
At the beginning of 2013 the I-95 Corridor Coalition (I-95 CC) directed the Vehicle Probe
Project (VPP) validation team to begin focusing on signalized arterial roadways, seeking
to understand whether probe data – which was previously shown to be accurate on
freeways – performed similarly on arterials. In response, the VPP validation team
conducted nine data validation efforts along 14 corridors within the Mid-Atlantic region
between April 2013 and June 2014. While additional analysis techniques were developed
to evaluate arterial data quality, the same approach was used to obtain ground truth data;
Wireless re-identification traffic monitoring (WRTM) technology (Bluetooth and/or Wi-Fi)
equipment was deployed at strategic locations along the selected road segments and used
to obtain direct measurement of travel times from a sample of vehicles, serving as a
reference for comparison with VPP reported speeds.
After the initial report was written, the Vehicle Probe Project entered a second phase (i.e.,
VPPII), which introduced a probe data marketplace with three vendors: HERE, INRIX,
and TomTom. Between 2014 and 2018, 13 data collection activities were carried out on 23
corridors within the mid-Atlantic region for all three vendors using a similar evaluation
procedure. This report provides an update to the original arterial report, quantifying the
accuracy of VPPII data across 13 additional arterial datasets and two additional vendors,
and comparing these results to the original VPPI case studies. These results indicate that
probe data performance on arterials has improved since the original analysis in 2014. In
particular:
• Performance on the traditional analysis has improved, and VPPII probe data for
all three vendors is much more consistently within contract specifications for
traditional error measures (i.e., AASE and SEB) than was observed in the original
VPPI case studies in 2013-2014. This is improvement is observable both when
comparing vendor speeds to the ground truth Mean and Standard Error of the
Mean (SEM) band speeds.
• Performance on the slowdown analysis – the current preferred way to quantify
operational performance on arterials – improved dramatically relative to the VPPI
levels for all three vendors and is less strongly linked to AADT and signal
density. The average percentage of slowdowns missed by each vendor (an indicator of
slowdown performance) across corridors dropped by over 50%, resulting in improved
performance across a range of road characteristics.
Note that the case studies represent a finite range of road characteristics (e.g., AADT,
signal density), and the conclusions may not generalize to conditions outside the observed

I-95 Corridor Coalition Vehicle Probe Project Evaluation – Summary of Arterial Reports 4 Vendors: HERE, INRIX, TOMTOM September 2019
data (e.g., roads with extremely low volumes or high signal densities far beyond what was
observed in the case studies). However, within the observed range of observed road
conditions – particularly 0-3 traffic signals per mile and above 20k AADT, all three
vendors typically perform at a level that is suitable for planning and many operational
applications. This is a noticeable improvement from the results shared in the previous
report, where performance was more closely linked to road characteristics and degraded
significantly for signal densities over 2 signals per mile.
However, it is important to recognize that in contrast to freeways, signalized arterials
have complex traffic patterns that cannot be fully captured the way vendors currently
report data, which has not changed since the initial report was produced in 2015. One of
the main challenges is that vendors report a single average speed for each time period,
which cannot possibly capture bi-modal and other flow patterns that are common on
arterials. Thus, even as probe data is becoming increasingly useful on higher signal
density roads (as evidenced by strong slowdown analysis performance), it simultaneously
cannot fully describe complex traffic conditions - especially during typical (i.e., non-
slowdown) periods where there is more variation in speeds. Additionally, arterial probe
data tends to consistently error towards faster speeds during congested periods – although
the positive speed bias is less severe than was previously observed in the initial report.
Despite these fundamental issues, VPPII arterial speed data is more accurate than what
was observed in the previous report, able to better capture traffic slowdown events, and
suitable for use over a wider range of road characteristics. Based on these findings, the
validation team recommends the following next steps:
• The I-95 Corridor Coalition should continue to evaluate probe data quality on
arterials to benchmark vendor capabilities.
• Additional emphasis should be placed on refining analysis techniques for
evaluating data quality on arterials.
• The I-95 Corridor Coalition should engage probe data vendors to discuss whether
additional information can be reported on arterials

I-95 Corridor Coalition Vehicle Probe Project Evaluation – Summary of Arterial Reports 5 Vendors: HERE, INRIX, TOMTOM September 2019
1. Background
The University of Maryland (UMD), under the direction of the I-95 Corridor Coalition (I-
95 CC), has been responsible for evaluating the quality of Vehicle Probe Project (VPP)
commercial probe data since the program began in 2008. The first phase of the project
(VPPI) consisted of a single probe vendor – INRIX, and initially focused on quantifying
data quality on freeway road segments. After spending the first few years developing
methods and an intuition for data quality on freeways, the VPP validation team began
shifting its attention to arterials.
This focus on arterials resulted in a dedicated data collection effort between April 2013
and June 2014, resulting in nine deployments across 14 arterial corridors in the Mid-
Atlantic Region, and culminating in a comprehensive report summarizing the state of
probe data quality on arterials. This initial arterial report used three analysis techniques:
(1) the traditional validation analysis that had been used previous on freeways, which
computes precision and bias error metrics to quantify performance, (2) a slowdown
analysis to quantify the extent to which congestion events are captured , and (3) a
distribution analysis to evaluate recurring congestion patterns. Based on the results, the
VPP team summarized the overall quality of data, and provided insights on which
methods were most appropriate, as well as directions for future work. These findings are
summarized below for convenience.
After the initial report was written, the Vehicle Probe Project entered a second phase (i.e.,
VPPII), which introduced a probe data marketplace with three vendors: HERE, INRIX,
and TomTom. Between 2014 and 2018, 13 arterial data collections were carried out on 23
corridors within the mid-Atlantic region for all three vendors, and the data was evaluated
in a similar manner as the previous report. This report summarizes the performance for
all three vendors in comparison to previous result, focusing on the traditional and
slowdown analysis methods.
Summary of previous arterial validation report findings
At high level, the previous arterial report – through various analysis techniques - found
that probe data performance correlated most strongly with traffic signal density; higher
traffic signal density tended to correspond with lower accuracy. To a lesser extent, it
found that higher traffic volumes were positively correlated with probe data accuracy but
emphasized that even high volumes could not overcome the challenges posed by close
signal spacing. Based on the observed probe performance across a range of signal

I-95 Corridor Coalition Vehicle Probe Project Evaluation – Summary of Arterial Reports 6 Vendors: HERE, INRIX, TOMTOM September 2019
densities and Average Annual Daily Traffic (AADT) values, it made the following top-
level recommendations:
• Probe data was recommended for operations and performance measures for signal
density values less than or equal to 1 signal per mile and AADT values of at least
40,000.
• It was recommended that probe data should be used with caution for signal
densities between 1-2 signals per mile and AADT values between 20k-40k.
• It was NOT recommended for signal density values above 2 signals per mile and
AADT values below 20,000.
Additionally, the report also noted some fundamental issues that were observed through
the analysis – particularly that probe data tends to over-report speeds during congested
periods, and that complex flow patterns observed on arterials cannot be fully
characterized with the average speed values reported by vendors. For example, bimodal
speed distributions are sometimes observed in the ground truth data but cannot be
captured by a single VPP speed value that lacks information about speed variation. In the
case of multiple valid observed speeds, the VPP speed tended to track the higher speed –
a phenomenon referred to as optimistic bias.
It also commented on the suitability of the analysis techniques used to evaluate VPP data
quality on arterials. It noted that the traditional analysis that has been used extensively
for prior VPP validation cannot fully characterize performance on arterials; it is possible
to achieve acceptable error metric values without performing well - particularly when VPP
data is assessed against SEM band. It also indicated that the slowdown analysis provided
the best insight into whether VPP data accurately captured traffic conditions, and that the
distribution analysis was well suited for quantifying whether probe data can capture
recurrent congestion patterns.
Based on the findings, it made recommendations to the I-95 Corridor Coalition about how
to proceed, which included continuing to focus on data quality on arterials, utilizing and
building upon the analysis techniques in the report, and engaging data providers and
researchers to figure out how probe data can be reported in a more meaningful way.

I-95 Corridor Coalition Vehicle Probe Project Evaluation – Summary of Arterial Reports 7 Vendors: HERE, INRIX, TOMTOM September 2019
2. Case Study Locations
Figure 1 shows the locations of new (i.e., VPPII) case study locations used to evaluate
arterial probe data in this report, while additional information about all locations can be
found Tables 1 and 2. Table 1 summarizes the VPPI case studies from April 2013 through
June 2014 (i.e., the subject of the previous report), while Table 2 summarizes VPPII case
studies from December 2014 through November 2018 . Both tables contain the road name,
code that was assigned to each corridor, validation date, the bi-directional traffic volume
as reported by the Highway Performance management System (HPMS), and signal
density.
Figure 1 – VPPII case study locations used for analysis in this report.

I-95 Corridor Coalition Vehicle Probe Project Evaluation – Summary of Arterial Reports 8 Vendors: HERE, INRIX, TOMTOM September 2019
Table 1 - VPPI case study locations and attributes
Case
Study
Number
Data Set
(State-ID#) Road #
Corridor
Code
Validation
Date Span
Average
AADT
(in 1000)
Average
Signal
Density
1 NC-06 NC-55 1 Apr 30-May
13, 2013 25.0 2.1
2 MD-07 MD-355 2a July 6-20,
2013
44.0 3.9
MD-586 2b 34.0 3.1
3 NJ-11
US-1 3a Sep 10 - 24,
2013
70.0 0.7
NJ-42 3b 48.0 1.8
US-130 3c 42.0 2.0
4 NJ-12 NJ-38 4a Nov 5-19,
2013
46.0 1.8
NJ-73 4b 52.0 1.7
5 PA-05 US-1 5a Dec 3 - 14,
2013
45.0 4.1
US-322 5c 25.0 0.5
6 PA-06 PA-611 6a Jan 9 - 22,
2014
27.0 3.3
PA-611 6b 21.0 11.5
7 VA-07
VA-7 7a April 5-16,
2014
56.0 1.9
VA-7 7b 55.0 1.6
US-29 7c 21.0 5.0
8 VA-08 US-29 8 May 8-19,
2014 33.0 3.6
9 MD-08 MD-140 9a Jun 5-17,
2014
31.0 3.9
9b 42.0 1.2

I-95 Corridor Coalition Vehicle Probe Project Evaluation – Summary of Arterial Reports 9 Vendors: HERE, INRIX, TOMTOM September 2019
Table 2 - VPPII case study locations and attributes
Case
Study
Number
Data Set
(State-ID#) Road #
Corridor
Code
Validation
Date Span
Average
AADT
(in 1000)
Average
Signal
Density
11 VA-09 US-1 11 Dec 4 - 18,
2014 36.0 2.9
12 VA-10 US-1 12 Jan 15 - 28,
2015 22.0 1.2
13 NJ-13 NJ-37 13 June 30-July
12, 2015 39.8 1.0
14 NC-07 US-29 14a Nov 11 - 25,
2015
28.7 1.4
US-74 14b 57.8 1.0
15 GA-02
GA-141 15a Feb 3 - 18,
2016
43.2 2.3
US-41 15b 30.8 1.9
US-19 15c 146.5 0.0
16 MD-10 US-1 16a Mar 25-Apr
10, 2016
29.2 2.2
US-29 16b 62.0 1.5
17 PA-09
PA-3 17a Apr 20-
May 5, 2016
28.3 4.6
PA-23 17b 11.1 0.9
US-30 17c 23.4 4.6
18 VA-11 US-50 18 Sep 26-Oct
7, 2016 52.9 2.8
19 NJ-14
US-1/9 19a Nov 16 - 28,
2017
74.1 1.9
US-1 19b 90.4 0.9
US-9 19c 75.5 0.4
20 MD-12 US-40 20 Mar 19 - 30,
2018 40.3 2.4
21 NC-09 NC-55 21 May 8 - 20,
2018 28.9 2.1
22 GA-04
GA-21 22a
Oct 23-Nov
4, 2018
31.9 2.7
US-80 22b 22.2 2.3
E/W Bay
St 22c 20.9 5.7
23 PA-11 US-22 23 Nov 14 - 26,
2018 15.7 2.4

I-95 Corridor Coalition Vehicle Probe Project Evaluation – Summary of Arterial Reports 10 Vendors: HERE, INRIX, TOMTOM September 2019
3. Case Study Analysis Methods
Two analysis methods are used to evaluate each of the arterial case studies: (1) the
traditional validation method, and (2) a slowdown analysis method. The traditional
method evaluates the vendor data over all time (even if traffic conditions are
uninteresting), whereas the slowdown analysis focuses specifically on traffic
perturbations – an approach that makes it well-suited for evaluating operational
performance. Note that the original arterial report contained a third approach (i.e., the
sampled distribution method), but it is omitted here because it is no longer used regularly
for evaluation purposes.
3.1 Traditional Validation Method
The traditional (also referred to as standard) validation analysis consists of comparing
sampled ground truth (i.e., WRTM) speeds against vendor speeds over five-minute
intervals and quantifying the discrepancy in terms of two error metrics defined in the
contract specifications. This evaluation approach was originally created to evaluate VPP
data on freeways, and over time has also been used on arterials by adjusting the speed
bins to reflect typical speeds on arterial facilities.
WRTM speeds are summarized in terms of (space) mean speed and confidence band for
each five-minute period. The WRTM mean speed is an estimate of mean speed for the
entire traffic stream, while the confidence band accounts for uncertainty in the estimate
based on the number of samples and variability of observed speeds. Several statistical
measures were initially evaluated to define the width of this uncertainty band, all of which
are described and reported in the original report. Ultimately, the standard error of the
mean (SEM) measure was selected due to its simplicity and sensitivity to both variability
and number of observations used for calculations. The SEM is calculated as the standard
deviation (SD) of the ground truth measurements divided by the square root of the
number of ground truth data points (n) taken for a given time. In other words, SEM =𝑆𝐷𝑊𝑅𝑇𝑀
√𝑛. The confidence band based on this statistic (i.e., the SEM band) narrows when
there is a higher degree of confidence in the WRTM estimate (i.e., based on more
observations or less variation) and widens when there is less confidence, seeking to
capture the true mean about 95% of the time.
A statistical analysis of the data is conducted for four defined speed bins, where each five-
minute interval is associated with a speed bin based on its corresponding ground truth
space-mean speed (0-15 mph, 15-30 mph, 30-45 mph, 45+ mph for arterials; 0-30 mph, 30-
45 mph, 45-60 mph, 60+ mph for freeways). Reported probe speeds are compared to both
the space-mean and SEM band ground truth speed for each five-minute time interval, and

I-95 Corridor Coalition Vehicle Probe Project Evaluation – Summary of Arterial Reports 11 Vendors: HERE, INRIX, TOMTOM September 2019
the discrepancies are quantified in terms of two error metrics: Average Absolute Speed
Error (AASE) and Speed Error Bias (SEB), which are reported separately for each speed
bin. According to contract specifications, AASE and SEB values must be within 10 mph
and 5 mph, respectively, when compared with the SEM band.
Average Absolute Speed Error (AASE)
AASE is calculated by summing up the absolute difference between probe vendor speeds (𝑆𝑃) and
ground truth speeds (𝑆𝐺𝑇) for each time interval and taking the average over 𝑛 observations. That
is, AASE = 1
𝑛∑ |𝑆𝑃 − 𝑆𝐺𝑇|𝑛
𝑖=1 . Because the absolute value is used, positive and negative errors
cannot cancel, and the result is always positive.
Speed Error Bias (SEB)
Speed Error Bias is calculated similarly to AASE, with the difference that the absolute value of the
errors is not taken. In other words, SEB = 1
𝑛∑ 𝑆𝑃 − 𝑆𝐺𝑇
𝑛𝑖=1 . Thus, positive and negative errors can
cancel each other out, and the resulting value can provide insight into whether there is a consistent
positive or negative error.
A sample of corridor-level results from a recent validation is shown in Table 3.
Table 3 - Example of Traditional Error Metrics
Traditional Validation Metrics Example
Speed Bin
Average Absolute Speed
Error (<10mph)
Speed Error Bias
(<5mph) Number of 5
Minute Samples Comparison
with SEM
Band
Comparison
with Mean
Comparison
with SEM
Band
Comparison
with Mean
0-15 MPH 1.64 3.9 1.44 3.06 1587
15-25 MPH 1.49 5.15 1.03 3.48 5316
25-35 MPH 1.15 5.33 0.33 2.66 11125
>35 MPH 1.58 4.88 -1.38 -2.74 19731
All Speeds 1.44 5.01 -0.42 -0.03 37759
It should be noted that the traditional methodology was originally designed for freeway
analysis and has been adjusted over time to accommodate arterial roads. However, as the
original report pointed out, the SEB band tends to be much larger on signalized arterials
– sometimes resulting in vendor speeds that are within the large confidence interval, but
do not accurately reflect traffic characteristics. Part of the challenge is systemic; vendors
report a single average speed for each time period, but complex traffic flow often has a
wide range of valid speeds, and in some cases two distinct modes, which cannot possibly
be captured by a single value.
It has been suggested that comparing vendor data with the mean ground truth value may
be a better solution, but this approach is also imperfect in the case of widely-varying or

I-95 Corridor Coalition Vehicle Probe Project Evaluation – Summary of Arterial Reports 12 Vendors: HERE, INRIX, TOMTOM September 2019
bimodal speeds. Accordingly, the traditional methodology continues to compare vendor
data to both the mean and SEM band ground truth speeds, and proper interpretation of
the traditional validation metrics should take these factors into consideration.
3.2 Slowdown Analysis Method
The slowdown analysis is an offshoot of the traditional analysis, developed to provide a
more intuitive measure of probe data’s ability to capture congestion events. The
definition of a slowdown in this context is when traffic speeds (as identified by ground
truth WRTM sensors) decrease by at least 15 mph for a period of one hour or more. On
slower speed arterials, the threshold may be reduced to a reduction in speed of 10 mph,
and the duration of 30 minutes or greater.
An analyst visually compares ground truth and vendor speeds for each slowdown event,
focusing on how well the vendor data captures the magnitude and duration of the speed
reduction. Each slowdown is ultimately classified as ‘Fully Captured’, ‘Partially
Captured’, or ‘Failed to Capture’ according to the following rules:
• A Fully Captured slowdown indicates that the probe data accurately characterized
both the reduction in speed, and duration of the slowdown. The error in speed
reduction or duration cannot exceed 20%.
Figure 2 - Sample of fully captured slowdown.
• A Partially Captured slowdown indicates that the probe data reported a significant
disruption to traffic, but the extent of speed reduction or duration of time were in
error by more than 20%.

I-95 Corridor Coalition Vehicle Probe Project Evaluation – Summary of Arterial Reports 13 Vendors: HERE, INRIX, TOMTOM September 2019
Figure 3- Sample of partially captured slowdown.
• Failed to Capture indicates that the probe data either completely missed the
slowdown, or the extent of speed reduction or duration of the event were
significant in error such that the slowdown would not be interpreted as a significant
disruption to traffic.
Figure 4 - Sample of failed to capture slowdown.
The slowdown analysis is a manual process that requires human judgment to classify each
slowdown event. However, the previous arterial report’s analysis indicated that this
method was the most capable of quantifying vendor performance – particularly for
operational purposes.

I-95 Corridor Coalition Vehicle Probe Project Evaluation – Summary of Arterial Reports 14 Vendors: HERE, INRIX, TOMTOM September 2019
4. Summary of Case Study Results
Both analysis methods (i.e., traditional validation and slowdown analysis) were applied
to the data collected from all three vendors along the arterial corridors for the 13 new case
studies. The results are summarized and discussed in this section, and tables containing
detailed information can be found in the Appendix.
4.1 Traditional Validation
As described in Section 3.1, the traditional analysis produces AASE and SEB error metrics
that compare vendor speeds to both the ground truth mean speed and standard error of
the mean (SEM) band (i.e., a proxy for the 95% confidence interval). The error metrics
from the original arterial report (i.e., old VPPI case studies) are reported in Table A.1,
while the results from the new case studies can be found in Tables A.2 (VPPII Vendor 1),
A.3 (VPPII Vendor 2), and A.4 (VPPII Vendor 3). Each table contains both AASE and SEB
scores separated by a slash (‘/’), where the number preceding the slash is the metric
assessed against the mean of the ground truth data and the number after the slash is the
same metric assessed against the SEM band.
Compliance with Contract Specifications
Comparisons assessed against the SEM band have historically been used for evaluating
vendor performance, although it is worth noting that the contract specifications were
initially designed with freeways in mind. Instances where vendors did not meet these
specifications (i.e., where vendor speeds were not within 10 MPH for AASE or ±5 MPH
for SEB when compared to the SEM band in each speed bin) are colored red in tables A.1-
A.4. These tables show clear improvement in vendor compliance between VPPI and
VPPII case studies; data was within specification for 93% of AASE and 67% of SEB
scores during VPPI, and these percentages improved to 100% of AASE and 83%-98%
(depending on vendor) of SEB scores during VPPII.
Figures 5-6 provide additional insight into vendor compliance, with Figure 5 focusing on
AASE, and Figure 6 on SEB. Both plots show the compliance percentages for each vendor
for each speed bin when vendor speeds are compared to the mean (left) and SEM band
(right). Even though the mean has not been used historically for making “pass/fail”
determinations, it is instructive to understand how the vendor speeds compare to the
(space) mean ground truth speed - particularly because arterials tend to have large
variations in traffic speed, which can at times obscure how well vendor data is performing.

I-95 Corridor Coalition Vehicle Probe Project Evaluation – Summary of Arterial Reports 15 Vendors: HERE, INRIX, TOMTOM September 2019
Figure 5 –AASE compliance percentages for VPPI and VPPII case studies.
Figure 6 – SEB compliance percentages for VPPI and VPPII case studies.
First consider Figure 5, and note the results for VPPI (i.e., the old case studies). Despite
strong performance when compared to the SEM band, the compliance rate when
compared to the mean is much lower for the lowest two speed bins. However, the results
for all three vendors in the VPPII case studies show much better performance when
compared to the mean – particularly for the two lowest speed bins that are known to be
more challenging. Figure 6 shows similar results, except the discrepancy in compliance
when comparing vendor data to the mean and SEM band is even more pronounced.
Nonetheless, despite rather low compliance rates when compared to the mean, all three
vendors do show noticeable improvement relative to the VPPI case studies.

I-95 Corridor Coalition Vehicle Probe Project Evaluation – Summary of Arterial Reports 16 Vendors: HERE, INRIX, TOMTOM September 2019
Overall Trends
Finally, it is useful to visually compare the error metrics contained in A.1-A.4 to identify
trends between VPPI and VPPII case studies - shown in Figures 7 (AASE) and 8 (SEB). In
each bar chart, the bar represents the mean error metric value for all validations in that
category, while the black line shows the value of the standard deviation. For example, in
Figure 7, the average AASE when compared to the mean (left plot) in old case studies (i.e.,
VPPI) for the 0-15 mph (blue bar) is just under 12 mph with a standard deviation around
5 mph.
Figure 7 – Summary of AASE values for VPPI and VPPII case studies.
Figure 8 – Summary of SEB values for VPPI and VPPII case studies.
I-95 Corridor Coalition Vehicle Probe Project Evaluation – Summary of Arterial Reports 17 Vendors: HERE, INRIX, TOMTOM September 2019
A few general trends are evident from Figures 7 and 8. First, all three vendors are, on
average, producing AASE and SEB error metrics that are better than what was observed
initially in VPPI – both when compared to the mean and SEM band. Given that
comparisons with the SEM band are not as meaningful when there are large speed
variations on the road, improvements when compared to the mean are encouraging, and
indicate that the data quality has improved. Additionally, while the lowest two speed
bins still appear to be the most challenging for vendors, the extent to which this is the case
is less for the new case studies. Finally, on average, all three vendors tend to overestimate
speeds in the 0-15, 15-25 and 25-35 speed bins (i.e., positive bias), and underestimate them
in 35+ speed bin (i.e., negative bias). However, the magnitude of these biases is much
lower in the VPPII case studies for all three vendors than for the old case study. This
last point relates to findings from the previous arterial report, which observed that probe
data tends to overestimate traffic speed during congestion. While this appears to still be
the case for all three vendors, the phenomenon is less pronounced.
4.2 Slowdown Analysis
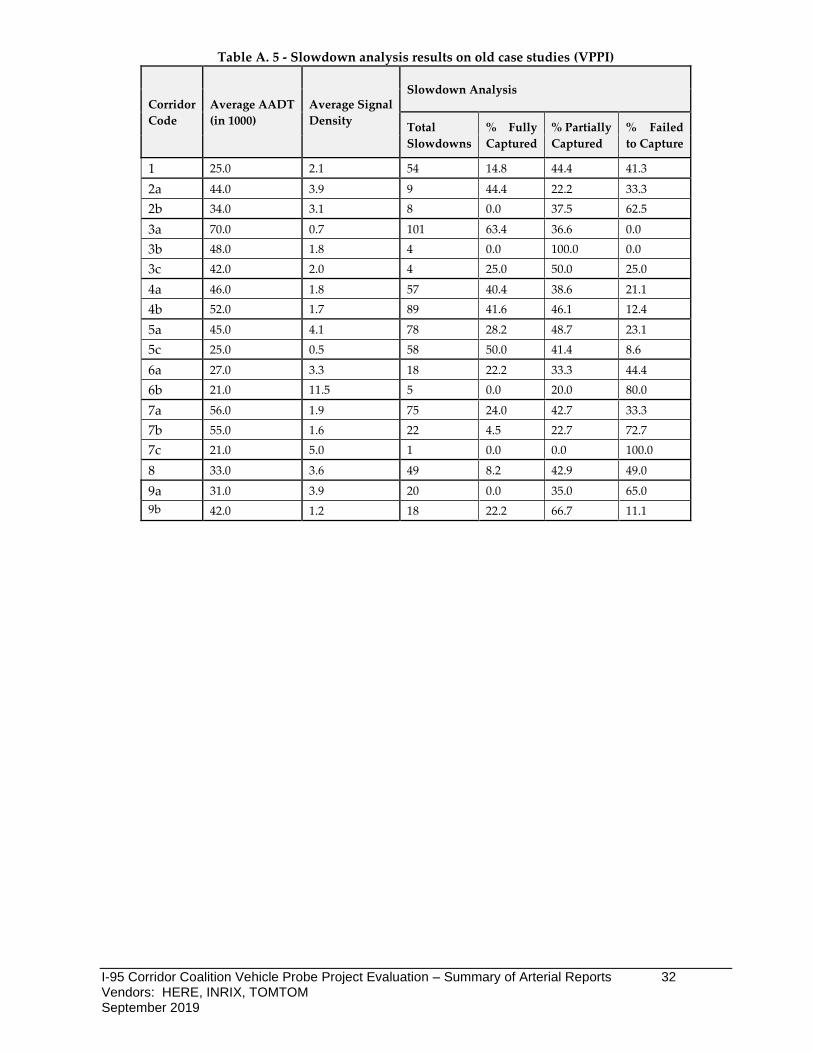
The results of the slowdown analysis for old and new case studies are summarized in
Tables A.5 and A.6, respectively. Each table shows the total number of slowdowns and
the percent fully captured, partially captured and failed to capture for each corridor within
the case studies, as well as roadway information that was previously found to correlate
with slowdown performance. The following sections analyze the data from various
perspectives.
Overall Performance
First, it is useful to compute the overall slowdown performance across all observed
slowdowns (regardless of corridor), a perspective that gives a high-level view of overall
slowdown accuracy. A key advantage to this approach is that it gives equal weight to all
slowdown events, but a potential disadvantage is that the overall accuracy may be overly
influenced by observations on a few corridors, which may not be representative of all road
types. To this point, note that the number of slowdowns observed on old VPPI case studies
ranges from 0-101 with mean = 35.2 and median = 20, and from 0-140 with mean = 29.3 and
median = 17 on new VPPII case studies. Thus, for both VPPI and VPPII case studies,
there is significant variation in the number of slowdowns, meaning that some corridors
contribute much more than others to the overall performance.
Table 4 summarizes the overall slowdown performance for each vendor across all case
studies using the data from Tables A.5 and A.6. It clearly shows that all vendors
performed much better on the slowdown analysis in new VPPII case studies than the VPPI

I-95 Corridor Coalition Vehicle Probe Project Evaluation – Summary of Arterial Reports 18 Vendors: HERE, INRIX, TOMTOM September 2019
data showed on old case studies; the percentage of fully captured slowdowns improved
from 33% to 59-66% (depending on the vendor), and percentage of failed to capture
dropped from 25% to 6-10%. Furthermore, it highlights the fact that all three vendors are
generally within 5% of one another, indicating that the slowdown performance differences
are minor at the aggregate level. However, because these results consider all slowdowns
– which are not evenly distributed among case studies, these results can be heavily
influenced by a few corridors that may not be representative of all road geometries.
Table 4 – Overall slowdown analysis results across all corridors for VPPI and VPPII case studies
Performance by Corridor
A second perspective is to compute slowdown performance independently on each case
study / corridor, as was done in the previous report. An advantage of this approach is
that it considers the varying road characteristics (e.g., signal density, AADT) associated
with each corridor, which may give better insight into “typical” performance on a range
of road geometries, and can be used to understand the conditions under which the data is
adequate. Furthermore, the results are not dominated by a single corridor with many
more slowdowns than the others, as can be the case when looking at overall performance.
However, the primary disadvantage of computing the accuracy separately for each case
study is that the slowdown performance on each corridor is equally weighted regardless
of the number of slowdowns observed. Since the number of slowdowns varies
dramatically across corridors, corridors with very few observations – where a single
slowdown classification can significantly change the accuracy – may produce results that
are less reliable than those with more slowdowns.
When considering the results from a corridor level perspective, a minimum slowdown
threshold was added to omit corridors with less than a minimum number of slowdowns.
This parameter was chosen to be 5 – around the 15-20th percentile in the distribution of
slowdowns on new case studies – and was introduced to try to prevent case studies with
extremely few opportunities for slowdown classification from being over-weighted in the
results. Please note that this filtering approach was not conducted in the previous report
but has been applied to the old VPPI case studies in this report for uniformity with the
new VPPII results.
Total
Slowdowns
Fully
Captured (%)
Partially
Captured (%)
Failed to
Capture (%)
Missing Data
(%)
VPPI 670 32.7 41.9 25.4 0.0
VPPII – Vendor 1 674 65.6 24.2 9.6 0.6
VPPII – Vendor 2 674 59.2 30.6 9.9 0.3
VPPII – Vendor 3 674 61.1 29.2 5.9 3.7

I-95 Corridor Coalition Vehicle Probe Project Evaluation – Summary of Arterial Reports 19 Vendors: HERE, INRIX, TOMTOM September 2019
Figure 9 summarizes the distribution of slowdown analysis performance across old and
new case studies via boxplots. The left set of boxplots in Figure 9 focuses on the percentage
of slowdowns that are “Fully Captured”, while the right set summarizes the percentage
that “Failed to Capture” slowdowns – both of which show that all three vendors’ ability
to fully capture slowdowns (and similarly avoid missing slowdowns) has improved
significantly in since the initial arterial report was produced.
Figure 9 – Summary of slowdown analysis performance for VPPI and VPPII studies.
The key summary statistics for “Failed to Capture” – used extensively in the original
arterial report as a strong indicator of arterial performance – are summarized in Table 5
and correspond to the right set of box plots in Figure 9. Notably, the average, median,
standard deviation and percentiles of new case studies for all three vendors improved
appreciably over the old case studies. For example, old case studies failed to capture
slowdowns 37% of the time on average, which is now less than 14% for all three vendors
(13.3%, 11.4%, and 4.2%). Furthermore, the improvement in slowdown performance (as
measured by percentage of failed to capture slowdowns) was also corroborated
statistically via hypothesis testing; the difference in mean “Failed to capture” percentages
between new and old case studies was statistically significant for all three vendors.

I-95 Corridor Coalition Vehicle Probe Project Evaluation – Summary of Arterial Reports 20 Vendors: HERE, INRIX, TOMTOM September 2019
Table 5 - Statistics of failed to capture slowdowns across VPPI and VPPII case studies
Summary Statistics
Across Case Studies
% Failed to Capture Slowdowns
VPPI VPPII
(Vendor 1)
VPPII
(Vendor 2)
VPPII
(Vendor 3)
Mean 37.1 13.3 11.4 4.2
Std. Deviation 24.9 22.8 16.9 6.1
Percentile-25 16.8 0.0 0.0 0.0
Percentile-50 33.3 0.0 7.7 0.0
Percentile-75 55.8 12.1 14.5 7.1
Additionally, it is instructive to see how slowdown analysis performance across corridors
corresponds to road characteristics. The previous arterial report found a positive
correlation between signal density and the percentage of “Failed to capture” slowdowns,
and to a lesser extent a negative correlation between AADT and the percentage “Failed to
capture” slowdowns – leading to recommendations about where probe data may be
considered trustworthy. A similar analysis that includes new case studies is repeated here;
Figures 10 and 11 show regression plots comparing “Failed to Capture” slowdowns to
signal density and AADT, respectively, while Tables 6 and 7 summarize the results
obtained via simple linear regression. It should be noted that most data points are within
a limited range of road characteristics in the new case studies, and care must be taken
when making judgements beyond that region (i.e., the trend lines beyond these regions
do not actually reflect observed results). Along these lines, the data points from old and
new case studies are based on slightly different road characteristic ranges, so the
corresponding regression coefficients may not be directly comparable. Nonetheless, this
approach allows general trends to be explored.
Figure 10 - Percent of failed to capture slowdowns versus signal density.

I-95 Corridor Coalition Vehicle Probe Project Evaluation – Summary of Arterial Reports 21 Vendors: HERE, INRIX, TOMTOM September 2019
Figure 11 - Percent of failed to capture slowdowns versus average AADT.
Table 6 – Simple linear regression results for slowdown performance based on signal density.
% Failed to Capture Signal Density (Intercept)
𝑹𝟐 # Corridors Coefficient p-val Coefficient p-val
VPPI 0.060 0.01 0.19 0.03 0.41 15
VPPII Vendor 1 -0.047 0.37 0.22 0.05 0.05 19
VPPII Vendor 2 -0.008 0.85 0.13 0.13 0.00 19
VPPII Vendor 3 0.028 0.03 -0.01 0.72 0.24 19
Table 7 – Simple linear regression results for slowdown performance based on AADT.
% Failed to Capture AADT (Intercept)
𝑹𝟐 # Corridors Coefficient p-val Coefficient p-val
VPPI -0.008 0.09 0.69 0.00 0.20 15
VPPII Vendor 1 -0.0029 0.09 0.27 0.01 0.16 19
VPPII Vendor 2 -0.0016 0.22 0.19 0.02 0.09 19
VPPII Vendor 3 -0.0003 0.59 0.05 0.06 0.02 19
Quality of probe data correlated best with signal density on old VPPI case studies.
Visually, the blue line in in Figure 10 shows the positive relation between signal density
and percent failed to capture slowdowns, which corresponds a coefficient of
determination (i.e., the percent of variation attributed to the least square regression on the
independent variable), 𝑅2, of around 0.41 and a statistically significant slope (low p-value).
However, on VPPII case studies (i.e., the yellow/green/blue lines), the relationship is less
clear and differs among vendors. The regression plots for VPPII Vendors 1 and 2 (yellow
and green) do not show meaningful correlation between probe quality and signal density,
a conclusion drawn from low 𝑅2 values (0.03 and 0.02, respectively) and a slope coefficient
with an unintuitive sign (i.e., negative slope) that is not statistically significant (indicated
by high p-values in Table 6). On the other hand, VPPII Vendor 3 does correlate to
slowdown performance and has a statistically significant slope – although its 𝑅2 value is
lower than VPPI. Furthermore, a key difference is that VPPII Vendor 3’s regression line
(red) is shifted much lower than the VPPI line (blue), indicating much better performance

I-95 Corridor Coalition Vehicle Probe Project Evaluation – Summary of Arterial Reports 22 Vendors: HERE, INRIX, TOMTOM September 2019
across the range of observed signal densities. Thus, even if there is some drop in
performance related to increased signal density (as is seen with VPPII Vendor 3 in the new
case studies, and may be expected intuitively), the slowdown performance – measured by
percent failed to capture slowdowns – appears to be at least as good as what was observed
for low signal densities on old VPPI case studies.
The VPPI case studies showed a negative correlation between AADT and percent failed
to capture-- although to a lesser extent than signal density, evidenced by an 𝑅2 of 0.20 and
marginally statistically significant regression line slope coefficient. While the new case
studies for all three vendors also show negative correlations, the goodness of fit is lower
for each (𝑅2 values, of 0.16, 0.09, 0.042, respectively) and the regression line slopes do not
appear to be statistically significant for two of three (VPPII Vendor 1’s coefficient is
marginally significant – similar to VPPI, but even so, the slope is less steep). These results
suggest that AADT is not a strong contributing factor to slowdown performance for VPPII
probe data. Note that all else being equal, AADT should intuitively be positively
associated with performance (i.e., higher volumes mean more opportunities for probe
vehicles to characterize traffic conditions) – yet it alone is not reliably associated with
probe performance across the range of values observed.
Results by Road Characteristic Range
Finally, the third perspective considers an alternative grouping of slowdowns; rather than
considering the results separately for each corridor, it organizes all slowdowns from
Tables A.5 and A.6 into ranges of relevant road characteristics (i.e., signal density, AADT)
and recomputes slowdown performance for each grouping. The advantage of this
approach is that corridors with similar characteristics can be grouped together logically,
and within a grouping the computed performance will take all observed slowdowns into
consideration (rather than equally weighting performance on each corridor regardless of
the number of slowdowns). However, the challenge is determining how to choose ranges
for AADT and signal density that are useful. One strategy would be to divide them into
ranges with equal number of observations; however, for comparison sake they are
separated into ranges that generally correspond to the recommendations made in the
initial report.
Previously, the initial arterial report distinguished between signal densities in the
following ranges: <= 1 signal per mile, 1-2 signals per mile, and > 2 signals per mile. In this
case, we wish to additionally distinguish between 2-3 signals per mile – resulting in four
signal density categories for analysis (i.e., 0-1, 1-2, 2-3, >3). For AADT, volumes are
separated into the same bins used previously: <=20k vehicles per day, 20k-40k, and > 40k.
Tables 8 and 9 summarize the percentage of total slowdowns that correspond to each
combination of signal density and AADT bin for VPPI and VPPII case studies, respectively.

I-95 Corridor Coalition Vehicle Probe Project Evaluation – Summary of Arterial Reports 23 Vendors: HERE, INRIX, TOMTOM September 2019
Note that in both tables the “Total” column shows the overall percent of slowdowns
observed in each AADT range (0% in 0-20k, 32% in 20-40k, 68% in 40k+ for VPPI; 2% in
0-20k, 31% in 20-40k, 68% in 40k+ for VPPII), while the “Total” Row shows the overall
percent of slowdowns observed in each signal density range (24% in 0-1, 40% in 1-2, 8%
in 2-3, 28% in 3+ for VPPI; 32% in 0-1, 18% in 1-2, 49% in 2-3, 2% in 3+ for VPPII). Based
on how the slowdowns are distributed across road characteristics, there are not enough
observations on new case studies to make reliable claims about data quality above 3
signals per mile or below 20k AADT. Thus, subsequent analysis uses the following
groupings: 0-1, 1-2, and 2-3 signals per mile for signal density, and 20k-40k and 40k+ for
AADT. Table 8 – Distribution of VPPI slowdowns across road characteristic ranges.
Percent of Total
Slowdowns
Signal Density (Signals / mile)
0 - 1 1-2 2-3 3+ Total
AADT
0 – 20k - - - - 0
20k – 40k 9 - 8 15 32
40k + 15 40 - 13 68
Total 24 40 8 28
Values are rounded to the nearest percent
Table 9 - Distribution of VPPII slowdowns across road characteristic ranges.
Percent of Total
Slowdowns
Signal Density (Signals / mile)
0 - 1 1-2 2-3 3+ Total
AADT
0 – 20k 1 - 1 - 2
20k – 40k 3 8 18 2 31
40k + 28 10 30 - 68
Total 32 18 49 2
Values are rounded to the nearest percent
Figure 12 summarizes slowdown performance by both signal density and AADT ranges.
The left plot focuses on signal density and shows an intuitive trend for old case studies;
the slowdown analysis performance clearly decreases as the signal density range increases.
However, the trend is less obvious for the new VPPII case studies. While all VPPII vendors
show strong performance in the 0-1 signal per mile bin, VPPII Vendors 1 and 2 show
moderate overall performance in the 1-2 signals per mile range (roughly 15-25% failed to
capture) but perform better in the 2-3 signals per mile bin (generally within 10% failed to
capture) – indicating why the regression lines from Figure 10 did not correlate well with
signal density. This phenomenon is not evident for VPPII Vendor 3, since its performance
is relatively constant in each bin. Given that the 1-2 signals per mile bin only contains
about 18% of all slowdowns (see Table 9), challenges experienced on a single corridor
may be artificially lowering the performance for Vendors 1 and 2. In any case, is important
to emphasize that data in the 2-3 signals per mile range – which previously was deemed
unreliable based on old case studies – appears to now be much more accurate than before.

I-95 Corridor Coalition Vehicle Probe Project Evaluation – Summary of Arterial Reports 24 Vendors: HERE, INRIX, TOMTOM September 2019
Figure 12 – Slowdown performance by signal density (left) and AADT (right) ranges.
The right plot in Figure 12 focuses on slowdown performance by AADT bin. In old case
studies, the performance improves a bit as volumes increase between 20k-40k and 40k+
bins. This trend is even more noticeable for VPPII vendors I and II, but does not hold for
VPPII Vendor 3, whose performance slightly decreases for higher volumes. However, it
is important to note that the 20k-40k and 40k+ volume bins do not have the same number
of slowdowns in each bin – nor the same proportion of slowdowns with different signal
density characteristics. In other words, it is likely that the moderate performance
observed by VPPII Vendors I and II in the 20k-40k range is related to other factors (as
opposed to being solely a result of volume level). In fact, further investigation showed
that the failed to capture slowdowns that contributed to this trend occurred at locations
where there are 1-2 signals per mile (i.e., the same locations that caused the drop in
performance for the 1-2 signals per mile bin in the left plot). Thus, while the results
indicate that the performance on high volume roads is strong, it is unlikely that volume
level alone is the determining factor – at least in the observed volume ranges.
I-95 Corridor Coalition Vehicle Probe Project Evaluation – Summary of Arterial Reports 25 Vendors: HERE, INRIX, TOMTOM September 2019
5. Conclusions
This report provides an update to the original arterial report, quantifying the accuracy of
VPPII data across 13 additional arterial datasets and two additional vendors, and
comparing these results to the original VPPI case studies. These results indicate that probe
data performance on arterials has improved since the original analysis in 2014. In
particular:
• Performance on the traditional analysis has improved, and VPPII probe data for
all three vendors is much more consistently within contract specifications for
traditional error measures (i.e., AASE and SEB) than was observed in the original
VPPI case studies in 2013-2014. This is improvement is observable both when
comparing vendor speeds to the ground truth Mean and Standard Error of the
Mean (SEM) band speeds.
• Performance on the slowdown analysis – the current preferred way to quantify
operational performance on arterials – improved dramatically relative to the VPPI
levels for all three vendors and is less strongly linked to AADT and signal
density. The average percentage of slowdowns missed by each vendor (an
indicator of slowdown performance) across corridors dropped by over 50%,
resulting in improved performance across a range of road characteristics.
Note that the case studies represent a finite range of road characteristics (e.g., AADT,
signal density), and the conclusions may not generalize to conditions outside the observed
data (e.g., roads with extremely low volumes or high signal densities far beyond what was
observed in the case studies). However, within the observed range of observed road
conditions – particularly 0-3 traffic signals per mile and above 20k AADT, all three
vendors typically perform at a level that is suitable for planning and many operational
applications. This is a noticeable improvement from the results shared in the previous
report, where performance was more closely linked to road characteristics and degraded
significantly for signal densities over 2 signals per mile.
Nonetheless, arterial roads still present certain fundamental challenges, and should be
treated with caution. Some fundamental issues include:
• Probe data consistently errors toward faster speeds during congested periods,
although to a lesser extent than was previously observed in the initial arterial
report. This phenomenon can be observed in the lowest speed bins for all vendors
in Figure 8, which show positive Speed Error Bias assessed against both the Mean
and SEM band. While there is a clear positive bias in the lowest speed bin (i.e.,
during congestion) for all vendors, the magnitude of the average bias is less for all

I-95 Corridor Coalition Vehicle Probe Project Evaluation – Summary of Arterial Reports 26 Vendors: HERE, INRIX, TOMTOM September 2019
three VPPII vendors relative to the VPPI levels. As the initial report noted, one
consequence of overreporting speeds during congestion is that it may appear that
congestion is getting worse in the future as probe vendors improve their reporting
capabilities and better capture the extent of slowdowns
• Complex flow patterns common on signalized roadways cannot be observed in
VPP data. Arterials with many traffic signals can produce multi-modal speed
distributions due to signal timing patterns. While the validation metrics may still
be within contract specifications because the ground truth data has a large
confidence band of “acceptable” ground truth mean speeds, the issue remains that
VPP data only reports a single speed, which may be sufficiently accurate for some
applications, but not others. Note that the original report also noted that VPP data
tended to track the higher speed (i.e., “optimistic bias”), but this was not noticed to
the same extent in the new case studies. In any case, when actual traffic conditions
are complex and there are distinct modes, the VPP data can only track one of the
modes or report a value in between them, which may not reflect the speed of any
vehicles.
Accordingly, even as probe data is becoming increasingly useful on higher signal
density roads (as evidenced by strong slowdown analysis performance in the 2-3
signals per mile range), it is important to remember that traffic signals still cause
complex traffic patterns that cannot be fully observed by VPP data – especially
during typical (i.e., non-slowdown) conditions. Thus, roads with high traffic signal
density should still be used with caution.
• Low volume roads are difficult to validate: Extremely low volume roads pose
challenges for VPP vendors and validation efforts because both VPP probe data
and ground truth re-identification data rely on sampling techniques. This means
data vendors have fewer probe vehicle observations to generate VPP speed data,
and in some cases the validation team cannot collect enough data to meaningfully
evaluate the probe data over 5-minute time periods (e.g., there may not be enough
observations to quantify the ground truth conditions, or the confidence band may
be extremely large). Furthermore, few VPPII case studies have been conducted on
roads with less than 20k AADT, so the validation team has not been able to
thoroughly evaluate data quality in this range. Thus, even though AADT does not
correlate strongly to data accuracy in the ranges observed in this report, low
volume situations should be treated with caution – particularly when used for
operational purposes.
Note that the evaluation techniques employed in this study evaluate data quality
over short periods of time, thus emphasizing operations and performance

I-95 Corridor Coalition Vehicle Probe Project Evaluation – Summary of Arterial Reports 27 Vendors: HERE, INRIX, TOMTOM September 2019
management applications. Accordingly, concerns about being able to effectively
quantify ground truth conditions on low volume roads are also based on this
perspective. However, it is worth pointing out that probe data can also be used for
planning purposes, which tends to focus on larger temporal periods - in which case
the challenges associated with low-volume roads may be less pronounced (e.g.,
data could be aggregated over a larger temporal window to generate sufficient
observations for analysis). VPPII probe data has not been explicitly studied in this
manner due to lack of low-volume case studies but may be considered in future
research.
Despite these fundamental challenges, VPPII arterial speed data is more accurate than
what was observed in the previous report, able to better capture traffic slowdown events,
and suitable for use over a wider range of road characteristics. Based on these findings,
the validation team makes the following recommendations to the I-95 Corridor Coalition
and its members:
• The I-95 Corridor Coalition should continue to evaluate probe data quality on
arterials to benchmark vendor capabilities. It is expected that probe data will
continue to improve over time, but the I-95 CC should continue to emphasize
arterial validations to regularly track vendor performance.
• Additional emphasis should be placed on refining analysis techniques for
evaluating data quality on arterials. While capable of providing some useful
insight, the traditional validation analysis approach should not be the only
technique used to quantify data accuracy on arterials. Currently, the slowdown
analysis is seen as the best way to quantify probe data accuracy for operational
purposes, and thus it should continue to be developed. It may be useful to explore
whether it is possible to partially automate the slowdown analysis process to
decrease reliance on an analyst’s judgement for the classification process.
Additionally, future work should consider whether existing arterial performance
management analysis tools and performance measures can be leveraged for the
purposes of probe data validation on arterials. Finally, it would be useful to
evaluate probe data on low volume roads, which may mean introducing additional
techniques to quantify typical performance over longer temporal periods.
• The I-95 Corridor Coalition should engage probe data vendors to discuss
whether additional information can be reported on arterials. The validation team
– in cooperation with Coalition members - should consider what information
should be reported in addition to average travel time / speed. As previously
discussed, signalized arterials have complex traffic patterns that cannot be fully
characterized by a single speed value.

I-95 Corridor Coalition Vehicle Probe Project Evaluation – Summary of Arterial Reports 28 Vendors: HERE, INRIX, TOMTOM September 2019
Appendix
Tables A.1-A.4 report the traditional error metrics for both old and new case studies, while
Tables A.5-A.6 summarize the slowdown analysis results.
Table A. 1 –Traditional AASE and SEB error metrics for old case studies (VPPI)
Data
Set
(State-
ID#)
Comparison with Mean / Comparison with SEM Band
Average Absolute Speed Error
(AASE)
Speed Error Bias
(SEB)
Speed Bin Speed Bin
0-15
MPH
15-25
MPH
25-35
MPH
>35
MPH
0-15
MPH
15-25
MPH
25-35
MPH
>35
MPH
NC-06 13.9/9.6 10.9/3.4 5.6/1 5.1/1.3 13.7/9.6 10.5/3.3 3.8/0.7 -3.4/-1.1
MD-07 12.7/6.4 7.3/3 3.7/0.9 12.5/6.3 12.7/6.4 7/2.9 1.3/0.3 -12.4/-6.2
13.5/7.5 8.6/3.4 4.7/1.2 7.8/2.9 13.4/7.5 8.2/3.3 2.3/0.8 -7.3/-2.8
NJ-11
4.4/2.9 7.3/5.3 9.6/5.4 6.5/2.3 3.8/2.8 6.9/5.2 8.8/5.2 -2.9/-1.3
13.4/7.4 10.3/3.6 6.4/1.3 5.6/1.8 13.4/7.4 10.1/3.6 5.3/1.1 -4/-1.6
19.9/12.2 13.8/5.1 7.1/2.8 4.9/1.5 19.9/12.2 13.7/5.1 6.5/2.6 -1.4/-0.6
NJ-12 12.8/9.5 11.8/7.5 7.7/3.1 4.9/1.5 12.8/9.5 11.7/7.5 7.2/3 -1.2/-0.6
7/4.7 9/4.1 7.5/3.5 5.2/1.8 7/4.7 8.8/4 6.4/3.2 0/-0.1
PA-05 11.5/7.5 8.4/4.7 5.7/1.9 4.9/1.3 11.3/7.5 8.2/4.7 4.6/1.7 -2.7/-0.9
8.2/5.9 8.3/4.3 6.7/2.9 3.1/1.3 8.1/5.9 8.2/4.3 6.3/2.7 -0.1/0
PA-06 9.1/4.9 6.1/2.9 4.1/1.1 6.1/2.3 9.1/4.9 5.7/2.8 1.7/0.6 -4.4/-1.7
6.5/3.3 3.4/1.3 5.3/2.1 12.9/5.5 6.4/3.3 1.5/0.8 -4.9/-2 -12.9/-5.5
VA-07
10.8/7.5 7.8/4.5 6.7/2.6 6.3/2.2 10.7/7.5 7.3/4.3 4.8/2.1 -3.5/-1.6
19.3/18.3 13.8/10.8 12.4/6.6 5.2/1.7 19.1/18.2 13.4/10.6 12/6.5 -0.9/-0.6
8.1/3.9 3.7/1.2 2.5/0.6 8.7/5.2 8/3.8 2.8/1 -1.1/-0.5 -8.7/-5.2
VA-08 11.9/7.2 7.4/3.8 6.8/1.3 6.2/2.5 10.7/7.1 7.4/3.7 1.8/0.5 -3.9/-1.2
MD-08 9.7/5.8 5.1/1.9 4.1/1.1 9.2/3.8 9.6/5.8 4.2/1.8 -1.5/-0.4 -9/-3.8
18.9/16.9 13.1/10.1 13.5/6.8 6.6/2.9 18.9/16.9 12.9/10.1 12.5/6.2 -2.9/-1.6

I-95 Corridor Coalition Vehicle Probe Project Evaluation – Summary of Arterial Reports 29 Vendors: HERE, INRIX, TOMTOM September 2019
Table A. 2–Traditional AASE and SEB error metrics for new case studies (VPPII Vendor 1)
Data
Set
(State-
ID#)
Comparison with Mean / Comparison with SEM Band
Average Absolute Speed Error
(AASE)
Speed Error Bias
(SEB)
Speed Bin Speed Bin
0-15
MPH
15-25
MPH
25-35
MPH
>35
MPH
0-15
MPH
15-25
MPH
25-35
MPH
>35
MPH
VA-09 7.8/4.8 4.6/1.4 3.9/1.1 7.8/3.8 7.8/4.8 3.6/1.2 -1.5/-0.6 -7.4/-3.8
VA-10 7.3/4.6 4.7/1.6 4.4/1.1 6.0/2.3 7.1/4.6 3.2/1.2 -0.2/0.0 -4.5/-2.0
NJ-13 7.0/5.1 7.2/2.8 5.1/0.9 5.4/1.3 7.0/5.1 6.9/2.8 3.3/0.7 -3.3/-1.2
NC-07 6.8/4.7 4.6/2.1 3.2/1.1 4.2/1.9 6.8/4.7 4.3/2.1 2.1/0.7 -3.5/-1.8
GA-02 5.3/3.7 5.3/2.3 3.6/0.7 4.8/1.7 5.1/3.6 4.7/2.1 1.2/0.3 -3.9/-1.5
MD-10 7.2/4.2 5.6/1.3 3.8/0.9 6.8/2.3 7.2/4.2 5.0/1.2 0.7/0.4 -4.3/-1.9
PA-09 4.1/2.1 2.8/0.8 3.4/0.9 7.9/2.4 4.1/2.1 1.2/0.4 -2.0/-0.7 -7.7/-2.4
VA-11 5.0/2.9 6.3/2.4 5.2/1.2 5.8/1.8 4.6/2.8 5.2/2.3 2.0/0.5 -3.8/-1.6
NJ-14 5.0/2.8 4.8/1.8 5.2/1.5 5.9/1.7 4.9/2.8 3.1/1.6 2.2/0.8 -3.5/-1.3
MD-12 9.6/3.1 5.5/1.3 5.2/1.3 6.6/2.7 9.6/3.1 4.8/1.2 1.1/0.3 -5.2/-2.6
NC-09 6.1/2.7 5.6/1.6 6.0/1.3 5.8/2.2 5.9/2.7 4.7/1.4 3.2/0.6 -3.4/-1.9
GA-04 3.9/1.64 5.15/1.49 5.33/1.15 4.88/1.58 3.06/1.44 3.48/1.03 2.66/0.33 -2.74/-1.38
PA-11 9.59/3.13 5.53/1.28 5.2/1.34 6.57/2.7 9.58/3.13 4.82/1.2 1.07/0.34 -5.2/-2.56

I-95 Corridor Coalition Vehicle Probe Project Evaluation – Summary of Arterial Reports 30 Vendors: HERE, INRIX, TOMTOM September 2019
Table A. 3 – Traditional AASE and SEB error metrics for new case studies (VPPII Vendor 2)
Data
Set
(State-
ID#)
Comparison with Mean / Comparison with SEM Band
Average Absolute Speed Error
(AASE)
Speed Error Bias
(SEB)
Speed Bin Speed Bin
0-15
MPH
15-25
MPH
25-35
MPH
>35
MPH
0-15
MPH
15-25
MPH
25-35
MPH
>35
MPH
VA-09 9.5/ 6.4 6.6/2.8 5.1/1.7 6.9/3.2 9.5/6.4 5.7/2.6 0.6/0.2 -5.1/-2.6
VA-10 11.8/8.8 7.2/3.3 5.4/1.7 5.6/2.1 11.7/8.7 5.8/2.9 2.4/0.8 -3.0/-1.4
NJ-13 6.7/4.8 9.7/5.0 8.1/2.8 6.0/1.6 6.4/4.8 8.9/4.8 6.3/2.4 -0.4/-0.5
NC-07 4.2/2.7 4.0/1.8 4.7/2.0 4.7/2.3 3.8/2.6 1.8/1.1 2.0/0.9 -3.1/-1.8
GA-02 4.8/3.2 7.5/4.2 6.1/2.2 4.4/1.5 4.5/3.1 7.0/4.0 4.3/1.8 -1.7/-0.8
MD-10 8.6/5.6 9.0/3.6 6.1/2.3 7.0/2.4 8.5/5.5 8.4/3.5 4.0/1.8 0.2/-0.2
PA-09 5.4/3.4 4.0/1.7 4.2/1.3 6.9/2.0 5.2/3.3 2.2/1.1 -0.2/-0.1 -5.4/-1.8
VA-11 6.9/4.6 7.5/3.4 6.6/2.0 6.7/2.4 6.7/4.6 6.2/3.2 2.5/0.9 -3.4/-1.8
NJ-14 5.4/3.6 5.9/3.0 6.3/2.5 5.9/1.7 5.2/3.6 4.9/2.8 4.1/2.0 -1.7/-0.7
MD-12 13.2/6.1 8.7/2.8 6.1/1.8 6.5/2.4 13.2/6.1 8.1/2.6 3.7/1.3 -3.6/-1.9
NC-09 8.1/4.4 7.1/2.5 7.4/2.0 5.9/2.0 8.1/4.4 6.3/2.3 5.1/1.4 -1.6/-1.4
GA-04 4.47/1.94 5.52/1.7 6.47/1.79 5.03/1.55 3.78/1.74 4.08/1.3 4.08/1 -1.7/-1.13
PA-11 13.25/6.08 8.74/2.8 6.07/1.85 6.46/2.42 13.19/6.07 8.06/2.61 3.67/1.26 -3.64/-1.95

I-95 Corridor Coalition Vehicle Probe Project Evaluation – Summary of Arterial Reports 31 Vendors: HERE, INRIX, TOMTOM September 2019
Table A. 4 - Traditional AASE and SEB error metrics for new case studies (VPPII Vendor 3)
Data
Set
(State-
ID#)
Comparison with Mean / Comparison with SEM Band
Average Absolute Speed Error
(AASE)
Speed Error Bias
(SEB)
Speed Bin Speed Bin
0-15
MPH
15-25
MPH
25-35
MPH
>35
MPH
0-15
MPH
15-25
MPH
25-35
MPH
>35
MPH
VA-09 12.3/9.0 11.3/6.1 7.6/3.3 5.2/1.8 12.3/9.0 11.2/6.1 6.8/3.1 0.1/-0.2
VA-10 9.6/6.7 9.9/5.4 7.9/3.3 6.2/2.5 9.4/6.6 9.6/5.3 6.7/3.0 -1.2/-1.1
NJ-13 6.6/4.7 12.1/7.0 9.0/3.7 5.9/1.3 6.6/4.7 12.1/7.0 8.5/3.6 0.3/-0.4
NC-07 7.5/5.4 7.8/4.5 7.5/3.8 3.8/1.5 7.4/5.4 7.6/4.5 6.9/3.6 -1.2/-0.8
GA-02 5.9/4.3 10.1/6.3 10.3/5.2 5.5/2.0 5.8/4.3 9.7/6.2 8.7/4.6 -3.5/-1.5
MD-10 9.4/6.3 12.6/6.3 8.3/3.7 6.5/2.0 9.3/6.3 12.5/6.3 7.6/3.6 -0.7/-0.6
PA-09 6.1/3.8 6.0/3.3 4.5/1.5 5.1/1.1 6.0/3.8 5.7/3.2 2.4/1.0 -0.1/-0.2
VA-11 6.4/4.1 8.5/4.2 6.6/1.9 5.9/1.9 6.3/4.1 7.9/4.1 4.0/1.4 -3.0/-1.5
NJ-14 3.9/1.8 4.1/1.3 4.4/1.1 6.3/2.0 3.7/1.8 2.0/1.0 1.3/0.6 -4.1/-1.6
MD-12 8.7/2.4 5.5/1.2 5.2/1.6 6.3/2.4 8.7/2.4 5.0/1.2 2.5/1.0 -4.4/-2.3
NC-09 6.6/3.0 6.7/2.2 7.7/2.1 5.2/1.4 6.5/3.0 6.1/2.1 6.0/1.7 -0.6/-0.9
GA-04 3.42/1.27 5.42/1.46 4.97/1.08 4.21/1.02 3.1/1.21 3.84/0.96 2.89/0.45 -1.26/-0.73
PA-11 8.75/2.37 5.55/1.21 5.23/1.57 6.27/2.44 8.75/2.37 5.04/1.18 2.55/1.05 -4.38/-2.31
I-95 Corridor Coalition Vehicle Probe Project Evaluation – Summary of Arterial Reports 32 Vendors: HERE, INRIX, TOMTOM September 2019
Table A. 5 - Slowdown analysis results on old case studies (VPPI)
Corridor
Code
Average AADT
(in 1000)
Average Signal
Density
Slowdown Analysis
Total
Slowdowns
% Fully
Captured
% Partially
Captured
% Failed
to Capture
1 25.0 2.1 54 14.8 44.4 41.3
2a 44.0 3.9 9 44.4 22.2 33.3
2b 34.0 3.1 8 0.0 37.5 62.5
3a 70.0 0.7 101 63.4 36.6 0.0
3b 48.0 1.8 4 0.0 100.0 0.0
3c 42.0 2.0 4 25.0 50.0 25.0
4a 46.0 1.8 57 40.4 38.6 21.1
4b 52.0 1.7 89 41.6 46.1 12.4
5a 45.0 4.1 78 28.2 48.7 23.1
5c 25.0 0.5 58 50.0 41.4 8.6
6a 27.0 3.3 18 22.2 33.3 44.4
6b 21.0 11.5 5 0.0 20.0 80.0
7a 56.0 1.9 75 24.0 42.7 33.3
7b 55.0 1.6 22 4.5 22.7 72.7
7c 21.0 5.0 1 0.0 0.0 100.0
8 33.0 3.6 49 8.2 42.9 49.0
9a 31.0 3.9 20 0.0 35.0 65.0
9b 42.0 1.2 18 22.2 66.7 11.1

I-95 Corridor Coalition Vehicle Probe Project Evaluation – Summary of Arterial Reports 33 Vendors: HERE, INRIX, TOMTOM September 2019
Table A. 6 - Slowdown analysis results on new case studies (VPPII)
Corridor
Code
Average
AADT
(in 1000)
Average
Signal
Density
Vendor #
Slowdown Analysis
Total
Slowdowns
% Fully
Captured
% Partially
Captured
% Failed
to Capture
% Missing
Data
11 36.0 2.9
1
79
59.5 29.1 11.4 0.0
2 40.5 43.0 16.5 0.0
3 43.0 41.8 2.5 12.7
12 22.0 1.2
1
18
27.8 22.2 50 0
2 27.8 0.0 72.2 0.0
3 33.3 55.6 0.0 11.1
13 39.8 1.0
1
17
29.4 58.8 0 11.8
2 52.9 41.2 5.9 0.0
3 41.2 58.8 0.0 0.0
14a 28.7 1.4
1
22
4.5 36.4 59.1 0.0
2 40.9 54.5 4.5 0.0
3 50.0 31.8 18.2 0.0
14b 57.8 1.0
1
79
65.8 26.6 7.6 0.0
2 96.2 3.8 0.0 0.0
3 48.1 41.8 10.1 0.0
15a 43.2 2.3
1
56
71.4 25.0 0.0 3.6
2 83.9 12.5 0.0 3.6
3 67.9 28.6 3.6 0.0
15b 30.8 1.9
1
11
54.5 45.5 0.0 0.0
2 81.8 18.2 0.0 0.0
3 63.6 36.4 0.0 0.0
15c 146.5 0.0
1
68
98.5 1.5 0.0 0.0
2 88.2 11.8 0.0 0.0
3 91.2 7.4 1.5 0.0
16a 29.2 2.2
1
8
62.5 12.5 25.0 0.0
2 75.0 12.5 12.5 0.0
3 100.0 0.0 0.0 0.0
16b 62.0 1.5
1
30
86.7 13.3 0.0 0.0
2 86.7 13.3 0.0 0.0
3 90.0 10.0 0.0 0.0
17a 28.3 4.6
1
11
90.9 9.1 0.0 0.0
2 27.3 63.6 9.1 0.0
3 45.5 36.4 18.2 0.0
17b 11.1 0.9
1
8
0.0 25.0 75.0 0.0
2 12.5 62.5 25.0 0.0
3 87.5 12.5 0.0 0.0
17c 23.4 4.6
1
3
0.0 33.3 66.7 0.0
2 66.7 0.0 33.3 0.0
3 66.7 0.0 33.3 0.0
18 52.9 2.8
1
140
72.1 19.3 8.6 0.0
2 32.9 55.7 11.4 0.0
3 59.3 30.0 10.7 0.0
19a 74.1 1.9 1 39 51.3 35.9 12.8 0.0

I-95 Corridor Coalition Vehicle Probe Project Evaluation – Summary of Arterial Reports 34 Vendors: HERE, INRIX, TOMTOM September 2019
Corridor
Code
Average
AADT
(in 1000)
Average
Signal
Density
Vendor #
Slowdown Analysis
Total
Slowdowns
% Fully
Captured
% Partially
Captured
% Failed
to Capture
% Missing
Data
2 51.3 41.0 7.7 0.0
3 41.0 20.5 5.1 33.3
19b 90.4 0.9
1
31
58.1 38.7 3.2 0.0
2 35.5 41.9 22.6 0.0
3 61.3 38.7 0.0 0.0
19c 75.5 0.4
1
10
70.0 30.0 0.0 0.0
2 70.0 30.0 0.0 0.0
3 100.0 0.0 0.0 0.0
20 40.3 2.4
1
4
50.0 25.0 25.0 0.0
2 25.0 25.0 50.0 0.0
3 25.0 75.0 0.0 0.0
21 28.9 2.1
1
20
70.0 30.0 0.0 0.0
2 60.0 20.0 20.0 0.0
3 65.0 35.0 0.0 0.0
22a 31.9 2.7
1
11
81.8 18.2 0.0 0.0
2 72.7 18.2 9.1 0.0
3 90.9 0.0 9.1 0.0
22b
1 80.0 20.0 0.0 0.0
22.2 2.3 2 5 80.0 20.0 0.0 0.0
3 100.0 0.0 0.0 0.0
22c 20.9 5.7
1 - - - -
2 0 - - - -
3 - - - -
23 15.7 2.4
1
4
75.0 25.0 0.0 0.0
2 75.0 25.0 0.0 0.0
3 100.0 0.0 0.0 0.0