Embed Size (px)
Citation preview
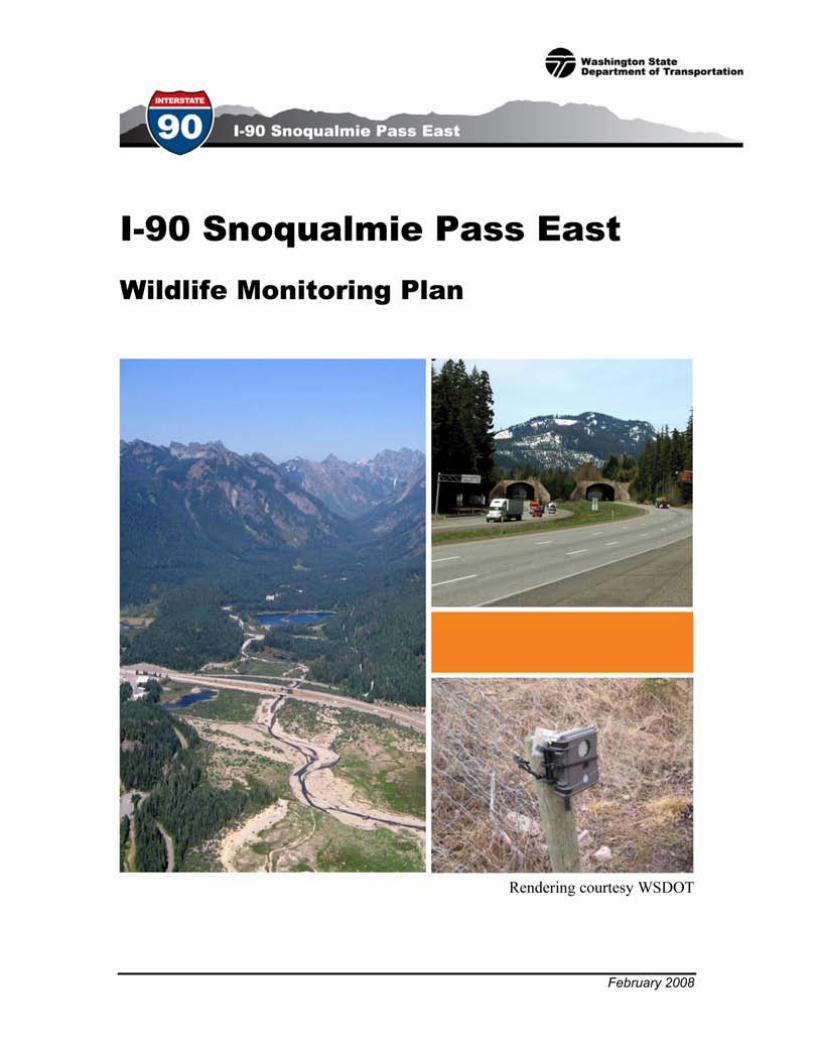


I-90 Wildlife Monitoring Plan, Western Transportation Institute February 2008
Title VI
WSDOT ensures full compliance with Title VI of the Civil Rights Act of 1964 by prohibiting discrimination against any person on the basis of race, color, national origin or sex in the provision of benefits and services resulting from its federally assisted programs and activities. For questions regarding WSDOT’s Title VI Program, you may contact the Department’s Title VI Coordinator at (360) 705-7098. Americans with Disabilities Act (ADA) Information If you would like copies of this document in an alternative format – large print, Braille, cassette tape, or on computer disk, please call (360) 705-7097. Persons who are deaf or hard of hearing, please call the Washington State Telecommunications Relay Service, or Tele-Braille at 7-1-1, Voice 1-800-833-6384, and ask to be connected to (360) 705-7097.
Washington State Department of Transportation Page ii
I-90 Wildlife Monitoring Plan, Western Transportation Institute February 2008
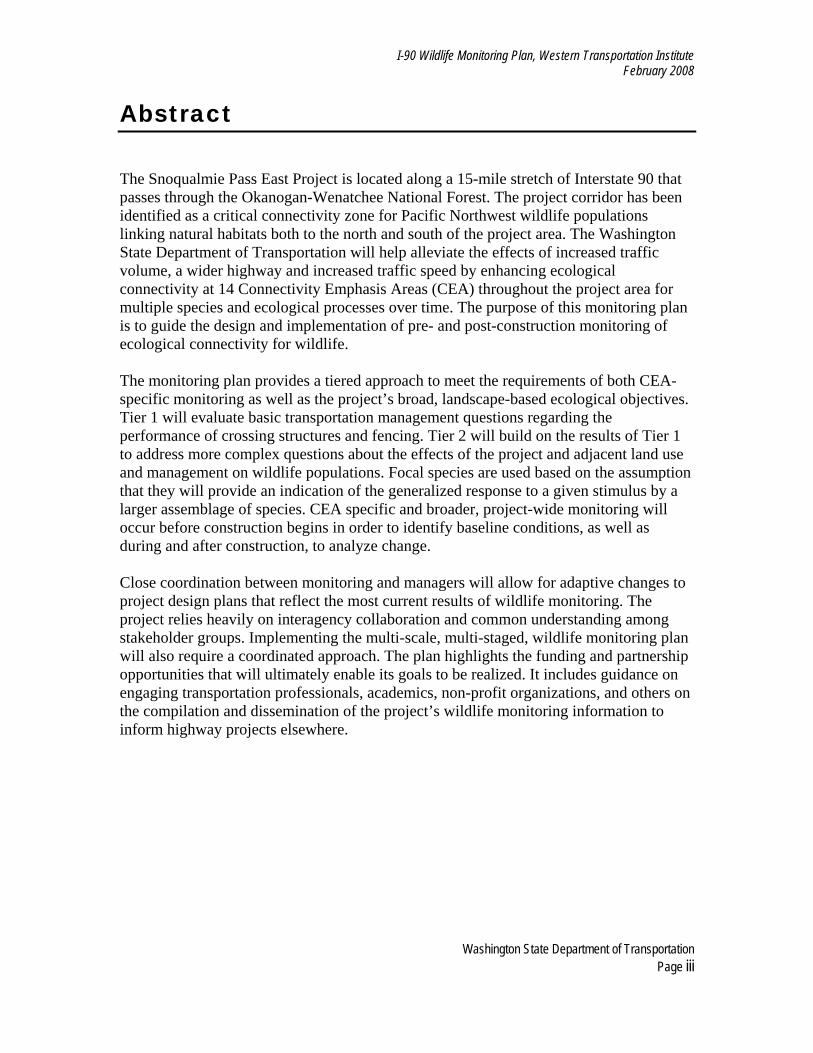
Abstract The Snoqualmie Pass East Project is located along a 15-mile stretch of Interstate 90 that passes through the Okanogan-Wenatchee National Forest. The project corridor has been identified as a critical connectivity zone for Pacific Northwest wildlife populations linking natural habitats both to the north and south of the project area. The Washington State Department of Transportation will help alleviate the effects of increased traffic volume, a wider highway and increased traffic speed by enhancing ecological connectivity at 14 Connectivity Emphasis Areas (CEA) throughout the project area for multiple species and ecological processes over time. The purpose of this monitoring plan is to guide the design and implementation of pre- and post-construction monitoring of ecological connectivity for wildlife. The monitoring plan provides a tiered approach to meet the requirements of both CEA-specific monitoring as well as the project’s broad, landscape-based ecological objectives. Tier 1 will evaluate basic transportation management questions regarding the performance of crossing structures and fencing. Tier 2 will build on the results of Tier 1 to address more complex questions about the effects of the project and adjacent land use and management on wildlife populations. Focal species are used based on the assumption that they will provide an indication of the generalized response to a given stimulus by a larger assemblage of species. CEA specific and broader, project-wide monitoring will occur before construction begins in order to identify baseline conditions, as well as during and after construction, to analyze change. Close coordination between monitoring and managers will allow for adaptive changes to project design plans that reflect the most current results of wildlife monitoring. The project relies heavily on interagency collaboration and common understanding among stakeholder groups. Implementing the multi-scale, multi-staged, wildlife monitoring plan will also require a coordinated approach. The plan highlights the funding and partnership opportunities that will ultimately enable its goals to be realized. It includes guidance on engaging transportation professionals, academics, non-profit organizations, and others on the compilation and dissemination of the project’s wildlife monitoring information to inform highway projects elsewhere.
Washington State Department of Transportation Page iii

I-90 Wildlife Monitoring Plan, Western Transportation Institute February 2008
Table of Contents Executive Summary ..................................................................................................... viii Key Findings................................................................................................................ viii Recommended Actions .................................................................................................. ix Next Steps .................................................................................................................... xiv
1. Introduction.............................................................................................................. 1-1 Purpose and Goals of the Wildlife Monitoring Plan.................................................... 1-1 Project Setting.............................................................................................................. 1-1 Landscape Conservation and Biodiversity Values ...................................................... 1-3 Ecological Connectivity Objectives............................................................................. 1-4 Tiered Approach to Wildlife Monitoring..................................................................... 1-6 Partners and Stakeholders ............................................................................................ 1-8
2. Past and Current Activities in Project Area ............................................................. 2-1 Evaluation of Baseline Information ............................................................................. 2-1 Existing Data and Studies ............................................................................................ 2-1
3. Monitoring Framework and Guidelines................................................................... 3-1 Monitoring Objectives ................................................................................................. 3-1 A Two-tiered Approach ............................................................................................... 3-2 Tier 2 Complementary Monitoring and Research ....................................................... 3-3 Focal Species Approach............................................................................................... 3-5 CEA-Specific Monitoring Objectives.......................................................................... 3-8 Survey Methods ......................................................................................................... 3-13 Adaptive Management ............................................................................................... 3-19 Implementation .......................................................................................................... 3-19 Evaluating Performance............................................................................................. 3-23 Reporting.................................................................................................................... 3-24
4. Education, Outreach & Communications ................................................................ 4-1 Education ..................................................................................................................... 4-1 Outreach....................................................................................................................... 4-3 Communications .......................................................................................................... 4-4
5. Potential Partnerships............................................................................................... 5-1 Federal Agencies.......................................................................................................... 5-1 State Agencies.............................................................................................................. 5-1 Academia ..................................................................................................................... 5-1 Non-Governmental Organizations ............................................................................... 5-2 Integration with Monitoring and Research Project ...................................................... 5-2
6. Funding for Wildlife Monitoring and Research Projects......................................... 6-1 Federal transportation funding sources and opportunities ........................................... 6-1 Federal non-transportation funding sources and opportunities.................................... 6-3 State and local funding sources and opportunities....................................................... 6-4 Private foundations and potential funding opportunities ............................................. 6-5 Corporate philanthropy and funding opportunities...................................................... 6-5
7. References................................................................................................................ 7-1 8. Appendix A.............................................................................................................. 8-1
Washington State Department of Transportation Page iv
Common and Scientific Names ................................................................................... 8-1

I-90 Wildlife Monitoring Plan, Western Transportation Institute February 2008
9. Appendix B .............................................................................................................. 9-1 Selection of Focal Species ........................................................................................... 9-1
10. Appendix C ........................................................................................................ 10-1 CEA-Specific Investments and Potential................................................................... 10-1 Monitoring Targets .................................................................................................... 10-1
11. Appendix D........................................................................................................ 11-1 12. Appendix E ........................................................................................................ 12-1 13. List of Preparers................................................................................................. 13-1
Washington State Department of Transportation Page v
I-90 Wildlife Monitoring Plan, Western Transportation Institute February 2008
List of Exhibits ES-1 Recommended Tier 1 wildlife monitoring objectives, survey methods, and species. ES-2 Examples of Tier 2 ecological connectivity studies. 1-1 North-south habitat linkage zones in the project area (Source WSDOT 2006). 1-2 Connectivity emphasis areas (CEA) in the project area. (Source WSDOT 2006). 1-3 Tier 1 Objectives and Monitoring Metrics. 1-4 Examples of Tier 2 objectives and monitoring metrics. 3-1 Candidate focal species (or species groups) for Tier 1 monitoring efforts. Species in bold
type are the most likely candidate species for one or more monitoring objectives. 3-2 CEA-specific summary of ecological values and existing and planned design
commitments. 3-3 Summary of available survey methods, potential target species and cost estimates for
conducting Tier 1 wildlife monitoring. 3-4 Summary of potential candidate species or species groups associated with five specific
habitat types within the project area. 3-5 Proposed schedule of Tier 1 and Tier 2 monitoring and research in the Snoqualmie Pass
East Project Area during pre-construction, construction, and post-construction periods. 5-1 Roles and responsibilities matrix. 9-1 Guide to selecting focal species based on monitoring criteria and ecosystem context. 9-2 Sample of some wildlife species occurring in the project area and their ecological
attribute classification (see Noss 1999). 10-1 Gold Creek CEA Summary 10-2 Rocky Run Creek CEA Summary 10-3 Wolfe Creek CEA Summary 10-4 Resort Creek CEA Summary 10-5 Townsend Creek CEA Summary 10-6 Price and Noble Creeks CEA Summary 10-7 Bonnie Creek CEA Summary 10-8 Swamp Creek CEA Summary 10-9 Toll Creek CEA Summary 10-10 Cedar Creek CEA Summary 10-11 Telephone Creek CEA Summary 10-12 Hudson Creek CEA Summary 10-13 Easton Hill CEA Summary 10-14 Kachess River/Lake Easton CEA Summary 11-1 Framework for evaluating the performance of ecological connectivity measures. 12-1 Remote digital infrared-operated camera (Source: T Clevenger/WTI). 12-2 Raking of track bed in culvert, Banff National Park, Alberta (Source: T Clevenger/WTI). 12-3 Sooted track plate with tracks of small- and medium-sized mammals (R. Long/WTI). 12-4 Diagram of hair-snagging system at a wildlife underpass used in DNA-based research of
population-level benefits of crossing structures (Source: T Clevenger/WTI). 12-5 Grizzly bear passing through hair-snagging device at wildlife overpass in Banff National
Park, Alberta (Source: T Clevenger/WTI). 12-6 Digital barcode tag for frogs (Source: S Wagner/CWU). 12-7 Scat-detection dog working to locate scat (Source: R Long/WTI). 12-8 Roadkill Observation Collection System (ROCS) (Source: WTI).
Washington State Department of Transportation Page vi
I-90 Wildlife Monitoring Plan, Western Transportation Institute February 2008
List of Acronyms CAT Project—Cougars and Teaching Project CEA—Connectivity Emphasis Area CTIP—Coordinated Federal Lands Highway Technology Implementation Program CWU—Central Washington University DDF—Doris Duke Foundation FHWA—Federal Highways Administration FLHP—Federal Lands Highway Program GIS—Geographic Information System GPS—Global Positioning System HSIP—Highway Safety Improvement Program I-90—US Interstate 90 MDT—Mitigation Development Team MP—Milepost MSU—Montana State University NFF—National Forest Foundation PDA—Personal Digital Assistant PV—Population viability ROCS—Roadkill Observation Collection System ROW—Right-of-way SAFETEA-LU—Safe Accountable Flexible Efficient Transportation Equity Act: A Legacy for Users SHSP—Strategic Highway Safety Plan STEP—Surface Transportation Environment and Planning Cooperative Research Program TEP—Transportation Enhancement Program USDA—US Department of Agriculture USDI—US Department of the Interior USFS—US Forest Service USFWS—US Fish and Wildlife Service UTC—University Transportation Center WCS—Wildlife Conservation Society WDFW—Washington Department of Fish and Wildlife WSDOT—Washington Department of Transportation WTI—Western Transportation Institute WVC—Wildlife-Vehicle Collision
Washington State Department of Transportation Page vii
I-90 Wildlife Monitoring Plan, Western Transportation Institute February 2008
Executive Summary
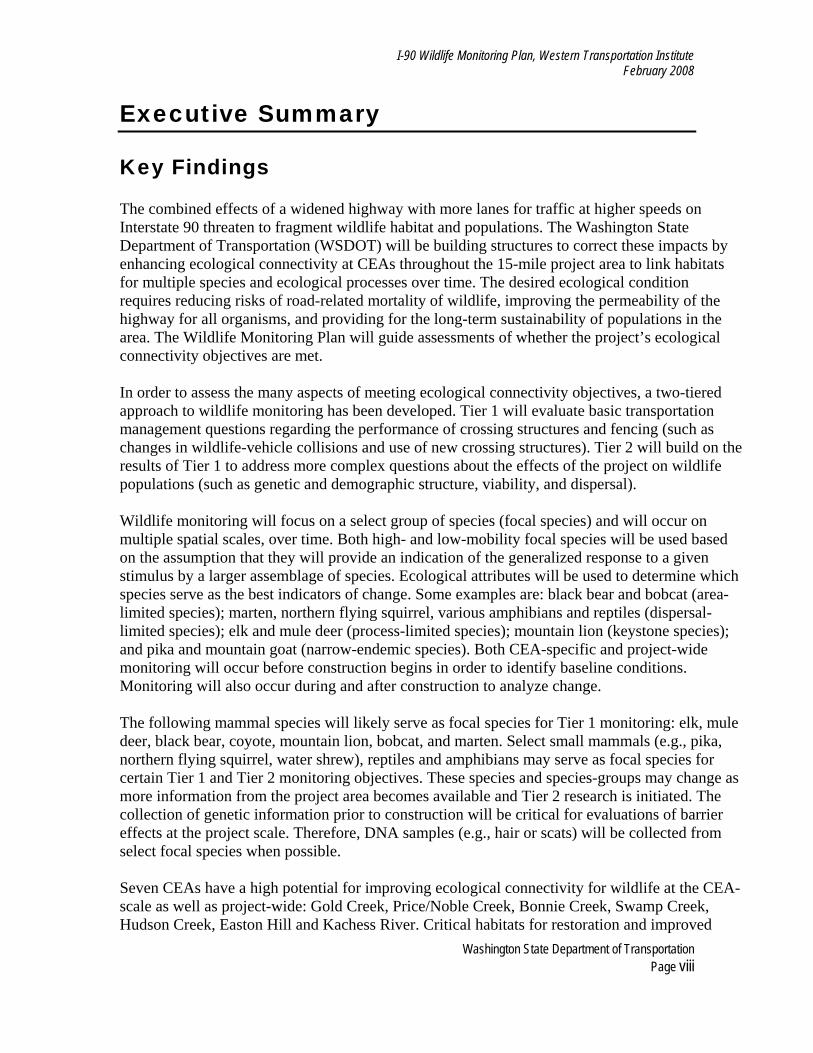
Key Findings The combined effects of a widened highway with more lanes for traffic at higher speeds on Interstate 90 threaten to fragment wildlife habitat and populations. The Washington State Department of Transportation (WSDOT) will be building structures to correct these impacts by enhancing ecological connectivity at CEAs throughout the 15-mile project area to link habitats for multiple species and ecological processes over time. The desired ecological condition requires reducing risks of road-related mortality of wildlife, improving the permeability of the highway for all organisms, and providing for the long-term sustainability of populations in the area. The Wildlife Monitoring Plan will guide assessments of whether the project’s ecological connectivity objectives are met. In order to assess the many aspects of meeting ecological connectivity objectives, a two-tiered approach to wildlife monitoring has been developed. Tier 1 will evaluate basic transportation management questions regarding the performance of crossing structures and fencing (such as changes in wildlife-vehicle collisions and use of new crossing structures). Tier 2 will build on the results of Tier 1 to address more complex questions about the effects of the project on wildlife populations (such as genetic and demographic structure, viability, and dispersal). Wildlife monitoring will focus on a select group of species (focal species) and will occur on multiple spatial scales, over time. Both high- and low-mobility focal species will be used based on the assumption that they will provide an indication of the generalized response to a given stimulus by a larger assemblage of species. Ecological attributes will be used to determine which species serve as the best indicators of change. Some examples are: black bear and bobcat (area-limited species); marten, northern flying squirrel, various amphibians and reptiles (dispersal-limited species); elk and mule deer (process-limited species); mountain lion (keystone species); and pika and mountain goat (narrow-endemic species). Both CEA-specific and project-wide monitoring will occur before construction begins in order to identify baseline conditions. Monitoring will also occur during and after construction to analyze change. The following mammal species will likely serve as focal species for Tier 1 monitoring: elk, mule deer, black bear, coyote, mountain lion, bobcat, and marten. Select small mammals (e.g., pika, northern flying squirrel, water shrew), reptiles and amphibians may serve as focal species for certain Tier 1 and Tier 2 monitoring objectives. These species and species-groups may change as more information from the project area becomes available and Tier 2 research is initiated. The collection of genetic information prior to construction will be critical for evaluations of barrier effects at the project scale. Therefore, DNA samples (e.g., hair or scats) will be collected from select focal species when possible. Seven CEAs have a high potential for improving ecological connectivity for wildlife at the CEA-scale as well as project-wide: Gold Creek, Price/Noble Creek, Bonnie Creek, Swamp Creek, Hudson Creek, Easton Hill and Kachess River. Critical habitats for restoration and improved
Washington State Department of Transportation Page viii

I-90 Wildlife Monitoring Plan, Western Transportation Institute February 2008
connectivity associated with these CEAs are subalpine, late-successional forest, talus, wetlands and adjacent wilderness areas. Each CEA’s design measures differed based on whether they sought to provide connectivity for fragmentation-sensitive species (i.e., rare, wide-ranging and/or localized species generally sensitive to roads) or common species (i.e., widespread species in project area that are generally less sensitive to road disturbance). This distinction also helps determine the allocation of sub-samples for monitoring as well as the type of performance evaluation. Fragmentation-sensitive CEAs include Gold Creek, Easton Hill and Kachess River, while combined fragmentation-sensitive/common species CEAs include Price/Noble Creek, Bonnie Creek, Swamp Creek, Toll Creek, and Hudson Creek. CEAs with common species include Rocky Run, Wolfe Creek and Resort Creek. This monitoring framework will guide performance evaluations of the project’s design measures for terrestrial ecological connectivity in terms of individual organisms and their populations. While the Wildlife Monitoring Plan addresses amphibians, it does not address the monitoring of fish or most other aquatic resources. Sample targets are provided to measure and assess whether the connectivity design measures are meeting the project’s goal and objectives.
Recommended Actions Tier 1 Monitoring In this plan there are six Tier 1 monitoring objectives proposed, they include the following:
1. Evaluate the locations and rate of wildlife-vehicle collisions; 2. Assess the use and effectiveness of wildlife crossing structures—both existing and
planned; 3. Characterize the locations and rate of at-grade highway crossings by wildlife; 4. Estimate species occurrence and distribution in the project area; 5. Assess the effectiveness of fencing; and 6. Appraise the effectiveness of jump-outs.
These objectives were selected based on the goal of WSDOT to assess the performance of connectivity measures associated with the I-90 Snoqualmie Pass East Project. Tier 2 research projects will help to further examine objectives for increasing connectivity by the project as defined by the multi-agency Mitigation Development Team (WSDOT 2006). Listed below in Exhibit ES-1 are the recommended Tier 1 wildlife monitoring objectives, when the monitoring should be conducted relative to construction, the primary survey methods, focal species and location of the monitoring within the project area.
Washington State Department of Transportation Page ix
I-90 Wildlife Monitoring Plan, Western Transportation Institute February 2008
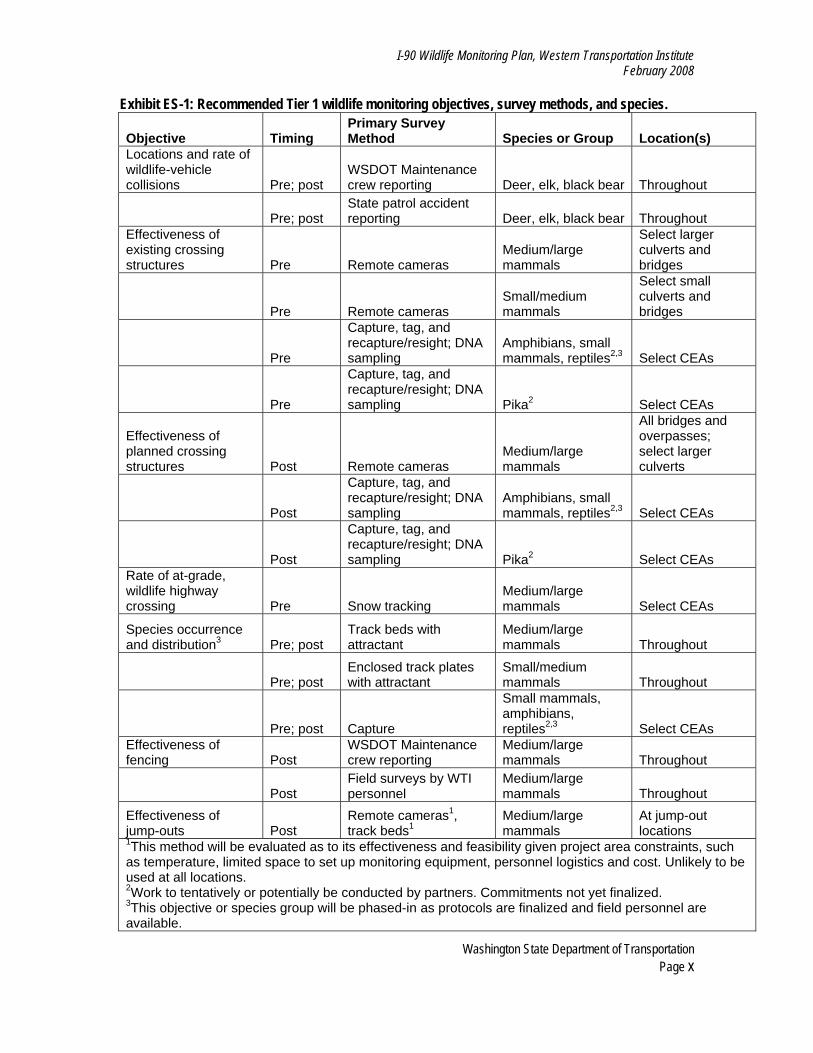
Exhibit ES-1: Recommended Tier 1 wildlife monitoring objectives, survey methods, and species.
Objective Timing Primary Survey Method Species or Group Location(s)
Locations and rate of wildlife-vehicle collisions Pre; post
WSDOT Maintenance crew reporting Deer, elk, black bear Throughout
Pre; post State patrol accident reporting Deer, elk, black bear Throughout
Effectiveness of existing crossing structures Pre Remote cameras
Medium/large mammals
Select larger culverts and bridges
Pre Remote cameras Small/medium mammals
Select small culverts and bridges
Pre
Capture, tag, and recapture/resight; DNA sampling
Amphibians, small mammals, reptiles2,3 Select CEAs
Pre
Capture, tag, and recapture/resight; DNA sampling Pika2 Select CEAs
Effectiveness of planned crossing structures Post Remote cameras
Medium/large mammals
All bridges and overpasses; select larger culverts
Post
Capture, tag, and recapture/resight; DNA sampling
Amphibians, small mammals, reptiles2,3 Select CEAs
Post
Capture, tag, and recapture/resight; DNA sampling Pika2 Select CEAs
Rate of at-grade, wildlife highway crossing Pre Snow tracking
Medium/large mammals Select CEAs
Species occurrence and distribution3 Pre; post
Track beds with attractant
Medium/large mammals Throughout
Pre; post Enclosed track plates with attractant
Small/medium mammals Throughout
Pre; post Capture
Small mammals, amphibians, reptiles2,3 Select CEAs
Effectiveness of fencing Post
WSDOT Maintenance crew reporting
Medium/large mammals Throughout
Post Field surveys by WTI personnel
Medium/large mammals Throughout
Effectiveness of jump-outs Post
Remote cameras1, track beds1
Medium/large mammals
At jump-out locations
1This method will be evaluated as to its effectiveness and feasibility given project area constraints, such as temperature, limited space to set up monitoring equipment, personnel logistics and cost. Unlikely to be used at all locations. 2Work to tentatively or potentially be conducted by partners. Commitments not yet finalized. 3This objective or species group will be phased-in as protocols are finalized and field personnel are available.
Washington State Department of Transportation Page x
I-90 Wildlife Monitoring Plan, Western Transportation Institute February 2008
Occurrence and Rate of Wildlife-Vehicle Collisions (WVCs) Wildlife-vehicle collisions should primarily be monitored via data collected by WSDOT Maintenance crews and the State patrol. These sources of data are already operational and will require relatively little additional cost. Efforts to instruct WSDOT personnel about species types and reasons for accurate monitoring, however, should occur for the program to best meet the monitoring objectives. The feasibility and effectiveness of concurrent surveys by Western Transportation Institute (WTI) personnel should also be evaluated as an additional source of WVC data that can be used to validate or calibrate data collected by WSDOT and the State patrol. These additional surveys will be more costly but may help to address the inconsistencies in data that result when information is collected by non-research personnel, as well as providing information on smaller animals. Effectiveness of Existing Crossing Structures Existing crossing structures will be monitored prior to construction to determine rate of crossings by wildlife and factors (structural and habitat) that influence passage using a multivariate analysis. The use of remote cameras will be the most effective method for assessing the rate at which medium and large focal species use existing structures (e.g., culverts, bridges) to cross the highway. Alternatively, track beds should be evaluated for use at select structures during drier times of the year. Although track beds cost less to deploy, they require substantially more staff time to maintain and cannot be operated at sites with running water nor on steeper slopes. Further, interpretation of tracks is typically more ambiguous than assigning species to photographs. The authors propose that the monitoring of amphibians, reptiles, and small mammals at select sites be conducted via capture, tag, and recapture/resight and DNA sampling methods. Effectiveness of Planned Crossing Structures Planned crossing structures will be monitored post-construction to determine rate of crossings by wildlife and factors (structural and habitat) that facilitate passage using a multivariate analysis. As with the monitoring of existing structures, remote cameras will be the most effective survey method for this objective. Because most planned structures will be designed to be dry, the authors suspect that track beds will be a viable secondary method and can help to assess the effectiveness of remote cameras while also providing backup in the case of non-functional or stolen cameras. As with monitoring existing structures, the authors propose that the monitoring of amphibians, reptiles, and small mammals at select sites be conducted via capture, tag, and recapture/resight and DNA sampling methods. Rate of At-Grade Wildlife Highway Crossings
Washington State Department of Transportation Page xi
Assessing the rate of at-grade wildlife highway crossings is the most difficult of the Tier 1 objectives to accomplish. The authors propose snow tracking as the most effective method for collecting crossing data during the winter. For non-winter periods evaluating the use of remote cameras deployed with sensors aimed parallel to the direction of the highway as one potential method to detect attempted at-grade crossings of medium and large mammals is recommended. In some locations track beds deployed along the road may also be feasible, however, the authors suspect such locations will be limited and the logistics of deploying track beds in this manner may be difficult. Both “snow free” methods are recommended for evaluation only, given the
I-90 Wildlife Monitoring Plan, Western Transportation Institute February 2008
constraints in study design and potential for data collection (see Survey Methods, Appendix D). The authors recommend utilizing global positioning system (GPS) collars on species such as black bears, mountain lions, and elk to provide important taxa-specific data on successful crossings. Species Occurrence Remote cameras deployed with an attractant at scent stations (or “detection stations”) is the method of choice to meet this objective. The up-front cost of purchasing cameras for many detection stations, however, would be substantial. If initial funding for cameras is not possible for all stations, then track beds deployed with an attractant should be used as the primary method for collecting detection/non-detection data for mid-sized and large mammals. Enclosed track plates are recommended for detecting some medium and small mammals, and capture methods are recommended for amphibians, reptiles, and small mammals. Given the time commitment required to access and maintain track bed and track plate stations, or to conduct capture-based surveys, it is anticipated that these objectives will require phasing-in as time and personnel permit. Remote cameras should be deployed at as many stations as is feasible to permit validation of track bed results. Also, it is recommended that hair collection devices designed for certain focal species be deployed at select detection stations, and that DNA from collected hair be extracted and stored for future Tier 2 analyses. Collecting genetic information prior to construction will support Tier 2 analyses designed to assess barrier effects at population levels. Effectiveness of Fencing Fencing effectiveness would best be assessed via reports of animals inside the wildlife fencing by WSDOT Maintenance crews, complemented with bi-annual surveys of fence integrity by WTI personnel. Effectiveness of Jump-Outs Monitoring of jump-outs is best conducted with the use of remote cameras if funding to purchase cameras is available. Track beds installed at the top of the jump out and monitored frequently would be a viable alternative, although the personnel cost to maintain such beds would be substantial. Tier 2 Monitoring and Research A number of ongoing wildlife research projects and projects in development may facilitate development of Tier 2 monitoring and evaluation. Listed below are four Tier 2 objectives that are recommended as high priority for development. For each objective there is a corresponding monitoring metric, monitoring method(s) and potential focal species (see Exhibit ES-2).
Washington State Department of Transportation Page xii

I-90 Wildlife Monitoring Plan, Western Transportation Institute February 2008
Exhibit ES-2: Examples of Tier 2 ecological connectivity studies.
Objective Timing Primary Survey Method Species Location(s)
Population-level benefits1 Pre; post Hair collection, scat-detection dogs Black bear2 Throughout
Regional species occurrence1 Pre; post
Remote cameras, hair collection, tracking, scat-detection dogs Wolverine2 Throughout
Population viability analysis1 Post Computer-based analysis Mountain lion2 Throughout
Extent of human disturbance Pre; post
GIS mapping, spatial statistics, trail/traffic counters
Not Applicable Throughout
1 Work to tentatively be conducted by other partners. Commitments not yet finalized. 2 Sample focal species
Assessing the Effect of the Project’s Connectivity Measures on the Genetic and Demographic Connectivity of Wildlife Populations Monitoring metric: Genetic assessment of number and sex of animals using the wildlife crossing structures; pre- and post-construction genetic assessment of population-level barrier effect of I-90. This can be accomplished through the use of non-invasive DNA-based methods to identify (a) individuals using wildlife crossing structures and (b) individuals in the local population to objectively evaluate how wildlife crossing structures benefit population connectivity. GPS collaring (see Appendix E) could also provide valuable information about the rate and location of crossing structure use. Potential focal species may include black bears, mountain lions, martens, and amphibian/reptile species. Assessing Species Occurrence in the Larger Landscape Adjacent to the I-90 Project Corridor Monitoring metric: Pre- and post-construction wildlife use of locations across the larger landscape. Several methods could be used including remote still cameras or video at scent stations, track beds or track plates at scent stations or hair collection devices with DNA methods. Many potential focal species could be used for evaluating this objective. Assessing the Probability of Wildlife Species Persistence in the Project Area as a Result of the Increased Connectivity Afforded by the Project’s Connectivity Measures Monitoring metric: Spatially explicit population viability models to explore levels of connectivity provided by the project’s connectivity design measures. The development of spatially-explicit, individual-based population viability models using life-stage simulation analysis would help evaluate this objective. Although commercial programs are available, customized programming provides greater flexibility and more robust model results. Modeling would integrate landscape suitability and empirical data on demographic parameters from other species-specific research conducted as part of the project.
Washington State Department of Transportation Page xiii
I-90 Wildlife Monitoring Plan, Western Transportation Institute February 2008
Isolating or Controlling for the Influence of Potentially Confounding Human Activity and Disturbance on the Performance of the Connectivity Measures Monitoring metric: Extent, distribution and level of human activity (e.g., recreational activities, built areas, low-volume and forest road traffic) at or near wildlife crossing structures. Several techniques could be used including trail counters, traffic counters, geographic information system (GIS) analyses and spatial statistics. Surveys and data collection could be in collaboration with the United States Forest Service (USFS). The Use of Experimental Controls Studies intending to evaluate differences in a state variable (e.g., abundance) between two or more locations or times should include multiple “control” sites. Such controls ensure that putative effects are not simply the result of regional variability in the state variables that are unrelated to the impact of interest. We suggest that Tier 2 projects attempt to incorporate controls whenever possible. These could include sites located away from the project area.
Next Steps This monitoring plan discusses recommended Tier 1 monitoring objectives, candidate focal species for monitoring, available survey methods for wildlife monitoring, and the application of methods in relation to specific CEAs in the project area. In addition, it makes suggestions for assessing a variety of Tier 2 objectives. These topics comprise the components and background for implementing a wildlife monitoring program. Steps to ultimately make this plan operational will occur as sufficient information is gathered to permit the planning of each component, and as the personnel required to complete each component are available or can be arranged. The collection of pertinent information (e.g., which specific existing crossing structures are able to be monitored?) and the resulting monitoring design decisions that flow from this information will be summarized in a series of memoranda, each relating to a different component or subcomponent of monitoring. Such memoranda will be incorporated as scope items and deliverables of future monitoring. For example, the following actions have recently been completed or are currently underway:
• a ground-based evaluation of existing crossing structures and culverts suitable for pre-construction monitoring;
• an evaluation of available WVC data, WSDOT’s and other agencies’ current WVC collection protocols, and an assessment of needs for future pre- and post-construction WVC monitoring;
• field testing of various wildlife detection and monitoring methods (e.g., remote camera testing and snow tracking pilot surveys);
• a review of data collection protocols and specific protocol recommendations such as how to locate survey sites, sampling duration, survey timing, and sampling occasion and length (i.e., duration between checks of remote cameras or track beds).
Following the completion of these subcomponent evaluations, appropriate preparations for monitoring (e.g., hiring of additional personnel, equipment purchase, logistical planning) can
Washington State Department of Transportation Page xiv

I-90 Wildlife Monitoring Plan, Western Transportation Institute February 2008
Washington State Department of Transportation Page xv
begin. While the planning of some objectives or components cannot commence until after items such as those above are completed, some wildlife monitoring will be conducted during the completion of such evaluations. For example, it is expected that some snow tracking transects will be completed and that some existing crossing structures will be monitored by remote cameras during March–April 2008.
I-90 Wildlife Monitoring Plan, Western Transportation Institute February 2008
1. Introduction
Purpose and Goals of the Wildlife Monitoring Plan The purpose of this monitoring plan is to guide the design and implementation of pre- and post- construction monitoring of ecological connectivity for wildlife. The plan discusses a tiered approach that will be required to adequately meet the requirements of both CEA-specific monitoring as well as the project’s broad, landscape-based ecological objectives. The plan also provides recommendations for specific survey methods and gives suggestions for how to best initiate activities given certain time constraints. The project relies heavily on interagency collaboration and common understanding among stakeholder groups. Implementing the multi-scale, multi-staged, wildlife monitoring plan will also require a coordinated approach. The plan highlights the funding and partnership opportunities that will ultimately enable its goals to be realized.
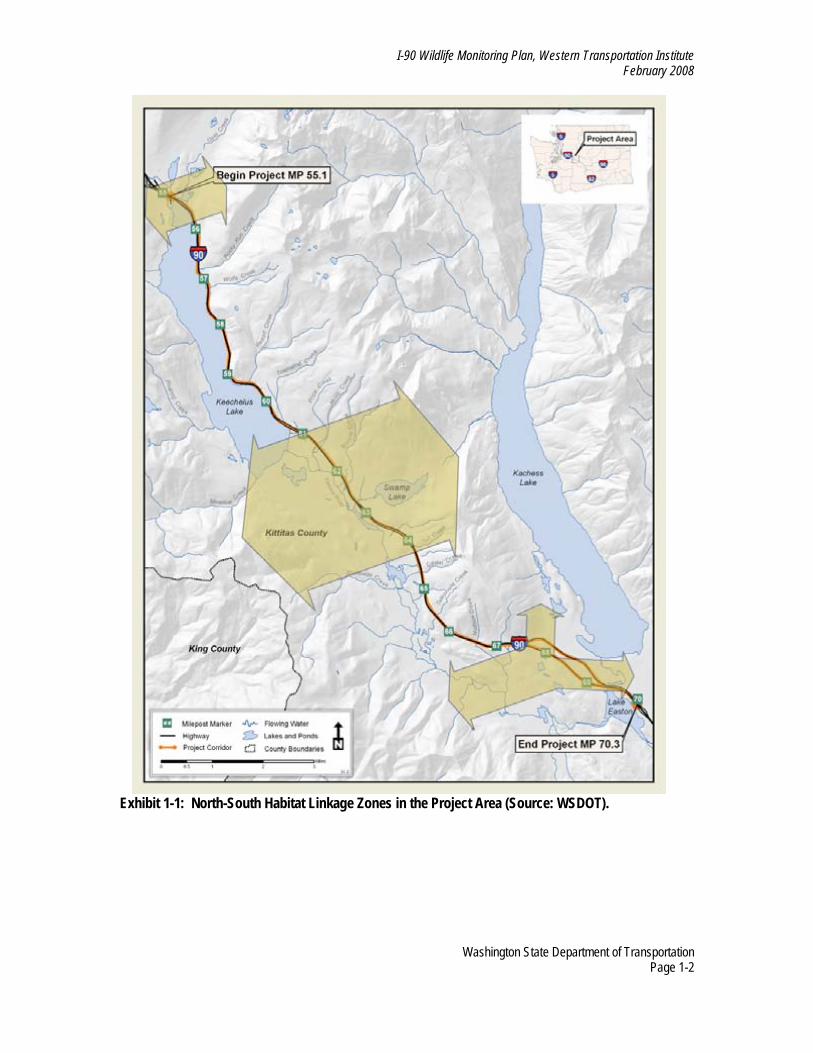
Project Setting The Snoqualmie Pass East Project is located in the Cascade Mountain Range (Cascades) of Washington, along 15 miles of I-90 that pass through the Okanogan-Wenatchee National Forest (Exhibit 1-1). The project corridor is part of a 100-mile scenic byway known as the Mountains to Sound Greenway—the first stretch of interstate highway in the country to be designated a National Scenic Byway. The project corridor occupies the Upper Yakima River Sub-Basin east of the Cascade crest. The topography is mountainous and situated in a rain-shadow that causes highly variable patterns of precipitation ranging from 140 inches per year at Snoqualmie Pass to 50 inches per year at Easton. The area is an important ecotone between the dry interior and wet coastal zones, and a center of high biodiversity (Hansen et al. 1991).
Washington State Department of Transportation Page 1-1
I-90 Wildlife Monitoring Plan, Western Transportation Institute February 2008
Exhibit 1-1: North-South Habitat Linkage Zones in the Project Area (Source: WSDOT).
Washington State Department of Transportation Page 1-2
I-90 Wildlife Monitoring Plan, Western Transportation Institute February 2008
Landscape Conservation and Biodiversity Values The project area lies within the boundaries of the Snoqualmie Pass Adaptive Management Area, which was created by the Northwest Forest Plan for areas within the range of the northern spotted owl (see Appendix A for common and scientific names of wildlife species cited). The Plan highlighted the importance of the Snoqualmie Pass area for maintaining ecological connectivity in the Cascades. Numerous public and private entities have made extensive efforts to improve the ecological conditions in the upper Yakima River watershed, including land management plans that emphasize ecological connectivity, land exchanges, and purchases of private lands for transfer to public ownership. Currently, approximately 80,000 acres have been consolidated and conserved by the USFS or private non-profit conservation organizations in the area. Adequate connections between habitats and hydrologic features on either side of I-90 are necessary for the continued health of the project area’s diverse ecosystems. Threats to Biodiversity At the landscape scale the project area is positioned between a number of important wilderness areas and national parks, which provide refuge for wildlife. The project corridor has been identified as a critical connectivity zone for Pacific Northwest wildlife populations (e.g., Thomas et al. 1990) linking natural habitats on public lands–national forests, wilderness areas, national parks–both to the north and south of the project area. The project corridor represents the narrowest width, west to east, of public land in the Washington Cascades. Apart from being an area of high biodiversity, the central Cascades region east of Snoqualmie Pass is a critical link for the north-south movement of organisms in the greater Cascade Range (USFS and USDI 1994). At the project scale, the USFS has identified more than 49 species of amphibians, mammals, and birds that are closely associated with late-successional habitat or old-growth forest in the area. Research by Singleton and Lehmkuhl (2000) indicated that the project area provided important linkages for the local movement of wildlife, as well as broader ecological connectivity between the north and south Cascades. Their study further identified three significant north-south linkage zones within the project area, each with its own distinct species assemblages (WSDOT 2006). Interstate 90 Traffic Levels Some wildlife species (e.g., wolverine, Canada lynx) may avoid crossing I-90 due primarily to disturbance from traffic noise. Studies have shown that habitat quality for some wildlife species deteriorates close to busy highways (Reijnen and Foppen 1994, Forman and Deblinger 2000). Other research has demonstrated how highways can negatively affect wildlife distribution and movements (Rowland et al. 2000, Sweanor et al. 2000, Chruszcz et al. 2003). Between 1991 and 2001, more than 240 deer and elk were reported killed in collisions with motor vehicles in the project area (WSDOT 2006). The I-90 corridor is believed to be a partial or complete barrier to wildlife movement (Singleton and Lehmkuhl 2000). On the average day 28,000 vehicles pass through the project area, and on busy weekends the number increases to as
Washington State Department of Transportation Page 1-3
I-90 Wildlife Monitoring Plan, Western Transportation Institute February 2008
many as 58,000 per day (WSDOT 2005). If averaged over the course of the day this adds up to the passing of one vehicle every 3.1 and 1.5 seconds, respectively. Over the next 20 to 30 years, traffic volumes on this section of I-90 are expected to double. To accommodate the increased traffic on I-90, the project will widen the highway from four to six lanes. The combined effects of increased traffic volume, a wider highway, and increased traffic speed will further fragment wildlife habitat and populations. Structures designed to enhance ecological connectivity will need to provide habitat linkages for multiple species and ecological processes over time (WSDOT 2006). Other Compounding Factors Interstate 90 is one of many landscape elements that affect animal movements within the upper Yakima River Valley east of Snoqualmie Pass. Forest harvesting, railroads, reservoirs, high road densities, seasonal nodes of human activity, and areas of residential and commercial development all affect landscape permeability at local and regional scales. Many of these agents of habitat fragmentation are dynamic in nature, and some can be managed to enhance the future connectivity potential of the area for wildlife populations. However, one clear trend is that traffic volumes in the project corridor are increasing, and are predicted to continue to increase at an average of 2 to 3 percent per year. Future residential development and other activities that result in the alteration and loss of habitat in the upper Yakima River Valley will also profoundly affect the region, with commuting traffic contributing to increasing traffic volumes on I-90 and remaining areas of natural habitat being further reduced in size and continuity.
Ecological Connectivity Objectives Definitions of Ecological Connectivity To maintain or restore the biological integrity of the area impacted by the I-90 transportation corridor, measures designed to allow for ecological connectivity in the project area are necessary. Explicitly identifying which connectivity measures were appropriate and where they should occur was a task undertaken by the multi-agency MDT subcommittee organized by WSDOT for the I-90 Snoqualmie Pass East project and composed of the stakeholder agencies in the project area (see WSDOT 2006).
Washington State Department of Transportation Page 1-4

I-90 Wildlife Monitoring Plan, Western Transportation Institute February 2008
Washington State Department of Transportation Page 1-5
As part of its recommendation package, the MDT defined ecological connectivity as: “The movement of organisms and the occurrence of ecological processes across an ecosystem over time. Intact ecosystems are structured by dynamic processes that create a shifting mosaic of various habitat patches. The ability of organisms to disperse freely through this mosaic is important to allow genetic exchange, re-colonization of habitats, and maintenance of functioning food webs. Genetic variability is a species’ insurance against localized or population level disturbances and ultimately improves an organism’s evolutionary potential. The ultimate outcome is natural sustaining populations across an ecosystem over time” (WSDOT 2006). This definition provides the basis for monitoring and research designed to evaluate whether the project-wide objectives of increasing ecological connectivity for the project’s transportation corridor are met during the phased reconstruction of the highway. Project-Wide Objectives The MDT report identified broad objectives to determine whether project designs would meet the goal of increased ecological connectivity. These objectives can be refined into three questions:
• Are aquatic and terrestrial habitats sufficiently linked to function properly for the species they support? Habitats of particular importance include old-growth forests, upland forests, wetlands, riparian habitats, streams and unique habitats such as talus.
• Are hydrological processes sufficiently connected to permit the proper function of stream channels, riparian areas, floodplains, channel capacity and movement, wetland flow paths and hydroperiods, and groundwater-surface water interactions?
• Will highway-related mortality and impediments to movement be reduced sufficiently to provide a moderate to high probability of sustaining local and regional populations of all species, and to reduce risks associated with demographic isolation and limited genetic variability?
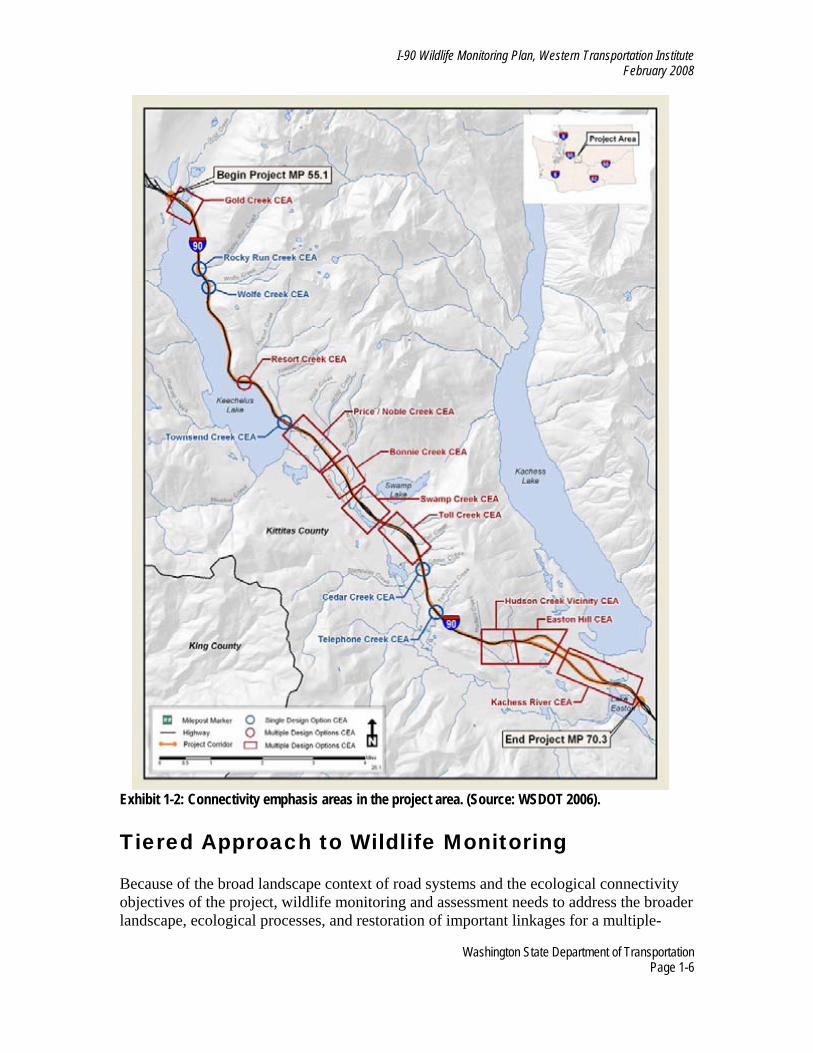
These objectives are project-wide analogs of watershed-scale performance standards developed by the MDT and assigned to the 14 CEAs identified in the project area (Attachment 3 of the MDT Report [WSDOT 2006]). Connectivity Emphasis Areas Connectivity Emphasis Areas are defined as areas within the project area where there is an opportunity to improve connectivity for a unique assemblage of species and/or habitat types (Exhibit 1-2). CEA-specific connectivity objectives consist of increasing movement by wildlife and reconnecting plant and animal populations separated by I-90. Effective planning and a monitoring feedback loop will be essential if WSDOT is to use an adaptive management approach for future phases of design and construction.
I-90 Wildlife Monitoring Plan, Western Transportation Institute February 2008
Exhibit 1-2: Connectivity emphasis areas in the project area. (Source: WSDOT 2006).
Tiered Approach to Wildlife Monitoring Because of the broad landscape context of road systems and the ecological connectivity objectives of the project, wildlife monitoring and assessment needs to address the broader landscape, ecological processes, and restoration of important linkages for a multiple-
Washington State Department of Transportation Page 1-6

I-90 Wildlife Monitoring Plan, Western Transportation Institute February 2008
species ecosystem. Implementing a wildlife monitoring plan at a range of spatial and ecological scales will require an unprecedented level of collaboration, and there will undoubtedly be challenges to funding and organizing such a project. Such challenges, however, will provide opportunities to develop partnerships to both facilitate research and to effectively leverage funds. A two-tiered approach to monitoring ecological connectivity in the project area makes practical sense given the array of objectives the various agencies and stakeholders bring to the project. Tier 1 examines basic transportation management questions regarding whether highway design measures increase movement of wildlife across the transportation corridor. Tier 2 builds on Tier 1 to help further assess whether ecological connectivity is achieved from having the highway design measures in place. Wildlife monitoring will be conducted at multiple spatial scales, including within CEAs, across the project area, and throughout the region. Tier 1 monitoring will be conducted primarily at the scale of CEAs and the project area. Tier 2 monitoring and research will encompass work at specific CEAs as well as landscape or regional studies of wide-ranging mammals. WSDOT will be the primary agency responsible for addressing Tier 1 objectives, while WSDOT and its public and private partners will collaborate to fund and address Tier 2 objectives. Tier 1 Tier 1 monitoring and assessment will be designed to evaluate the project’s connectivity measures at the scale of the project corridor. Specifically Tier 1 research will allow WSDOT to evaluate whether crossing structures are facilitating the cross-highway movements of wildlife, as well as to evaluate the performance of particular crossing designs, habitat restoration efforts, and fencing methods. Exhibit 1-3 includes project objectives and associated monitoring metrics identified for Tier 1. Exhibit 1-3: Tier 1 Objectives and Monitoring Metrics. Objective Monitoring Metric Reducing WVCs frequency of wildlife-vehicle collisions pre- and
post-construction Increasing animal use/effectiveness of wildlife crossing structures
crossing rates of animals using existing and proposed crossing structures
Measuring the frequency of at-grade, highway crossings by wildlife
rate of at-grade, wildlife highway crossings pre-construction
Increasing the area used by wildlife adjacent to the I-90 Project corridor
pre- and post-construction wildlife use of habitats adjacent to the project corridor
Reducing the frequency of wildlife intrusions into the highway ROW
effectiveness of wildlife fencing post-construction
Enabling wildlife to escape the highway ROW if intrusions occurs
effectiveness of wildlife jump-outs post-construction
Washington State Department of Transportation Page 1-7
I-90 Wildlife Monitoring Plan, Western Transportation Institute February 2008
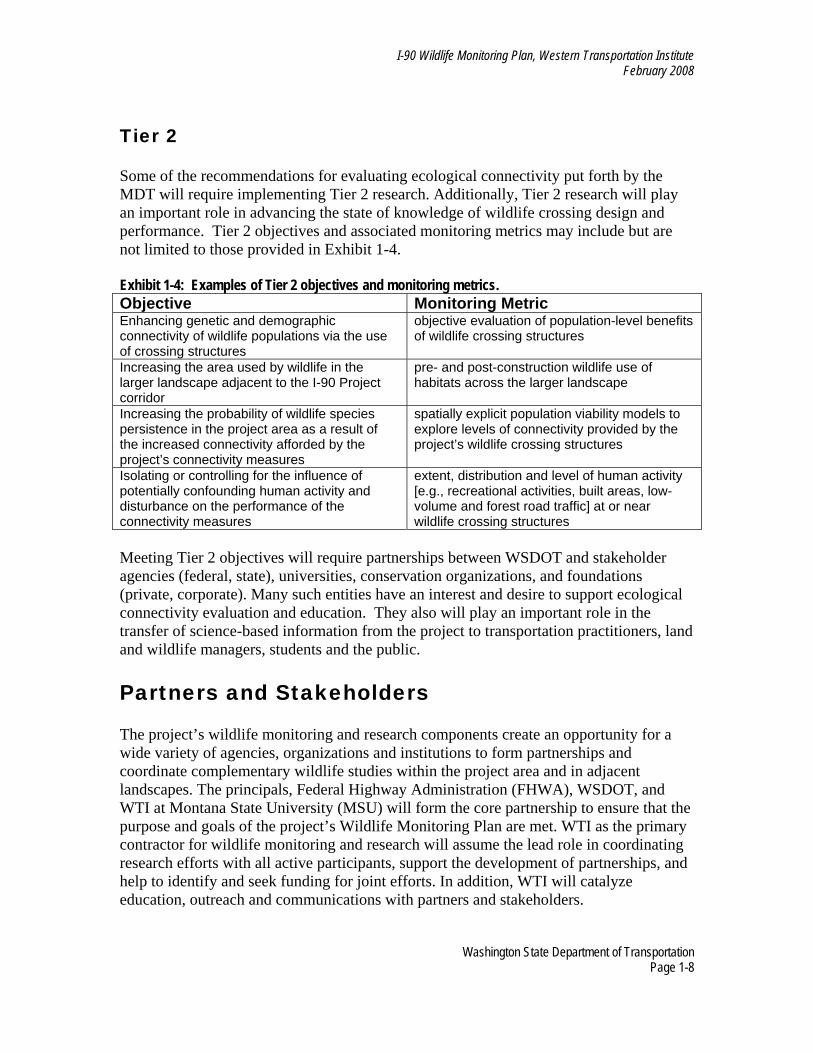
Tier 2 Some of the recommendations for evaluating ecological connectivity put forth by the MDT will require implementing Tier 2 research. Additionally, Tier 2 research will play an important role in advancing the state of knowledge of wildlife crossing design and performance. Tier 2 objectives and associated monitoring metrics may include but are not limited to those provided in Exhibit 1-4. Exhibit 1-4: Examples of Tier 2 objectives and monitoring metrics. Objective Monitoring Metric Enhancing genetic and demographic connectivity of wildlife populations via the use of crossing structures
objective evaluation of population-level benefits of wildlife crossing structures
Increasing the area used by wildlife in the larger landscape adjacent to the I-90 Project corridor
pre- and post-construction wildlife use of habitats across the larger landscape
Increasing the probability of wildlife species persistence in the project area as a result of the increased connectivity afforded by the project’s connectivity measures
spatially explicit population viability models to explore levels of connectivity provided by the project’s wildlife crossing structures
Isolating or controlling for the influence of potentially confounding human activity and disturbance on the performance of the connectivity measures
extent, distribution and level of human activity [e.g., recreational activities, built areas, low-volume and forest road traffic] at or near wildlife crossing structures
Meeting Tier 2 objectives will require partnerships between WSDOT and stakeholder agencies (federal, state), universities, conservation organizations, and foundations (private, corporate). Many such entities have an interest and desire to support ecological connectivity evaluation and education. They also will play an important role in the transfer of science-based information from the project to transportation practitioners, land and wildlife managers, students and the public.
Partners and Stakeholders The project’s wildlife monitoring and research components create an opportunity for a wide variety of agencies, organizations and institutions to form partnerships and coordinate complementary wildlife studies within the project area and in adjacent landscapes. The principals, Federal Highway Administration (FHWA), WSDOT, and WTI at Montana State University (MSU) will form the core partnership to ensure that the purpose and goals of the project’s Wildlife Monitoring Plan are met. WTI as the primary contractor for wildlife monitoring and research will assume the lead role in coordinating research efforts with all active participants, support the development of partnerships, and help to identify and seek funding for joint efforts. In addition, WTI will catalyze education, outreach and communications with partners and stakeholders.
Washington State Department of Transportation Page 1-8
I-90 Wildlife Monitoring Plan, Western Transportation Institute February 2008
Federal land management and wildlife agencies, the Washington Department of Fish and Wildlife (WDFW) and related state agencies, Central Washington University (CWU) and other academic institutions, non-governmental organizations, private foundations and other stakeholders that are interested in understanding and evaluating the effects of engineered connectivity measures on this segment of I-90 will be encouraged to participate. Many of these stakeholders already form part of a Wildlife Monitoring Technical Committee tasked with reviewing monitoring activities and ensuring that stakeholder concerns are met. Non-profit conservation organizations have formed the I-90 Wildlife Bridges Coalition which is collecting wildlife information in the project area as well as conducting outreach and education. These agencies and organizations will provide a variety of skills, experience and funding opportunities to further the goals of the project’s Wildlife Monitoring Plan.
Washington State Department of Transportation Page 1-9

I-90 Wildlife Monitoring Plan, Western Transportation Institute February 2008
Washington State Department of Transportation Page 1-10

I-90 Wildlife Monitoring Plan, Western Transportation Institute February 2008
2. Past and Current Activities in Project Area
Evaluation of Baseline Information Prior to the development of the I-90 Snoqualmie Pass East Project, WSDOT co-funded a multi-scale assessment of wildlife connectivity and barriers to animal movement along 35 miles of I-90 between Snoqualmie Pass and Cle Elum, between January 1998 and March 2000 by Singleton and Lehmkuhl (2000). Their assessment consisted of five components:
• Landscape-level GIS “least-cost path” modeling to identify potential existing habitat linkages for four guilds of wildlife species (including high-mobility and low-mobility taxa);
• GIS analysis of deer and elk road-kill distribution; • Remote camera surveys to evaluate wildlife distribution in the area around I-90; • Monitoring of existing culverts and bridges to document wildlife use; and • Winter snow tracking surveys to document animal distribution and I-90 crossing
locations. Results presented in Singleton and Lehmkuhl (2000) provide a good example of the information required for planning effective measures for restoring connectivity across busy highways–information that is rarely available for aiding transportation projects that are in the permitting phase. Despite the positive aspects of this research, it lacked the empirical data necessary to validate model results within the project study area. Indeed, very little of the information used by the MDT contained actual field study of terrestrial wildlife in the project area. Even basic presence information for most species is not available throughout the project area. Such information can currently only be predicted based on existing habitat and verified species presence in other parts of the Upper Yakima River Watershed (see WSDOT 2006, Attachment 2).
Existing Data and Studies The following past, current or future studies and assessments have been or will be conducted in the region surrounding the project area and are potentially relevant to the monitoring project at either the Tier 1 or Tier 2 level. The authors differentiate projects that were conducted in the past (P), from those currently underway (C) or being explored for future (F) study. Also noted is whether the project occurs within the I-90 Project corridor (IN) or elsewhere in the Cascades or other adjacent regions (OUT).
Washington State Department of Transportation Page 2-1
I-90 Wildlife Monitoring Plan, Western Transportation Institute February 2008
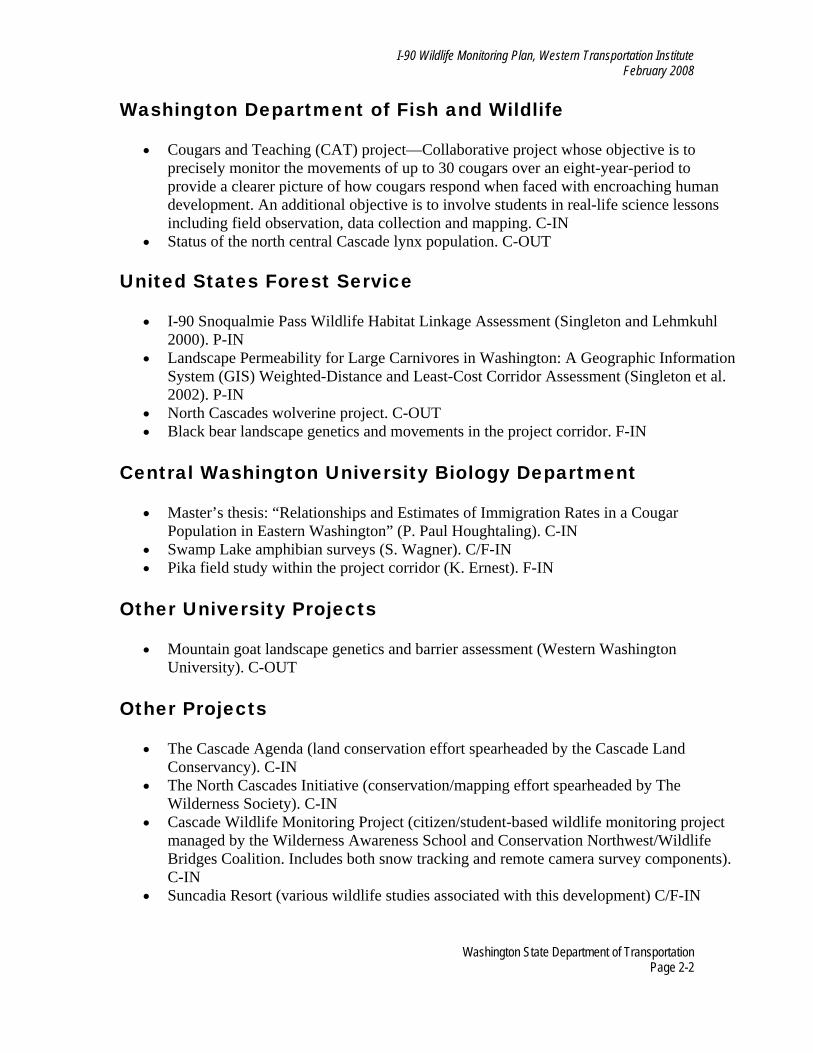
Washington Department of Fish and Wildlife
• Cougars and Teaching (CAT) project—Collaborative project whose objective is to precisely monitor the movements of up to 30 cougars over an eight-year-period to provide a clearer picture of how cougars respond when faced with encroaching human development. An additional objective is to involve students in real-life science lessons including field observation, data collection and mapping. C-IN
• Status of the north central Cascade lynx population. C-OUT
United States Forest Service
• I-90 Snoqualmie Pass Wildlife Habitat Linkage Assessment (Singleton and Lehmkuhl 2000). P-IN
• Landscape Permeability for Large Carnivores in Washington: A Geographic Information System (GIS) Weighted-Distance and Least-Cost Corridor Assessment (Singleton et al. 2002). P-IN
• North Cascades wolverine project. C-OUT • Black bear landscape genetics and movements in the project corridor. F-IN
Central Washington University Biology Department
• Master’s thesis: “Relationships and Estimates of Immigration Rates in a Cougar Population in Eastern Washington” (P. Paul Houghtaling). C-IN
• Swamp Lake amphibian surveys (S. Wagner). C/F-IN • Pika field study within the project corridor (K. Ernest). F-IN
Other University Projects
• Mountain goat landscape genetics and barrier assessment (Western Washington University). C-OUT
Other Projects
• The Cascade Agenda (land conservation effort spearheaded by the Cascade Land Conservancy). C-IN
• The North Cascades Initiative (conservation/mapping effort spearheaded by The Wilderness Society). C-IN
• Cascade Wildlife Monitoring Project (citizen/student-based wildlife monitoring project managed by the Wilderness Awareness School and Conservation Northwest/Wildlife Bridges Coalition. Includes both snow tracking and remote camera survey components). C-IN
• Suncadia Resort (various wildlife studies associated with this development) C/F-IN
Washington State Department of Transportation Page 2-2

I-90 Wildlife Monitoring Plan, Western Transportation Institute February 2008
3. Monitoring Framework and Guidelines A monitoring framework is essential for determining whether the project’s connectivity design measures (i.e., crossing structures, fencing) are meeting the ecological connectivity needs both at the CEA level and project-wide. The framework for the project evaluation consists of developing metrics for these two levels of ecological connectivity and is central to Tier 1 monitoring. Tier 2 research will seek partners to evaluate the impacts of the design measures on wildlife population demography and genetic structure. In addition, examining changes in demography and genetic structure may support research that will enable the assessment of long-term viability of wildlife populations. Wildlife monitoring will address CEA-specific objectives as well as project-wide objectives, with each encompassing a range of focal species, spatial scales, and pre- and/or post-construction periods. Focal species are used with the assumption that the monitored species will respond to connectivity enhancement measures similarly to most other species.
Monitoring Objectives The MDT report identified two broad objectives specific to improving wildlife/terrestrial species linkages that were designed to meet the ecological connectivity goals (WSDOT 2006). The first objective is to evaluate whether terrestrial habitats are adequately linked to allow for the movement of wildlife between core habitats, meet their biological needs, and adapt to changing landscape conditions. Of particular importance are unique habitats in the project area such as talus and old-growth forests, in addition to upland forests, wetlands, and riparian habitats. The second objective is to reduce highway-related mortality of wildlife and impediments to their movements to ensure sustaining local and regional populations of all species, and reducing risks associated with demographic isolation and limited genetic variability. Project monitoring will be conducted at three spatial scales:
• Local-scale or site-specific monitoring at particular CEAs • Project-scale monitoring covering the entire 15-mile project area • Landscape or regional scale monitoring and research
Information obtained from individual CEA-based monitoring will be of value for evaluating project objectives at those CEAs, or for wildlife with localized populations (i.e., low-mobility species such as pikas with entire populations centered around one or within a few CEAs). Additionally, the collective information from CEA-based monitoring will be used to determine whether project-wide ecological connectivity needs were met for high-mobility species. Project- and landscape-scale monitoring will be used to evaluate project-wide objectives, particularly for wide-ranging species. Finally, the collection of valuable genetic information prior to construction will be critical for analyses designed to assess barrier effects at the project or landscape scale. The authors
Washington State Department of Transportation Page 3-1
I-90 Wildlife Monitoring Plan, Western Transportation Institute February 2008
recommend the collection of DNA samples (e.g., hair or scats) for select focal species be employed wherever and whenever possible.
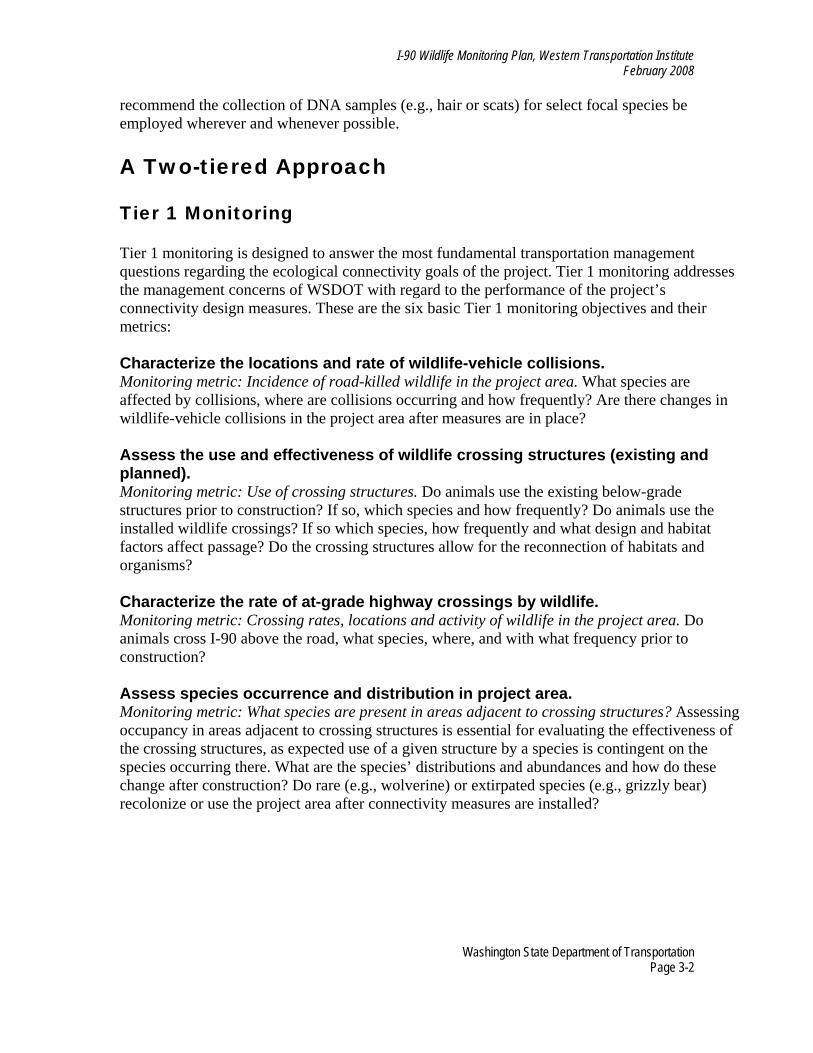
A Two-tiered Approach Tier 1 Monitoring Tier 1 monitoring is designed to answer the most fundamental transportation management questions regarding the ecological connectivity goals of the project. Tier 1 monitoring addresses the management concerns of WSDOT with regard to the performance of the project’s connectivity design measures. These are the six basic Tier 1 monitoring objectives and their metrics: Characterize the locations and rate of wildlife-vehicle collisions. Monitoring metric: Incidence of road-killed wildlife in the project area. What species are affected by collisions, where are collisions occurring and how frequently? Are there changes in wildlife-vehicle collisions in the project area after measures are in place? Assess the use and effectiveness of wildlife crossing structures (existing and planned). Monitoring metric: Use of crossing structures. Do animals use the existing below-grade structures prior to construction? If so, which species and how frequently? Do animals use the installed wildlife crossings? If so which species, how frequently and what design and habitat factors affect passage? Do the crossing structures allow for the reconnection of habitats and organisms? Characterize the rate of at-grade highway crossings by wildlife. Monitoring metric: Crossing rates, locations and activity of wildlife in the project area. Do animals cross I-90 above the road, what species, where, and with what frequency prior to construction? Assess species occurrence and distribution in project area. Monitoring metric: What species are present in areas adjacent to crossing structures? Assessing occupancy in areas adjacent to crossing structures is essential for evaluating the effectiveness of the crossing structures, as expected use of a given structure by a species is contingent on the species occurring there. What are the species’ distributions and abundances and how do these change after construction? Do rare (e.g., wolverine) or extirpated species (e.g., grizzly bear) recolonize or use the project area after connectivity measures are installed?
Washington State Department of Transportation Page 3-2

I-90 Wildlife Monitoring Plan, Western Transportation Institute February 2008
Assess the effectiveness of wildlife fencing. Monitoring metric: Reports of wildlife in the right-of-way and surveys of fence breaches (e.g., holes in fence and under fence). How effective is fencing for various wildlife species throughout the project area?
1. Assess the effectiveness of jump-outs; 2. Monitoring metric: Effectiveness of wildlife jump-outs. If wildlife access the right-of-
way, how effective are jump-outs at allowing wildlife to escape?
Tier 2 Complementary Monitoring and Research Tier 2 research focuses on landscape and population-level connectivity and is intended to complement Tier 1 monitoring by providing a more comprehensive understanding of how the project connectivity measures perform. Tier 2 research will require collaboration and partnering between WSDOT and other entities to be successful. Importantly, Tier 2 efforts are anticipated to advance the science of road ecology, particularly in relation to restoring connectivity across highways. Research areas for Tier 2 may consist of one or more of the following: Assessing the population-level benefits of wildlife crossings. The project’s connectivity measures are intended to enhance the movement of organisms, increase genetic diversity, and provide for naturally sustaining populations (MDT 2006). Research questions: Wildlife crossing structures may be used many times by different species, but how many individuals and what sex and age group classes are using the structures? Are populations benefiting from the wildlife crossings? What is the genetic structure (pre-construction) of target populations and does this structure significantly change after construction? Assessing species occurrence. Improved connectivity across I-90 in the project area should result in positive changes in species distribution (greater movement and dispersal) when compared with pre-construction baseline conditions. For high-mobility species, assessment will be required at scales larger than the CEAs and beyond the project corridor. Research questions: How are species distributed and what are their abundances in the larger landscape prior to construction? Do species distributions and abundances change after construction? Do absent species (re)colonize the study area after connectivity measures are installed? Conducting population viability analysis. The project’s connectivity measures are intended to eventually provide for naturally sustaining or viable populations in the project area. Population viability modeling is a powerful tool and evaluation method. Research questions: Using information from species-specific Tier 2 research and spatially explicit population viability models derived from that research, assess whether there are changes
Washington State Department of Transportation Page 3-3
I-90 Wildlife Monitoring Plan, Western Transportation Institute February 2008
in key life-history attributes that will affect long-term, local-scale population growth and viability. Evaluating the effects of human activity on crossing structure performance. Evaluation as to whether ecological connectivity needs are being met after construction will require the identification and possible control of potentially confounding human activity and disturbance in the project area (i.e., is sub-optimal use of a particular crossing structure the result of poor design or human disturbance?). Research questions: How does the distribution and level of human activity (e.g., recreational activities, built areas, low-volume and forest road traffic) affect the use of specific crossing structures? Finally, the collection of valuable genetic information prior to construction will be critical for Tier 2 analyses designed to assess barrier effects at the scale of populations. We, therefore, strongly recommend that methods designed to collect DNA samples (e.g., hair collection devices, scat collection) for select focal species be employed wherever and whenever possible, and that DNA from collected samples be extracted and stored for future Tier 2 analyses. Because Tier 2 research requires the formation of partnerships and collaborative efforts (see Chapters 5 and 6) that are only currently emerging, the authors can discuss Tier 2 in terms of projects that are (1) on-going or in development, or (2) conceptual. Some of the projects currently on-going or at a development stage that could help to inform Tier 2 research include the following:
• Cougars and Teaching (CAT) project (WDFW) • Black bear landscape genetics and movements in the project corridor (USFS) • “Relationships and Estimates of Immigration Rates in a Cougar Population in Eastern
Washington” (CWU master’s thesis, P. Houghtaling) • Swamp Lake amphibian surveys (CWU, S. Wagner) • Pika field study within the project corridor (CWU, K. Ernest) • Mountain goat landscape genetics and barrier assessment (Western Washington
University, Ph.D. dissertation, A. Shirk) Numerous other Tier 2 projects can be conceived of as either highly applied studies that will complement Tier 1 monitoring or independent projects that are more academically focused. Such projects will develop as Tier 1 monitoring begins, potential collaborators are identified, and relationships with partnering organizations are formed.
Washington State Department of Transportation Page 3-4
I-90 Wildlife Monitoring Plan, Western Transportation Institute February 2008
Focal Species Approach The project objectives include provisions for mitigating the fragmentation effects of a highway corridor on a range of species with varying mobilities (WSDOT 2006). As all species cannot be monitored, the selection of focal species that possess specific ecological attributes (e.g., resource or dispersal limitations, keystone species, umbrella species; see Appendix B) will result in monitoring data that will be most relevant to either the greatest number of species in the area, or to those species that are the most sensitive to the process being monitored (e.g., ability to cross over highway surfaces). Selected focal species, therefore, will be indicators of changes—positive or negative—that result from efforts to improve ecological connectivity in the project corridor. In many cases the selected survey methods will permit the collection of data from a great number of species (e.g., most medium and large mammals). Assessment of these data will, however, be limited to those species that generate sufficient quantities of data for statistical analyses and inference. In these cases actual focal species will not be identified until after monitoring has commenced. The process of focal species selection should be comprehensive and examine the entire list of species known to be present in the study area (see WSDOT 2006, Attachment 2). Several criteria can be used to identify potential focal species (see Appendix B) for monitoring the performance of ecological connectivity measures. The authors used these criteria to identify a suite of candidate focal species for the six basic Tier 1 monitoring objectives (Exhibit 3-1). The process for selecting candidate focal species began with a list of the most common wildlife species that reside in the project area based on references in the MDT report (WSDOT 2006). Mammal species were divided into three main groups: ungulates, carnivores, and other mammals, which included small mammals as a separate listing. The level of mobility of each species or species group was assigned as low, moderate, or high, based on dispersal abilities listed in Singleton and Lehmkuhl (2000) and professional judgment. Each species—or species group—was then evaluated as to its potential to serve as a focal species for the six Tier 1 monitoring objectives via the criteria in Appendix B. Species were rated by the authors as: 1) likely candidate species for monitoring; 2) not likely candidate species; and 3) not applicable to the particular species (e.g., small mammals for wildlife-vehicle collision data). The following objective-specific summaries discuss the results of this candidate focal species selection process:
1. Rate of wildlife-vehicle collisions: Elk, mule deer and coyotes are the most common species in current road-kill databases (Singleton and Lehmkuhl 2000, WSDOT 2006) and therefore the most likely candidates for providing sufficient collision data for pre- and post-construction periods. Opportunistic data will be collected from species common in the project area but less likely to be involved in wildlife-vehicle collisions such as black bears, mountain lions, coyotes, bobcats, and martens. Data on smaller mammals, reptiles and amphibians will be collected if systematic road-kill surveys are designed for these taxa (see Clevenger et al. 2003).
Washington State Department of Transportation Page 3-5

I-90 Wildlife Monitoring Plan, Western Transportation Institute February 2008
2. Effectiveness of wildlife crossing structures: Crossing data will be collected from all medium and large mammals in the project area including elk, mule deer, mountain goats, black bears, mountain lions, bobcats, coyotes, and marten. Opportunistic data will be collected from smaller taxa (e.g., weasel species, raccoons, skunk species). Select small mammals, amphibians, and reptiles will also be surveyed as species representing lower-mobility groups. Monitoring the use of structures by smaller taxa is possible if survey methods designed specifically to detect crossings by such species are used (see Foresman 2004). In some cases, efforts to monitor specific focal species (e.g., pikas) or species groups (e.g., amphibians) will be conducted as stand-alone projects by project partners. Monitoring of the structures may also provide valuable information on the presence of rare, wide-ranging species such as grizzly bears, gray wolves, lynx, wolverines and fishers in the project area.
3. Rate of at-grade crossings by wildlife: Species used to evaluate at-grade crossings during pre-construction will be essentially the same as the medium and large mammal species used to monitor crossing structures (see No. 2, above), although the methods available to monitor at-grade crossings are limited and will affect focal species selection (see below).
4. Species occurrence in the project area: Monitoring of species occurrence will provide important baseline information related to where species are found in the project area and possibly their relative abundance. An attempt will be made to collect occurrence data from a wide range of taxa—including small, medium, and large mammals as well as amphibians and reptiles. Once monitoring begins and more knowledge of species occurrence in the project area is available, the final suite of focal species for occupancy monitoring can be selected. Other species may be included as focal species as part of other projects that may develop once monitoring has begun.
5. Effectiveness of wildlife fencing: Post-construction data will be collected on the occurrence of fence intrusions by all mammal species larger in size than the openings in the fence material (i.e., mammals coyote-sized and larger). Elk and mule deer will be the primary species as they are most prone to entering the highway right-of-way after fencing (Feldhamer et al. 1986, Clevenger et al. 2002). Fence intrusions by black bears and felids (e.g., bobcats, Canada lynx, mountain lions) will be of interest given their ability to scale or jump over fences (Clevenger et al. 2001).
6. Effectiveness of jump-outs: Post-construction data will be collected at jump-outs from the medium and large mammal species. Small fauna that reach the right-of-way are able to exit safely through the fence and will not require jump-outs for safe escape.
Based on a preliminary assessment, it is anticipated that the following mammal species will serve as focal species for Tier 1 monitoring: elk, mule deer, black bear, coyote, mountain lion, bobcat, and marten. Additionally, select small mammals (e.g., pika, northern flying squirrel, water shrew), reptiles and amphibians may serve as focal species for particular Tier 1 and Tier 2 monitoring objectives. These species and species-groups may change as more information from the project area becomes available and Tier 2 research is initiated.
Washington State Department of Transportation Page 3-6
I-90 Wildlife Monitoring Plan, Western Transportation Institute February 2008
Washington State Department of Transportation Page 3-7
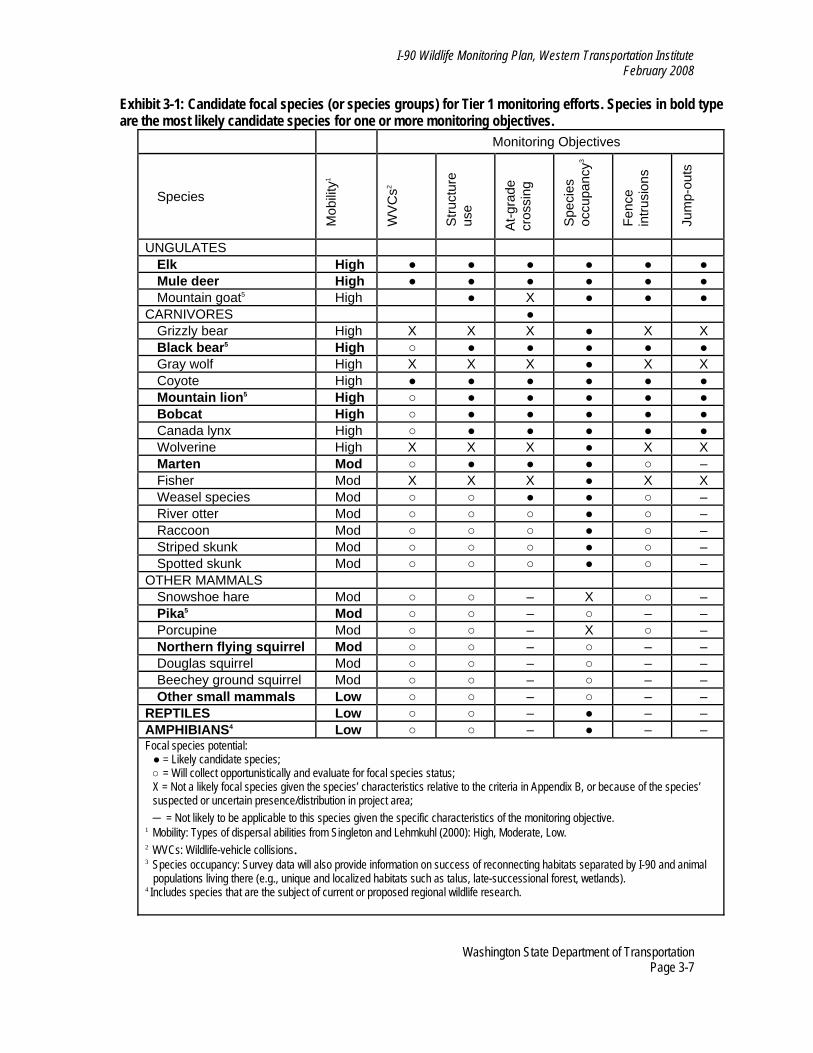
Exhibit 3-1: Candidate focal species (or species groups) for Tier 1 monitoring efforts. Species in bold type are the most likely candidate species for one or more monitoring objectives.
Monitoring Objectives
Species
Mob
ility1
WV
Cs2
Stru
ctur
e us
e
At-g
rade
cr
ossi
ng
Spe
cies
oc
cupa
ncy3
Fenc
e in
trusi
ons
Jum
p-ou
ts
UNGULATES Elk High ● ● ● ● ● ● Mule deer High ● ● ● ● ● ● Mountain goat5 High ● X ● ● ●
CARNIVORES ● Grizzly bear High X X X ● X X Black bear5 High ○ ● ● ● ● ● Gray wolf High X X X ● X X Coyote High ● ● ● ● ● ● Mountain lion5 High ○ ● ● ● ● ● Bobcat High ○ ● ● ● ● ● Canada lynx High ○ ● ● ● ● ● Wolverine High X X X ● X X Marten Mod ○ ● ● ● ○ – Fisher Mod X X X ● X X Weasel species Mod ○ ○ ● ● ○ – River otter Mod ○ ○ ○ ● ○ – Raccoon Mod ○ ○ ○ ● ○ – Striped skunk Mod ○ ○ ○ ● ○ – Spotted skunk Mod ○ ○ ○ ● ○ –
OTHER MAMMALS Snowshoe hare Mod ○ ○ – X ○ – Pika5 Mod ○ ○ – ○ – – Porcupine Mod ○ ○ – X ○ – Northern flying squirrel Mod ○ ○ – ○ – – Douglas squirrel Mod ○ ○ – ○ – – Beechey ground squirrel Mod ○ ○ – ○ – – Other small mammals Low ○ ○ – ○ – –
REPTILES Low ○ ○ – ● – – AMPHIBIANS4 Low ○ ○ – ● – – Focal species potential: ● = Likely candidate species; ○ = Will collect opportunistically and evaluate for focal species status; X = Not a likely focal species given the species’ characteristics relative to the criteria in Appendix B, or because of the species’ suspected or uncertain presence/distribution in project area; – = Not likely to be applicable to this species given the specific characteristics of the monitoring objective.
1 Mobility: Types of dispersal abilities from Singleton and Lehmkuhl (2000): High, Moderate, Low. 2 WVCs: Wildlife-vehicle collisions. 3 Species occupancy: Survey data will also provide information on success of reconnecting habitats separated by I-90 and animal
populations living there (e.g., unique and localized habitats such as talus, late-successional forest, wetlands). 4 Includes species that are the subject of current or proposed regional wildlife research.

I-90 Wildlife Monitoring Plan, Western Transportation Institute February 2008
CEA-Specific Monitoring Objectives CEAs are specific sites within the project area where opportunities for improving connectivity for unique assemblages of species and/or habitat types are highest (Exhibit 1-2). A commitment of the project is to focus mitigation within CEAs to improve transitional habitat below and adjacent to CEA structures. Connectivity objectives for each CEA focus on increasing movement by wildlife and reconnecting plant and animal populations separated by I-90 (WSDOT 2006). Tier 1 monitoring objectives may be either project-wide or CEA-specific. Project-wide monitoring will focus on assessment of wildlife-vehicle collisions, at-grade crossings by wildlife and the effectiveness of fencing and jump outs. CEA-specific Tier 1 monitoring includes 1) evaluating wildlife use of existing and proposed wildlife crossing structures, and 2) documenting local species occurrence. CEA-specific monitoring will be conducted in the vicinity of future crossing structures during pre-construction and at the structures during post-construction. A large amount of information has been amassed specific to each proposed CEA (WSDOT 2006). Appendix C relates all CEA-specific information to the Tier 1 monitoring objectives. The most pertinent information from each CEA relative to ecological values, target species for connectivity measures, candidate focal species, and existing and important habitats is summarized in Exhibits 3-2.
Washington State Department of Transportation Page 3-8
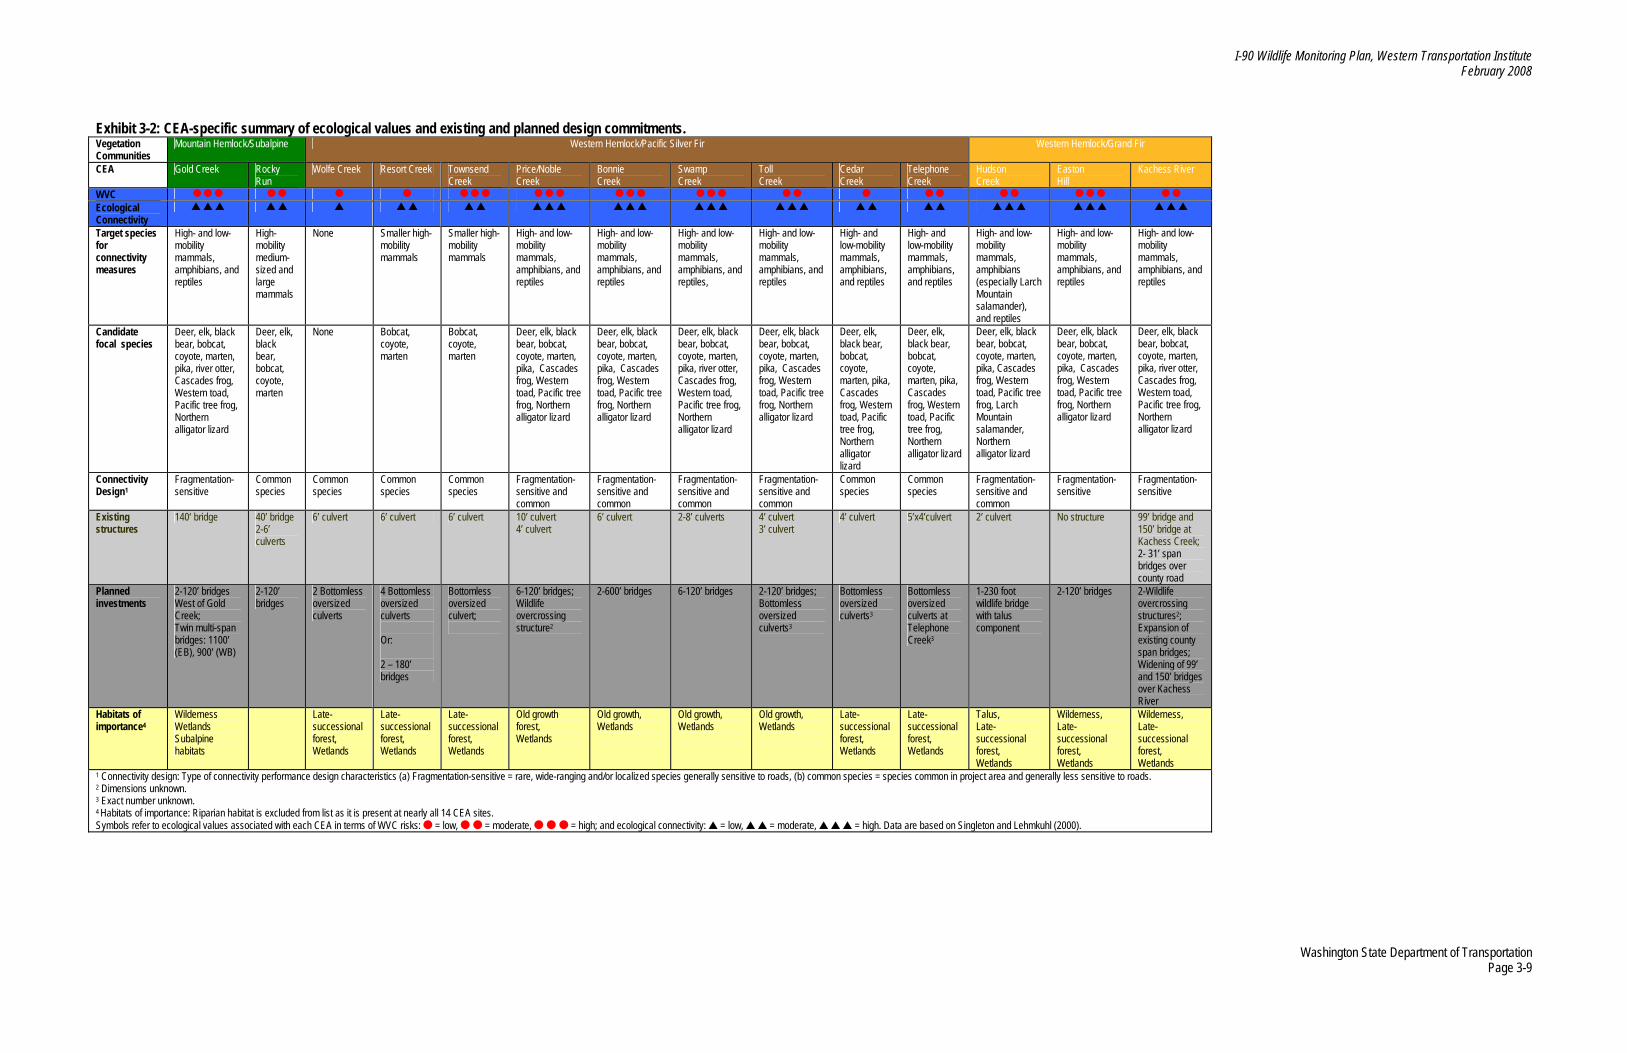
I-90 Wildlife Monitoring Plan, Western Transportation Institute February 2008
Exhibit 3-2: CEA-specific summary of ecological values and existing and planned design commitments. Vegetation Communities
Mountain Hemlock/Subalpine Western Hemlock/Pacific Silver Fir Western Hemlock/Grand Fir
CEA Gold Creek Rocky Run
Wolfe Creek Resort Creek Townsend Creek
Price/Noble Creek
Bonnie Creek
Swamp Creek
Toll Creek
Cedar Creek
Telephone Creek
Hudson Creek
Easton Hill
Kachess River
WVC Ecological Connectivity
Target species for connectivity measures
High- and low-mobility mammals, amphibians, and reptiles
High-mobility medium-sized and large mammals
None Smaller high-mobility mammals
Smaller high-mobility mammals
High- and low-mobility mammals, amphibians, and reptiles
High- and low-mobility mammals, amphibians, and reptiles
High- and low-mobility mammals, amphibians, and reptiles,
High- and low-mobility mammals, amphibians, and reptiles
High- and low-mobility mammals, amphibians, and reptiles
High- and low-mobility mammals, amphibians, and reptiles
High- and low-mobility mammals, amphibians (especially Larch Mountain salamander), and reptiles
High- and low-mobility mammals, amphibians, and reptiles
High- and low-mobility mammals, amphibians, and reptiles
Candidate focal species
Deer, elk, black bear, bobcat, coyote, marten, pika, river otter, Cascades frog, Western toad, Pacific tree frog, Northern alligator lizard
Deer, elk, black bear, bobcat, coyote, marten
None Bobcat, coyote, marten
Bobcat, coyote, marten
Deer, elk, black bear, bobcat, coyote, marten, pika, Cascades frog, Western toad, Pacific tree frog, Northern alligator lizard
Deer, elk, black bear, bobcat, coyote, marten, pika, Cascades frog, Western toad, Pacific tree frog, Northern alligator lizard
Deer, elk, black bear, bobcat, coyote, marten, pika, river otter, Cascades frog, Western toad, Pacific tree frog, Northern alligator lizard
Deer, elk, black bear, bobcat, coyote, marten, pika, Cascades frog, Western toad, Pacific tree frog, Northern alligator lizard
Deer, elk, black bear, bobcat, coyote, marten, pika, Cascades frog, Western toad, Pacific tree frog, Northern alligator lizard
Deer, elk, black bear, bobcat, coyote, marten, pika, Cascades frog, Western toad, Pacific tree frog, Northern alligator lizard
Deer, elk, black bear, bobcat, coyote, marten, pika, Cascades frog, Western toad, Pacific tree frog, Larch Mountain salamander, Northern alligator lizard
Deer, elk, black bear, bobcat, coyote, marten, pika, Cascades frog, Western toad, Pacific tree frog, Northern alligator lizard
Deer, elk, black bear, bobcat, coyote, marten, pika, river otter, Cascades frog, Western toad, Pacific tree frog, Northern alligator lizard
Connectivity Design1
Fragmentation-sensitive
Common species
Common species
Common species
Common species
Fragmentation-sensitive and common
Fragmentation-sensitive and common
Fragmentation-sensitive and common
Fragmentation-sensitive and common
Common species
Common species
Fragmentation-sensitive and common
Fragmentation-sensitive
Fragmentation-sensitive
Existing structures
140‘ bridge 40’ bridge 2-6’ culverts
6’ culvert 6’ culvert 6’ culvert 10’ culvert 4’ culvert
6’ culvert 2-8’ culverts 4’ culvert 3’ culvert
4’ culvert 5’x4’culvert 2’ culvert No structure 99’ bridge and 150’ bridge at Kachess Creek; 2- 31’ span bridges over county road
Planned investments
2-120’ bridges West of Gold Creek; Twin multi-span bridges: 1100’ (EB), 900’ (WB)
2-120’ bridges
2 Bottomless oversized culverts
4 Bottomless oversized culverts Or: 2 – 180’ bridges
Bottomless oversized culvert;
6-120’ bridges; Wildlife overcrossing structure2
2-600’ bridges 6-120’ bridges 2-120’ bridges; Bottomless oversized culverts3
Bottomless oversized culverts3
Bottomless oversized culverts at Telephone Creek3
1-230 foot wildlife bridge with talus component
2-120’ bridges 2-Wildlife overcrossing structures2; Expansion of existing county span bridges; Widening of 99’ and 150’ bridges over Kachess River
Habitats of importance4
Wilderness Wetlands Subalpine habitats
Late-successional forest, Wetlands
Late-successional forest, Wetlands
Late-successional forest, Wetlands
Old growth forest, Wetlands
Old growth, Wetlands
Old growth, Wetlands
Old growth, Wetlands
Late-successional forest, Wetlands
Late-successional forest, Wetlands
Talus, Late-successional forest, Wetlands
Wilderness, Late-successional forest, Wetlands
Wilderness, Late-successional forest, Wetlands
1 Connectivity design: Type of connectivity performance design characteristics (a) Fragmentation-sensitive = rare, wide-ranging and/or localized species generally sensitive to roads, (b) common species = species common in project area and generally less sensitive to roads. 2 Dimensions unknown. 3 Exact number unknown. 4 Habitats of importance: Riparian habitat is excluded from list as it is present at nearly all 14 CEA sites. Symbols refer to ecological values associated with each CEA in terms of WVC risks: = low, = moderate, = high; and ecological connectivity: = low, = moderate, = high. Data are based on Singleton and Lehmkuhl (2000).
Washington State Department of Transportation Page 3-9

I-90 Wildlife Monitoring Plan, Western Transportation Institute February 2008
Washington State Department of Transportation Page 3-10
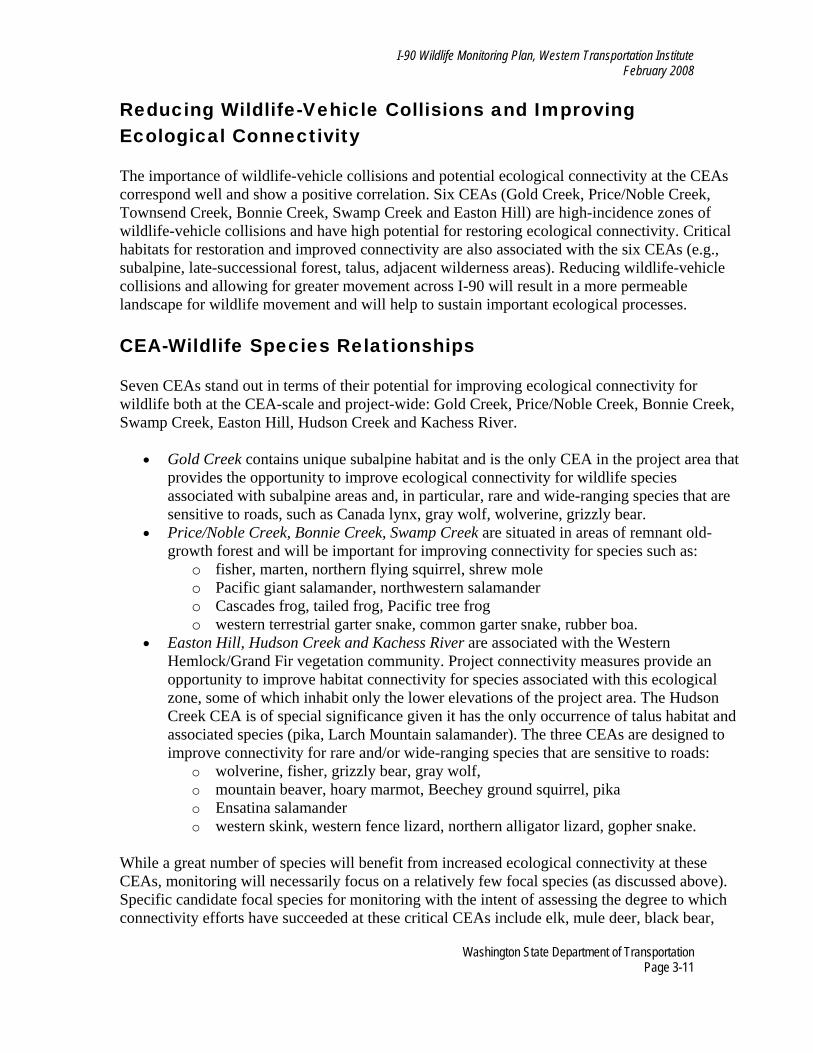
I-90 Wildlife Monitoring Plan, Western Transportation Institute February 2008
Reducing Wildlife-Vehicle Collisions and Improving Ecological Connectivity The importance of wildlife-vehicle collisions and potential ecological connectivity at the CEAs correspond well and show a positive correlation. Six CEAs (Gold Creek, Price/Noble Creek, Townsend Creek, Bonnie Creek, Swamp Creek and Easton Hill) are high-incidence zones of wildlife-vehicle collisions and have high potential for restoring ecological connectivity. Critical habitats for restoration and improved connectivity are also associated with the six CEAs (e.g., subalpine, late-successional forest, talus, adjacent wilderness areas). Reducing wildlife-vehicle collisions and allowing for greater movement across I-90 will result in a more permeable landscape for wildlife movement and will help to sustain important ecological processes. CEA-Wildlife Species Relationships Seven CEAs stand out in terms of their potential for improving ecological connectivity for wildlife both at the CEA-scale and project-wide: Gold Creek, Price/Noble Creek, Bonnie Creek, Swamp Creek, Easton Hill, Hudson Creek and Kachess River.
• Gold Creek contains unique subalpine habitat and is the only CEA in the project area that provides the opportunity to improve ecological connectivity for wildlife species associated with subalpine areas and, in particular, rare and wide-ranging species that are sensitive to roads, such as Canada lynx, gray wolf, wolverine, grizzly bear.
• Price/Noble Creek, Bonnie Creek, Swamp Creek are situated in areas of remnant old-growth forest and will be important for improving connectivity for species such as:
o fisher, marten, northern flying squirrel, shrew mole o Pacific giant salamander, northwestern salamander o Cascades frog, tailed frog, Pacific tree frog o western terrestrial garter snake, common garter snake, rubber boa.
• Easton Hill, Hudson Creek and Kachess River are associated with the Western Hemlock/Grand Fir vegetation community. Project connectivity measures provide an opportunity to improve habitat connectivity for species associated with this ecological zone, some of which inhabit only the lower elevations of the project area. The Hudson Creek CEA is of special significance given it has the only occurrence of talus habitat and associated species (pika, Larch Mountain salamander). The three CEAs are designed to improve connectivity for rare and/or wide-ranging species that are sensitive to roads:
o wolverine, fisher, grizzly bear, gray wolf, o mountain beaver, hoary marmot, Beechey ground squirrel, pika o Ensatina salamander o western skink, western fence lizard, northern alligator lizard, gopher snake.
While a great number of species will benefit from increased ecological connectivity at these CEAs, monitoring will necessarily focus on a relatively few focal species (as discussed above). Specific candidate focal species for monitoring with the intent of assessing the degree to which connectivity efforts have succeeded at these critical CEAs include elk, mule deer, black bear,
Washington State Department of Transportation Page 3-11

I-90 Wildlife Monitoring Plan, Western Transportation Institute February 2008
mountain lion, bobcat, marten, pika, Cascades frog, Western toad, Pacific tree frog, and Northern alligator lizard. Planned Investments and Connectivity Design Significant investments in infrastructure are being made in the project area to improve ecological connectivity across I-90 and to restore processes that have been disturbed in the past by highway operations. In addition to the seven CEAs noted earlier, ecological connectivity at the remaining seven CEAs will be greatly improved compared to current conditions. Further, the proposed installation of small to medium dry culverts at frequent intervals between CEAs will link habitats for smaller wildlife species. CEA-specific comparisons between the existing conditions and planned investments for cross-highway movements clearly suggest major improvements in highway permeability for terrestrial wildlife and habitat linkages (Exhibit 3-3). Tier 1 monitoring will evaluate whether the planned investments will translate to positive changes in habitat connectivity and animal movement. CEAs are not equal but clearly differ in their potential to provide ecological connectivity. These differences are largely based on their location in the project area and surrounding habitat. The ecological values associated with each CEA and their potential for improving connectivity permit a general classification of the CEA structures relative to their performance design characteristics as follows: (a) fragmentation-sensitive species = rare, wide-ranging and/or localized species generally sensitive to roads; and (b) common species = common and widespread species in project area that are generally less sensitive to road disturbance. Common species are found throughout the project area, but their use of crossing structures is important nonetheless. The distinction is, however, that CEAs identified as “fragmentation-sensitive” have a relatively higher importance for enabling cross-highway connectivity for the relevant species. The ecological values associated with each CEA (Exhibit 3-3) and the location of critical linkage zones in the project area (Singleton and Lehmkuhl 2000) can aid planning and monitoring activities, as described in the following section. Fragmentation-sensitive CEAs include Gold Creek, Easton Hill and Kachess River, while combined fragmentation-sensitive/common species CEAs include Price/Noble Creek, Bonnie Creek, Swamp Creek, Toll Creek, and Hudson Creek. Common species CEAs include Rocky Run, Wolfe Creek and Resort Creek. In addition to such designations based on performance design characteristics, it is also important to ensure that efforts to enhance connectivity benefit species that rely on particular types of habitats (e.g., upland, riparian, aquatic, talus, late-successional forest). In many cases such species have lower mobility. To ensure that such species are addressed by connectivity measures, monitoring of one or more species that is (are) closely associated with each habitat type is recommended. Exhibit 3-4 lists potential candidate species for each habitat type occurring in the project area. Methods designed to assess whether crossing structures are effective for low-mobility species are included in Exhibit 3-3 as well as in Appendix E.
Washington State Department of Transportation Page 3-12
I-90 Wildlife Monitoring Plan, Western Transportation Institute February 2008
Applications for Monitoring Tier 1 monitoring of CEA-specific and project–wide ecological connectivity must focus on both unique and common species and habitat types in the project area. Information summarized in Exhibit 3-3 will help to guide decisions regarding how to sub-sample certain Tier 1 monitoring studies within the project area. For example, monitoring wildlife use of existing structures and at-grade highway crossings will not be possible for the entire 15-mile section, but will require a sub-sampling approach. Further, CEA-specific information will permit both the identification of appropriate survey methods and selection of focal species once monitoring begins.
Survey Methods The six Tier 1 monitoring objectives described above can each be met using a variety of wildlife survey methods. These methods range from the relatively simple (e.g., reporting of wildlife-vehicle collisions by WSDOT personnel) to the complex (capture and global positioning system [GPS] collaring of individual animals). Each combination of monitoring objective and focal species requires the selection of appropriate survey methods (Exhibit 3-3). In some cases multiple methods exist for a given objective-species combination and researchers will have the luxury of balancing cost with specific data requirements and available funding or personnel. Further, for some methods most costs occur at the onset of monitoring efforts (e.g., remote cameras must be purchased prior to use), whereas for others the costs are largely distributed continuously throughout the monitoring period (e.g., snow tracking). Appendix E describes all methods that could potentially be used to meet the various Tier 1 monitoring objectives and potential Tier 2 objectives. Decisions as to the best method(s) must be made based on the particular objective, focal species, season, cost, and location.
Washington State Department of Transportation Page 3-13

I-90 Wildlife Monitoring Plan, Western Transportation Institute February 2008
Washington State Department of Transportation Page 3-14
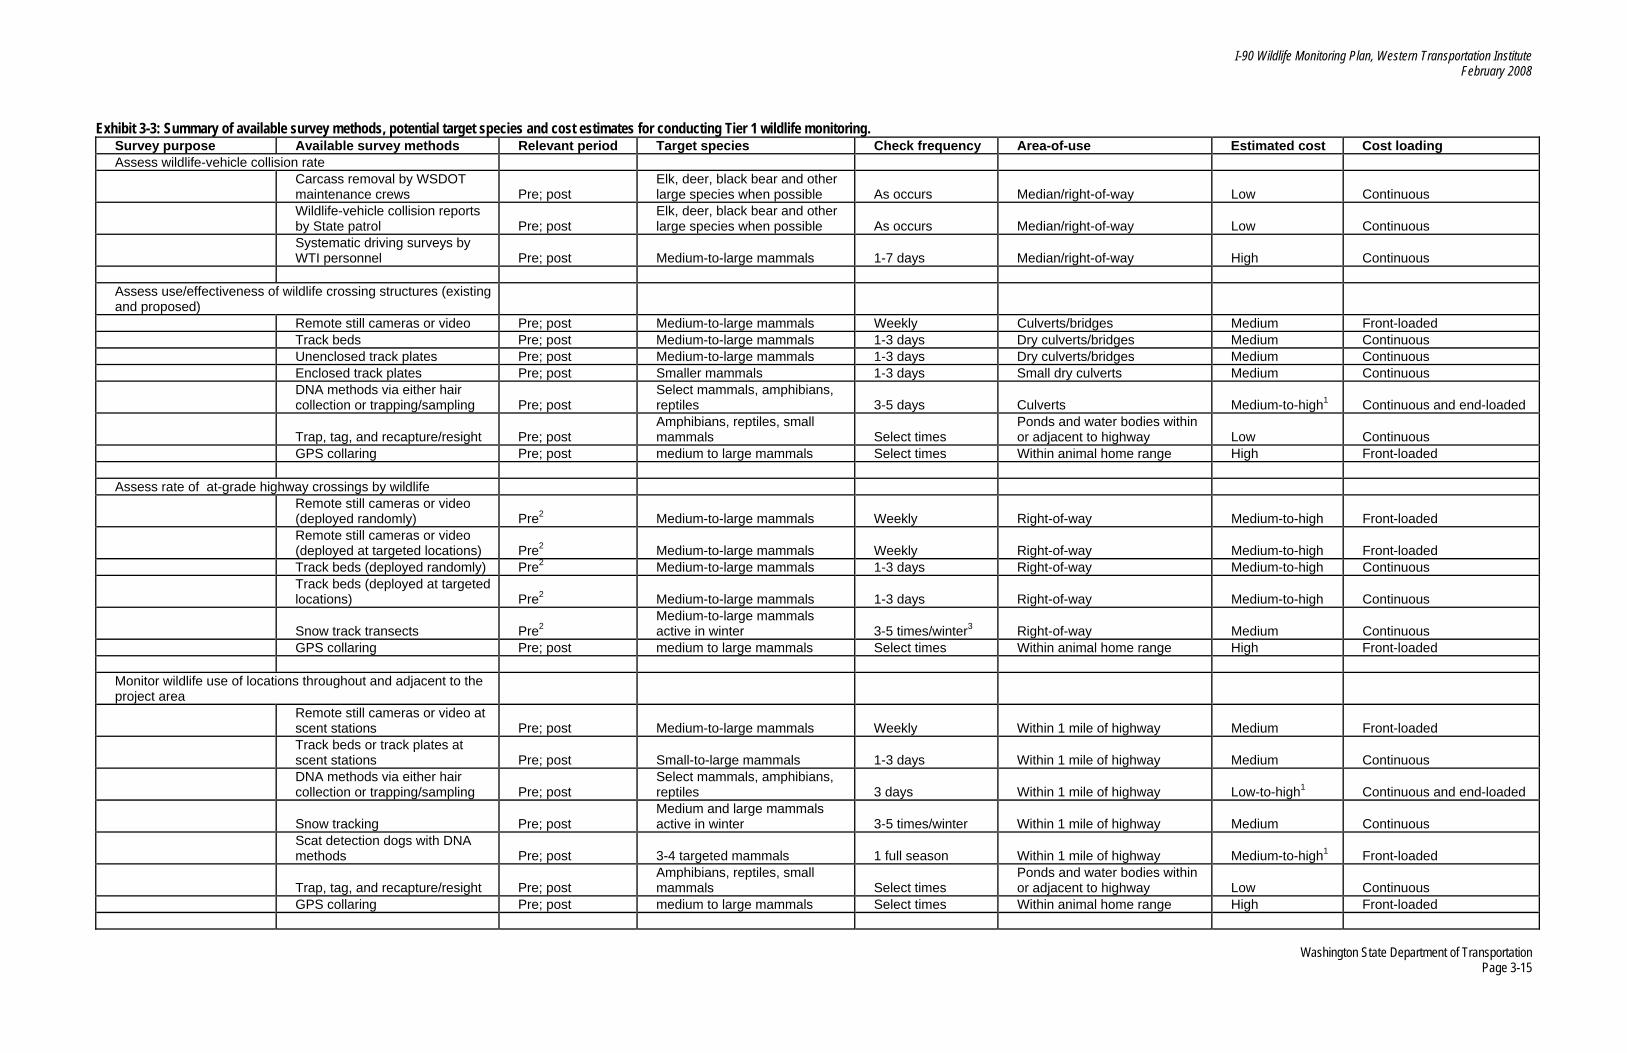
I-90 Wildlife Monitoring Plan, Western Transportation Institute February 2008
Exhibit 3-3: Summary of available survey methods, potential target species and cost estimates for conducting Tier 1 wildlife monitoring. Survey purpose Available survey methods Relevant period Target species Check frequency Area-of-use Estimated cost Cost loading Assess wildlife-vehicle collision rate
Carcass removal by WSDOT maintenance crews Pre; post
Elk, deer, black bear and other large species when possible As occurs Median/right-of-way Low Continuous
Wildlife-vehicle collision reports by State patrol Pre; post
Elk, deer, black bear and other large species when possible As occurs Median/right-of-way Low Continuous
Systematic driving surveys by WTI personnel Pre; post Medium-to-large mammals 1-7 days Median/right-of-way High Continuous
Assess use/effectiveness of wildlife crossing structures (existing and proposed) Remote still cameras or video Pre; post Medium-to-large mammals Weekly Culverts/bridges Medium Front-loaded Track beds Pre; post Medium-to-large mammals 1-3 days Dry culverts/bridges Medium Continuous Unenclosed track plates Pre; post Medium-to-large mammals 1-3 days Dry culverts/bridges Medium Continuous Enclosed track plates Pre; post Smaller mammals 1-3 days Small dry culverts Medium Continuous
DNA methods via either hair collection or trapping/sampling Pre; post
Select mammals, amphibians, reptiles 3-5 days Culverts Medium-to-high1 Continuous and end-loaded
Trap, tag, and recapture/resight Pre; post Amphibians, reptiles, small mammals Select times
Ponds and water bodies within or adjacent to highway Low Continuous
GPS collaring Pre; post medium to large mammals Select times Within animal home range High Front-loaded Assess rate of at-grade highway crossings by wildlife
Remote still cameras or video (deployed randomly) Pre2 Medium-to-large mammals Weekly Right-of-way Medium-to-high Front-loaded
Remote still cameras or video (deployed at targeted locations) Pre2 Medium-to-large mammals Weekly Right-of-way Medium-to-high Front-loaded
Track beds (deployed randomly) Pre2 Medium-to-large mammals 1-3 days Right-of-way Medium-to-high Continuous
Track beds (deployed at targeted locations) Pre2 Medium-to-large mammals 1-3 days Right-of-way Medium-to-high Continuous
Snow track transects Pre2 Medium-to-large mammals active in winter 3-5 times/winter3 Right-of-way Medium Continuous
GPS collaring Pre; post medium to large mammals Select times Within animal home range High Front-loaded Monitor wildlife use of locations throughout and adjacent to the project area
Remote still cameras or video at scent stations Pre; post Medium-to-large mammals Weekly Within 1 mile of highway Medium Front-loaded
Track beds or track plates at scent stations Pre; post Small-to-large mammals 1-3 days Within 1 mile of highway Medium Continuous
DNA methods via either hair collection or trapping/sampling Pre; post
Select mammals, amphibians, reptiles 3 days Within 1 mile of highway Low-to-high1 Continuous and end-loaded
Snow tracking Pre; post Medium and large mammals active in winter 3-5 times/winter Within 1 mile of highway Medium Continuous
Scat detection dogs with DNA methods Pre; post 3-4 targeted mammals 1 full season Within 1 mile of highway Medium-to-high1 Front-loaded
Trap, tag, and recapture/resight Pre; post Amphibians, reptiles, small mammals Select times
Ponds and water bodies within or adjacent to highway Low Continuous
GPS collaring Pre; post medium to large mammals Select times Within animal home range High Front-loaded
Washington State Department of Transportation Page 3-15

I-90 Wildlife Monitoring Plan, Western Transportation Institute February 2008
Survey purpose Available survey methods Relevant period Target species Check frequency Area-of-use Estimated cost Cost loading Evaluate effectiveness of wildlife fencing
WSDOT maintenance crews report animals inside fencing Post Medium-to-large mammals As occurs Median/right-of-way Medium Continuous
State patrol report animals inside fencing Post Medium-to-large mammals As occurs Median/right-of-way Medium Continuous
Systematic checks of fence integrity Post Medium-to-large mammals Monthly Fence line Medium Continuous
GPS collaring Pre; post medium to large mammals Select times Within animal home range High Front-loaded Evaluate effectiveness of jump-outs Remote still cameras or video Post Medium-to-large mammals Weekly Jump outs Medium Front-loaded Track beds on top of jump-outs Post Medium-to-large mammals 1-3 days Jump outs Medium Continuous 1 Cost depends largely on objectives--species-specific identification via DNA methods costs less than individual identification. Both can be cost effective when compared with more labor-intensive methods. 2 Although these methods can be used to monitor post-construction, it is assumed that wildlife fencing will so dramatically reduce at-grade highway crossing attempts as to make monitoring unnecessary and extremely cost-ineffective. 3 Will depend on statistical power considerations, number and timing of snow events, and time-constraints. See Appendix E for detailed description of each survey method.
Washington State Department of Transportation Page 3-16
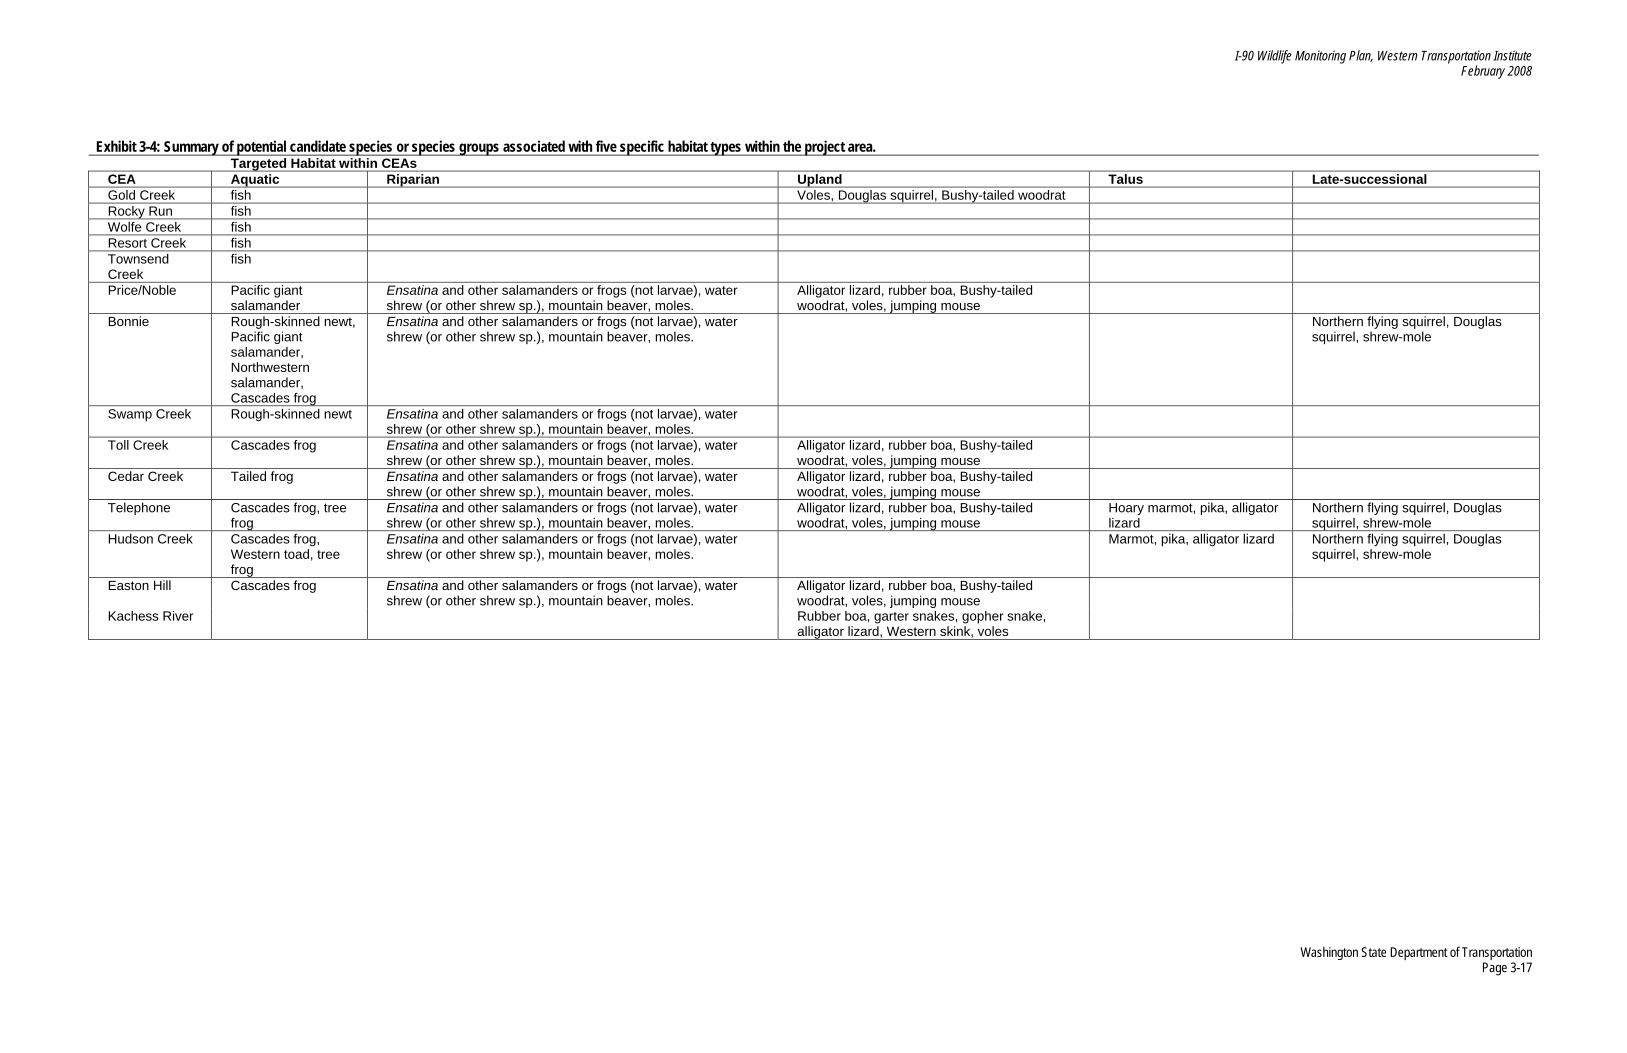
I-90 Wildlife Monitoring Plan, Western Transportation Institute February 2008
Exhibit 3-4: Summary of potential candidate species or species groups associated with five specific habitat types within the project area.
Targeted Habitat within CEAs CEA Aquatic Riparian Upland Talus Late-successional Gold Creek fish Voles, Douglas squirrel, Bushy-tailed woodrat Rocky Run fish Wolfe Creek fish Resort Creek fish Townsend Creek
fish
Price/Noble Pacific giant salamander
Ensatina and other salamanders or frogs (not larvae), water shrew (or other shrew sp.), mountain beaver, moles.
Alligator lizard, rubber boa, Bushy-tailed woodrat, voles, jumping mouse
Bonnie Rough-skinned newt, Pacific giant salamander, Northwestern salamander, Cascades frog
Ensatina and other salamanders or frogs (not larvae), water shrew (or other shrew sp.), mountain beaver, moles.
Northern flying squirrel, Douglas squirrel, shrew-mole
Swamp Creek Rough-skinned newt Ensatina and other salamanders or frogs (not larvae), water shrew (or other shrew sp.), mountain beaver, moles.
Toll Creek Cascades frog Ensatina and other salamanders or frogs (not larvae), water shrew (or other shrew sp.), mountain beaver, moles.
Alligator lizard, rubber boa, Bushy-tailed woodrat, voles, jumping mouse
Cedar Creek Tailed frog Ensatina and other salamanders or frogs (not larvae), water shrew (or other shrew sp.), mountain beaver, moles.
Alligator lizard, rubber boa, Bushy-tailed woodrat, voles, jumping mouse
Telephone Cascades frog, tree frog
Ensatina and other salamanders or frogs (not larvae), water shrew (or other shrew sp.), mountain beaver, moles.
Alligator lizard, rubber boa, Bushy-tailed woodrat, voles, jumping mouse
Hoary marmot, pika, alligator lizard
Northern flying squirrel, Douglas squirrel, shrew-mole
Hudson Creek Cascades frog, Western toad, tree frog
Ensatina and other salamanders or frogs (not larvae), water shrew (or other shrew sp.), mountain beaver, moles.
Marmot, pika, alligator lizard Northern flying squirrel, Douglas squirrel, shrew-mole
Easton Hill Cascades frog Ensatina and other salamanders or frogs (not larvae), water shrew (or other shrew sp.), mountain beaver, moles.
Alligator lizard, rubber boa, Bushy-tailed woodrat, voles, jumping mouse
Kachess River Rubber boa, garter snakes, gopher snake, alligator lizard, Western skink, voles
Washington State Department of Transportation Page 3-17

I-90 Wildlife Monitoring Plan, Western Transportation Institute February 2008
Washington State Department of Transportation Page 3-18
I-90 Wildlife Monitoring Plan, Western Transportation Institute February 2008
Adaptive Management Adaptive management under Tier 1 activities will consist of using results from the pre-construction monitoring to inform decision-making in relation to the planning and design of subsequent phases of the project. A priori triggers for management changes will need to stem from performance measures set for each of the Tier 1 objectives. Given the current knowledge of the project area and wildlife distributions, setting explicit performance measures for each objective is not currently feasible. To do so will require that pre-construction monitoring commence and that sufficient baseline information from the project area be obtained to determine realistic targets for each objective. Once suitable information is available, performance measures can be discussed and agreed upon by WSDOT and stakeholder agencies. A workshop involving both managers and the Wildlife Monitoring Technical Committee could be held to establish such performance measures and triggers for the Tier 1 objectives. Once such measures and triggers are agreed upon, measures that fall outside predefined acceptable targets will trigger discussion and ultimately decisions regarding any management or design changes. An example of adaptive management based on Tier 1 monitoring would be changing the design of wildlife crossing structures during subsequent phases of the project after obtaining empirical data from the use of structures from earlier phases. Microhabitat elements within wildlife crossings may require adaption if monitoring suggests that they do not facilitate the movement of certain target species or groups. Monitoring of fencing and jump-outs may identify deficiencies that lead to revised design or suggest that new materials could be used for future phases. Pre-construction data on local species occurrence and wildlife movements may lead to slight changes in the locations and types of wildlife crossing structures should monitoring reveal previously undocumented unique populations or important habitat linkages. Explicit management experiments that could help to adaptively manage future design plans should be conducted when and where possible. A built-in experiment might consist of constructing two distinct crossing structures side-by-side (e.g., an underpass adjacent to a wildlife overpass). The wildlife underpass and overpass planned for the Easton Hill CEA is a good example, and other opportunities for built-in experiments may arise in the future. Experiments of this type minimize confounding variables and provide a more experimental situation to test crossing structure performance and preferences by wildlife species. Successful adaptive management of the project design based on pre-construction monitoring results will require regular communication between the wildlife monitoring coordinator and the WSDOT Environmental Manager of the project. Close coordination between research and management will allow for timely changes to project design plans that reflect the most current results from monitoring activities.
Implementation The authors propose the following steps and general timeline—loosely grouped into monitoring “periods”—for implementing the Wildlife Monitoring Plan. In addition to the imminent pre-
Washington State Department of Transportation Page 3-19

I-90 Wildlife Monitoring Plan, Western Transportation Institute February 2008
construction periods, the authors also very generally describe the “during-construction” and post-construction periods. Each period will help to inform the period that follows in an adaptive fashion. Given the adaptive nature of this process, the steps and timelines making up the periods, as well as the periods themselves, should be considered general guides and not schedules per se. Active monitoring and research associated with the different Tier 1 and Tier 2 objectives are expected to begin and end at different times (Exhibit 3-5).
Washington State Department of Transportation Page 3-20

I-90 Wildlife Monitoring Plan, Western Transportation Institute February 2008
Exhibit 3-5: Proposed schedule of Tier 1 and Tier 2 monitoring and research in the Snoqualmie Pass East Project Area during pre-construction, construction, and post-construction periods.
Monitoring & Research Pre
-con
stru
ctio
n
Dur
ing
Con
stru
ctio
n
Pos
t-Con
stru
ctio
n
Tier 1 Wildlife-vehicle collision data collectionStructure use - existing culvertsStructure use - proposed crossingsAt grade, wildlife highway crossingsSpecies occupancyFence intrusionsJump-outs
Tier 2 Population-level benefits of crossingsRegional species occurrencePopulation viability analysisOther research (human activity, recreation)
Pre-Construction Monitoring Pre-construction monitoring activities will focus on designing a monitoring program, developing protocols, and collecting data related to each of the six Tier 1 monitoring objectives. Planning, funding, and implementation of Tier 2 projects will occur concurrently with Tier 1 activities. Step 1—Preliminary Research and Program Planning (October 2007–April 2008) Initial survey and review of the project area; identification of existing potential crossing structures; review of potential focal species; review of survey designs specific to objectives and focal species; review and preliminary testing of wildlife detection methods suitable for objectives, focal species, and potential survey designs; development of draft Tier 1 monitoring program; initial planning of Tier 2 projects. Step 2—Pre-Construction Monitoring: Season 1 (May 2008–September 2008) Systematic collection of data relating to Tier 1 objectives using methods and survey design developed and agreed upon in Step 1. Tier 2 projects will be implemented as they are planned and funded.
Washington State Department of Transportation Page 3-21

I-90 Wildlife Monitoring Plan, Western Transportation Institute February 2008
Step 3—Pre-Construction Monitoring: Off-Season (October 2008–April 2009) Continuation of systematic data collection for some Tier 1 objectives; analysis of data collected during Step 2; adaptation of methods and design based on Step 2 results and planning for Step 4; planning for Tier 2 projects. Step 4— Pre-Construction Monitoring: Season 2 (May 2009–September 2009) Systematic collection of data relating to objectives using adapted methods and survey design developed during Step 3; continuation of Tier 2 research. Proposed Tier 1 Monitoring Activities Collection of data related to: WVCs; wildlife use of existing below-grade passage structures; species occupancy monitoring and collection of genetic samples within and adjacent to the project area using noninvasive methods. Proposed Tier 2 Monitoring Activities Collection of data related to: population genetic structure; species occupancy; monitoring at larger scales using detection/non-detection methods; monitoring of human activity and use levels in the project area. Construction Monitoring Monitoring activities will likely continue once construction commences in areas not directly affected by the construction. Depending on the schedule and pattern of construction, careful monitoring during the construction period may enable construction-related effects on wildlife movement and distribution to be evaluated. Proposed Tier 1 Monitoring Activities Continue data collection for: WVCs; wildlife use of existing below-grade passage structures east of Phase 1; species occupancy monitoring and collection of genetic samples within and adjacent to the project area using noninvasive methods; use information obtained from pre-construction monitoring and research for adjustments to construction plans and/or design plans for subsequent phased construction of project. Proposed Tier 2 Monitoring Activities Continue data collection on population genetic structure; continue species occupancy monitoring at larger scales using noninvasive methods; continue monitoring of human activity and use levels in the project area.
Washington State Department of Transportation Page 3-22
I-90 Wildlife Monitoring Plan, Western Transportation Institute February 2008
Post-Construction Monitoring Pre-construction monitoring of existing conditions will continue for phases of the project that have not been constructed and new crossing structures will be monitored as they become operational. Proposed Tier 1 Monitoring Activities Continue collection of WVC data; continue monitoring wildlife use of existing below-grade passage structures east of Phase 1; monitor animal use of newly constructed Phase 1 wildlife crossings; continue species occupancy monitoring within and adjacent to the project area using noninvasive methods; begin monitoring of fence intrusions by wildlife in the project corridor; begin monitoring jump-out use by wildlife in the project corridor; continue to use information obtained from pre-construction monitoring and research for adjustments to construction plans and/or design plans for subsequent phased construction of project. Proposed Tier 2 Monitoring Activities Begin studies of population-level benefits of newly constructed crossings by sex and age of individuals using crossings and within the project area; continue data collection on population genetic structure (treatment and control areas); continue species occupancy monitoring at larger scales using noninvasive methods; begin developing models of population viability using demographic and landscape suitability data obtained from pre-construction- and construction-period research on species movements and demographic parameters; continue monitoring of human activity and use levels in the project area.
Evaluating Performance The monitoring framework permits evaluation of the performance of the project’s connectivity measures relative to ecological connectivity concerns in terms of individual organisms and their populations (Appendix D). The sample targets listed in Appendix D are provided to measure and assess whether the connectivity measures are performing or are effective in meeting the project needs. The monitoring plan developed in this report anticipates 3-4 years of pre-construction monitoring and a “construction” period, followed by a “post-construction” period. Approximately 15-20 years of wildlife monitoring and research in the project corridor are, therefore, envisioned (pre-construction = 3-4 years; during-construction = 5-6 years; post-construction = >5 years). Because of the long-term nature of the project, more detailed information on Tier 1 and Tier 2 monitoring objectives, management questions, study design considerations and performance targets are provided in Appendix D. This information will be of value to WSDOT management, consultants, and university researchers wishing to engage in monitoring activities on this project or transportation projects elsewhere.
Washington State Department of Transportation Page 3-23

I-90 Wildlife Monitoring Plan, Western Transportation Institute February 2008
Washington State Department of Transportation Page 3-24
Reporting Adequate and accurate dissemination of information relating to both monitoring progress and results is a critical component of any monitoring program. For this project there are multiple entities with interests in the outcome of monitoring. Reporting to WSDOT Regular quarterly and annual reports on monitoring progress will be compiled and submitted directly to WSDOT. Such reporting requirements are listed in the consultant’s Scope of Work (both as descriptions and deliverables) and included in the Schedule. While content will vary depending on the stage of monitoring, reports should include at minimum a narrative of work completed during the previous quarter or year, a brief overview of next steps, and a summary of data collected. For all reports, standard quality-assurance protocols will be followed including internal (within WTI) review, editing, and formatting. These quarterly and annual reports will be submitted both to WSDOT and to members of the Wildlife Monitoring Technical Committee. WSDOT can then make these reports available to others based on its internal requirements for reporting. In addition to the regular reporting described, a final report will be submitted in December 2009 prior to the completion of the Master Agreement for pre-construction monitoring. Additional Reports and Reporting to Secondary Recipients In addition to regular reporting, reports may be compiled after discrete data collection points of the project have been reached (e.g., after each summer field season). Any such reports will be agreed to beforehand and specified in the consultant’s Scope of Work. These reports will also be distributed to WSDOT and members of the Wildlife Monitoring Technical Committee, but also may be distributed to other project partners (e.g., I-90 Wildlife Bridges Coalition). Outreach and Dissemination of Information to the Public The Snoqualmie Pass East project has been a high-profile effort and will benefit from an active outreach and education component disseminating the results of wildlife monitoring. Chapter 4 provides a detailed overview of expected outreach efforts related to formal K–12 and university education, as well as informal education and outreach possibilities in collaboration with entities such as zoos and chambers of commerce. The chapter also discusses opportunities to disseminate information via professional technical transfer such as conferences and peer-reviewed publications, as well as direct community outreach and traditional media outlets.
I-90 Wildlife Monitoring Plan, Western Transportation Institute February 2008
4. Education, Outreach & Communications
Education Washington has over 6 million residents, with nearly 4 million people living in the Puget Sound area. A majority of Washington’s residents, therefore, reside less than a two-hour drive from the project area. The closest mid-sized town to the project area, Ellensburg, is home to CWU. The wildlife monitoring component of the project is being led by WTI. Combined, these factors provide the project with an excellent opportunity to conduct educational activities at the university, secondary and primary school levels. In addition to the formal education system, many informal education opportunities exist to involve the general public in the wildlife project or share the findings of the wildlife monitoring and research via educational activities. Higher Education The project’s wildlife monitoring and landscape connectivity research presents a variety of opportunities for university student involvement, either as undergraduates or as students in masters and doctoral programs. The wildlife monitoring coordinator, employed by WTI, is an adjunct professor in CWU’s Department of Biological Sciences and has an office located on CWU’s campus, allowing a close working relationship with CWU professors and their students. Statements of Interest for conducting research in the project area were solicited from various departments. The resulting statements included 29 potential projects spanning a variety of disciplines (i.e., anthropology, biology, geography, science education) that would engage faculty, graduate, undergraduate and K-12 students. WTI is the nation’s largest transportation institute focusing on rural transportation and is designated as a U.S. Department of Transportation University Transportation Center (UTC). Part of WTI’s mission is to provide research opportunities for university students. WTI’s Road Ecology Program currently has three MSU students working on road ecology research projects: an undergraduate conducting a review of aquatic crossings, a masters candidate creating a road ecology documentary film entitled “Too Many Roads,” and a doctoral candidate using DNA to study the effects of wildlife crossings on grizzly and black bear population demographics. The project is in many ways similar to the Banff Wildlife Crossings Project in Canada, a long-term WTI project. The Banff project has successfully supported a dozen graduate students (masters, PhD and postdoctoral level) from a variety of academic institutions. In addition, WTI has a competitive fellowship program for MSU graduate students known as the UTC transportation fellowship program. This program funds seven graduate students per year—up to two years for each student. The project provides opportunities for WTI road ecology fellows as well as other university students to engage in wildlife monitoring and research in the project area.
Washington State Department of Transportation Page 4-1
I-90 Wildlife Monitoring Plan, Western Transportation Institute February 2008
Kindergarten – 12th Grade In 2005 the I-90 Wildlife Bridges Coalition, a collaborative project administered by Conservation Northwest (see description in Chapter 5), teamed with the Washington State Department of Transportation in hosting an art contest for Washington school children ages 8–11. The contest, dubbed the “Bridging Futures Contest,” was designed to raise awareness and support for the project. In 2006, the coalition partnered with WSDOT and the Washington Foundation for the Environment for the second year of the contest. The 2005 contest winner’s artwork was used in an advertisement placed on a billboard along I-90 near Ellensburg (see www.i90wildlifebridges.org/bridgingfutures3.htm). The contest is being held for the fourth time this year. The partnering organizations have worked with children across the state via websites, information packets, and presentations in an effort to educate them about issues surrounding wildlife and roads with a specific focus on the project. Building on this art contest, partnerships, and previous experience in delivering information to the classroom, wildlife monitoring efforts provide the opportunity to engage students in K-12 classrooms across the state of Washington. Informal Education Museums, chambers of commerce, service groups and other venues present opportunities to share wildlife monitoring and research findings through the use of displays, presentations, exhibits, posters and other types of educational information (Jacobson et al. 2006). For example, the Woodland Park Zoo in Seattle has expressed interest in sponsoring one or more events focusing on the Project. Similar experience by the Banff Wildlife Crossings Project with the Calgary Zoo has led to formal wildlife-highway exhibits, as well as other information produced in cooperation with zoo educators. Technical Transfer Project partners have already successfully shared wildlife project information at a variety of professional meetings throughout the United States. In the past several months they have given talks at the “Road Ecology for Conservationists Workshop, Non-Profit Conservationists and Transportation: New Intersections,” held March 29–30 at WTI in Bozeman, Mont. Also, a presentation was made at the “International Conference on Ecology and Transportation 2007, Bridging the Gaps Naturally,” held in Little Rock, Ark., May 20–25, 2007. These are but two recent examples of the opportunities that exist to share the results of the wildlife monitoring and research project with professionals interested in highway-wildlife interactions and connectivity restoration efforts.
Washington State Department of Transportation Page 4-2
I-90 Wildlife Monitoring Plan, Western Transportation Institute February 2008
The following venues exist to provide technical transfer of information as the project’s wildlife monitoring and research is conducted, data is analyzed, and results are produced:
• Road ecology workshops and conferences (including the Transportation Research Board’s annual meeting; International Conference on Ecology and Transportation, Annual meetings of the Society of Conservation Biology and Ecological Society of America);
• Scientific journal articles (e.g., Conservation Biology, Environmental Management, Journal of Wildlife Management, Journal of Applied Ecology, Ecological Applications, Environmental Engineering, Ecological Engineering, Biological Conservation, Wildlife Biology);
• Transportation newsletters and magazines (e.g. TR News); and • Websites (e.g. www.wildlifeandroads.org,
www.fhwa.dot.gov/environment/wildlifecrossings).
Outreach Community Awareness There is broad interest in the project and particular interest in efforts that reduce wildlife-vehicle collisions and provide for wildlife connectivity. This project, like other highway projects that have a substantial focus on wildlife crossings, will garner intense interest from the public. Conducting community awareness outreach in the towns surrounding the project area will help provide local citizens with information on crossing designs, structures, and focal species. The wildlife monitoring project will detail the success of these efforts before and after highway construction is concluded. Conducting outreach in local communities to share the wildlife monitoring and research information will provide interested individuals and organizations with regular updates on the progress of the monitoring project. Field Trips Field trips can provide an overview of the project by giving visitors the opportunity to actually see wildlife-vehicle collision hot spots, current crossing structures under the roadway, locations of future crossing structures, tracking beds, remote cameras, and other wildlife detection devices. Due to the hazards inherent to major highways, a safety plan will be developed and close coordination with WSDOT will occur to assure visitor safety.
Washington State Department of Transportation Page 4-3

I-90 Wildlife Monitoring Plan, Western Transportation Institute February 2008
Washington State Department of Transportation Page 4-4
Communications Media It is important that wildlife monitoring and research efforts coordinate with WSDOT in providing scientific information to newspaper, radio and television media outlets. Such coordination will ensure that clear, consistent, and accurate facts and results are provided to the public. A systematic protocol for providing wildlife monitoring information to WSDOT public affairs personnel will help to streamline this process. Such a protocol can be developed between the WTI research coordinator and the appropriate staff at WSDOT as field work progresses. In addition, key spokespersons for the wildlife monitoring project will be identified and contact information provided. Currently, the two key media contacts are:
• Robert Long, I-90 Wildlife Monitoring Research Coordinator, WTI, and • Jason Smith, I-90 Environmental Manager, WSDOT.
Special Publications There will be a variety of opportunities to develop informational brochures, posters, pamphlets or other outreach and education materials for the wildlife monitoring and research project. The variety of partners that will be active in the project area makes it incumbent on the wildlife research coordinator to assure that facts and data are accurate and that sources of information are properly identified and credited. It is envisioned that many of the special publications will be developed collaboratively with project partners. Other Media It is expected that publishers and producers of websites, blogs, videos, documentaries and other media will express interest in, and request information about, the wildlife monitoring project. As with traditional media, close coordination with WSDOT will be essential for providing high quality information in a timely manner.
I-90 Wildlife Monitoring Plan, Western Transportation Institute February 2008
5. Potential Partnerships
Federal Agencies The two main federal agencies involved with the wildlife monitoring and research project are the USFS and the USFWS. The USFS is the largest landowner in the project area and its lands there constitute part of the Snoqualmie Pass Adaptive Management Area, which emphasizes supporting ecological connectivity. Thus, connectivity goals are an important aspect of USFS involvement in the project. One of the USFWS’s primary responsibilities is to assure that the project’s impact on threatened and endangered species, such as bull trout, is consistent with the requirements of the Endangered Species Act. Together, the USFS and USFWS are interested in a wide variety of wildlife species, from low mobility salamanders and mollusks to wide-ranging cougars and wolverines. Both have significant wildlife research capabilities and staff dedicated to understanding the interactions of wildlife with habitat and anthropogenic factors. As both agencies have participated on the MDT, they are familiar with the wildlife species and ecological issues present in the project area and will be excellent partners for wildlife monitoring and research.
State Agencies The two primary state agencies active in ecological connectivity efforts for the project are WSDOT and the WDFW. Both agencies had representatives on the MDT and have been actively leading or participating in the project. Other state agencies that may be interested in partnering include the Washington Department of Ecology and Washington State Parks. There will be a variety of opportunities for WSDOT and WDFW to partner with state agencies, federal agencies, academics and non-profit organizations to conduct wildlife monitoring and research.
Academia The two primary academic institutions that have been involved in the project, to date, are CWU and MSU. Both have departments and programs that provide graduate and undergraduate students the opportunity to participate in research projects involving a broad range of wildlife taxa. Professors, research scientists or students may become involved in the project depending on their relationships with the federal and state agencies, MSU-CWU, or non-governmental organizations. As a result of the many taxa involved, experts in herpetology, wildlife ecology, genetics or other disciplines will be needed to successfully complete the Tier 1 and Tier 2 objectives of this project. Other academic institutions that may engage in the monitoring project include the University of Washington, Washington State University, and Western Washington University.
Washington State Department of Transportation Page 5-1

I-90 Wildlife Monitoring Plan, Western Transportation Institute February 2008
Non-Governmental Organizations The I-90 Wildlife Bridges Coalition is a collective of non-profit conservation groups working together to ensure the Snoqualmie Pass East Project meets a high standard for wildlife connectivity as well as human safety and transportation efficiency (www.i90wildlifebridges.org). The coalition’s steering committee consists of: Alpine Lakes Protection Society, Biodiversity Northwest, Conservation Northwest, Kittitas Audubon Society, Seattle Audubon Society, Sierra Club and the Cascade Conservation Partnership. There are 25 endorsing organizations include American Rivers, Center for Tribal Water Advocacy, Defenders of Wildlife, Humane Society of the United States, the Nature Conservancy of Washington and the Washington Environmental Council. In addition, the Coalition’s website lists 11 endorsing businesses. Currently the I-90 Wildlife Bridges coalition has placed remote cameras in the project area to document wildlife use and has been involved in organizing citizen-based wildlife tracking surveys. Coordinating their efforts with the other wildlife monitoring and research will help utilize their equipment and its findings. In some cases data collected as part of this effort may help to address select Tier 1 monitoring objectives (pending appropriate equipment, training, and protocols). In most cases, however, these data will supplement monitoring efforts. An example of another non-profit conservation organization expressing interest in the project is the Wildlife Conservation Society (WCS). They conduct field research in over 60 countries around the world and their North America Program has research sites located throughout western North America. WCS scientists are currently studying landscape connectivity in relation to wolverine, fisher, bear, wolf, and other carnivore populations. Coordination with organizations such as WCS and other non-profit wildlife research entities may encourage synergy between researchers and minimize duplication of effort.
Integration with Monitoring and Research Project Many of the aforementioned agencies, institutions and organizations have a wide variety of expertise and experience with wildlife monitoring, research and conservation. Many may wish to conduct Tier 1 or Tier 2 monitoring activities, education, outreach and/or communications activities for the project. Therefore it is important that either WSDOT, the Wildlife Research Coordinator or the Wildlife Monitoring Technical Committee develop a means of selecting how the various interested partners participate in the Monitoring Program. In addition, there is a need to define the roles and responsibilities for those willing to conduct activities in the project area based on their expertise, funding and interest (Exhibit 5-1).
Washington State Department of Transportation Page 5-2

I-90 Wildlife Monitoring Plan, Western Transportation Institute February 2008
Exhibit 5-1: Roles and responsibilities matrix.
Organization/Type Tier I Tier II Education Outreach Communications WSDOT X X X X WDFW X X Other state agencies X X X X USFS X X X USFWS X X X Other federal agencies X X WTI X X X X X CWU X X X X Other academic institutions X X Non-profit organizations X X X X
Washington State Department of Transportation Page 5-3

I-90 Wildlife Monitoring Plan, Western Transportation Institute February 2008
Washington State Department of Transportation Page 5-4
I-90 Wildlife Monitoring Plan, Western Transportation Institute February 2008
6. Funding for Wildlife Monitoring and Research Projects
WSDOT has made a commitment to fund the Tier 1 monitoring program before, during and after highway construction has occurred. Tier 2 monitoring and research will be a cooperative effort by WSDOT and many other interested agencies, academics, non-profit organizations and institutions. Sources for funding wildlife connectivity and monitoring projects include a mix of traditional transportation programs, agencies, and interested non-transportation partners. Reducing wildlife-vehicle collisions and enhancing ecological connectivity can have benefits beyond those provided for motorist safety (e.g., reduced wildlife mortality, protection of threatened or endangered species, improved habitat connectivity and reduced maintenance costs for carcass removal). Such benefits reach well beyond the realm of transportation safety, providing the opportunity to develop new sources of funding with non-transportation partners.
Federal transportation funding sources and opportunities Note: Many of these sources of funding were gathered by WTI as part of contract with the Federal Highway Administration for the National Wildlife Vehicle Reduction Study: A Report to Congress (Huijser et al. 2007). Traditional federal funding sources for highway-wildlife projects originate with the Safe Accountable Flexible Efficient Transportation Equity Act: A Legacy for Users (SAFETEA-LU, US Public Law 109-59 2005). Pertinent programs that could support wildlife crossing monitoring and ecological connectivity research and are funded by SAFETEA-LU are summarized below and are managed by three administrative units within the U.S Department of Transportation: the Federal Highway Administration, the Federal Transit Administration and the National Highway Traffic Safety Administration. The Highway Safety Improvement Program (HSIP) in SAFETEA-LU is now a separately funded program. This program has a total of $5.1 billion available for 2006–2009, with $90 million set aside each year specifically for projects involving high risk rural roads. To be eligible for these funds, the project’s connectivity enhancement efforts must fall under a state’s Strategic Highway Safety Plan (SHSP). A potentially efficient way to implement wildlife crossing and connectivity measures is to incorporate activities that occur as part of reconstruction and maintenance projects and are funded by Interstate Maintenance or the Surface Transportation Program. Bridge projects can be particularly good opportunities for such an approach. With a small amount of wildlife exclusion fencing and a fairly minimal bridge extension, such bridge projects can successfully increase local connectivity. Other federal transportation resources for the project can be accessed through
Washington State Department of Transportation Page 6-1
I-90 Wildlife Monitoring Plan, Western Transportation Institute February 2008
a mix of Department of Transportation agencies and programs. The Federal Highway Administration (FHWA) has a list of such programs at its Planning, Environment, & Realty website (www.fhwa.dot.gov/hep/index.htm). The Public Lands Highways Discretionary Program has been continued under SAFETEA-LU through 2009 and is authorized to annually fund projects in those 11 western states that contain at least 3 percent of the total public land in the United States. In 2006, 77 projects were designated by Congress to receive a total of $95,200,000 in funding (www.fhwa.dot.gov/discretionary). Although I-90 itself is not part of the Public Lands Highways Discretionary Program, adjacent state and USFS roads in the project may qualify under the program. Another potential source of funding is FHWA’s Surface Transportation Environment and Planning Cooperative Research Program (STEP). SAFETEA-LU has authorized $16.875 million/year for Fiscal Years 2006–2009 for this project. STEP is the sole source of Federal funds for conducting FHWA research on planning and environmental issues. One emphasis area, “Environment: Natural Environment,” includes wildlife habitat as a focal category. See www.fhwa.dot.gov/hep/step/step.htm for more details. SAFETEA-LU’s Technology Deployment Program, administered by the FHWA, includes the Innovative Bridge Research and Deployment Program which is intended to promote, demonstrate, evaluate and document innovative designs, materials, and construction methods for bridges and other highway structures. The Transportation Enhancement Program (TEP) provides funds for transportation related projects designed to strengthen the cultural, aesthetic, and environmental aspects of the US intermodal transportation system. Transportation Enhancement activities offer communities the opportunity to expand transportation choices. The TEP allows for the implementation of a variety of nontraditional projects. TEP activities are a sub-component of the Surface Transportation Program. Information can be found at: www.fhwa.dot.gov/environment/te. The primary purpose of the Federal Highway Administration’s Federal Lands Highway Program (FLHP) is to provide funding for a coordinated program of public roads that serve the transportation needs of federal lands and are not a state or local government responsibility. This program, funded under the Highway Trust Fund, contains five categories: Indian Reservation Roads, Park Roads and Parkways, Forest Highways, Public Lands Highways and Refuge Roads. The FLHP roads serve recreational travel and tourism, protect and enhance natural resources, provide sustained economic development in rural areas, and provide needed transportation access for Native Americans. This is another program with funds available for USFS roads that may exist within, or adjacent to, the project area. Information on the program is located at: www.fhwa.dot.gov/flh/flhprog.htm. The Coordinated Federal Lands Highway Technology Implementation Program (CTIP) is a cooperative technology deployment and sharing program between the FHWA Federal Lands Highway office and federal land management agencies. It provides a forum for identifying, studying, documenting, and transferring new technologies to the transportation community.
Washington State Department of Transportation Page 6-2

I-90 Wildlife Monitoring Plan, Western Transportation Institute February 2008
Many new innovative technologies, such as special culverts to facilitate fish passage, have been funded through the CTIP program. CTIP funds are normally used for technology projects related to transportation networks on Federal public lands. Research projects are not eligible under this program. Information on this program is located on the web at: www.fhwa.dot.gov/flh/ctip.htm. The National Highway Traffic Safety Administration administers the State and Community Highway Safety Program which has a grant program for States, federally recognized Indian tribes, the District of Columbia, Puerto Rico, American Samoa, Guam, Northern Marianas, and the Virgin Islands. Information for grants is at: www.federalgrantswire.com/state_and_community_highway_safety.html.
Federal non-transportation funding sources and opportunities A potential federal resource for funding the project is the USFWS which administers a variety of natural resource assistance grants to government agencies, public and private organizations, groups and individuals. Links to information about available grants can be found at: www.fws.gov/grants. Twenty Natural Resource Assistance Grant Programs for State agencies are administered by the USFWS. Several of these programs are for wildlife protection and restoration; more information is available at: www.fws.gov/grants/state.html. One such program is the Cooperative Endangered Species Conservation Fund (Section 6) Grants to States & Territories which is designed to provide financial assistance to States and Territories to participate in a wide array of voluntary conservation projects for candidate, proposed and listed species; more information is available at: www.fws.gov/endangered/grants/section6. The National Forest Foundation (NFF) is the congressionally-chartered nonprofit partner of the USFS. The NFF provides funding for National Forests and Grasslands to support community-based forestry, recreation, watershed restoration, and wildlife habitat. This may be a potential source of grant opportunities for wildlife projects and research on federal lands in the project area. For more information visit the website: www.natlforests.org. The National Fish and Wildlife Foundation is a private, non-profit, tax-exempt organization, established by Congress in 1984 and dedicated to the conservation of fish, wildlife, and plants, and the habitat on which they depend. The Foundation meets its goals by creating partnerships between the public and private sectors and strategically invests in conservation and sustainable use of natural resources. It awards matching grants to projects benefiting conservation education, habitat protection and restoration, and natural resource management. Information on this foundation is available at: www.nfwf.org.
Washington State Department of Transportation Page 6-3

I-90 Wildlife Monitoring Plan, Western Transportation Institute February 2008
State and local funding sources and opportunities Washington Wildlife and Recreation Program provides funding for the acquisition and development of local and state parks, water access sites, trails, critical wildlife habitat, natural areas, and urban wildlife habitat. It also funds farmland preservation and protection of riparian areas. More information on grant seeking is available at: www.iac.wa.gov/iac/Docs.htm#wwrp. Another opportunity for supporting wildlife research projects may be to work with the WDFW to incorporate project objectives into their priority list for funding under Washington State’s Wildlife Grants program. This program is managed by the USFWS to develop and implement programs for the benefit of wildlife and their habitat, including species that are not hunted or fished. WDFW selects the projects that are submitted for funding under the program to the USFWS. If a wildlife research project is consistent with the priorities of Washington State’s wildlife conservation strategy or “state wildlife action plan,” it may also be eligible for funding by the Doris Duke Foundation. The goal of the Doris Duke Foundation’s Habitat Conservation Program is to “accelerate the conservation of essential habitats identified in State Wildlife Action Plans.” One strategy under its Environment Program is to support research, training and education initiatives. For more information visit: www.ddcf.org/page.asp?pageId=674. Doris Duke Foundation’s funding is regranted through the Wildlife Conservation Society’s “Wildlife Action Opportunities Fund,” which provides competitive grants to conservation organizations that are working to implement priority actions and strategies identified in State Wildlife Action Plans. During the first year of its two-year funding cycle, this fund has awarded 16 grants for over $1.3 million to a variety of local, regional, and national nonprofit conservation organizations for projects that strive to implement priority conservation activities outlined by the State Wildlife Action Plan. Seattle City Light administers a wildlife research funding program that facilitates the “development of improved methods for the understanding, management, and protection of wildlife resources in the North Cascades ecosystem and…contribute(s) to the training of new researchers and investigators.” The program has funded grizzly bear, long-toed salamander, lynx, and macroinvertebrate studies. For more information on the program visit the website at: www.seattle.gov/light/environment/WildlifeGrant. Seattle City Light also encourages grant seekers to explore other allied granting programs such at the National Fish and Wildlife Foundation and the Earthwatch Institute.
Washington State Department of Transportation Page 6-4

I-90 Wildlife Monitoring Plan, Western Transportation Institute February 2008
Private foundations and potential funding opportunities While transportation infrastructure is generally financed through a combination of local, state, and federal funding, private foundation philanthropy can increase funding efficiency by helping to leverage or match public funds for research, education, outreach, and advocacy efforts. Most philanthropy is focused on granting to non-profit organizations organized under Section 501(c)(3) of the Internal Revenue Code. Thus, for project wildlife monitoring to receive private funding, it is incumbent on WSDOT and the FHWA to collaborate with non-profit organizations. Philanthropy Northwest, based in Seattle, has over 150 individual grant making organizations. They focus their giving in the states of Alaska, Idaho, Montana, Oregon, Washington and Wyoming. They provide over $440 million a year in $5,000 to more than $20 million grants aimed at meeting important regional needs. Internet links to many of the member groups can be found at: www.philanthropynw.org/about/memberlists/memberlist.htm. A report in 2004 to the Henry P. Kendall Foundation, “Highway Funding for Nature: A Major Conservation Opportunity?” by Charles C. Chester, includes a section describing private grant makers interested in road ecology issues and projects they’ve funded across the country. The report is available at: www.kendall.org/publications/reports.html. A web-based entity that facilitates the funding of smart growth and other related transportation initiatives, the Funders’ Network for Smart Growth and Livable Communities, has a search engine for grant seekers at its website: www.fundersnetwork.org/directory2784/directory.htm. The Foundation Center, another web-based entity, has an extensive directory of private philanthropic and grant-making foundations that could potentially support the project’s wildlife conservation efforts. The Center can be located at: www.foundationcenter.org.
Corporate philanthropy and funding opportunities Thousands of America’s corporations have a long history of philanthropy, and many have established their own foundations to facilitate their giving. In addition, some have programs that match employee contributions, provide in-kind gifts or provide volunteers for projects. The project’s wildlife crossings, habitat connectivity and research efforts may be eligible to receive support from such corporate conservation, environmental, or community programs. An excellent resource for information on corporate philanthropy is the National Directory of Corporate Giving (New York: The Foundation Center). It describes the charitable activities of 2586 major US corporate foundations and 1468 direct giving programs. Entries include the company's name, address, affiliates, subsidiaries (if any), amount and range of grants, and types of non-cash support such as staff time and products.
Washington State Department of Transportation Page 6-5

I-90 Wildlife Monitoring Plan, Western Transportation Institute February 2008
Washington State Department of Transportation Page 6-6
An on-line search for corporate funding sources is available at Fundsnet Services Online (www.fundsnetservices.com) and lists both corporate and private foundation programs with links to their websites.
I-90 Wildlife Monitoring Plan, Western Transportation Institute February 2008
7. References Beier, P., and S. Loe. 1992. A checklist for evaluating impacts to wildlife movement corridors. Wildlife Society Bulletin 20:434-440. Chruszcz, B., A.P. Clevenger, K. Gunson, and M. Gibeau. 2003. Relationships among grizzly bears, highways, and habitat in the Banff-Bow Valley, Alberta, Canada. Canadian Journal of Zoology 81:1378-1391. Clevenger, A.P., Chruszcz, B. and Gunson, K. 2001. Highway mitigation fencing reduces wildlife-vehicle collisions. Wildlife Society Bulletin 29:646-653. Clevenger, A.P., Chruszcz, B., Gunson, K., and Wierzchowski, J. 2002. Roads and wildlife in the Canadian Rocky Mountain Parks - Movements, mortality and mitigation. Final Report (October 2002). Report prepared for Parks Canada, Banff, Alberta. Clevenger, A.P., B. Chruszcz, and K. Gunson. 2003. Spatial patterns and factors influencing small vertebrate fauna road-kill aggregations. Biological Conservation 109, 15-26. Feldhamer, G.A., J.E. Gates, D.M. Harman, A.J. Loranger, and K.R. Dixon. 1986. Effects of interstate highway fencing on white-tailed deer activity. Journal of Wildlife Management 50:497-503. Foresman, K. 2004. The effects of highways on fragmentation of small mammal populations and modifications of crossing structures to mitigate such impacts. Final report (Oct 2001 – Jan 2004) to Montana Department of Transportation, Helena, MT. Forman, R.T.T. and R.D. Deblinger. 2000. The ecological road-effect zone of a Massachusetts (USA) suburban highway. Conservation Biology 14: 36-46. Hansen, A.J., T. A. Spies, F. J. Swanson, and J. L. Ohmann. 1991. Conserving biodiversity in Managed Forests. BioScience 41: 382-392. Hardy, A.R., Fuller, J., Huijser, M., Kociolek, A.M. and Evans, M. 2007. Evaluation of wildlife crossing structures and fencing on U.S. Highway 93 Evaro to Polson, phase I: preconstruction data collection and finalization of evaluation plan. FHWA/MT-06-008/1744-1, Helena, MT. 190pp. Huijser, M.P., P. McGowen, J. Fuller, A. Hardy, A. Kociolek, A.P. Clevenger, D. Smith and R. Ament. 2007. Wildlife-vehicle collision reduction study. Report to Congress. U.S. Department of Transportation, Federal Highway Administration, Washington D.C., USA. Jacobson, S.K., M.D. McDuff, and M.C. Monroe. 2006. Conservation education and outreach techniques. Oxford University Press, New York, NY.
Washington State Department of Transportation Page 7-1

I-90 Wildlife Monitoring Plan, Western Transportation Institute February 2008
Lambeck, R.J. 1997. Focal species: A multi-species umbrella for nature conservation. Conservation Biology 11: 849-856. McDonald, W. and Cassady St Clair, C. 2004. Elements that promote highway crossing structure use by small mammals in Banff National Park. Journal of Applied Ecology 41, 82-93. Noss, R. 1990. Indicators for monitoring biodiversity: a hierarchical approach. Conservation Biology 4: 355-364. Noss, R. 1999. Assessing and monitoring forest biodiversity: a suggested framework and indicators. Forest Ecology and Management 115: 135-146. Noss, R., M. O’Connell, and D. Murphy. 1997. The science of conservation planning : Habitat conservation under the Endangered Species Act. World Wildlife Fund and Island Press, Washington, DC. Reijnen, R. and R. Foppen. 1994. The effects of car traffic on breeding bird populations in woodland. I. Evidence of reduced habitat quality for willow warblers (Phylloscopus trochilus) breeding close to a highway. Journal of Applied Ecology 31:85-94. Roedenbeck, I., L. Fahrig, C. Findlay, J. Houlahan, J. Jaeger, N. Klar, S. Kramer-Schadt and E. van der Grift. 2007. The Rauischholzhausen agenda for road ecology. Ecology and Society 12 (1): 11 [online] URL: www.ecologyandsociety.org/vol12/iss1/art11. Rowland, M.M., Wisdom, M.J., Johnson, B.K., and Kie, J.G. 2000. Elk distribution and modeling in relation to roads. Journal of Wildlife Management 64:672-684. Singleton, P.H. and Lehmkuhl, J.F. 2000. I-90 Snoqualmie Pass wildlife habitat linkage assessment. Research final report – January 1998 to March 2000. Washington State Department of Transportation and United States Forest Service. WA-RD 489.1. Singleton, P.H., W.L. Gaines, and J.F. Lehmkuhl. 2002. Landscape permeability for large carnivores in Washington: a geographic information system weighted-distance and least-cost corridor assessment. United States Forest Service research paper, PNW-RP-549. Sweanor, L.L., Logan, K.A. and Hornocker, M.G. 2000: Cougar dispersal patterns, metapopulation dynamics, and conservation. – Conservation Biology 14: 798-808. Thomas, J.W. et al. 1990. A conservation strategy for the northern spotted owl: a report to the Interagency Scientific Committee to address the conservation of the northern spotted owl. U.S. Forest Service, U.S. Fish and Wildlife Service, and National Park Service, Washington DC.
Washington State Department of Transportation Page 7-2
I-90 Wildlife Monitoring Plan, Western Transportation Institute February 2008
United States Forest Service and United States Fish and Wildlife Service. 1994. Final supplemental environmental impact statement on management of habitat for late-successional forest-related species within the range of the northern spotted owl. United States Forest Service and United States Bureau of Land Management and National Park Service, Portland, OR, 414 p. WSDOT. 2006. Recommendation package: Interstate 90 Snoqualmie Pass East mitigation development team. Washington State Department of Transportation, Yakima, WA, July 2006.
Washington State Department of Transportation Page 7-3

I-90 Wildlife Monitoring Plan, Western Transportation Institute February 2008
Washington State Department of Transportation Page 7-4

I-90 Wildlife Monitoring Plan, Western Transportation Institute February 2008
8. Appendix A
Common and Scientific Names Mammals Pika (Ochotona princeps) Snowshoe hare (Lepus americanus) Hoary marmot (Marmota caligata) Beechey ground squirrel (Otospermophilus beecheyi) Yellow pine chipmunk (Tamias amoenus) Golden-mantled ground squirrel (Spermophilus saturatus) Northern flying squirrel (Glaucomys sabrinus) Mountain beaver (Aplodontia rufa) Water shrew (Sorex palustris navigator) Voles (Microtus spp.) Pacific jumping mouse (Zapus trinotatus trinotatus) Bushy-tailed woodrat (Neotoma cinerea occidentalis) Shrew-mole (Neurotrichus gibbsii gibbsii) Moles (Scapanus spp.) Porcupine (Erethizon dorsatum) Mountain goat (Oreamnos americanus) Mule deer (Odocoileus hemionus) Elk (Cervus elaphus) Weasel (Mustela sp.) Marten (Martes americana) Fisher (Martes pennanti) Wolverine (Gulo gulo) River otter (Lutra canadensis) Raccoon (Procyon lotor) Black bear (Ursus americanus) Grizzly bear (Ursus arctos) Mountain lion (Puma concolor) Canada lynx (Lynx canadensis) Bobcat (Lynx rufus) Cascade red fox (Vulpes fulva) Coyote (Canis latrans) Gray wolf (Canis lupus) Birds Northern spotted owl (Strix occidentalis caurina)
Washington State Department of Transportation Page 8-1

I-90 Wildlife Monitoring Plan, Western Transportation Institute February 2008
Amphibians Larch Mountain salamander (Plethodon larselli) Ensatina (Ensatina eschschultzii) Northwestern salamander (Ambystoma gracilis) Pacific giant salamander (Dicamptodon tenebrosus) Long-toed salamander (Ambystoma macrodactylum) Cascades frog (Rana cascadae) Western toad (Bufo boreas) Pacific tree frog (Pseudacris regilla) Tailed frog (Ascaphus truei) Reptiles Gopher snake (Pituophis catenifer) Common garter snake (Thamnophis sirtalis) Northwestern garter snake (Thamnophis ordinoides) Western terrestrial garter snake (Thamnophis elegans) Rubber boa (Charina bottae) Northern alligator lizard (Elgaria coerulea) Western fence lizard (Sceloporous occidentalis) Western skink (Eumeces skiltonianus) Fish Bull trout (Salvelinus confluentus)
Washington State Department of Transportation Page 8-2
I-90 Wildlife Monitoring Plan, Western Transportation Institute February 2008
9. Appendix B
Selection of Focal Species Several criteria can be used to identify potential focal species for monitoring connectivity enhancement efforts. Each criterion pertains to either the specific monitoring objective or the ecosystem context of the monitoring plan. With regard to the monitoring objectives of this project, the ecological attributes of the focal species along with their sampling potential (i.e., their ability to generate sufficient data for statistically robust analyses) are the most important. A guide with specific criteria for the selection of focal species is shown below.
Washington State Department of Transportation Page 9-1
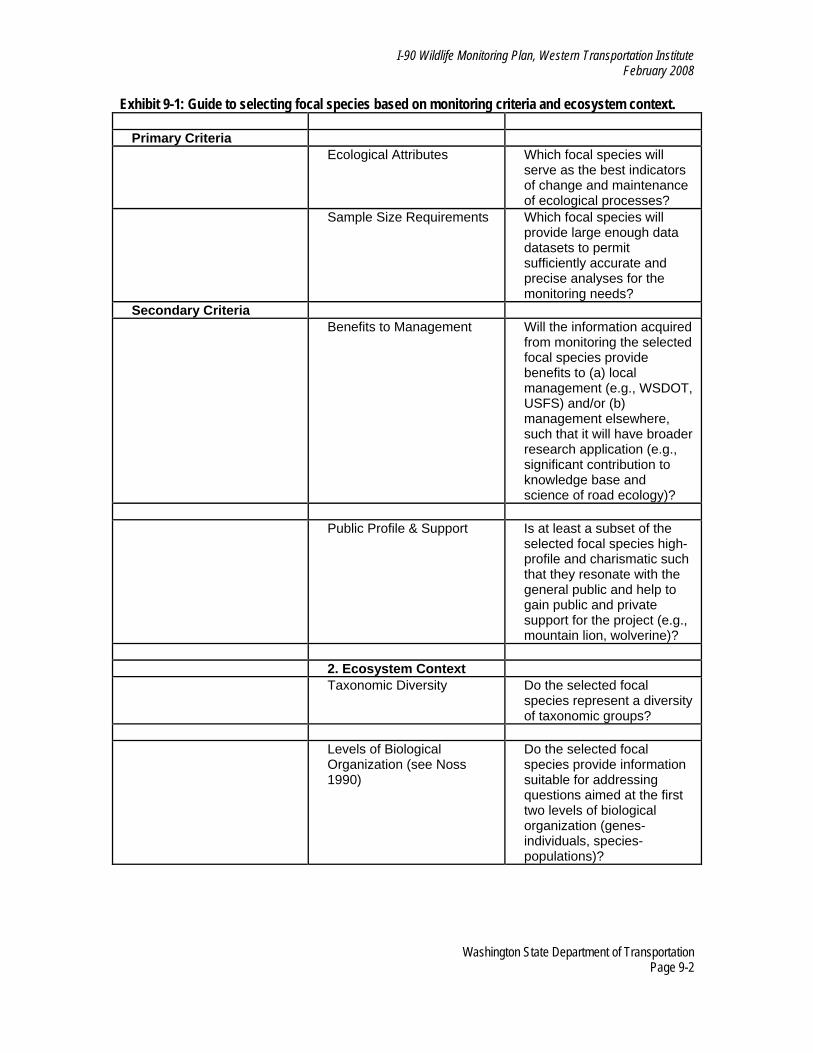
I-90 Wildlife Monitoring Plan, Western Transportation Institute February 2008
Exhibit 9-1: Guide to selecting focal species based on monitoring criteria and ecosystem context. Primary Criteria Ecological Attributes Which focal species will
serve as the best indicators of change and maintenance of ecological processes?
Sample Size Requirements Which focal species will provide large enough data datasets to permit sufficiently accurate and precise analyses for the monitoring needs?
Secondary Criteria Benefits to Management Will the information acquired
from monitoring the selected focal species provide benefits to (a) local management (e.g., WSDOT, USFS) and/or (b) management elsewhere, such that it will have broader research application (e.g., significant contribution to knowledge base and science of road ecology)?
Public Profile & Support Is at least a subset of the
selected focal species high-profile and charismatic such that they resonate with the general public and help to gain public and private support for the project (e.g., mountain lion, wolverine)?
2. Ecosystem Context Taxonomic Diversity Do the selected focal
species represent a diversity of taxonomic groups?
Levels of Biological
Organization (see Noss 1990)
Do the selected focal species provide information suitable for addressing questions aimed at the first two levels of biological organization (genes-individuals, species-populations)?
Washington State Department of Transportation Page 9-2
I-90 Wildlife Monitoring Plan, Western Transportation Institute February 2008
Ecological attributes of indicator species have been used as a guide for identifying potential focal species in other projects (see Noss 1999). Work by Lambeck (1997) and Noss et al. (1997) provides guidance as to what species make good focal species for monitoring biodiversity. Their list of seven attributes can be used as a guide for identifying potential focal species or populations for the I-90 Project. The seven ecological attributes with examples of wildlife species that found in the project area or in close proximity are listed in [bold].
1. Area limited species. Species that require the largest patch size to maintain viable populations. Species generally have large home ranges and/or low population densities. [mountain lion, black bear, bobcat]
2. Dispersal-limited species. Species that are limited in their ability to move from patch to patch, or that face a high mortality risk in trying to do so. Some species include flightless insects, lungless salamanders, small forest mammals, and large mammals subject to road-kill. [northern flying squirrel, Douglas squirrel, marten, fisher]
3. Resource-limited species. Species requiring specific resources that are often or at least occasionally in critically short supply. Resources may include large snags, nectar sources or fruits. Hummingbirds, frugivorous birds, and cavity-nesting birds and mammals are in this category.
4. Process-limited species. Species sensitive to the level, rate, spatial characteristics, or timing of some ecological process, such as flooding, fire, wind transport of sediments, grazing, competition with exotics or predation. [elk, mule deer]
5. Keystone species. Ecologically pivotal species whose impact on a community or ecosystem is large, and disproportionately large for their abundance. Examples in forests include cavity-excavating birds and herbivorous insects subject to outbreaks. [mountain lion, gray wolf, grizzly bear]
6. Narrow-endemic species. Species restricted to a small geographic range (e.g. <50,000 km2 is a commonly used cut-off) and often with very few occurrences within that range. Most species are herbaceous plants. [pika, hoary marmot, mountain goat]
7. Special cases. Species important in the forest ecoregion that do not fall within one of the above categories. This group includes disjunct or peripheral populations that are genetically distinct and ‘flagship species’ that promote public support for conservation efforts.
Washington State Department of Transportation Page 9-3

I-90 Wildlife Monitoring Plan, Western Transportation Institute February 2008
Washington State Department of Transportation Page 9-4
Exhibit 9-2: Sample of some wildlife species occurring in the project area and their ecological attribute classification (see Noss 1999).
Species
Are
a-lim
ited
Dis
pers
al-
limite
d
Res
ourc
e-lim
ited
Proc
ess-
limite
d
Key
ston
e
Nar
row
-en
dem
ic
Spec
ial
case
s1
Marten X Fisher X Bobcat X Mountain lion X X X Black bear X X Gray wolf X Grizzly bear X Elk X Mountain goat X X Pika X X X X Hoary marmot X Northern flying squirrel
X
Douglas squirrel X Amphibians X X X X X Reptiles X X X X Bull trout X X X X 1Includes species that are currently the subject of regional wildlife research.
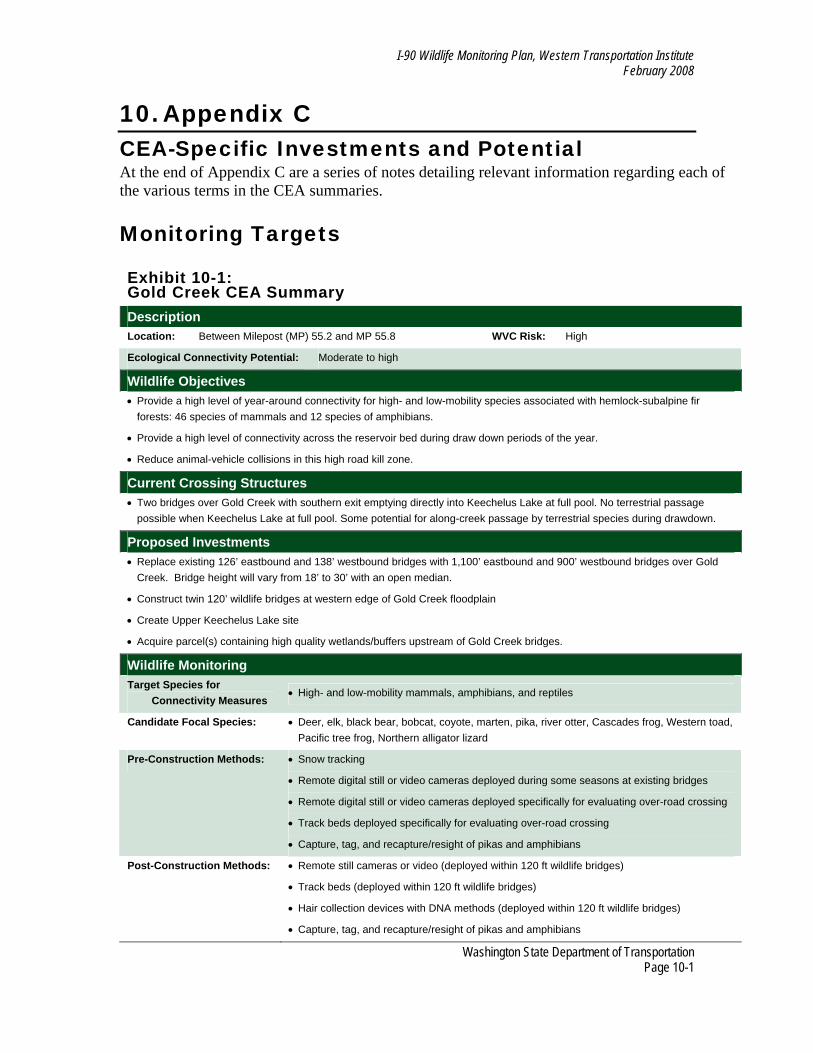
I-90 Wildlife Monitoring Plan, Western Transportation Institute February 2008
10. Appendix CCEA-Specific Investments and Potential At the end of Appendix C are a series of notes detailing relevant information regarding each of the various terms in the CEA summaries.
Monitoring Targets
Washington State Department of Transportation
Exhibit 10-1: Gold Creek CEA Summary Description Location: Between Milepost (MP) 55.2 and MP 55.8 WVC Risk: High
Ecological Connectivity Potential: Moderate to high
Wildlife Objectives • Provide a high level of year-around connectivity for high- and low-mobility species associated with hemlock-subalpine fir
forests: 46 species of mammals and 12 species of amphibians.
• Provide a high level of connectivity across the reservoir bed during draw down periods of the year.
• Reduce animal-vehicle collisions in this high road kill zone.
Current Crossing Structures • Two bridges over Gold Creek with southern exit emptying directly into Keechelus Lake at full pool. No terrestrial passage
possible when Keechelus Lake at full pool. Some potential for along-creek passage by terrestrial species during drawdown.
Proposed Investments • Replace existing 126’ eastbound and 138’ westbound bridges with 1,100’ eastbound and 900’ westbound bridges over Gold
Creek. Bridge height will vary from 18’ to 30’ with an open median.
• Construct twin 120’ wildlife bridges at western edge of Gold Creek floodplain
• Create Upper Keechelus Lake site
• Acquire parcel(s) containing high quality wetlands/buffers upstream of Gold Creek bridges.
Wildlife Monitoring Target Species for
Connectivity Measures • High- and low-mobility mammals, amphibians, and reptiles
Candidate Focal Species: • Deer, elk, black bear, bobcat, coyote, marten, pika, river otter, Cascades frog, Western toad, Pacific tree frog, Northern alligator lizard
Pre-Construction Methods: • Snow tracking
• Remote digital still or video cameras deployed during some seasons at existing bridges
• Remote digital still or video cameras deployed specifically for evaluating over-road crossing
• Track beds deployed specifically for evaluating over-road crossing
• Capture, tag, and recapture/resight of pikas and amphibians
Post-Construction Methods: • Remote still cameras or video (deployed within 120 ft wildlife bridges)
• Track beds (deployed within 120 ft wildlife bridges)
• Hair collection devices with DNA methods (deployed within 120 ft wildlife bridges)
• Capture, tag, and recapture/resight of pikas and amphibians
Page 10-1
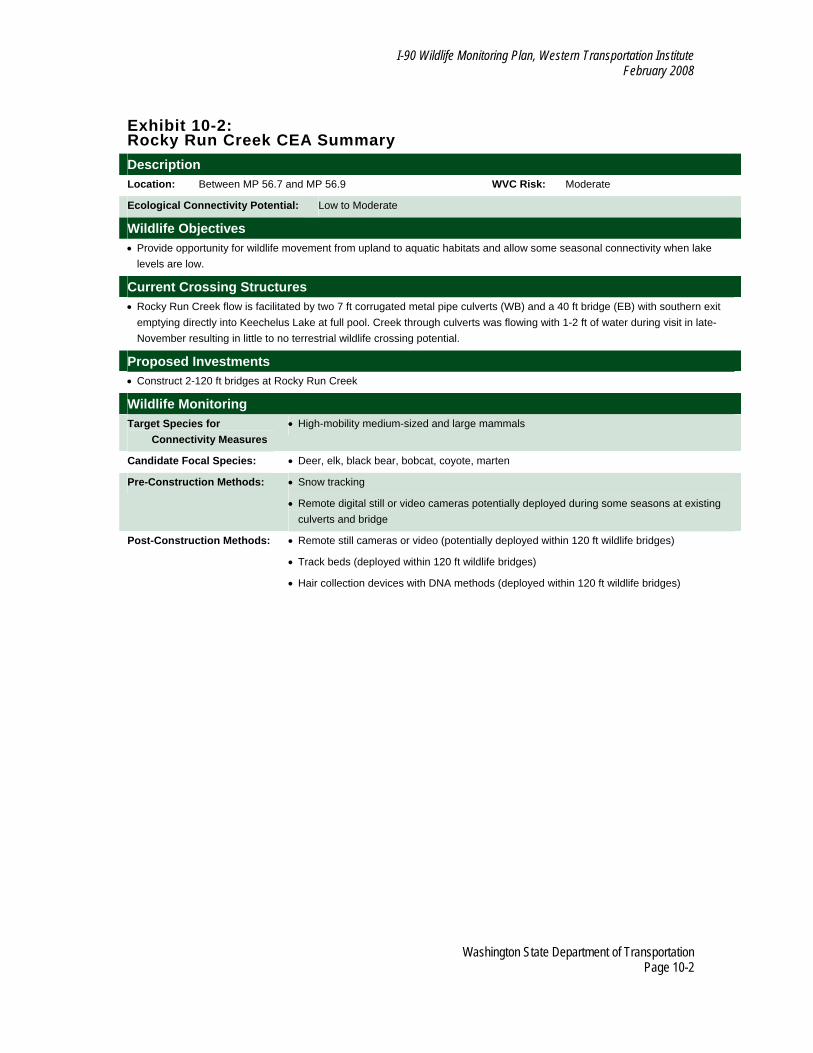
I-90 Wildlife Monitoring Plan, Western Transportation Institute February 2008
Exhibit 10-2: Rocky Run Creek CEA Summary Description Location: Between MP 56.7 and MP 56.9 WVC Risk: Moderate
Ecological Connectivity Potential: Low to Moderate
Wildlife Objectives • Provide opportunity for wildlife movement from upland to aquatic habitats and allow some seasonal connectivity when lake
levels are low.
Current Crossing Structures • Rocky Run Creek flow is facilitated by two 7 ft corrugated metal pipe culverts (WB) and a 40 ft bridge (EB) with southern exit
emptying directly into Keechelus Lake at full pool. Creek through culverts was flowing with 1-2 ft of water during visit in late-November resulting in little to no terrestrial wildlife crossing potential.
Proposed Investments • Construct 2-120 ft bridges at Rocky Run Creek
Wildlife Monitoring Target Species for
Connectivity Measures • High-mobility medium-sized and large mammals
Candidate Focal Species: • Deer, elk, black bear, bobcat, coyote, marten
Pre-Construction Methods: • Snow tracking
• Remote digital still or video cameras potentially deployed during some seasons at existing culverts and bridge
Post-Construction Methods: • Remote still cameras or video (potentially deployed within 120 ft wildlife bridges)
• Track beds (deployed within 120 ft wildlife bridges)
• Hair collection devices with DNA methods (deployed within 120 ft wildlife bridges)
Washington State Department of Transportation Page 10-2
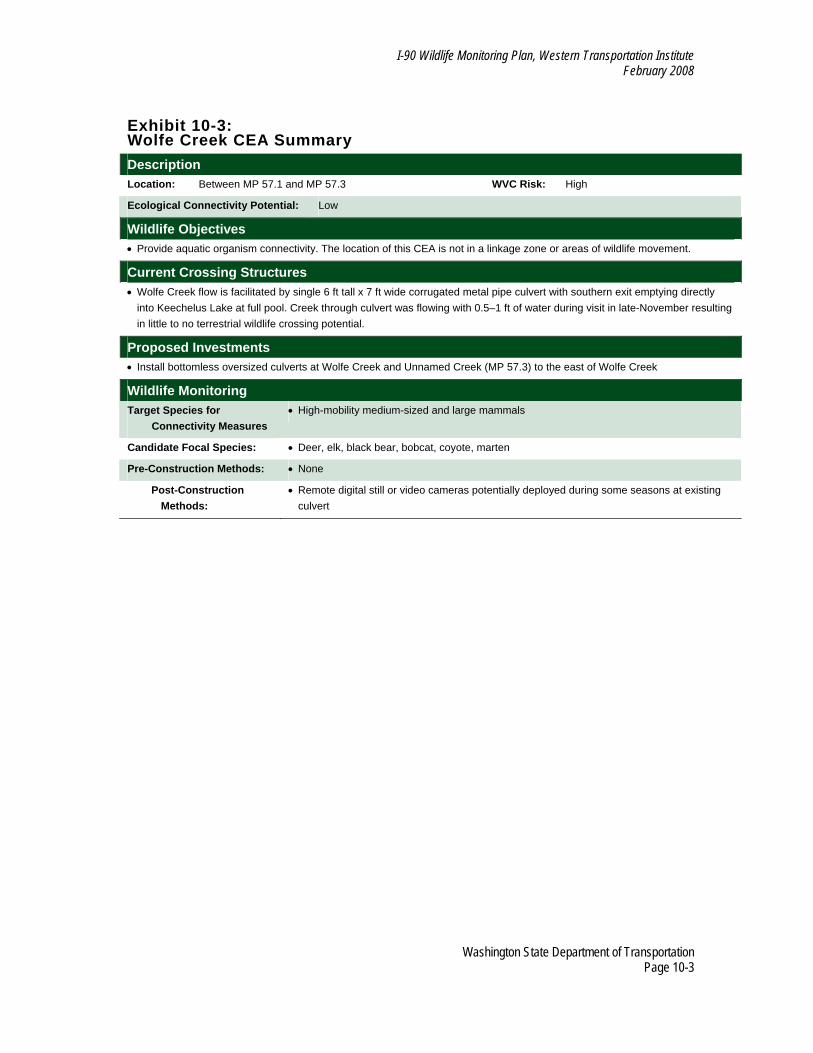
I-90 Wildlife Monitoring Plan, Western Transportation Institute February 2008
Exhibit 10-3: Wolfe Creek CEA Summary Description Location: Between MP 57.1 and MP 57.3 WVC Risk: High
Ecological Connectivity Potential: Low
Wildlife Objectives • Provide aquatic organism connectivity. The location of this CEA is not in a linkage zone or areas of wildlife movement.
Current Crossing Structures • Wolfe Creek flow is facilitated by single 6 ft tall x 7 ft wide corrugated metal pipe culvert with southern exit emptying directly
into Keechelus Lake at full pool. Creek through culvert was flowing with 0.5–1 ft of water during visit in late-November resulting in little to no terrestrial wildlife crossing potential.
Proposed Investments • Install bottomless oversized culverts at Wolfe Creek and Unnamed Creek (MP 57.3) to the east of Wolfe Creek
Wildlife Monitoring Target Species for
Connectivity Measures • High-mobility medium-sized and large mammals
Candidate Focal Species: • Deer, elk, black bear, bobcat, coyote, marten
Pre-Construction Methods: • None
Post-Construction Methods:
• Remote digital still or video cameras potentially deployed during some seasons at existing culvert
Washington State Department of Transportation Page 10-3
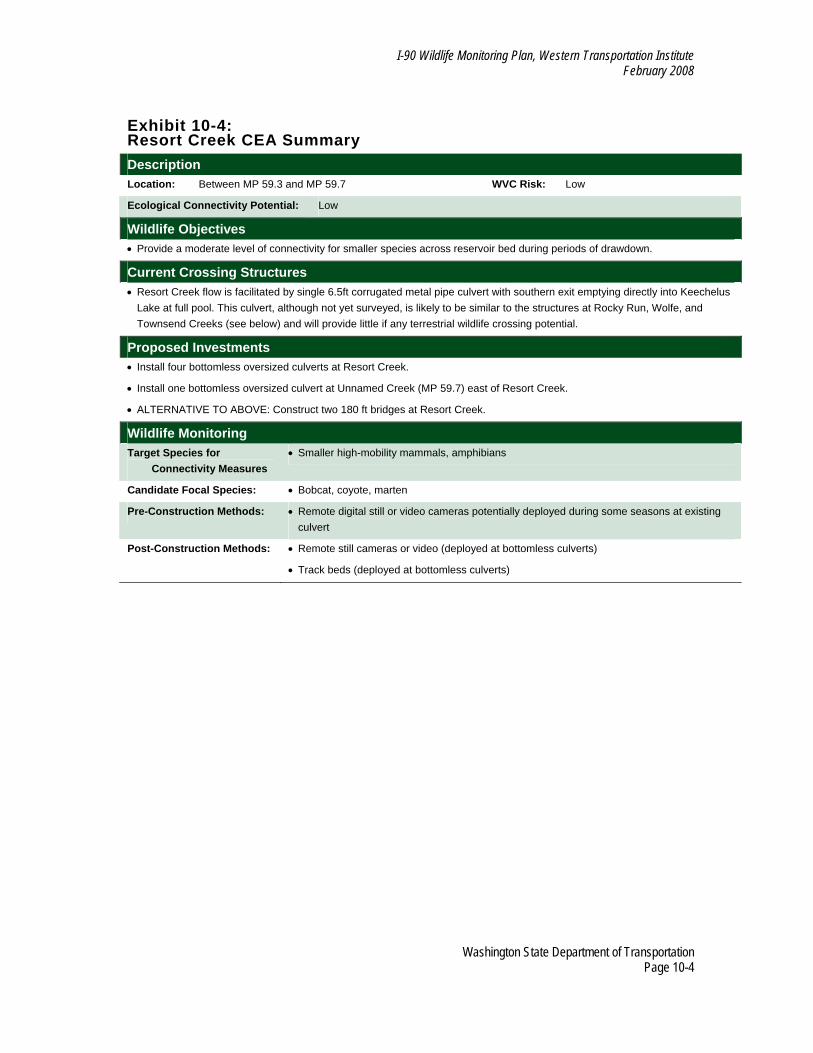
I-90 Wildlife Monitoring Plan, Western Transportation Institute February 2008
Exhibit 10-4: Resort Creek CEA Summary Description Location: Between MP 59.3 and MP 59.7 WVC Risk: Low
Ecological Connectivity Potential: Low
Wildlife Objectives • Provide a moderate level of connectivity for smaller species across reservoir bed during periods of drawdown.
Current Crossing Structures • Resort Creek flow is facilitated by single 6.5ft corrugated metal pipe culvert with southern exit emptying directly into Keechelus
Lake at full pool. This culvert, although not yet surveyed, is likely to be similar to the structures at Rocky Run, Wolfe, and Townsend Creeks (see below) and will provide little if any terrestrial wildlife crossing potential.
Proposed Investments • Install four bottomless oversized culverts at Resort Creek.
• Install one bottomless oversized culvert at Unnamed Creek (MP 59.7) east of Resort Creek.
• ALTERNATIVE TO ABOVE: Construct two 180 ft bridges at Resort Creek.
Wildlife Monitoring Target Species for
Connectivity Measures • Smaller high-mobility mammals, amphibians
Candidate Focal Species: • Bobcat, coyote, marten
Pre-Construction Methods: • Remote digital still or video cameras potentially deployed during some seasons at existing culvert
Post-Construction Methods: • Remote still cameras or video (deployed at bottomless culverts)
• Track beds (deployed at bottomless culverts)
Washington State Department of Transportation Page 10-4
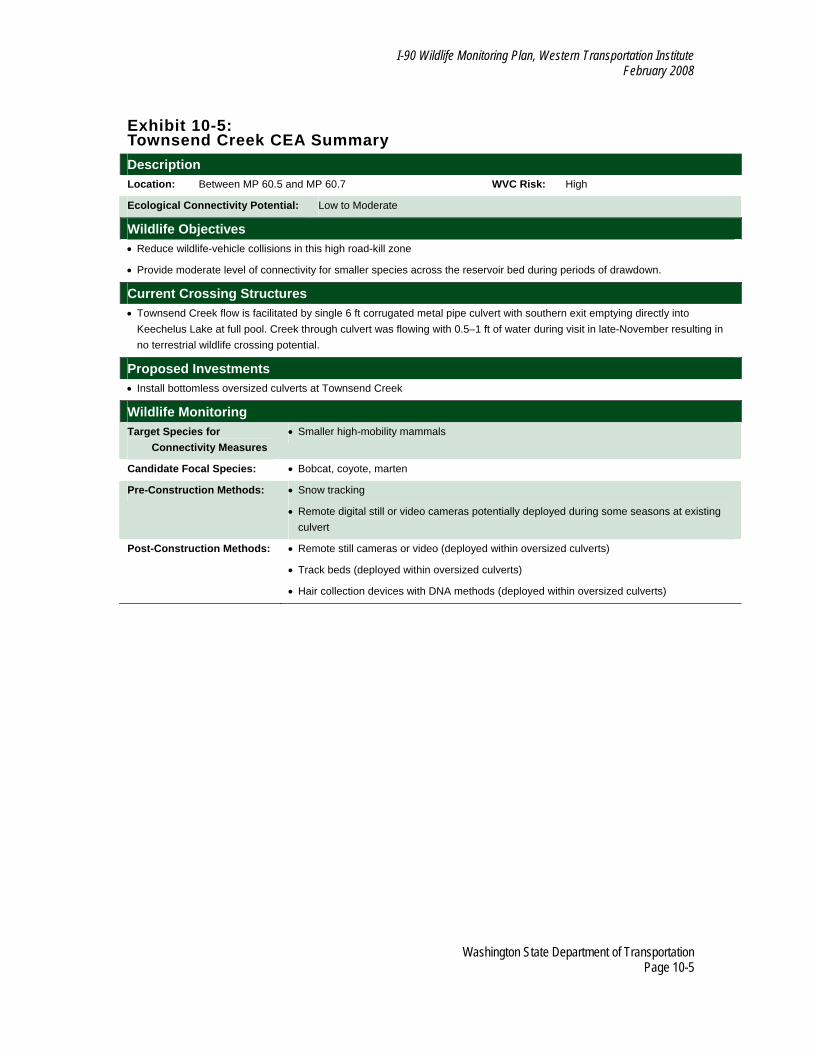
I-90 Wildlife Monitoring Plan, Western Transportation Institute February 2008
Exhibit 10-5: Townsend Creek CEA Summary Description Location: Between MP 60.5 and MP 60.7 WVC Risk: High
Ecological Connectivity Potential: Low to Moderate
Wildlife Objectives • Reduce wildlife-vehicle collisions in this high road-kill zone
• Provide moderate level of connectivity for smaller species across the reservoir bed during periods of drawdown.
Current Crossing Structures • Townsend Creek flow is facilitated by single 6 ft corrugated metal pipe culvert with southern exit emptying directly into
Keechelus Lake at full pool. Creek through culvert was flowing with 0.5–1 ft of water during visit in late-November resulting in no terrestrial wildlife crossing potential.
Proposed Investments • Install bottomless oversized culverts at Townsend Creek
Wildlife Monitoring Target Species for
Connectivity Measures • Smaller high-mobility mammals
Candidate Focal Species: • Bobcat, coyote, marten
Pre-Construction Methods: • Snow tracking
• Remote digital still or video cameras potentially deployed during some seasons at existing culvert
Post-Construction Methods: • Remote still cameras or video (deployed within oversized culverts)
• Track beds (deployed within oversized culverts)
• Hair collection devices with DNA methods (deployed within oversized culverts)
Washington State Department of Transportation Page 10-5

I-90 Wildlife Monitoring Plan, Western Transportation Institute February 2008
Exhibit 10-6: Price and Noble Creeks CEA Summary Description Location: Between MP 60.7 and MP 61.9 WVC Risk: High
Ecological Connectivity Potential: High
Wildlife Objectives • Provide high level of year-round connectivity for high- and low-mobility species associated with western hemlock/Pacific silver
fir forest zone.
• Build structures to provide connectivity for 34 species of mammals, 8 amphibian species and 19 mollusk species that are known to occur or are suspected in this area.
• Connect special soil type, Kachess gravelly sandy loam (K254) and associated low-mobility species.
• Reduce wildlife-vehicle collisions in this high road-kill zone.
Current Crossing Structures • Price Creek: 10 ft concrete box culvert may facilitate highway crossing by terrestrial species—1/2” of water flowing during early
October 2007 site visit.
• Noble Creek: 4 ft corrugated pipe culvert facilitates flow of Noble Creek—1 ft of fast-flowing water exiting southern exit during early October 2007 site visit.
• Bridge at Unnamed Creek (MP 60.9)
Proposed Investments • Construct two 120 ft bridges at Unnamed Creek (MP 60.9) west of Price Creek
• Construct two 120 ft bridges at Price Creek
• Construct two 120 ft bridges at Noble Creek
• Construct 150 ft wildlife overcrossing structure
Wildlife Monitoring Target Species for
Connectivity Measures • High- and low-mobility mammals, amphibians, and reptiles
Candidate Focal Species: • Deer, elk, black bear, bobcat, coyote, marten, pika, river otter, Cascades frog, Western toad, Pacific tree frog, Northern alligator lizard
Pre-Construction Methods: • Snow tracking
• Remote digital still or video cameras deployed during some seasons at existing bridges
• Remote digital still or video cameras deployed specifically for evaluating at-grade wildlife highway crossings
• Track beds deployed specifically for evaluating at-grade road crossing
Post-Construction Methods: • Remote still cameras or video (deployed within 120 ft wildlife bridges and on overcrossing structure)
• Track beds (deployed within 120 ft wildlife bridges and on overcrossing structure)
• Hair collection devices with DNA methods (deployed within 120 ft wildlife bridges and on overcrossing structure)
Washington State Department of Transportation Page 10-6
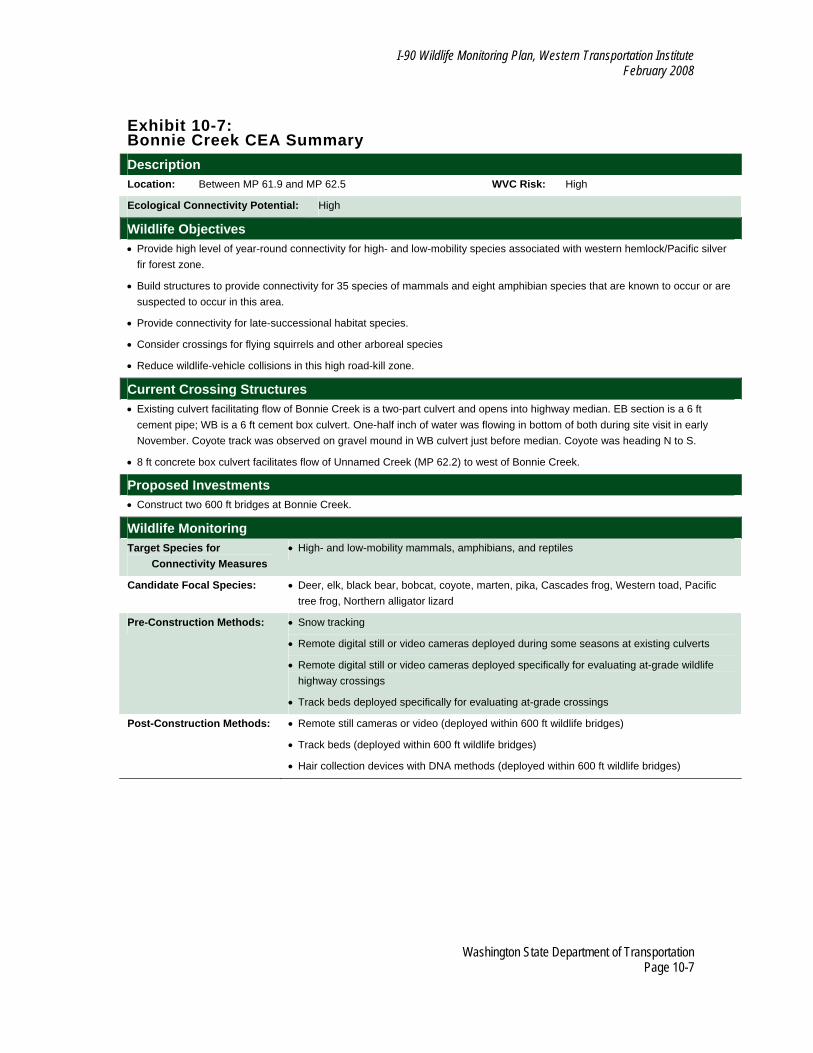
I-90 Wildlife Monitoring Plan, Western Transportation Institute February 2008
Exhibit 10-7: Bonnie Creek CEA Summary Description Location: Between MP 61.9 and MP 62.5 WVC Risk: High
Ecological Connectivity Potential: High
Wildlife Objectives • Provide high level of year-round connectivity for high- and low-mobility species associated with western hemlock/Pacific silver
fir forest zone.
• Build structures to provide connectivity for 35 species of mammals and eight amphibian species that are known to occur or are suspected to occur in this area.
• Provide connectivity for late-successional habitat species.
• Consider crossings for flying squirrels and other arboreal species
• Reduce wildlife-vehicle collisions in this high road-kill zone.
Current Crossing Structures • Existing culvert facilitating flow of Bonnie Creek is a two-part culvert and opens into highway median. EB section is a 6 ft
cement pipe; WB is a 6 ft cement box culvert. One-half inch of water was flowing in bottom of both during site visit in early November. Coyote track was observed on gravel mound in WB culvert just before median. Coyote was heading N to S.
• 8 ft concrete box culvert facilitates flow of Unnamed Creek (MP 62.2) to west of Bonnie Creek.
Proposed Investments • Construct two 600 ft bridges at Bonnie Creek.
Wildlife Monitoring Target Species for
Connectivity Measures • High- and low-mobility mammals, amphibians, and reptiles
Candidate Focal Species: • Deer, elk, black bear, bobcat, coyote, marten, pika, Cascades frog, Western toad, Pacific tree frog, Northern alligator lizard
Pre-Construction Methods: • Snow tracking
• Remote digital still or video cameras deployed during some seasons at existing culverts
• Remote digital still or video cameras deployed specifically for evaluating at-grade wildlife highway crossings
• Track beds deployed specifically for evaluating at-grade crossings
Post-Construction Methods: • Remote still cameras or video (deployed within 600 ft wildlife bridges)
• Track beds (deployed within 600 ft wildlife bridges)
• Hair collection devices with DNA methods (deployed within 600 ft wildlife bridges)
Washington State Department of Transportation Page 10-7
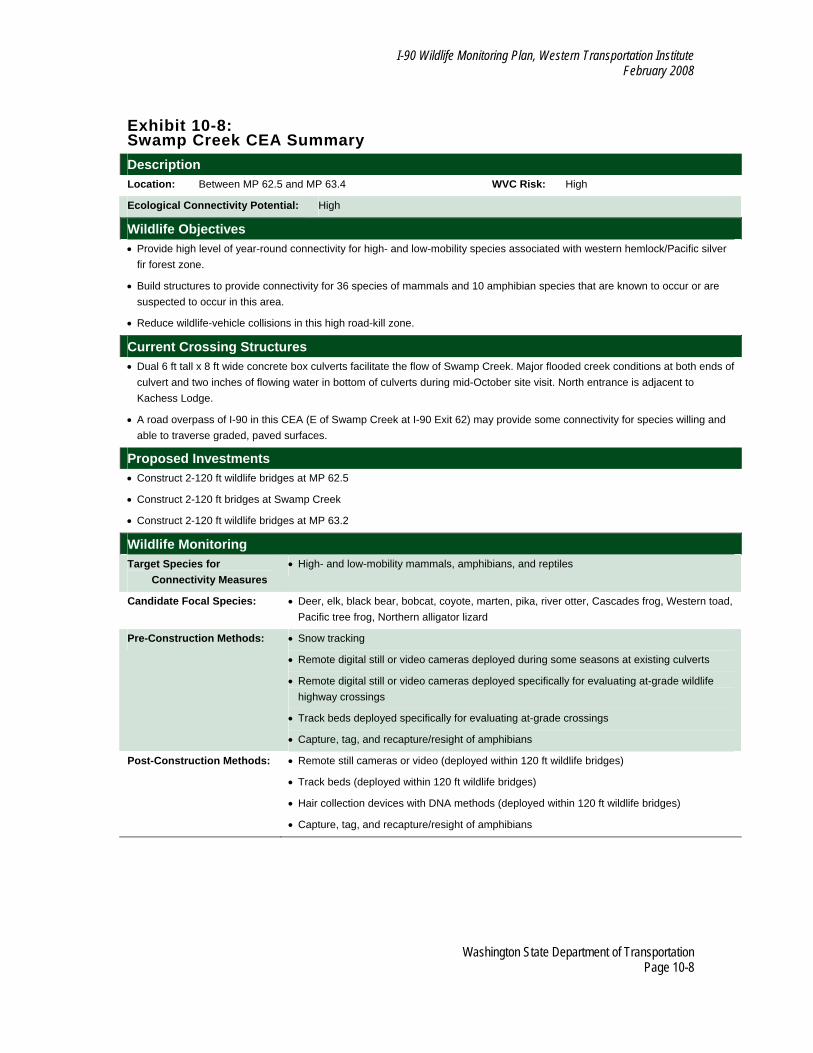
I-90 Wildlife Monitoring Plan, Western Transportation Institute February 2008
Exhibit 10-8: Swamp Creek CEA Summary Description Location: Between MP 62.5 and MP 63.4 WVC Risk: High
Ecological Connectivity Potential: High
Wildlife Objectives • Provide high level of year-round connectivity for high- and low-mobility species associated with western hemlock/Pacific silver
fir forest zone.
• Build structures to provide connectivity for 36 species of mammals and 10 amphibian species that are known to occur or are suspected to occur in this area.
• Reduce wildlife-vehicle collisions in this high road-kill zone.
Current Crossing Structures • Dual 6 ft tall x 8 ft wide concrete box culverts facilitate the flow of Swamp Creek. Major flooded creek conditions at both ends of
culvert and two inches of flowing water in bottom of culverts during mid-October site visit. North entrance is adjacent to Kachess Lodge.
• A road overpass of I-90 in this CEA (E of Swamp Creek at I-90 Exit 62) may provide some connectivity for species willing and able to traverse graded, paved surfaces.
Proposed Investments • Construct 2-120 ft wildlife bridges at MP 62.5
• Construct 2-120 ft bridges at Swamp Creek
• Construct 2-120 ft wildlife bridges at MP 63.2
Wildlife Monitoring Target Species for
Connectivity Measures • High- and low-mobility mammals, amphibians, and reptiles
Candidate Focal Species: • Deer, elk, black bear, bobcat, coyote, marten, pika, river otter, Cascades frog, Western toad, Pacific tree frog, Northern alligator lizard
Pre-Construction Methods: • Snow tracking
• Remote digital still or video cameras deployed during some seasons at existing culverts
• Remote digital still or video cameras deployed specifically for evaluating at-grade wildlife highway crossings
• Track beds deployed specifically for evaluating at-grade crossings
• Capture, tag, and recapture/resight of amphibians
Post-Construction Methods: • Remote still cameras or video (deployed within 120 ft wildlife bridges)
• Track beds (deployed within 120 ft wildlife bridges)
• Hair collection devices with DNA methods (deployed within 120 ft wildlife bridges)
• Capture, tag, and recapture/resight of amphibians
Washington State Department of Transportation Page 10-8
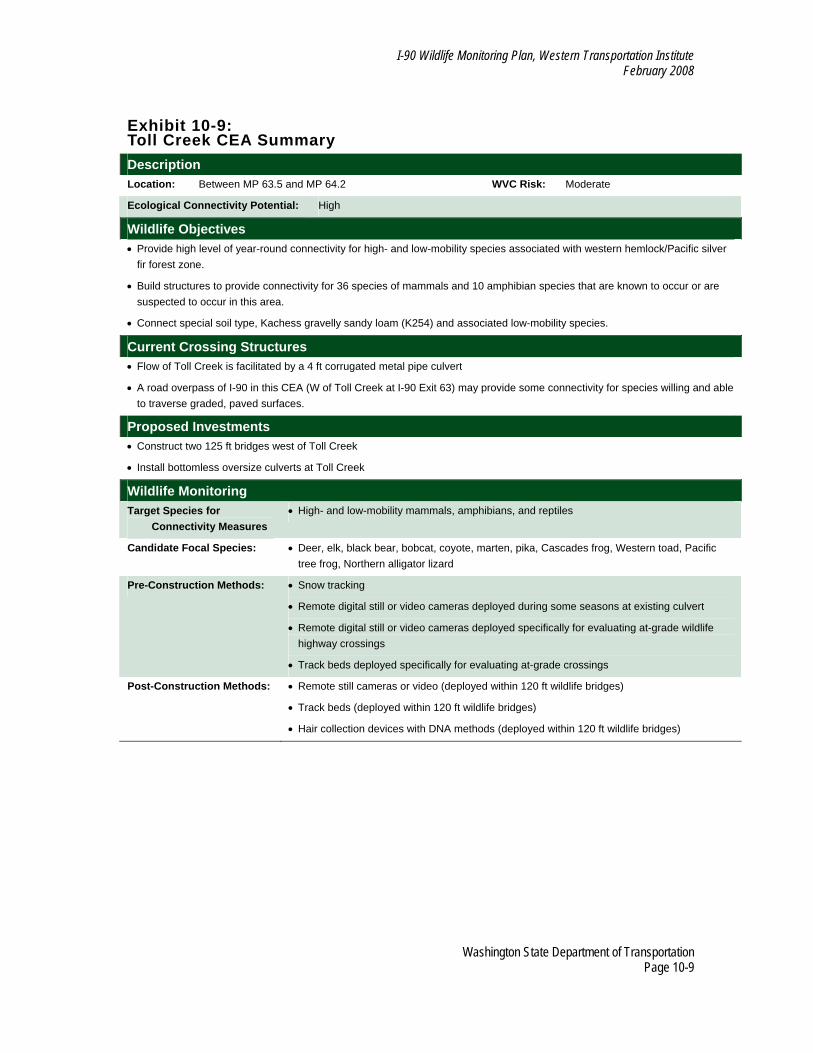
I-90 Wildlife Monitoring Plan, Western Transportation Institute February 2008
Exhibit 10-9: Toll Creek CEA Summary Description Location: Between MP 63.5 and MP 64.2 WVC Risk: Moderate
Ecological Connectivity Potential: High
Wildlife Objectives • Provide high level of year-round connectivity for high- and low-mobility species associated with western hemlock/Pacific silver
fir forest zone.
• Build structures to provide connectivity for 36 species of mammals and 10 amphibian species that are known to occur or are suspected to occur in this area.
• Connect special soil type, Kachess gravelly sandy loam (K254) and associated low-mobility species.
Current Crossing Structures • Flow of Toll Creek is facilitated by a 4 ft corrugated metal pipe culvert
• A road overpass of I-90 in this CEA (W of Toll Creek at I-90 Exit 63) may provide some connectivity for species willing and able to traverse graded, paved surfaces.
Proposed Investments • Construct two 125 ft bridges west of Toll Creek
• Install bottomless oversize culverts at Toll Creek
Wildlife Monitoring Target Species for
Connectivity Measures • High- and low-mobility mammals, amphibians, and reptiles
Candidate Focal Species: • Deer, elk, black bear, bobcat, coyote, marten, pika, Cascades frog, Western toad, Pacific tree frog, Northern alligator lizard
Pre-Construction Methods: • Snow tracking
• Remote digital still or video cameras deployed during some seasons at existing culvert
• Remote digital still or video cameras deployed specifically for evaluating at-grade wildlife highway crossings
• Track beds deployed specifically for evaluating at-grade crossings
Post-Construction Methods: • Remote still cameras or video (deployed within 120 ft wildlife bridges)
• Track beds (deployed within 120 ft wildlife bridges)
• Hair collection devices with DNA methods (deployed within 120 ft wildlife bridges)
Washington State Department of Transportation Page 10-9
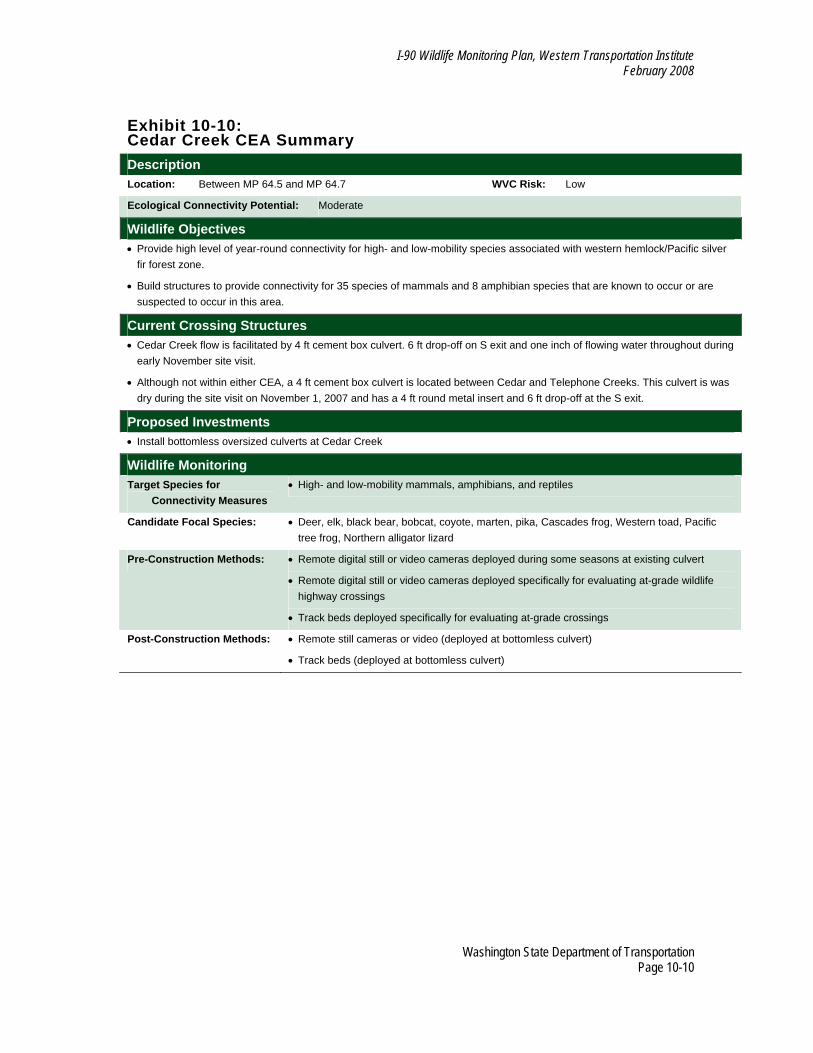
I-90 Wildlife Monitoring Plan, Western Transportation Institute February 2008
Exhibit 10-10: Cedar Creek CEA Summary Description Location: Between MP 64.5 and MP 64.7 WVC Risk: Low
Ecological Connectivity Potential: Moderate
Wildlife Objectives • Provide high level of year-round connectivity for high- and low-mobility species associated with western hemlock/Pacific silver
fir forest zone.
• Build structures to provide connectivity for 35 species of mammals and 8 amphibian species that are known to occur or are suspected to occur in this area.
Current Crossing Structures • Cedar Creek flow is facilitated by 4 ft cement box culvert. 6 ft drop-off on S exit and one inch of flowing water throughout during
early November site visit.
• Although not within either CEA, a 4 ft cement box culvert is located between Cedar and Telephone Creeks. This culvert is was dry during the site visit on November 1, 2007 and has a 4 ft round metal insert and 6 ft drop-off at the S exit.
Proposed Investments • Install bottomless oversized culverts at Cedar Creek
Wildlife Monitoring Target Species for
Connectivity Measures • High- and low-mobility mammals, amphibians, and reptiles
Candidate Focal Species: • Deer, elk, black bear, bobcat, coyote, marten, pika, Cascades frog, Western toad, Pacific tree frog, Northern alligator lizard
Pre-Construction Methods: • Remote digital still or video cameras deployed during some seasons at existing culvert
• Remote digital still or video cameras deployed specifically for evaluating at-grade wildlife highway crossings
• Track beds deployed specifically for evaluating at-grade crossings
Post-Construction Methods: • Remote still cameras or video (deployed at bottomless culvert)
• Track beds (deployed at bottomless culvert)
Washington State Department of Transportation Page 10-10

I-90 Wildlife Monitoring Plan, Western Transportation Institute February 2008
Exhibit 10-11: Telephone Creek CEA Summary Description Location: Between MP 65.5 and MP 65.7 WVC Risk: Low
Ecological Connectivity Potential: Moderate
Wildlife Objectives • Provide high level of year-round connectivity for high- and low-mobility species associated with western hemlock/Pacific silver
fir forest zone.
• Build structures to provide connectivity for 35 species of mammals and 8 amphibian species that are known to occur or are suspected to occur in this area.
• Connect natural talus habitat on both sides of highway
Current Crossing Structures • Telephone Creek flow is facilitated by 6 ft tall x 4 ft wide cement box culvert. 5 ft drop-off on S exit and three inches of water
flowing throughout with waterfall at S exit during early November site visit
Proposed Investments • Install bottomless oversized culverts at Telephone Creek and Unnamed Creek (MP 65.1)
Wildlife Monitoring Target Species for
Connectivity Measures • High- and low-mobility mammals, amphibians, and reptiles
Candidate Focal Species: • Deer, elk, black bear, bobcat, coyote, marten, pika, Cascades frog, Western toad, Pacific tree frog, Northern alligator lizard
Pre-Construction Methods: • Remote digital still or video cameras deployed during some seasons at existing culverts
Post-Construction Methods: • Remote still cameras or video (deployed at bottomless culverts)
Washington State Department of Transportation Page 10-11
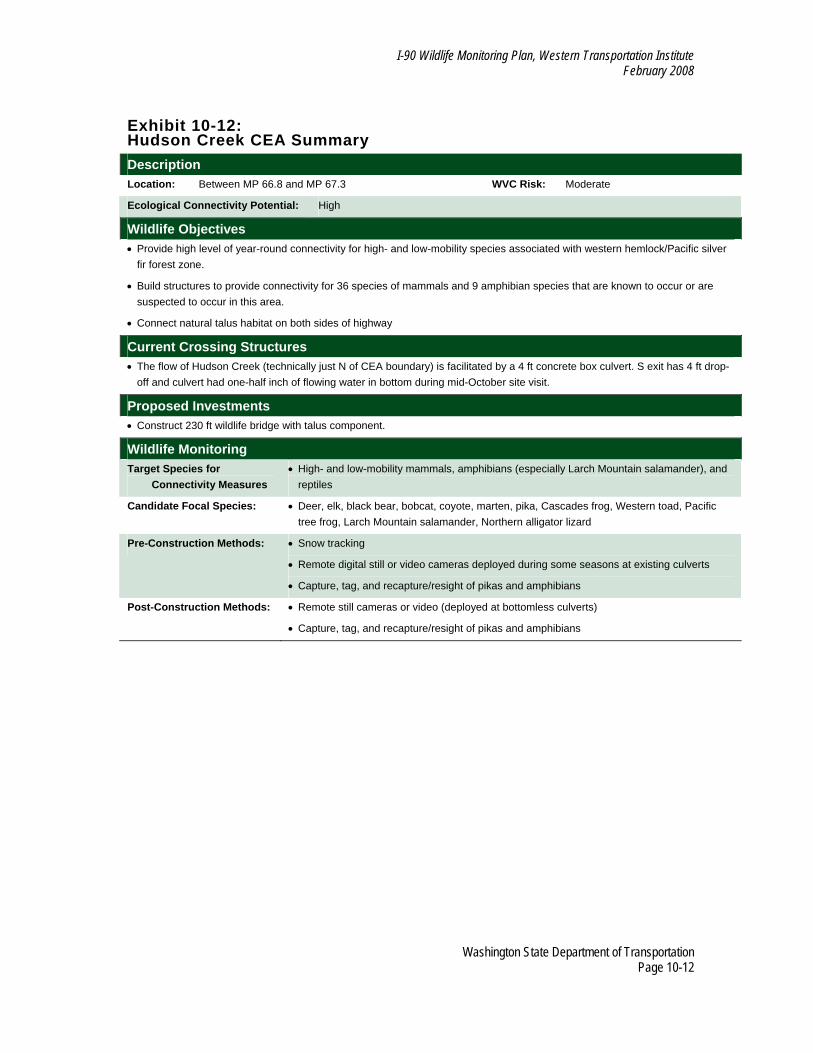
I-90 Wildlife Monitoring Plan, Western Transportation Institute February 2008
Exhibit 10-12: Hudson Creek CEA Summary Description Location: Between MP 66.8 and MP 67.3 WVC Risk: Moderate
Ecological Connectivity Potential: High
Wildlife Objectives • Provide high level of year-round connectivity for high- and low-mobility species associated with western hemlock/Pacific silver
fir forest zone.
• Build structures to provide connectivity for 36 species of mammals and 9 amphibian species that are known to occur or are suspected to occur in this area.
• Connect natural talus habitat on both sides of highway
Current Crossing Structures • The flow of Hudson Creek (technically just N of CEA boundary) is facilitated by a 4 ft concrete box culvert. S exit has 4 ft drop-
off and culvert had one-half inch of flowing water in bottom during mid-October site visit.
Proposed Investments • Construct 230 ft wildlife bridge with talus component.
Wildlife Monitoring Target Species for
Connectivity Measures • High- and low-mobility mammals, amphibians (especially Larch Mountain salamander), and
reptiles
Candidate Focal Species: • Deer, elk, black bear, bobcat, coyote, marten, pika, Cascades frog, Western toad, Pacific tree frog, Larch Mountain salamander, Northern alligator lizard
Pre-Construction Methods: • Snow tracking
• Remote digital still or video cameras deployed during some seasons at existing culverts
• Capture, tag, and recapture/resight of pikas and amphibians
Post-Construction Methods: • Remote still cameras or video (deployed at bottomless culverts)
• Capture, tag, and recapture/resight of pikas and amphibians
Washington State Department of Transportation Page 10-12
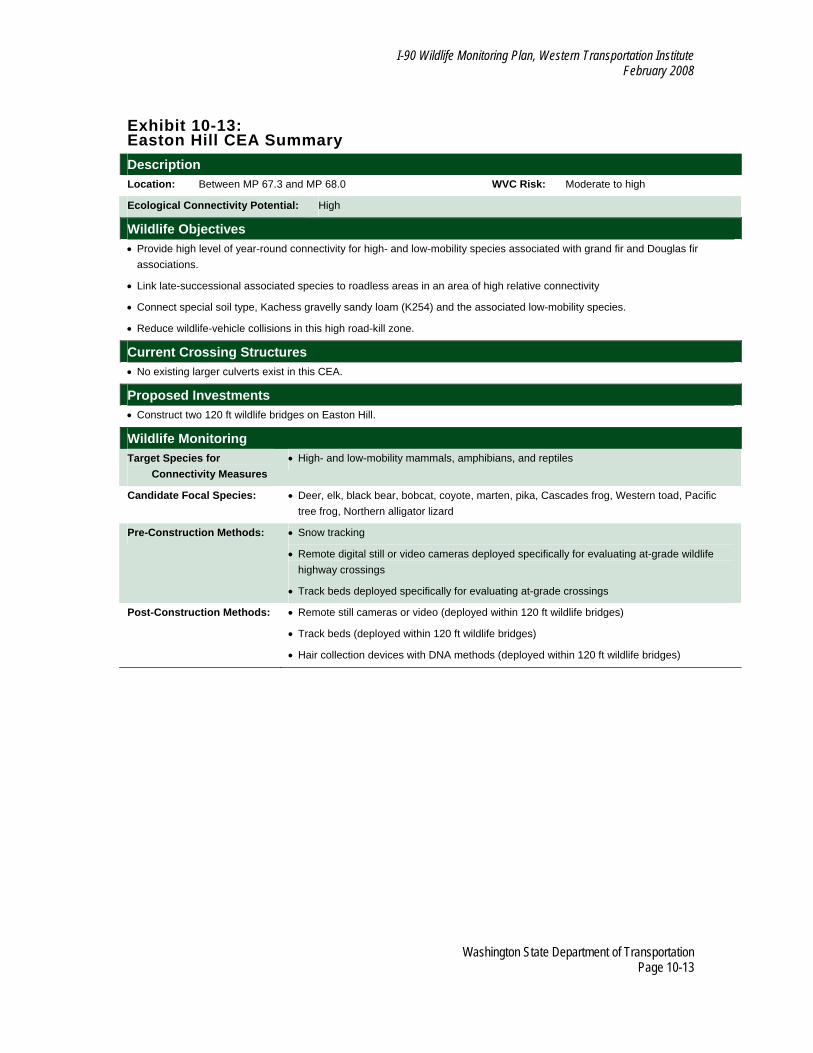
I-90 Wildlife Monitoring Plan, Western Transportation Institute February 2008
Exhibit 10-13: Easton Hill CEA Summary Description Location: Between MP 67.3 and MP 68.0 WVC Risk: Moderate to high
Ecological Connectivity Potential: High
Wildlife Objectives • Provide high level of year-round connectivity for high- and low-mobility species associated with grand fir and Douglas fir
associations.
• Link late-successional associated species to roadless areas in an area of high relative connectivity
• Connect special soil type, Kachess gravelly sandy loam (K254) and the associated low-mobility species.
• Reduce wildlife-vehicle collisions in this high road-kill zone.
Current Crossing Structures • No existing larger culverts exist in this CEA.
Proposed Investments • Construct two 120 ft wildlife bridges on Easton Hill.
Wildlife Monitoring Target Species for
Connectivity Measures • High- and low-mobility mammals, amphibians, and reptiles
Candidate Focal Species: • Deer, elk, black bear, bobcat, coyote, marten, pika, Cascades frog, Western toad, Pacific tree frog, Northern alligator lizard
Pre-Construction Methods: • Snow tracking
• Remote digital still or video cameras deployed specifically for evaluating at-grade wildlife highway crossings
• Track beds deployed specifically for evaluating at-grade crossings
Post-Construction Methods: • Remote still cameras or video (deployed within 120 ft wildlife bridges)
• Track beds (deployed within 120 ft wildlife bridges)
• Hair collection devices with DNA methods (deployed within 120 ft wildlife bridges)
Washington State Department of Transportation Page 10-13
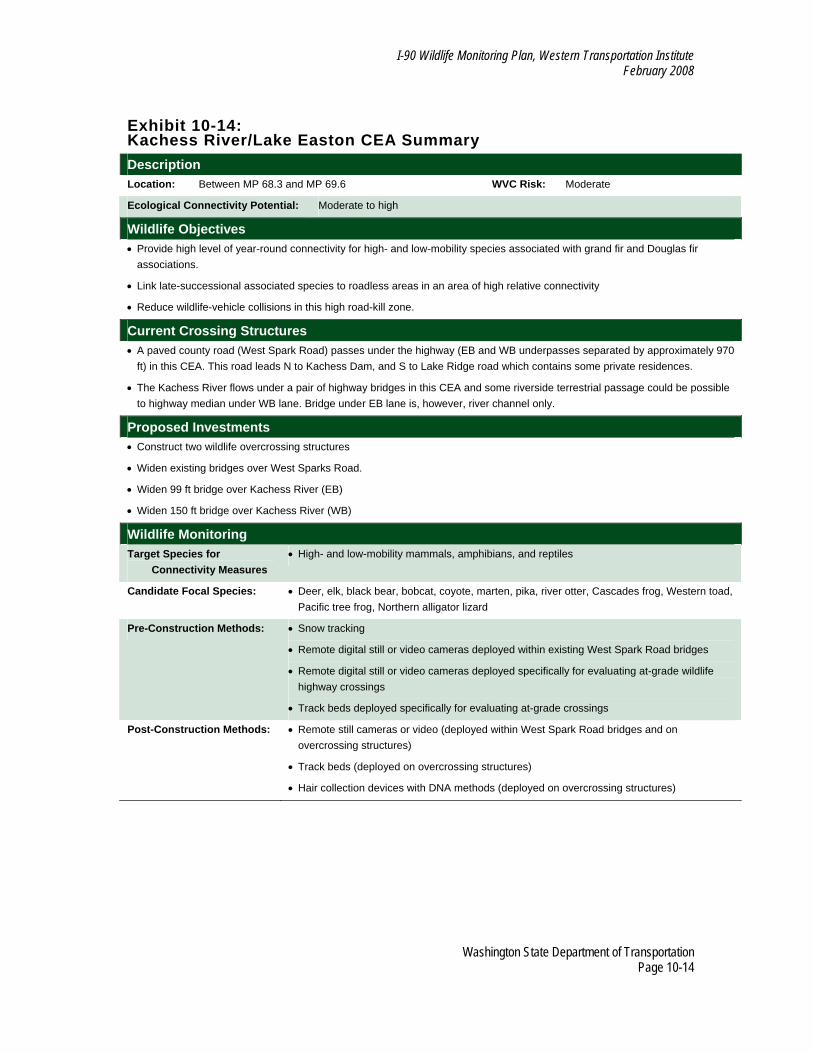
I-90 Wildlife Monitoring Plan, Western Transportation Institute February 2008
Exhibit 10-14: Kachess River/Lake Easton CEA Summary Description Location: Between MP 68.3 and MP 69.6 WVC Risk: Moderate
Ecological Connectivity Potential: Moderate to high
Wildlife Objectives • Provide high level of year-round connectivity for high- and low-mobility species associated with grand fir and Douglas fir
associations.
• Link late-successional associated species to roadless areas in an area of high relative connectivity
• Reduce wildlife-vehicle collisions in this high road-kill zone.
Current Crossing Structures • A paved county road (West Spark Road) passes under the highway (EB and WB underpasses separated by approximately 970
ft) in this CEA. This road leads N to Kachess Dam, and S to Lake Ridge road which contains some private residences.
• The Kachess River flows under a pair of highway bridges in this CEA and some riverside terrestrial passage could be possible to highway median under WB lane. Bridge under EB lane is, however, river channel only.
Proposed Investments • Construct two wildlife overcrossing structures
• Widen existing bridges over West Sparks Road.
• Widen 99 ft bridge over Kachess River (EB)
• Widen 150 ft bridge over Kachess River (WB)
Wildlife Monitoring Target Species for
Connectivity Measures • High- and low-mobility mammals, amphibians, and reptiles
Candidate Focal Species: • Deer, elk, black bear, bobcat, coyote, marten, pika, river otter, Cascades frog, Western toad, Pacific tree frog, Northern alligator lizard
Pre-Construction Methods: • Snow tracking
• Remote digital still or video cameras deployed within existing West Spark Road bridges
• Remote digital still or video cameras deployed specifically for evaluating at-grade wildlife highway crossings
• Track beds deployed specifically for evaluating at-grade crossings
Post-Construction Methods: • Remote still cameras or video (deployed within West Spark Road bridges and on overcrossing structures)
• Track beds (deployed on overcrossing structures)
• Hair collection devices with DNA methods (deployed on overcrossing structures)
Washington State Department of Transportation Page 10-14
I-90 Wildlife Monitoring Plan, Western Transportation Institute February 2008
*NOTES: The following points should be noted as they are relevant to all CEA-specific monitoring:
• Wildlife-Vehicle Collision (WVC) risk is based on road-kill data presented in WSDOT (2006).
• Ecological Connectivity Potential is based on data reported in Singleton and Lehmkuhl (2000).
• All “Proposed Investments” are based on the I-90 Project Footprint (Rev. 02), August 14, 2007.
• Culverts included under “Current Potential Crossing Structures” are limited to larger culverts (i.e., ≥ 4 ft tall) identified in WSDOT’s “All_Culverts_Stormwater_Utilities” layer or as “large culverts” (i.e., > 44 in) by Singleton and Lehmkuhl (2000).
• Culverts located between CEAs are not addressed in this review. Some of these culverts may ultimately be replaced with structures that could facilitate wildlife movement.
• Identified pre-construction and post-construction survey methods are the methods that the authors believe may be the most cost-effective methods for collecting the required monitoring data. In some cases the methods actually selected for monitoring may differ. Further, monitoring of some metrics associated with some objectives in select CEAs may not be possible given logistical or cost constraints.
• During-construction survey methods are not identified in this review. Methods used during-construction will be similar to those pre- and post-construction periods for certain Tier 1 and 2 objectives (see Exhibit 3-5).
• Monitoring of wildlife-vehicle collisions (both pre- and post-construction) will be conducted at the scale of the project area (as opposed to the individual CEA) and will be based on one of the following survey methods:
o Carcass removal reports by WSDOT maintenance crews; o Wildlife-vehicle collision reports by State patrol; o Systematic driving surveys by WTI personnel using PDA-GPS hand-held data
collectors.
Washington State Department of Transportation Page 10-15

I-90 Wildlife Monitoring Plan, Western Transportation Institute February 2008
Washington State Department of Transportation Page 10-16

I-90 Wildlife Monitoring Plan, Western Transportation Institute February 2008
11. Appendix D Exhibit 11-1: Framework for evaluating the performance of ecological connectivity measures. Numbers for monitoring questions relate to one another across columns. Black text = Tier 1 monitoring; Blue text = Tier 2 monitoring and research.
MONITORING OBJECTIVES
Monitoring question Methods Study design Targets
WILDLIFE-VEHICLE COLLISION REDUCTION (PRE- AND POST-CONSTRUCTION)
1. Do crossing structures reduce mortality rates? 1.a. Compared to baseline levels of road mortality; 1.b. Compared to adjacent “control” areas post-construction. 1.c. Compared to other sections of highway without crossing structures. 3. What is the incidence of mortality among a marked sample? (Addressing this question will require large sample sizes and representative sampling of population.)
Road-kill data collection: 1 & 2. Road-kill surveys on highway sections with and without crossing structures. Surveys must be extensive (see Feldhamer et al. 1986) and systematically conducted at frequent intervals. Radio telemetry: 3. Standard capture-mark-release techniques. Transmitters may consist of VHF transmitters or global positioning system (GPS) transmitters with the latter providing more spatial accuracy in identifying how and where animals cross highways.
Road-kill data collection: 1.a. (1) Pre- vs. post-construction comparison of mortality rates on “treatment” areas (crossing structures) with “controls” (BACI1 design). 1.a. (2) Pre- vs. post- construction comparison of mortality rates on “treatment” areas (crossing structures) and those without “controls” (BA1 design). 1.b. Post-construction comparison of mortality rates using “treatment” (crossing structures) sections vs. adjacent sections without crossing structures (CI1
design). 2.a. Multivariate logistic regression analysis. 2.b. Comparison of mortality rates on sections with and without crossing structures, standardized by highway length. Radio telemetry: 3. Proportion of marked sample killed on highway compared to control sections.
1 & 2. Reduction in mortality rates compared with baseline conditions (i.e., without crossing structures). Reductions should either be statistically significant or deemed biologically meaningful. 3. Significant (statistical or biological) proportion of the marked sample survives and reproduces in highway environment with crossing structures.
Washington State Department of Transportation Page 11-1
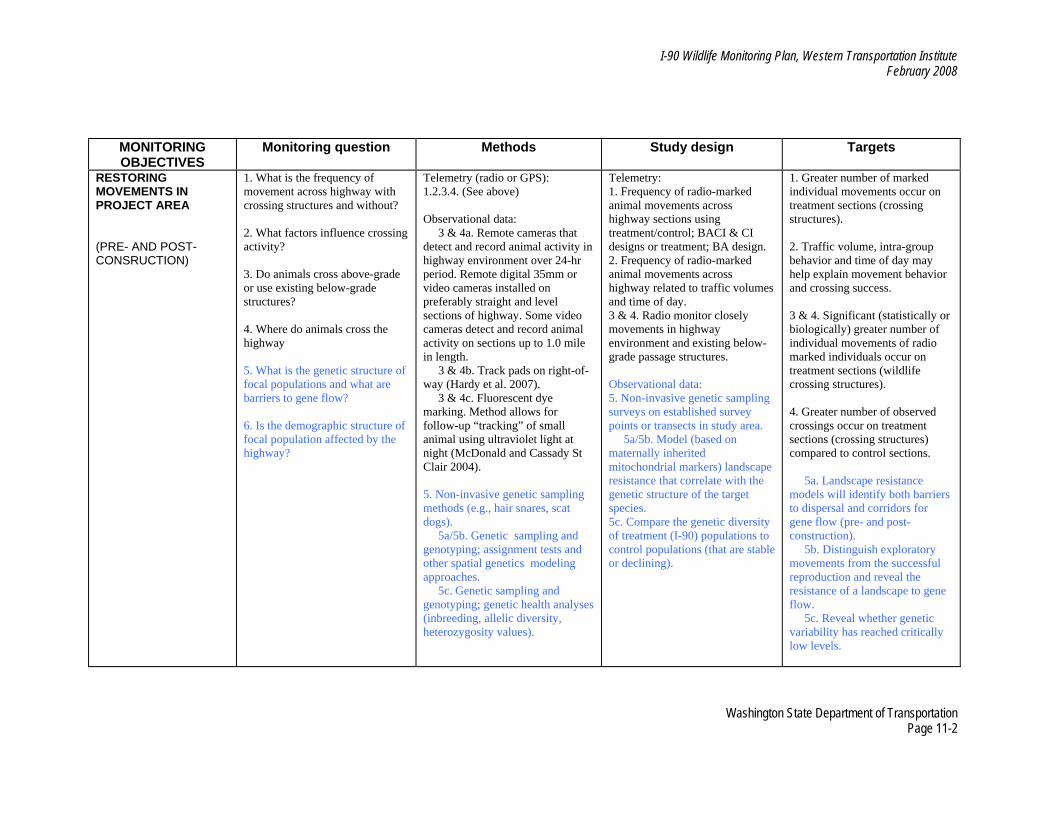
I-90 Wildlife Monitoring Plan, Western Transportation Institute February 2008
MONITORING OBJECTIVES
Monitoring question Methods Study design Targets
RESTORING MOVEMENTS IN PROJECT AREA (PRE- AND POST-CONSRUCTION)
1. What is the frequency of movement across highway with crossing structures and without? 2. What factors influence crossing activity? 3. Do animals cross above-grade or use existing below-grade structures? 4. Where do animals cross the highway 5. What is the genetic structure of focal populations and what are barriers to gene flow? 6. Is the demographic structure of focal population affected by the highway?
Telemetry (radio or GPS): 1.2.3.4. (See above) Observational data: 3 & 4a. Remote cameras that detect and record animal activity in highway environment over 24-hr period. Remote digital 35mm or video cameras installed on preferably straight and level sections of highway. Some video cameras detect and record animal activity on sections up to 1.0 mile in length. 3 & 4b. Track pads on right-of-way (Hardy et al. 2007). 3 & 4c. Fluorescent dye marking. Method allows for follow-up “tracking” of small animal using ultraviolet light at night (McDonald and Cassady St Clair 2004). 5. Non-invasive genetic sampling methods (e.g., hair snares, scat dogs). 5a/5b. Genetic sampling and genotyping; assignment tests and other spatial genetics modeling approaches. 5c. Genetic sampling and genotyping; genetic health analyses (inbreeding, allelic diversity, heterozygosity values).
Telemetry: 1. Frequency of radio-marked animal movements across highway sections using treatment/control; BACI & CI designs or treatment; BA design. 2. Frequency of radio-marked animal movements across highway related to traffic volumes and time of day. 3 & 4. Radio monitor closely movements in highway environment and existing below-grade passage structures. Observational data: 5. Non-invasive genetic sampling surveys on established survey points or transects in study area. 5a/5b. Model (based on maternally inherited mitochondrial markers) landscape resistance that correlate with the genetic structure of the target species. 5c. Compare the genetic diversity of treatment (I-90) populations to control populations (that are stable or declining).
1. Greater number of marked individual movements occur on treatment sections (crossing structures). 2. Traffic volume, intra-group behavior and time of day may help explain movement behavior and crossing success. 3 & 4. Significant (statistically or biologically) greater number of individual movements of radio marked individuals occur on treatment sections (wildlife crossing structures). 4. Greater number of observed crossings occur on treatment sections (crossing structures) compared to control sections. 5a. Landscape resistance models will identify both barriers to dispersal and corridors for gene flow (pre- and post-construction). 5b. Distinguish exploratory movements from the successful reproduction and reveal the resistance of a landscape to gene flow. 5c. Reveal whether genetic variability has reached critically low levels.
Washington State Department of Transportation Page 11-2

I-90 Wildlife Monitoring Plan, Western Transportation Institute February 2008
MONITORING OBJECTIVES
Monitoring question Methods Study design Targets (Applications)
POPULATION VIABILITY (POST-CONSTRUCTION)
Do project connectivity measures affect key life-history attributes (e.g., mortality, fertility, survival to reproduction, connectivity) and provide for natural sustaining populations in the project area?
Spatially-explicit population viability modeling: Development of spatially-explicit, individually-based population viability (PV) models using demography data and habitat data collected for other project objectives or obtained from the scientific literature. Use of custom or commercially available PV modeling software (e.g., RAMAS-GIS). Robust demography and spatially-explicit landscape suitability information will be required for such an approach.
Spatially-explicit population viability modeling: Modeling of PV under (a) baseline conditions, (b) highway without wildlife crossings, (c) highway with wildlife crossings.
Spatially-explicit population viability modeling: Determination of the mean and variation of demographic parameters necessary to maintain viable populations over the long term; provides different modeling scenarios by varying performance targets, refining target parameters and creating new monitoring questions based on predictions, and future PV models.
Washington State Department of Transportation Page 11-3
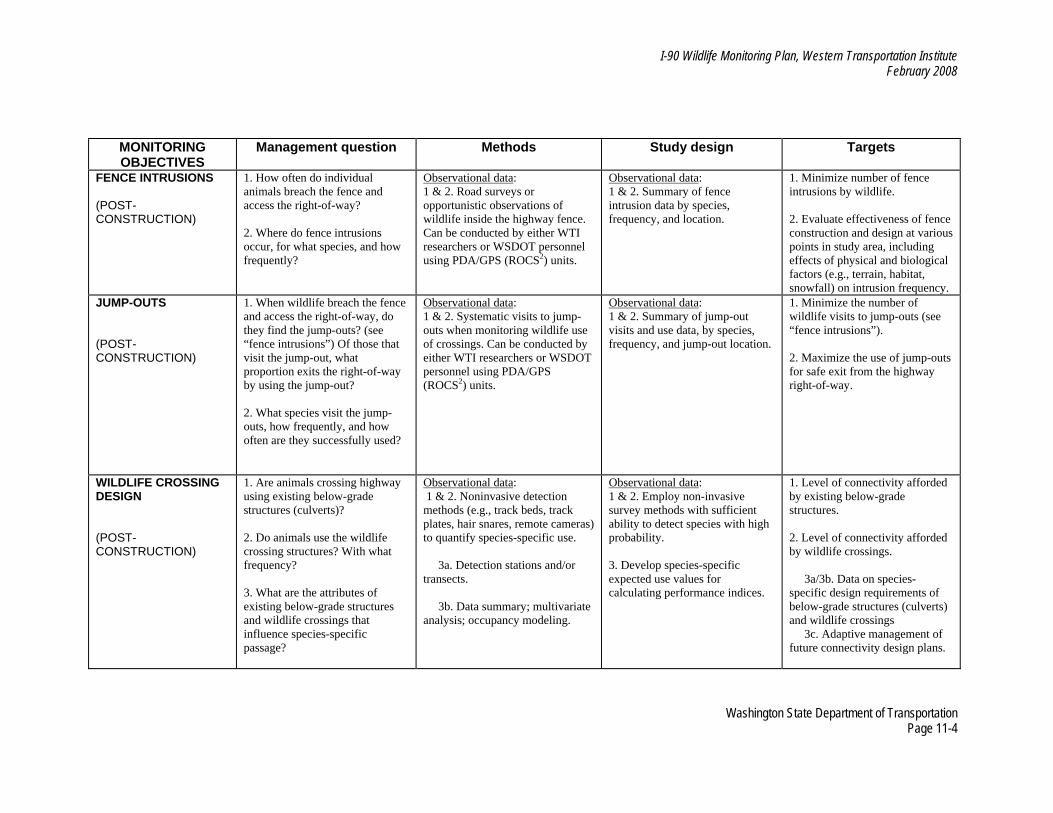
I-90 Wildlife Monitoring Plan, Western Transportation Institute February 2008
MONITORING OBJECTIVES
Management question Methods Study design Targets
FENCE INTRUSIONS (POST-CONSTRUCTION)
1. How often do individual animals breach the fence and access the right-of-way? 2. Where do fence intrusions occur, for what species, and how frequently?
Observational data: 1 & 2. Road surveys or opportunistic observations of wildlife inside the highway fence. Can be conducted by either WTI researchers or WSDOT personnel using PDA/GPS (ROCS2) units.
Observational data: 1 & 2. Summary of fence intrusion data by species, frequency, and location.
1. Minimize number of fence intrusions by wildlife. 2. Evaluate effectiveness of fence construction and design at various points in study area, including effects of physical and biological factors (e.g., terrain, habitat, snowfall) on intrusion frequency.
JUMP-OUTS (POST-CONSTRUCTION)
1. When wildlife breach the fence and access the right-of-way, do they find the jump-outs? (see “fence intrusions”) Of those that visit the jump-out, what proportion exits the right-of-way by using the jump-out? 2. What species visit the jump-outs, how frequently, and how often are they successfully used?
Observational data: 1 & 2. Systematic visits to jump-outs when monitoring wildlife use of crossings. Can be conducted by either WTI researchers or WSDOT personnel using PDA/GPS (ROCS2) units.
Observational data: 1 & 2. Summary of jump-out visits and use data, by species, frequency, and jump-out location.
1. Minimize the number of wildlife visits to jump-outs (see “fence intrusions”). 2. Maximize the use of jump-outs for safe exit from the highway right-of-way.
WILDLIFE CROSSING DESIGN (POST-CONSTRUCTION)
1. Are animals crossing highway using existing below-grade structures (culverts)? 2. Do animals use the wildlife crossing structures? With what frequency? 3. What are the attributes of existing below-grade structures and wildlife crossings that influence species-specific passage?
Observational data: 1 & 2. Noninvasive detection methods (e.g., track beds, track plates, hair snares, remote cameras) to quantify species-specific use. 3a. Detection stations and/or transects. 3b. Data summary; multivariate analysis; occupancy modeling.
Observational data: 1 & 2. Employ non-invasive survey methods with sufficient ability to detect species with high probability. 3. Develop species-specific expected use values for calculating performance indices.
1. Level of connectivity afforded by existing below-grade structures. 2. Level of connectivity afforded by wildlife crossings. 3a/3b. Data on species-specific design requirements of below-grade structures (culverts) and wildlife crossings 3c. Adaptive management of future connectivity design plans.
Washington State Department of Transportation Page 11-4
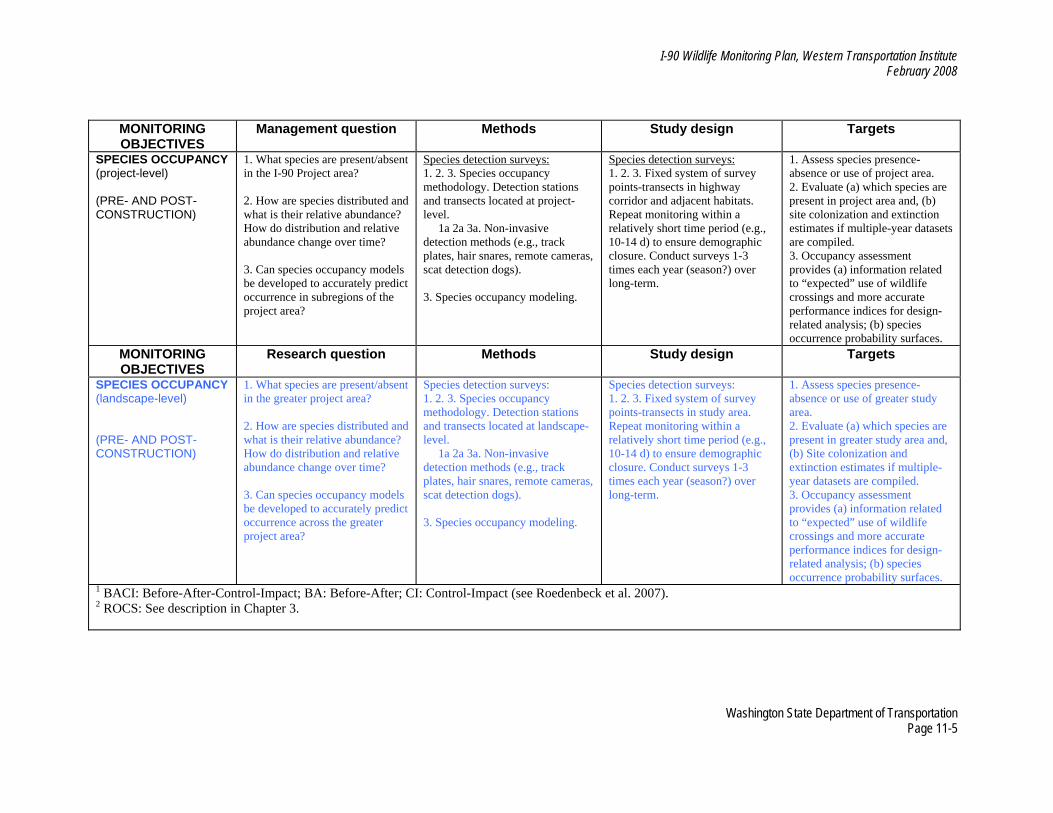
I-90 Wildlife Monitoring Plan, Western Transportation Institute February 2008
MONITORING OBJECTIVES
Management question Methods Study design Targets
SPECIES OCCUPANCY (project-level) (PRE- AND POST-CONSTRUCTION)
1. What species are present/absent in the I-90 Project area? 2. How are species distributed and what is their relative abundance? How do distribution and relative abundance change over time? 3. Can species occupancy models be developed to accurately predict occurrence in subregions of the project area?
Species detection surveys: 1. 2. 3. Species occupancy methodology. Detection stations and transects located at project-level. 1a 2a 3a. Non-invasive detection methods (e.g., track plates, hair snares, remote cameras, scat detection dogs). 3. Species occupancy modeling.
Species detection surveys: 1. 2. 3. Fixed system of survey points-transects in highway corridor and adjacent habitats. Repeat monitoring within a relatively short time period (e.g., 10-14 d) to ensure demographic closure. Conduct surveys 1-3 times each year (season?) over long-term.
1. Assess species presence-absence or use of project area. 2. Evaluate (a) which species are present in project area and, (b) site colonization and extinction estimates if multiple-year datasets are compiled. 3. Occupancy assessment provides (a) information related to “expected” use of wildlife crossings and more accurate performance indices for design-related analysis; (b) species occurrence probability surfaces.
MONITORING OBJECTIVES
Research question Methods Study design Targets
SPECIES OCCUPANCY (landscape-level) (PRE- AND POST-CONSTRUCTION)
1. What species are present/absent in the greater project area? 2. How are species distributed and what is their relative abundance? How do distribution and relative abundance change over time? 3. Can species occupancy models be developed to accurately predict occurrence across the greater project area?
Species detection surveys: 1. 2. 3. Species occupancy methodology. Detection stations and transects located at landscape-level. 1a 2a 3a. Non-invasive detection methods (e.g., track plates, hair snares, remote cameras, scat detection dogs). 3. Species occupancy modeling.
Species detection surveys: 1. 2. 3. Fixed system of survey points-transects in study area. Repeat monitoring within a relatively short time period (e.g., 10-14 d) to ensure demographic closure. Conduct surveys 1-3 times each year (season?) over long-term.
1. Assess species presence-absence or use of greater study area. 2. Evaluate (a) which species are present in greater study area and, (b) Site colonization and extinction estimates if multiple-year datasets are compiled. 3. Occupancy assessment provides (a) information related to “expected” use of wildlife crossings and more accurate performance indices for design-related analysis; (b) species occurrence probability surfaces.
1 BACI: Before-After-Control-Impact; BA: Before-After; CI: Control-Impact (see Roedenbeck et al. 2007). 2 ROCS: See description in Chapter 3.
Washington State Department of Transportation Page 11-5

I-90 Wildlife Monitoring Plan, Western Transportation Institute February 2008
Washington State Department of Transportation Page 11-6
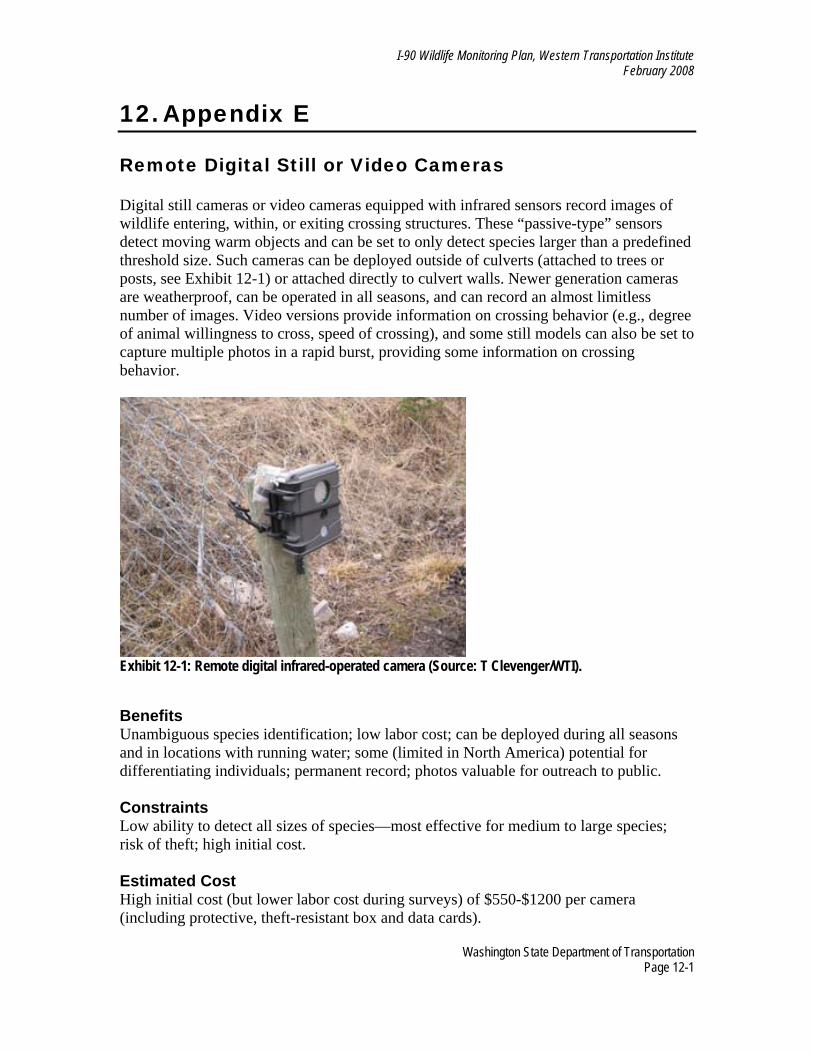
I-90 Wildlife Monitoring Plan, Western Transportation Institute February 2008
12. Appendix E Remote Digital Still or Video Cameras Digital still cameras or video cameras equipped with infrared sensors record images of wildlife entering, within, or exiting crossing structures. These “passive-type” sensors detect moving warm objects and can be set to only detect species larger than a predefined threshold size. Such cameras can be deployed outside of culverts (attached to trees or posts, see Exhibit 12-1) or attached directly to culvert walls. Newer generation cameras are weatherproof, can be operated in all seasons, and can record an almost limitless number of images. Video versions provide information on crossing behavior (e.g., degree of animal willingness to cross, speed of crossing), and some still models can also be set to capture multiple photos in a rapid burst, providing some information on crossing behavior.
Exhibit 12-1: Remote digital infrared-operated camera (Source: T Clevenger/WTI). Benefits Unambiguous species identification; low labor cost; can be deployed during all seasons and in locations with running water; some (limited in North America) potential for differentiating individuals; permanent record; photos valuable for outreach to public. Constraints Low ability to detect all sizes of species—most effective for medium to large species; risk of theft; high initial cost. Estimated Cost High initial cost (but lower labor cost during surveys) of $550-$1200 per camera (including protective, theft-resistant box and data cards).
Washington State Department of Transportation Page 12-1
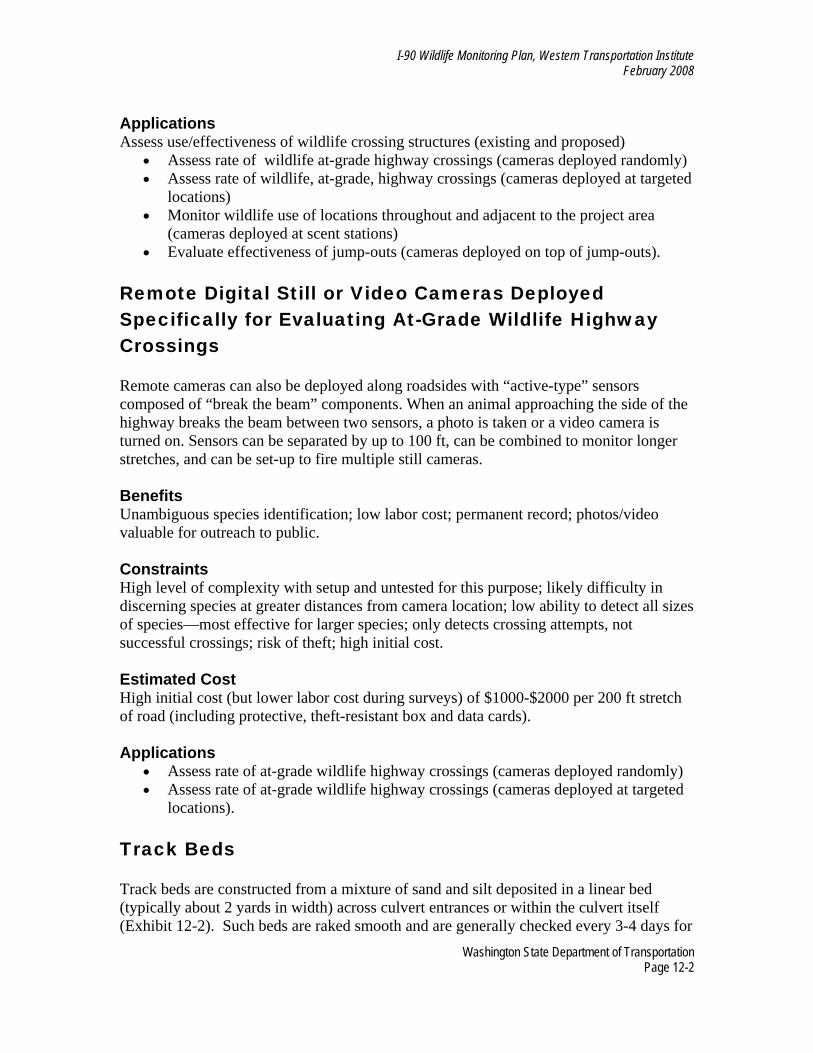
I-90 Wildlife Monitoring Plan, Western Transportation Institute February 2008
Applications Assess use/effectiveness of wildlife crossing structures (existing and proposed)
• Assess rate of wildlife at-grade highway crossings (cameras deployed randomly) • Assess rate of wildlife, at-grade, highway crossings (cameras deployed at targeted
locations) • Monitor wildlife use of locations throughout and adjacent to the project area
(cameras deployed at scent stations) • Evaluate effectiveness of jump-outs (cameras deployed on top of jump-outs).
Remote Digital Still or Video Cameras Deployed Specifically for Evaluating At-Grade Wildlife Highway Crossings Remote cameras can also be deployed along roadsides with “active-type” sensors composed of “break the beam” components. When an animal approaching the side of the highway breaks the beam between two sensors, a photo is taken or a video camera is turned on. Sensors can be separated by up to 100 ft, can be combined to monitor longer stretches, and can be set-up to fire multiple still cameras. Benefits Unambiguous species identification; low labor cost; permanent record; photos/video valuable for outreach to public. Constraints High level of complexity with setup and untested for this purpose; likely difficulty in discerning species at greater distances from camera location; low ability to detect all sizes of species—most effective for larger species; only detects crossing attempts, not successful crossings; risk of theft; high initial cost. Estimated Cost High initial cost (but lower labor cost during surveys) of $1000-$2000 per 200 ft stretch of road (including protective, theft-resistant box and data cards). Applications
• Assess rate of at-grade wildlife highway crossings (cameras deployed randomly) • Assess rate of at-grade wildlife highway crossings (cameras deployed at targeted
locations). Track Beds Track beds are constructed from a mixture of sand and silt deposited in a linear bed (typically about 2 yards in width) across culvert entrances or within the culvert itself (Exhibit 12-2). Such beds are raked smooth and are generally checked every 3-4 days for
Washington State Department of Transportation Page 12-2
I-90 Wildlife Monitoring Plan, Western Transportation Institute February 2008
tracks that indicate animal crossings and provide additional information (e.g., species, direction of travel, number of individuals).
Exhibit 12-2: Raking of track bed in culvert, Banff National Park, Alberta (Source: T Clevenger/WTI). Benefits Detect wide-variety of animal sizes (but generally coyote-size and larger); can provide back-up in case remote camera malfunctions or is stolen; relatively low up-front cost; Generally not affected by weather events that may obliterate tracks if structure is covered (e.g., underpass or culvert). Constraints Unable to deploy at locations with running water unless natural banks or engineered pathways are constructed in structures; occasionally problems with species identification; trampling of tracks (i.e., many overlapping tracks) can make interpretation difficult if not checked regularly; difficult to confirm that an individual animal passed completely through the structure or simply crossed the bed and returned. Estimated Cost Low cost (field vehicle and labor cost during surveys for personnel to check track pads regularly); personnel costs: $1300 for one month of monitoring @ 10 days of work per month @ $130/day ($16/hr); low equipment costs: rake, personal data assistant (PDA), digital camera, tape measure, field guide to animal tracks. Applications
• Assess use/effectiveness of wildlife crossing structures (existing and proposed) • Monitor wildlife use of locations throughout and adjacent to the project area (beds
deployed in conjunction with a bait or scent lure • Evaluate effectiveness of jump-outs (beds deployed on top and around the base of
jump-outs).
Washington State Department of Transportation Page 12-3

I-90 Wildlife Monitoring Plan, Western Transportation Institute February 2008
Track Beds Deployed Specifically for Evaluating At-Grade Wildlife Highway Crossings Track beds can also be deployed along highway shoulders or in medians, providing a means to detect animals approaching the side of the highway or in the median. Benefits Detect wide variety of large mammals; can provide back-up in case remote camera malfunctions or is stolen; Constraints Unable to deploy at locations with little or no shoulder, where shoulder is steep or inundated with water, where shoulder is mostly vegetation, or in locations where monitoring and maintenance would be a safety risk to personnel; ambiguous species identification common; tracks cannot easily be collected and reviewed later; over-tracking (i.e., many overlapping tracks) can make interpretation difficult; difficult to confirm that animals leaving tracks actually attempted to cross highway or had simply crossed the bed and returned; only detects crossing attempts, not successful crossings; installation requires heavy machinery and coordination with Department of Transportation; high labor cost (must be maintained frequently). Estimated Cost High initial cost: $350–$400 for materials and installation of one 100 ft bed (depends largely on access to sand and machinery); low operational cost: labor cost to conduct surveys=$1300 for one month of monitoring @ 10 days of work per month @ $130/day ($16/hr); low equipment costs: rake, PDA, digital camera, tape measure, field guide to animal tracks (same as ‘track bed’ monitoring above). Applications
• Assess rate of at-grade highway wildlife crossings (cameras deployed randomly) • Assess rate of at-grade highway wildlife crossings (cameras deployed at targeted
locations). Unenclosed Track Plates A metal plate covered partially with a thin layer of soot and then a section of light-colored contact paper with the sticky side up. Animals crossing the plate first walk over soot and then track the soot on the contact paper, leaving a print (Exhibit 12-3). Plates are checked for prints every 5-7 days and soot/paper is replaced. Contact paper with prints is removed and stored in plastic page protector.
Washington State Department of Transportation Page 12-4
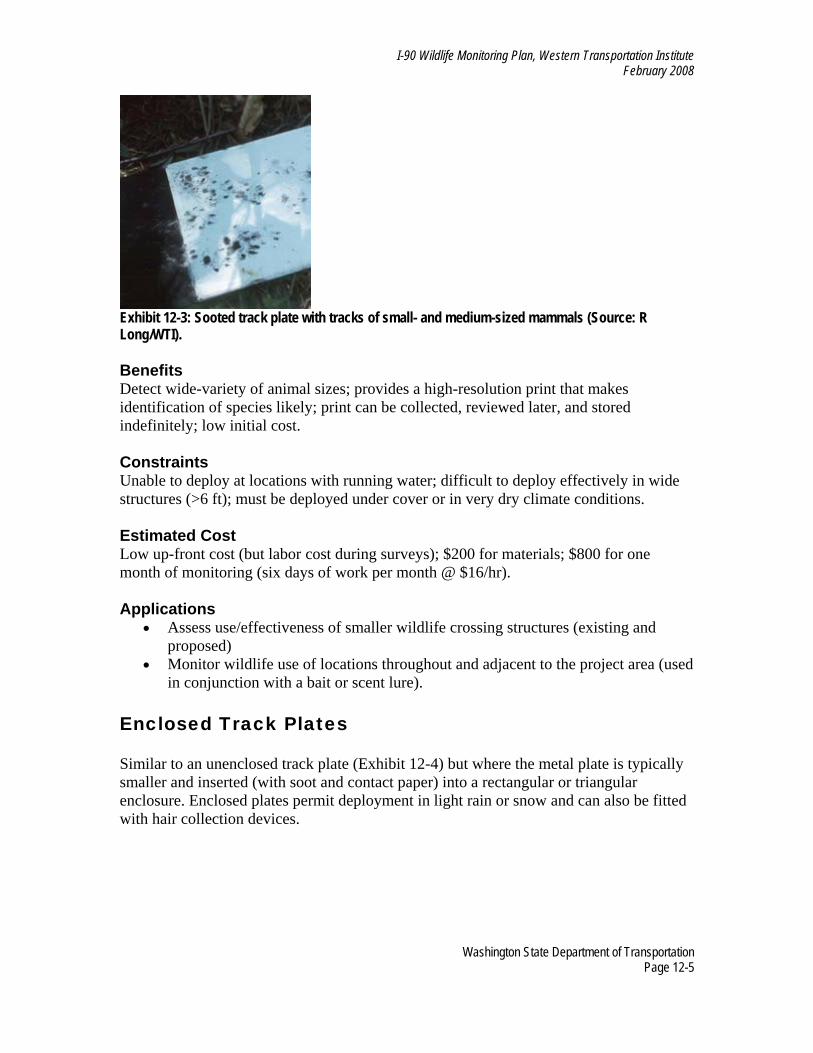
I-90 Wildlife Monitoring Plan, Western Transportation Institute February 2008
Exhibit 12-3: Sooted track plate with tracks of small- and medium-sized mammals (Source: R Long/WTI). Benefits Detect wide-variety of animal sizes; provides a high-resolution print that makes identification of species likely; print can be collected, reviewed later, and stored indefinitely; low initial cost. Constraints Unable to deploy at locations with running water; difficult to deploy effectively in wide structures (>6 ft); must be deployed under cover or in very dry climate conditions. Estimated Cost Low up-front cost (but labor cost during surveys); $200 for materials; $800 for one month of monitoring (six days of work per month @ $16/hr). Applications
• Assess use/effectiveness of smaller wildlife crossing structures (existing and proposed)
• Monitor wildlife use of locations throughout and adjacent to the project area (used in conjunction with a bait or scent lure).
Enclosed Track Plates Similar to an unenclosed track plate (Exhibit 12-4) but where the metal plate is typically smaller and inserted (with soot and contact paper) into a rectangular or triangular enclosure. Enclosed plates permit deployment in light rain or snow and can also be fitted with hair collection devices.
Washington State Department of Transportation Page 12-5

I-90 Wildlife Monitoring Plan, Western Transportation Institute February 2008
Exhibit 12-4: Diagram of hair-snagging system at a wildlife underpass used in DNA-based research of population-level benefits of crossing structures (Source: T Clevenger/WTI). Benefits Readily used by many smaller species (e.g., fisher, marten, raccoon, and smaller); provides a high-resolution print that makes identification of species likely; print can be collected, reviewed later, and stored indefinitely; ability to incorporate hair collection devices; protected from some weather; low up-front cost. Constraints Unable to deploy at locations with running water; limited to small species; can only be deployed in very small structures unless used with bait or scent lures. Estimated Cost Low up-front cost (but labor cost during surveys); $200 for materials; $800 for one month of monitoring (six days of work per month @ $16/hr). Applications
• Assess use/effectiveness of smaller wildlife crossing structures (existing and proposed)
• Monitor wildlife use of locations throughout and adjacent to the project area (used in conjunction with a bait or scent lure).
Hair Collection Devices with DNA Methods Various hair collection devices are available and selection typically depends on species of interest and specific objectives. Most hair collection at crossing structures is conducted via two barbed-wire strands stretched across the mouth of the structure at heights appropriate for the target species of interest (Exhibit 12-4)
Washington State Department of Transportation Page 12-6
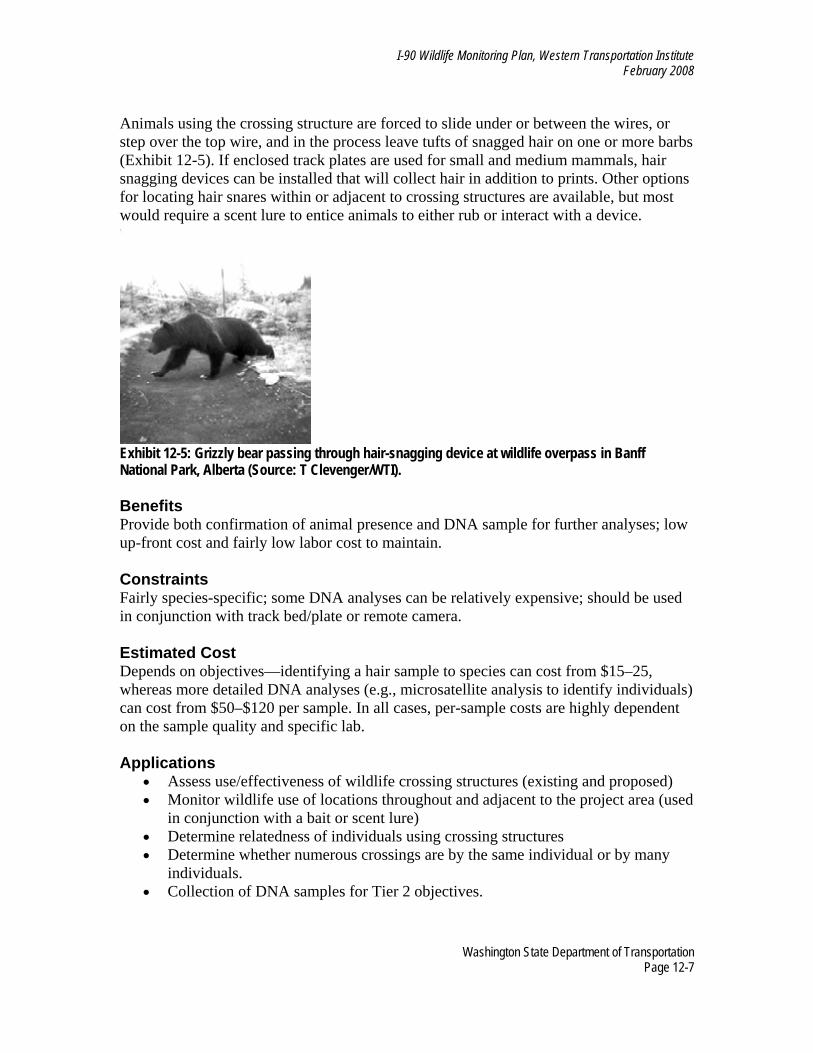
I-90 Wildlife Monitoring Plan, Western Transportation Institute February 2008
Animals using the crossing structure are forced to slide under or between the wires, or step over the top wire, and in the process leave tufts of snagged hair on one or more barbs (Exhibit 12-5). If enclosed track plates are used for small and medium mammals, hair snagging devices can be installed that will collect hair in addition to prints. Other options for locating hair snares within or adjacent to crossing structures are available, but most would require a scent lure to entice animals to either rub or interact with a device.
Exhibit 12-5: Grizzly bear passing through hair-snagging device at wildlife overpass in Banff National Park, Alberta (Source: T Clevenger/WTI). Benefits Provide both confirmation of animal presence and DNA sample for further analyses; low up-front cost and fairly low labor cost to maintain. Constraints Fairly species-specific; some DNA analyses can be relatively expensive; should be used in conjunction with track bed/plate or remote camera. Estimated Cost Depends on objectives—identifying a hair sample to species can cost from $15–25, whereas more detailed DNA analyses (e.g., microsatellite analysis to identify individuals) can cost from $50–$120 per sample. In all cases, per-sample costs are highly dependent on the sample quality and specific lab. Applications
• Assess use/effectiveness of wildlife crossing structures (existing and proposed) • Monitor wildlife use of locations throughout and adjacent to the project area (used
in conjunction with a bait or scent lure) • Determine relatedness of individuals using crossing structures • Determine whether numerous crossings are by the same individual or by many
individuals. • Collection of DNA samples for Tier 2 objectives.
Washington State Department of Transportation Page 12-7
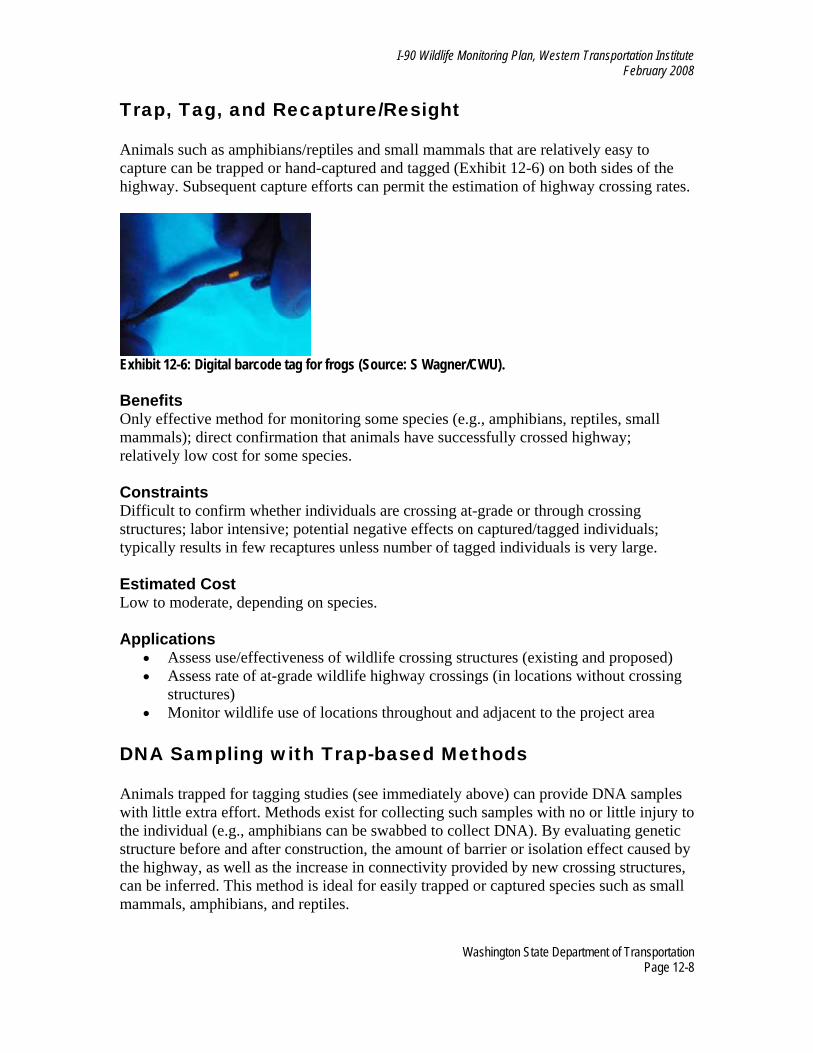
I-90 Wildlife Monitoring Plan, Western Transportation Institute February 2008
Trap, Tag, and Recapture/Resight Animals such as amphibians/reptiles and small mammals that are relatively easy to capture can be trapped or hand-captured and tagged (Exhibit 12-6) on both sides of the highway. Subsequent capture efforts can permit the estimation of highway crossing rates.
Exhibit 12-6: Digital barcode tag for frogs (Source: S Wagner/CWU). Benefits Only effective method for monitoring some species (e.g., amphibians, reptiles, small mammals); direct confirmation that animals have successfully crossed highway; relatively low cost for some species. Constraints Difficult to confirm whether individuals are crossing at-grade or through crossing structures; labor intensive; potential negative effects on captured/tagged individuals; typically results in few recaptures unless number of tagged individuals is very large. Estimated Cost Low to moderate, depending on species. Applications
• Assess use/effectiveness of wildlife crossing structures (existing and proposed) • Assess rate of at-grade wildlife highway crossings (in locations without crossing
structures) • Monitor wildlife use of locations throughout and adjacent to the project area
DNA Sampling with Trap-based Methods Animals trapped for tagging studies (see immediately above) can provide DNA samples with little extra effort. Methods exist for collecting such samples with no or little injury to the individual (e.g., amphibians can be swabbed to collect DNA). By evaluating genetic structure before and after construction, the amount of barrier or isolation effect caused by the highway, as well as the increase in connectivity provided by new crossing structures, can be inferred. This method is ideal for easily trapped or captured species such as small mammals, amphibians, and reptiles.
Washington State Department of Transportation Page 12-8
I-90 Wildlife Monitoring Plan, Western Transportation Institute February 2008
Benefits Provides instantaneous method for assessing whether gene flow exists across barriers, as well as the extent to which new connectivity measures increase gene flow; low up-front cost and fairly low labor cost. Constraints Fairly species-specific; some DNA analyses can be relatively expensive; may take long periods of time for the positive effects of increasing connectivity to be detected, especially with low-mobility species. Estimated Cost Detailed DNA analyses (e.g., microsatellite analysis to identify individuals) can cost from $50–$120 per sample. In all cases, per-sample costs are highly dependent on the sample quality and specific lab. Applications
• Assess use/effectiveness of wildlife crossing structures (existing and proposed) • Collection of DNA samples for Tier 2 objectives.
Snow Track Transects Snow tracking can be used to detect species that are active during winter. Snow tracking can be conducted while driving the road, traveling off-road parallel to and at close distances (e.g., within 150 ft) from the roadside, or on secondary roads or off-road transects away from the road. Benefits Fairly high effectiveness for detecting some species; easily tailored for use in many locations; low cost. Constraints Limited to locations with consistent snowfall; short time window to conduct surveys after each snowfall; difficult to schedule surveys; can be labor-intensive to collect substantial amounts of data during relatively few snowfalls (i.e., many personnel may be required to cover multiple transects within a short timeframe); difficult to confirm species unless track and snow conditions are ideal; tracks cannot easily be collected and reviewed later; traffic safety concerns when conducting road surveys; Estimated Cost Low to moderate; limited to cost of labor, one-time purchase of skis/snowshoes, and winter safety and avalanche training.
Washington State Department of Transportation Page 12-9

I-90 Wildlife Monitoring Plan, Western Transportation Institute February 2008
Applications
• Assess use/effectiveness of wildlife crossing structures (existing and proposed) • Assess rate of at-grade wildlife highway crossings • Monitor wildlife use of locations throughout and adjacent to the project area (used
in conjunction with a bait or scent lure) Scat Detection Dogs with DNA Methods Professionally trained dogs can now be used to effectively and efficiently locate scats from target species. A single dog, working with a handler and an “orienteer,” typically searches a predefined transect or grid (Exhibit 12-7). Located scats are collected for DNA analysis.
Exhibit 12-7: Scat-detection dog working to locate scat (Source: R Long/WTI). Benefits High degree of effectiveness and cost efficiency (i.e., cost per detection); does not require site preparation before survey; can be easily tailored to specific locations and can quickly adapt to changes in protocol; can be used in most conditions and on most types of topography; provides scat sample for multiple analyses (e.g., species and individual identification, diet, hormone analysis). Constraints High initial cost; substantial logistical issues; each dog limited to detecting a fairly discrete number of target species; in most cases requires DNA confirmation, or at least some DNA testing.
Washington State Department of Transportation Page 12-10
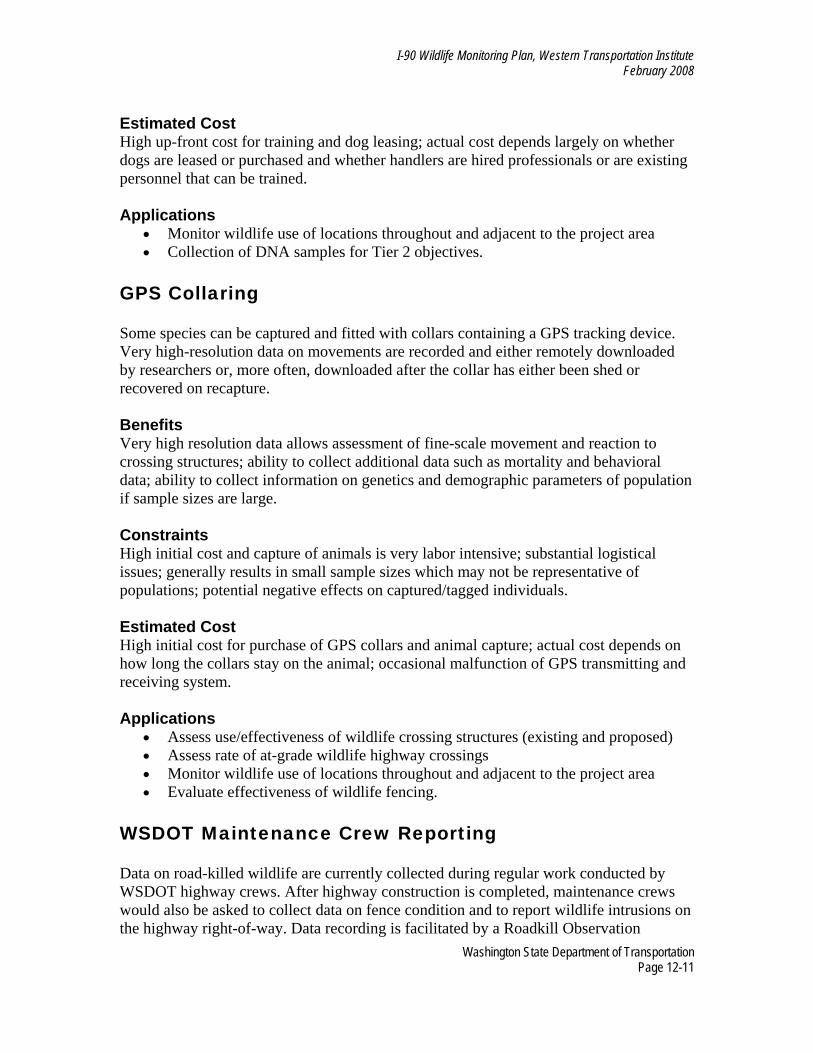
I-90 Wildlife Monitoring Plan, Western Transportation Institute February 2008
Estimated Cost High up-front cost for training and dog leasing; actual cost depends largely on whether dogs are leased or purchased and whether handlers are hired professionals or are existing personnel that can be trained. Applications
• Monitor wildlife use of locations throughout and adjacent to the project area • Collection of DNA samples for Tier 2 objectives.
GPS Collaring Some species can be captured and fitted with collars containing a GPS tracking device. Very high-resolution data on movements are recorded and either remotely downloaded by researchers or, more often, downloaded after the collar has either been shed or recovered on recapture. Benefits Very high resolution data allows assessment of fine-scale movement and reaction to crossing structures; ability to collect additional data such as mortality and behavioral data; ability to collect information on genetics and demographic parameters of population if sample sizes are large. Constraints High initial cost and capture of animals is very labor intensive; substantial logistical issues; generally results in small sample sizes which may not be representative of populations; potential negative effects on captured/tagged individuals. Estimated Cost High initial cost for purchase of GPS collars and animal capture; actual cost depends on how long the collars stay on the animal; occasional malfunction of GPS transmitting and receiving system. Applications
• Assess use/effectiveness of wildlife crossing structures (existing and proposed) • Assess rate of at-grade wildlife highway crossings • Monitor wildlife use of locations throughout and adjacent to the project area • Evaluate effectiveness of wildlife fencing.
WSDOT Maintenance Crew Reporting Data on road-killed wildlife are currently collected during regular work conducted by WSDOT highway crews. After highway construction is completed, maintenance crews would also be asked to collect data on fence condition and to report wildlife intrusions on the highway right-of-way. Data recording is facilitated by a Roadkill Observation
Washington State Department of Transportation Page 12-11
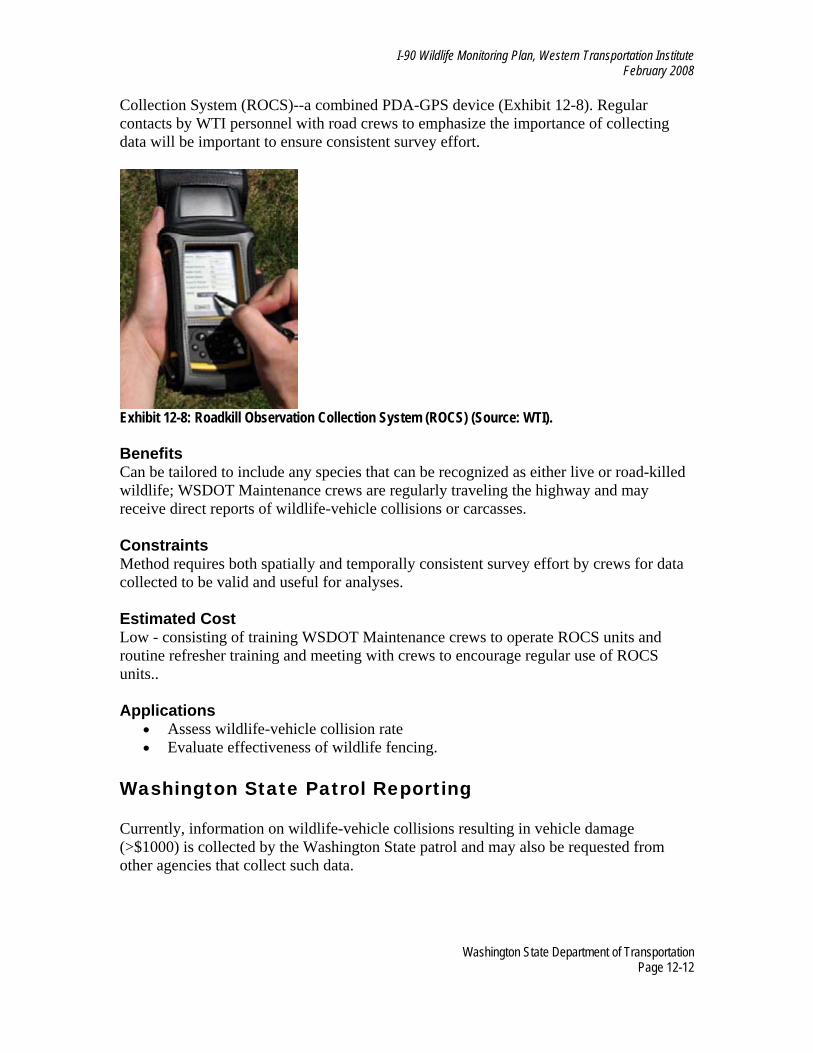
I-90 Wildlife Monitoring Plan, Western Transportation Institute February 2008
Collection System (ROCS)--a combined PDA-GPS device (Exhibit 12-8). Regular contacts by WTI personnel with road crews to emphasize the importance of collecting data will be important to ensure consistent survey effort.
Exhibit 12-8: Roadkill Observation Collection System (ROCS) (Source: WTI). Benefits Can be tailored to include any species that can be recognized as either live or road-killed wildlife; WSDOT Maintenance crews are regularly traveling the highway and may receive direct reports of wildlife-vehicle collisions or carcasses. Constraints Method requires both spatially and temporally consistent survey effort by crews for data collected to be valid and useful for analyses. Estimated Cost Low - consisting of training WSDOT Maintenance crews to operate ROCS units and routine refresher training and meeting with crews to encourage regular use of ROCS units.. Applications
• Assess wildlife-vehicle collision rate • Evaluate effectiveness of wildlife fencing.
Washington State Patrol Reporting Currently, information on wildlife-vehicle collisions resulting in vehicle damage (>$1000) is collected by the Washington State patrol and may also be requested from other agencies that collect such data.
Washington State Department of Transportation Page 12-12
I-90 Wildlife Monitoring Plan, Western Transportation Institute February 2008
Washington State Department of Transportation Page 12-13
Benefits Effort is consistent and will likely remain so into the future; cost is relatively minimal; species monitored are limited; can be cross-referenced with WSDOT maintenance crew reports and WTI personnel. Constraints Mortality data are limited to collisions with > $1000 in property damage (generally elk and deer). Estimated Cost Negligible. Applications
• Assess wildlife-vehicle collision rate • Evaluate effectiveness of wildlife fencing
WTI Personnel Road-Kill and Fence Integrity Surveys WTI personnel can collect information on wildlife-vehicle collisions during systematic drives through the project area (e.g., every 1-7 days). Fencing can be visually examined during regular course of work and field-examined twice per year by WSDOT maintenance crews and/or WTI personnel. Benefits Provides spatially and temporally consistent effort that can be closely controlled; all species coyote-size and larger can be monitored. Constraints Relatively high rate of survey (e.g., daily or minimally twice per week) may be required to locate carcasses, especially of small animals; does not detect instances when animals are injured and die undetected at a later time, or where carcasses leave the roadway and are not seen; single drive through may provide little chance of detecting carcasses; limited number and distribution of safe-stopping locations may make carcass identification impossible; slow required driving speeds often unsafe. Estimated Cost Low during seasons when other survey work is being conducted; moderate at other times. Applications
• Assess wildlife-vehicle collision rate • Evaluate effectiveness of wildlife fencing
I-90 Wildlife Monitoring Plan, Western Transportation Institute February 2008
13. List of PreparersThe Western Transportation Institute (WTI) is the nation’s largest transportation institute focusing on rural transportation issues and is designated as a U.S. Department of Transportation University Transportation Center. The Institute was established in 1994 by the Montana and California Departments of Transportation, in cooperation with Montana State University – Bozeman. The following authors are members of WTI’s Road Ecology Program. Anthony (Tony) Clevenger, Ph.D., Wildlife Ecology, is a Senior Wildlife Research Scientist specializing in identifying factors influencing wildlife crossing performance and analyzing factors contributing to wildlife-vehicle collisions. He is a member of the U.S. National Academy of Sciences Committee on Effects of Highways on Natural Communities and Ecosystems and has published over 40 articles in peer-reviewed scientific journals and co-authored three books including, Road Ecology: Science and Solutions (Island Press, 2003). Robert Long, Ph.D., Natural Resources, is a Research Ecologist with over 16 years of experience studying a variety of wildlife species. His research interests include carnivore ecology and conservation, landscape permeability for wildlife, and wildlife monitoring and survey design. Dr. Long currently coordinates wildlife monitoring efforts for WTI in the central Cascades of Washington, where he also holds an adjunct faculty position in the Biology Department at Central Washington University. Rob Ament, M.Sc., Biological Sciences, is the Road Ecology Program Manager. He has more than 25 years of experience in field research, natural resource management, environmental policy, and organizational development. He oversees over 20 active WTI road ecology research projects throughout North America. Rob currently serves on five different international, national and regional expert panels or boards.
Washington State Department of Transportation Page 13-1