Embed Size (px)
Citation preview

The INL is a U.S. Department of Energy National Laboratory operated by Battelle Energy Alliance
INL/EXT-09-16961
HYTEST Phase 1 Facility Commissioning and Modeling
Lee P. Shunn Richard D. Boardman Shane J. Cherry Craig G. Rieger
September 2009

INL/EXT-09-16961
HYTEST Phase I Facility Commissioning and Modeling
LDRD EI-112 First Year Annual Report: Measurement of Kinetic Behavior in a Coupled Reactor System
LDRD IC-107 First Year Annual Report: Integrated Control System Data Fusion
Lee P. Shunn Richard D. Boardman
Shane J. Cherry Craig G. Rieger
September 2009
Idaho National Laboratory Idaho Falls, Idaho 83415
http://www.inl.gov
Prepared for the U.S. Department of Energy Office of Nuclear Energy
Under DOE Idaho Operations Office Contract DE-AC07-05ID14517

DISCLAIMER
This information was prepared as an account of work sponsored by an agency of the U.S. Government. Neither the U.S. Government nor any agency thereof, nor any of their employees, makes any warranty, expressed or implied, or assumes any legal liability or responsibility for the accuracy, completeness, or usefulness, of any information, apparatus, product, or process disclosed, or represents that its use would not infringe privately owned rights. References herein to any specific commercial product, process, or service by trade name, trade mark, manufacturer, or otherwise, does not necessarily constitute or imply its endorsement, recommendation, or favoring by the U.S. Government or any agency thereof. The views and opinions of authors expressed herein do not necessarily state or reflect those of the U.S. Government or any agency thereof.

iii
This page intentionally left blank.
iv
Acknowledgments
This work is supported by the Idaho National Laboratory (INL) under the Laboratory Directed Research and Development (LDRD) Program. This LDRD activity used hydrogen that was produced by a separate high-temperature steam electrolysis experiment supported by the U.S. Department of Energy’s Nuclear Hydrogen Initiative. As part of this collaboration, hydrogen produced during 2500 hours of continuous operation of a solid oxide electrolysis cell was supplied as a feed stream to the experimental setup established under this LDRD project. The integration of these two experiments to establish a “hybrid” energy system is considered to be part of the current effort; however, the testing activities and publication of data from the electrolysis demonstration is not published in this report, and should not be credited to this activity. The PIs wish to acknowledge the assistance of the following contributors: Tony Watson, Research Technician Lisa Moore-McAteer, Research Technician Kevin DeWall, Laboratory Instruction Procedures Keith Condie, Mechanical Design Engineer Colvin Jergins, HYTEST Facility Project Manager John Heintzelman, GC method development and operations Carl Stoots, High-temperature Steam Electrolysis PI & Interface

v
This page intentionally left blank

HYTEST Phase I Facility Commissioning and Modeling INL-EXT-09-16961 September 2009
1
Executive Summary The purpose of this document is to report the first year accomplishments of two coordinated Laboratory Directed Research and Development (LDRD) projects at the Idaho National Laboratory (INL). Efforts within these two projects leverage a new laboratory facility that has been constructed for testing hybrid energy systems that are composed of tightly-coupled chemical processes. This work is the first phase in a series of hybrid energy research and testing stations that are planned for construction and operation at the INL (see Boardman & Aumeier, 2009). These testing stations are referred to hereafter as HYTEST facilities. The HYTEST Phase I facility discussed in this report was set up and commissioned in Bay 9 of the Bonneville County Technology Center (BCTC). The purpose of this facility is to utilize hydrogen that is produced by high-temperature steam electrolysis (HTSE) test reactors operating in Bay 9 (Herring et al. 2007) to produce useful synthetic fuels. The HYTEST experiment is designed to support the investigation of kinetic phenomena and transient responses among integrated reactor components. This facility provides a convenient scale for conducting scoping tests of new reaction concepts, materials performance, instrumentation, process monitoring and control, and data collection and management. To accomplish these objectives, a coupled system of chemical reactors was assembled and instrumented inside a ventilated enclosure in Bay 9. The reactor module was equipped with a hydrogen pump and receiver tank in order to collect high-quality hydrogen from the HTSE reactor, and deliver it to the HYTEST reactor system. Finally, a series of tests was conducted to demonstrate integrated operation of the HYTEST system with the HTSE reactors.
This work is the result of a collaboration between two LDRD projects. The goal of the first project, funded through the INL Energy Security Initiative (ESI), is to use real-time data from reactor operations to perform online sensitivity analysis and mechanism/model reduction in chemically reactive systems. The aforementioned HYTEST Phase I facility was largely constructed under the direction of this project, and process measurements from the reactor system were used to validate the initial models of the system. The project is planned to continue for two more years. During this first year, substitute natural gas (SNG) was synthesized using hydrogen from the INL HTSE experiment. In subsequent years, hybrid liquid synfuels, such as methanol and synthetic diesel, will be produced. Transient reactor models were developed for a

HYTEST Phase I Facility Commissioning and Modeling INL-EXT-09-16961 September 2009
2
methanation reactor, a steam-methane-reforming reactor, and a CO2-separation membrane reactor. Data collected from the HYTEST system was used to evaluate the performance of these transient reactor models.
A separate three-year LDRD project, funded by the INL Instruments and Controls Intelligent Systems (ICIS) signature, coordinated closely with the HYTEST effort. The purpose of the ICIS project is to develop and demonstrate real-time data fusion, an emerging field focused on evaluating multiple data feeds for the purpose of data reduction, qualification, comparison, and assessment. The end goal of data fusion is improved state assessment and awareness. As part of this effort, a temporal model for the coupled reactor system was developed from the models for each of the individual reactors and system components. A common goal of these two LDRD projects is to advance process monitoring and develop adaptive tools that effectively utilize real-time data to control, operate, and secure highly-coupled systems with complex dynamics. Following the set up and commissioning of the HYTEST Phase I facility, over 60 hours of integrated reactor tests were completed. During this period:
• All hydrogen was supplied from the HTSE reactors. The flow rate of HTSE products was approximately 1400 cm3 per minute, with a composition of approximately 45 vol.% H2 and 55 vol.% N2. No significant impurities were detected.
• Parametric testing of a methanation reactor was completed to monitoring the transition time necessary to achieve steady-state operation for various inlet compositions, moisture levels, gas pre-heat temperatures, reactor temperatures, and reactor space velocities.
• Parametric testing of a steam-methane-reforming (reverse-shift) catalytic reactor was completed to determine the shifted-gas equilibrium, quasi-equilibrium, or non-equilibrium compositions as a function of temperature and space velocity.
• Parametric testing of a CO2 separation membrane was performed, where the concentrated permeate was mixed with H2 from the HTSE reactor, and reverse-shifted.
Valuable lessons were learned during the HYTEST operations. In particular, a reversible catalyst deactivation was observed as a result of condensable carbon produced in the synfuels reactor’s pre-heater furnace. After coke had formed on the bed, regeneration of the catalyst was possible. However, the time required to attain steady state is on the order of hours, and the catalyst was not returned to its initial activity. The hydrogen produced by HTSE was essentially pure hydrogen, diluted only with sweep nitrogen. No observable nickel catalyst deactivation was observed over an initial break-in and testing period of 40 hours. Methanation tests were carried out at temperatures ranging from 275°C to 325°C and 5 to 25 psig. In general, the fractional conversion of CO to CH4 was greater at higher pressures and lower temperatures. This is consistent with Le Chatelier’s principle for the exothermic methanation reaction where the total number of moles decreases with the extent of reaction. Likewise, the addition of H2O to the inlet flow suppresses the formation of methane. The time to reach steady state depended weakly on the inlet conditions, and was typically about 20 minutes. These results generally agree with the predictions from the reactor model, however, the model tended to predict much faster responses than were measured in the experment. Understanding, measuring, and predicting process dynamics for interdependent reactors in hybrid synfuels production systems is one of the technical challenges of this work.

HYTEST Phase I Facility Commissioning and Modeling INL-EXT-09-16961 September 2009
3
Gas measurements taken with a four-channel micro-GC provided a complete gas speciation and were useful for the present effort. Improved results could be obtained by using a continuous composition monitor to collect higher-frequency measurements and accurately investigate system transients. Carbon dioxide was separated from a simulated flue gas stack (approximately 15% CO2 in nitrogen) using a nitrogen purification membrane. The experimental data generally matched theoretical predictions. The separated CO2 was diverted to the shift reactor, where it was reverse-shifted to carbon monoxide (CO) using hydrogen supplied by HTSE. The resulting CO-H2 syngas mixture could potentially be fed to a synfuels reactor. Attempts to perform reverse CO2 shift with hydrogen in a tubular reactor were partially successful. Unfortunately, a small, but significant amount of CO2 was converted to condensed carbon (or coke) on the surfaces of the indirectly heated tube. This carbon buildup contributed to problematic catalyst coking. The scoping tests completed in FY-09 will be followed with parametric testing in FY-10. In summary, the HYTEST experiments completed during FY-09 demonstrated the capability to integrate and operate a hybrid energy system to produce synthetic fuels using clean hydrogen technologies. Data that was collected during operations was used to investigate transient phenomena and system dynamics. All of the equipment functioned as designed, excepting surface corrosion that was observed in the high-temperature steam-reforming reactor. This suggests the need for future testing of high-temperature materials for chemical reactors. The Phase I HYTEST facility constructed for this project could be used for such investigations. A larger component testing facility (HYTEST Phase II) is being prepared for deployment and operation at the INL Engineering Development Facility (IEDF). Equipment set up and operations of this facility are planned to begin in FY-2010. Related to this effort, a new monitoring and control system has been constructed overlooking four 800 sq-ft bays in IEDF. A 10-ton crane will service all four bays. The two bays at opposite ends of the facility have structured-steel mezzanines with steel floor grating. This will support erection of tall reactor scaffolding and multi-level test setups. A major oil company has donated several equipment items to the INL, including a 40-ft slurry bubble column reactor, a tail gas flare, hydrogen and syngas compressors, and a gas chromatograph analyzer. This reactor will be set up in FY-10 to support Phase II HYTEST activities. Finally, the HYTEST Phase I and Phase II operations are poised to support technology development roadmaps being completed by a separate hybrid energy study investigating expanded uses of high-temperature gas-cooled reactors (HTGR). This report addresses practical integration options of the Next Generation Nuclear Plant (NGNP) and will lay a roadmap for technology development, technology integration and testing needs (see Nelson, 2009).

HYTEST Phase I Facility Commissioning and Modeling INL-EXT-09-16961 September 2009
4
CONTENTS ACKNOWLEDGMENTS..............................................................................................................IV EXECUTIVE SUMMARY.............................................................................................................. 1 ACRONYMS AND NOMENCLATURE ........................................................................................ 4 1. INTRODUCTION ................................................................................................................... 8
1.1 PURPOSE & SCOPE OF LDRD ACTIVITIES ........................................................................... 8 1.2 THEORY............................................................................................................................. 9 1.3 REACTION MECHANISMS & HEAT BALANCE ....................................................................... 10
1.3.1 Methanation reactor.................................................................................................. 10 1.3.2 Shift reactor .............................................................................................................. 12 1.3.3 Steam reforming reactor........................................................................................... 13 1.3.4 High-temperature Steam Electrolysis ....................................................................... 14
1.4 HYTEST PHASE I PLATFORM ........................................................................................... 15 2. FY-2009 LDRD ACCOMPLISHMENTS .............................................................................. 17
2.1 ADAPTIVE KINETICS MODELING ACCOMPLISHMENTS.......................................................... 17 2.1.1 Model Development.................................................................................................. 17 2.1.2 Experimental (HYTEST) Setup................................................................................. 18 2.1.3 Experimental (HYTEST) Operations ........................................................................ 19
2.2 INTEGRATED CONTROL SYSTEM DATA FUSION.................................................................. 19 2.2.1 Data Fusion Framework Development ..................................................................... 19
3. HYTEST EXPERIMENTAL SETUP AND TESTS ............................................................... 20 3.1 FACILITY DESCRIPTION..................................................................................................... 20 3.2 EXPERIMENTAL APPROACH AND PROCEDURES.................................................................. 34 3.3 COMMISSIONING TESTS.................................................................................................... 35 3.4 COMPUTATIONAL MODEL .................................................................................................. 38
3.4.1 Governing equations ................................................................................................ 38 3.4.2 Transport properties ................................................................................................. 38 3.4.3 Gas thermochemistry ............................................................................................... 39 3.4.4 Computational algorithm........................................................................................... 40 3.4.5 Catalytic packed bed model ..................................................................................... 41 3.4.6 Membrane model...................................................................................................... 43
3.5 EXPERIMENTAL RESULTS & MODEL COMPARISONS ........................................................... 45 3.5.1 Methanation Reactor ................................................................................................ 45 3.5.2 CO2 Separation Membane........................................................................................ 50 3.5.3 Reverse-Shift Reactor .............................................................................................. 53
3.6 FURTHER OBSERVATIONS AND DISCUSSION...................................................................... 55 4. DATA FUSION .................................................................................................................... 55 5. LDRD PLANS AND RECOMMENDATIONS ...................................................................... 56
5.1 DATA FUSION PLANS AND INTERFACE ............................................................................... 56 5.2 FUTURE POSSIBLE TESTING CAPABILITY ........................................................................... 57
6. CONCLUSIONS .................................................................................................................. 57 7. REFERENCES .................................................................................................................... 58

HYTEST Phase I Facility Commissioning and Modeling INL-EXT-09-16961 September 2009
5
FIGURES Figure 1.1 Methanation equilibrium as a function of temperature at 2.0 bar – moist inlet.
Inlet composition: 5.0 kmol H2, 1.667 kmol CO, 3.333 kmol H2O, 90 kmol N2. ........... 10 Figure 1.2 Methanation equilibrium as a function of pressure at 350°°C – moist inlet.
Inlet composition: 5.0 kmol H2, 1.667 kmol CO, 3.333 kmol H2O, 90 kmol N2. ........... 11 Figure 1.3 Methanation equilibrium as a function of temperature at 2.0 bar – dry inlet.
Inlet composition: 5.0 kmol H2, 1.667 kmol CO, 0.0 kmol H2O, 90 kmol N2. ............... 11 Figure 1.4 Shift reaction equilibrium as a function of temperature at 2.0 bar – moist inlet
stream. Inlet composition: 5.0 kmol H2, 5.0 kmol CO2, 90 kmol N2. ............................ 13 Figure 1.5 Steam-methane-reforming equilibrium as a function of temperature at 2.0 bar.
Inlet composition: 1.25 kmol CH4, 2.5 kmol H2O, 97.5 kmol N2. ................................. 14 Figure 1.6 Cross-section of a planar high-temperature electrolysis stack (from O’Brien,
2008). ........................................................................................................................... 15 Figure 1.7 General coupled reactor block flow diagram. ............................................................ 17 Figure 3.1 LDRD HYTEST Phase I process equipment schematic............................................ 21 Figure 3.2 HYTEST Phase I reactor system process components ............................................ 23 Figure 3.3 Schematic of a tube-feed, hollow-fiber membrane module. ...................................... 43 Figure 3.4 Comparison of model prediction with experimental data of Haraya et al.
(1988) for H2/CO separation. • Experimental data, - - - Model prediction............... 44
Figure 3.5 Temperature and pressure history for methanation reactor on 09-Sep-2009. .......... 45 Figure 3.6 Steady-state spatial profiles of (top-to-bottom) temperature, velocity, and
species mass fractions in the synthetic fuels reactor. Treactor = 325°C, Pinlet = 23.7 psig....................................................................................................................... 47
Figure 3.7 Transient evolution of spatial temperature profiles in the synthetic fuels reactor. Treactor = 325°C, Pinlet = 23.7 psig. ................................................................. 47
Figure 3.8 Transient species concentrations at the exit of the synthetic fuels reactor. Treactor = 325°C, Pinlet = 23.7 psig. • Experimental data, - - - Model prediction. ......... 49
Figure 3.9 Transient species concentrations at the exit of the synthetic fuels reactor. Treactor = 325°C, Pinlet = 6.5 psig..................................................................................... 49
Figure 3.10 Transient species concentrations at the exit of the synthetic fuels reactor (zoom to show initial transient behavior). Treactor = 325°C, Pinlet = 23.7 psig. ................ 50
Figure 3.11 Comparison of experimental data and model prediction of retentate pressure for CO2/N2 separation. Maximum error: 6.1%, average error: 2.4%. ........................... 51
Figure 3.12 Comparison of experimental data and model prediction of permeate mole fraction for CO2/N2 membrane separation.................................................................... 52
Figure 3.13 Comparison of measured data with water-gas shift equilibrium conditions. (temperature increasing with time)............................................................................... 54

HYTEST Phase I Facility Commissioning and Modeling INL-EXT-09-16961 September 2009
6
Figure 3.14 Comparison of measured data with water-gas shift equilibrium conditions. (temperature increasing with time)............................................................................... 54
TABLES Table 1.1 Energy Balance for Methanation Reaction 12 Table 3.1 HYTEST Phase I Equipment Specifications 28 Table 3.2 Compressed Gases by Cylinder, Composition, and Pressures 34 Table 3.3 Test Commissioning Activities 36 Table 3.4 Methanation test conditions and outlet methane concentration 46 Table 3.5 Membrane test conditions and outlet carbon dioxide concentration 50 Table 3.6 Membrane model results and predictions 53

HYTEST Phase I Facility Commissioning and Modeling INL-EXT-09-16961 September 2009
7
Acronyms and Nomenclature
BCTC Bonneville County Technology Center
F-T Fischer-Tropsch (synfuels)
HTSE high-temperature steam electrolysis
HTGR high-temperature gas-cooled reactor
GHSV gas hourly space velocity
IEDF INL Engineering Development Facility
IHX intermediate heat exchanger
INL Idaho National Laboratory
LPG liquefied petroleum gas
MWth megawatts thermal
MWe megawatts electrical
NGNP Next Generation Nuclear Plant
psig pressure in pounds per square inch - gauge
PHTS primary heat transport system
scfm standard cubic feet per minute
slpm standard liter per minute
SNG substitute natural gas
SOEC solid-oxide electrolysis cell
SOFC solid-oxide fuel cells
SV Space Velocity

8
1. INTRODUCTION The purpose of the INL Energy Security Initiative is to establish, coordinate, and develop activities at the INL and with federal, state, university, and industry partners to help achieve energy security for the United States. INL defines energy security as simultaneous attainment of economic stability, environmental sustainability, and resource security. These goals can only be achieved by understanding the characteristics of integrated energy system where individual plant dynamics may be impacted by transient conditions in the system. On a plant level, the transient behavior of highly-coupled reactors must be managed with resilient process monitoring and control systems that are capable of performing rapid reactor state assessments and projecting process trends and stability conditions. Future hybrid energy systems will leverage emerging technologies that exploit novel product chemistries, reactor designs, heat transfer devices, corrosion-resistant materials, control instrumentation, inferential process monitors, and data management systems. A hybrid energy laboratory facility (HYTEST Phase I) was designed and constructed for the purpose of performing scoping studies of individual hybrid energy system components and component integration. This setup provides a useful, bench-scale platform for conducting cost-effective investigations of reaction kinetics; heat transfer concepts; materials performance; and monitoring, control, and data management techniques. Data from the facility are useful for model development and validation. Finally, bench-scale operation of the HYTEST Phase I facility can help establish system operating requirements and control logic for larger testing platforms and eventual commercial applications.
1.1 Purpose & Scope of LDRD Activities
A three-year LDRD project (Shunn and Boardman, 2009) was initiated by the INL ESI to develop a new approach for parameter estimation and adaptive modeling for state assessment, system prognostics, and automatic control of interdependent chemical processes. In this approach, real-time data from a chemical process is used to deduce intrinsic reaction rate mechanisms and transport coefficients. Key model parameters in the governing conservation equations are then dynamically updated and used to numerically predict process behavior. Model predictions are used to inform automatic control systems to stably operate chemical systems with highly-coupled, interdependent components. The INL Instruments and Control Intelligent Systems (ICIS) signature addresses the grand challenge of developing effective and secure monitoring and control systems for U.S. energy plants and critical energy and communications infrastructures. Data measurements and management are key to developing resilient process control systems and for performing active state assessments. The advent of new monitoring instruments technology capable of collecting and transmitting process conditions must be coupled with techniques that can process large volumes of process signals. Integrated control systems for highly-coupled reactors necessitate data “fusion” techniques that can provide accurate information for the calibration of process models, and vice versa. A companion three-year LDRD addressing data fusion for integrated control systems was also initiated in FY-2009 (Cherry and Rieger, 2009). Research efforts are being coordinated between these joint LDRD activities. The kinetic models that are being developed by the ESI LDRD will form the basis of a dynamic simulation tool to predict transient process behavior. This simulation tool will be used to generate artificial

9
datasets to develop data fusion algorithms. Similarly, the data fusion techniques will be used to reduce actual experimental data to assess reactor operating conditions and to validate reactor models (or as this work proposes, to adapt model parameters to reconcile observed outputs with model predictions). The purpose of the current testing is to investigate technical aspects of an integrated process that uses hydrogen generated by high-temperature steam electrolysis (powered by heat and electricity from a flameless source such as a nuclear reactor) to convert CO2 and light gases into CO and H2 (syngas). The syngas is then fed to a synthetic fuels reactor to produce a high-value product. By-product CO2 and minor hydrocarbon compounds can be recycled until nearly all of the carbon is incorporated into the desired chemical or fuel product, providing a low-carbon-emitting process.
1.2 Theory Hydrocarbon fuels such as biomass and coal can be gasified and catalytically converted into chemicals and fuels. Conventional gasification generates the heat necessary to promote partially oxidization of the fuel. Additional hydrogen must be added and to attain the chemical stoichiometry of each specific chemical/fuels synthesis reaction. For example, diesel-range fuels can be produced by catalytic Fischer-Tropsch (F-T) chain-grown reactions that require four atoms of hydrogen for each carbon atom:
nCO + (2n+1)H2 � CnH2n+2 + n(H2O),
where n can vary from 1 to over 50 according to the chain-growth characteristics of the reaction. By far, the most common practice in industry is to supply the necessary hydrogen by reforming methane (CH4) or by shifting CO via the water-gas shift reaction.
CO + H2O � CO2 + H2 shift reaction CH4 + H2O � CO + 3H2 reforming reaction
The former produces by-product CO2 that is typically emitted and not incorporated into the chemical or fuel product. The latter requires heat, which is produced by partially burning a fuel source. This investigation will help develop an understanding of reaction trends, energy requirements, system stability, and process monitoring and control needs of similar hybrid systems with the following attributes:
• Production of synthetic fuels, including substitute natural gas, alcohols, diesel, and chemical compounds
• Generation of “carbon-free” hydrogen by high-temperature steam electrolysis (HTSE) to avoid methane reforming and water-gas shifting
• Capture of CO2 from a simulated flue gas sources or the synthesis reactor gaseous effluent
• Separation and recycle of by-product light gases, including CO2, CH4, C2H4, C2H6, etc. • Reverse-shift of CO2 with clean hydrogen to produce CO reactant • Reforming light by-product gases with “carbon-free heat” to form H2 and CO reactants

10
1.3 Reaction Mechanisms & Heat Balance
1.3.1 Methanation reactor
Substitute natural gas (SNG) is produced by reacting syngas (comprised mainly of CO and H2) in a fixed-bed reactor over a 15-35 wt% Ni/Al2O3 catalyst at a reaction temperature of 300-400°C, by the following strongly exothermic reactions:
CO2 + 4H2 � CH4 + 2H2O �H = -165 kJ/mol @ 25°C
CO + 3H2 � CH4 + H2O �H = -206 kJ/mol @ 25°C
The reaction is generally carried out at pressures above 30 atm, and gas hourly space velocities (GHSV) of 6,000 – 10,000 hr -1.
Methanation is typically carried out at 30 atm and 300-350°C to avoid catalyst sintering and carbon deposition. Promoters such as MgO may be used to retard sintering of the active Ni crystallites. Water vapor is necessary to suppress coking in the reactor.
At atmospheric pressure, the conversion is incomplete as shown in the comparison of Figure 1.1– Figure 1.3. Higher pressures favor the products simply as a matter of Le Chatlier’s principal that the system will shift to reduce the pressure.
Figure 1.1 Methanation equilibrium as a function of temperature at 2.0 bar – moist inlet.
Inlet composition: 5.0 kmol H2, 1.667 kmol CO, 3.333 kmol H2O, 90 kmol N2.

11
Figure 1.2 Methanation equilibrium as a function of pressure at 350°C – moist inlet.
Inlet composition: 5.0 kmol H2, 1.667 kmol CO, 3.333 kmol H2O, 90 kmol N2.
Figure 1.3 Methanation equilibrium as a function of temperature at 2.0 bar – dry inlet.
Inlet composition: 5.0 kmol H2, 1.667 kmol CO, 0.0 kmol H2O, 90 kmol N2.

12
From these equilibrium calculations it is apparent that: 1) moisture may be necessary in the inlet stream to prevent coking of the catalyst for temperatures as low as 250°C, 2) methanation increases with a rise in pressure (and therefore is normally carried out at pressure upwards of 30 bar), and 3) methanation is favored at lower temperatures, but will not be carried out below 250°C to avoid the formation of toxic Ni(CO)4. The adiabatic heat balance is tabulated below for the target test conditions.
Table 1.1 Energy Balance for Methanation Reaction T inlet = 300 °°C. P inlet = 2.0 bar
Given these data, it is unlikely that heat generation from the exothermic methanation reactions will exceed the catalyst sintering temperature of approximately 400°C. Electric band heaters, heated tape, and insulation were used in the current experiment to minimize heat loss from the reactor and ensure that the gases remained above 250°C.
1.3.2 Shift reactor

13
The water-gas shift reaction is inherent in all gasification and gaseous reacting flows contain hydrocarbon species.
CO + H2O � H2 + CO2 �H = -41 kJ/mol @ 25°C
This slightly exothermic equilibrium reaction favors the reactants at high temperatures as shown in Figure 1.4. Above 600°C the reaction stoichiometry is exactly balanced with no formation ofCH4 or condensed carbon species. Higher operating temperatures favor the reactants, which is the objective of this test operation.
Figure 1.4 Shift reaction equilibrium as a function of temperature at 2.0 bar – moist inlet stream.
Inlet composition: 5.0 kmol H2, 5.0 kmol CO2, 90 kmol N2.
1.3.3 Steam reforming reactor
Steam-methane reforming is simply the reverse of the CO methanation reaction above:
H2O + CH4 � 3H2 + CO �H = +206 kJ/mol @ 25°C
In this direction, the reaction is endothermic and requires heat to dissociate the methane. Figure 1.5 shows this relationship relative to the inlet stream conditions indicated. A reactor temperature of at least 700°C will be targeted to completely reform the inlet CH4. In order to maintain the product H2 composition below 4 vol% the inlet molar volume of CH4 will be held under 1.25 vol%.

14
Figure 1.5 Steam-methane-reforming equilibrium as a function of temperature at 2.0 bar.
Inlet composition: 1.25 kmol CH4, 2.5 kmol H2O, 97.5 kmol N2.
1.3.4 High-temperature Steam Electrolysis Note: The following discussion is extracted from the indicated set of publications pertaining to set up and operation of the high-temperature steam electrolysis cells in BCTC Bay 9 supported by the National Hydrogen Initiative.
High-temperature steam electrolysis (HTSE) utilizes a combination of thermal energy and electricity to split water in solid-oxide electrolysis cells (SOECs). These cells are similar to solid-oxide fuel cells (SOFCs). The feasibility of operating solid-oxide cells at high temperature in the electrolysis mode has been demonstrated for both tubular (Maskalick, 1986) and planar systems (O’Brien et al. 2005, O’Brien et al. 2006).
From a chemical reaction standpoint, the steam-splitting process corresponds to the dissociation or reduction of steam:
H2O(g) � H2(g) + O2(g) �H = +242.6 kJ/mol @ 100°C
The SOEC used to produce hydrogen for the present LDRD is a solid-state electrochemical device consisting of an oxygen-ion-conducting electrolyte (e.g., yttria- or scandia-stabilized zirconia) with porous electrically conducting electrodes deposited on either side of the electrolyte (O’Brien, 2008). A cross-section of a planar design is shown in Figure 1.6. The design depicted in the figure shows an electrolyte-supported cell with a nickel cermet cathode and a perovskite anode such as strontium-doped lanthanum manganite. In an electrolyte-supported cell, the electrolyte layer is thicker than either of the anodes. The flow fields conduct electrical current through the stack and provide flow passages for the process gas streams. The

15
separator plate or bipolar plate separates the process gas streams. It must also be electrically conducting and is usually metallic, such as a ferritic stainless steel.
Figure 1.6 Cross-section of a planar high-temperature electrolysis stack (from O’Brien, 2008).
As shown in Figure 1.6, a mixture of steam and hydrogen at 750-950°C is supplied to the cathode side of the electrolyte (note that cathode and anode sides are opposite to their fuel-cell-mode roles). The half-cell electrochemical reactions occur at the triple-phase boundary near the electrode/electrolyte interface. Oxygen ions are drawn through the electrolyte by an applied electrochemical potential. The ions liberate their electrons and recombine to form molecular O2on the anode side. The inlet steam-hydrogen mixture composition may be as much as 90% steam, with the remainder hydrogen. Hydrogen is included in the inlet stream in order to maintain reducing conditions at the cathode. The exiting mixture may be as much as 90% H2. Product hydrogen and residual steam is passed through a condenser or membrane separator to purify the hydrogen.
The derivation of performance equations and a model for the operation of the SOEC wascompleted previously (O’Brien, 2005). The results of this activity will be combined with the models developed by the present work at a future point in this project.
1.4 HYTEST Phase I Platform
The HYTEST Phase I setup was constructed at the Bonneville County Technology Center (BCTC) adjacent to the Nuclear Hydrogen Initiative (NHI) laboratory setup for high-temperature steam electrolysis (HTSE). This HYTEST setup has been designed to couple the HTSE testing operations with the HYTEST reactor components in order to use hydrogen and oxygen

16
produced by ongoing HTSE testing. In this manner, the quality and dynamic production of hydrogen and oxygen can be investigated concurrently with HYTEST activities that address; 1) feedstock conversion, 2) energy integration, 3) energy storage and product synthesis, 4) by-product management (i.e. CO2 capture, recycle, and reduction to fuels and chemicals), and 5) system simulation and process monitoring and control.
The general HYTEST Phase I setup that was designed to support the joint LDRD activities is illustrated in Figure 1.7. This setup integrates four reactors: 1) a 10 cm x 10 cm x 10 cell HTSE stack, 2) an indirectly heated tubular reactor capable of being heated to 1200°C to perform steam-methane reforming and reverse-shifting of CO2 with H2, 3) a high-pressure fixed-bed catalytic synthetic fuels reactor, and 4) a CO2-separation membrane reactor. The reactors are set up for integrated testing, including recycle of the streams necessary to attain high conversion efficiency and to investigate system dynamics and stability.
A HTSE reactor model, process monitoring, data collection and automatic control systems were previously established. A 2700-hour continuous test of the 10 cm x 10 cm x 10 cell HTSE stack was performed from May through September of 2009. The BCTC HYTEST setup checkout and startup testing began August 17 and concluded September 11, 2009 with the completion of more than 60 hours of integrated testing, wherein hydrogen from HTSE was used to produce substitute natural gas (SNG) using the methanation reactor.
In support of this effort, a Laboratory Instruction was developed and implemented to mitigate the risks associated with use of poisonous (CO) and flammable gases (CO, CH4, and H2). Several safety systems were included in the HYTEST module. Most importantly, automatic gas shutoff valves were installed to prevent the flow of reacting gases whenever reactor bed temperature were not maintained in a safe condition, or in case of any gas leaks. No hazardous conditions were encountered during the commissioning and operating tests for FY-2009. System startup and shutdown instructions were developed and used to ensure the accuracy of the tests and to help avoid any releases of gases or other unsafe conditions.

17
Figure 1.7 General coupled reactor block flow diagram.
2. FY-2009 LDRD ACCOMPLISHMENTS
2.1 Adaptive Kinetics Modeling Accomplishments
Funding for LDRD EI-112, Adaptive Process Modeling Using Parameter Estimation and Mechanism Sensitivity Analysis, was released at January 2009, leaving a total of 8 months to accomplish the following tasks:
2.1.1 Model Development
2.1.1.1. Literature review of synthetic fuel catalysis, steam-methane reforming, water-gas shift reaction and membrane separations to develop reactor models and design the experimental setup to support model validation.
2.1.1.2. Development of MATLAB-based transient models for mass transport and chemical reaction in each of the following reactors: synthetic fuels (methanation) reactor, steam-methane-reforming reactor, high-temperature water-gas-shift reactor.
�����
�����
������� ��
�����
���������
��������� ����������
����������������������
�� �!�
� �"�#$�
%���
�����&���
'�&�
�$�
�(�)��
����
� $�
��*���+���
���,�����
� $"#$�
%���
�����&���
'�&�
%���
�������"�
-�.(�&��/��
������
����
� �������� �
�� �
'��&(����*/�
'
�
������
��������������
���
������������
���������� ��
�
������)�
0�����������)�
0�����
��!�����"���� �
��#$#���
�����
� �� ��!��
��! ���"
1��(������&�
�2��*�
� $����#$�
%��������&���
'�&�
%���
���*���
-�����
��� �
����������,�����
��������*��3���
���(���4��5��
���2���������4��5��
'����(���%(�)��
�������(*���
%������*���
-�.(�&����*���
���������)�
6���������
1����*�

18
2.1.1.3. Development of a transient model for membrane separation of arbitrary multi-component gas mixtures. Application of the model to CO2 separation from simulated flue gas.
2.1.1.4. Validation of computational models using over 60 hours of process data from an integrated laboratory-scale reactor system.
2.1.2 Experimental (HYTEST) Setup
2.1.2.1. Completion of an experimental plan and test matrix for Year 1 operations of the BCTC HYTEST facility. Experiment conditions were selected to provide validation cases for the reaction models and to satisfy DOE-associated program milestone requirements.1
2.1.2.2. Completion and approval of an Environmental Checklist, Air Permit Applicability Determination, Laboratory Instruction (LI), and personnel training to support experimental data collection. LI provisions included automatic system shutdown in the event of hazardous or flammable gas releases in Bay 9.
2.1.2.3. Specification, acquisition, and calibration of mass-flow controllers, tube furnaces and heat tracing, pumps, tubing and fittings, pressure gauges and transmitters, thermocouples, automatic shutoff valves, pressure control valves, pressure relief valves, compressed gases, hydrogen pump, water injection pump, etc.
2.1.2.4. Design and acquisition of reaction vessels, compressed hydrogen and recycle gas storage tanks, CO2 separation membrane, methanation reactor, methane-reforming/water-gas-shift reactor, and steam generator.
2.1.2.5. Specification and acquisition of commercial methanation catalyst and steam reforming catalysts.
2.1.2.6. Design, purchase, and set up of experimental system enclosure, including electrical conduit and outlets connected to a single electrical distribution box with a 220/208-volt, 100-amp connection, and electrical bond ground.
2.1.2.7. Design and installation of enclosure ventilation system with a monitored flow controller using a variable-frequency drive to balance enclosure airflows during test operations.2
2.1.2.8. Set up of experimental system, automatic control system, and data-acquisition system.
2.1.2.9. Set up and calibration of micro-channel gas chromatograph for gas analysis.
1 FY-2009 PEMP Proposed Deliverables/Actions to Meet Measures 2.4.2 and 2.4.3. 2 Design and installation of the enclosure and enclosure ventilation system was funded by an INL-authorized
HYTEST facilities project.

19
2.1.3 Experimental (HYTEST) Operations
2.1.3.1. Reactor operations checkout testing, including HTSE hydrogen compression and supply.
2.1.3.2. Approximately 40-hours of parametric testing of substitute natural gas (SNG) production with continuous hydrogen supply from HTSE.
2.1.3.3. Over 10 hours operation of water-gas-shift reactor with continuous H2 supply from HTSE.
2.1.3.4. 10 hours operation of CO2 separation from simulated flue gas, integrated with CO2 reverse-shift with continuous H2 supply from HTSE.
2.2 Integrated Control System Data Fusion
2.2.1 Data Fusion Framework Development
2.2.1.1. Developed notional control system and process model relative to chemical processing facility. Initial model was developed using MATLAB Simulink and based on a training system utilized by the Department of Homeland Security, Control Systems Security Program Red Team / Blue Team control systems training courses.
2.2.1.2. Developed notional physical security system and scenario generation tool based on facility access technologies utilized at INL. This tool is used to generate facility access patterns to feed into data fusion engine.
2.2.1.3. Developed cyber security scenario generation capability aimed at adversely affecting control system and related processes.
2.2.1.4. Developed initial data fusion capability and graphical user interface that integrates cyber and physical security information with process control information. This capability will be refined in Year 2 of the data fusion effort.
2.2.1.5. Effort includes collaboration of an interdisciplinary team that includes representatives from academia and INL in the areas of computational intelligence, cyber security research, human factors and instrumentation and control, process engineering, physical security, infrastructure analysis, and modeling and simulation.
2.2.1.6. Two conference publications:
M. A. McQueen, W. F. Boyer, “Deception Used for Cyber Defense of Control Systems”, IEEE International Conference on Human System Interaction, May 21-23, 2009.

20
D. I. Gertman, "Human Factors and Data Fusion as Part of Control Systems Resilience", 2nd IEEE International Conference on Human System Interaction, Catania, Italy, May, 2009.
3. HYTEST EXPERIMENTAL SETUP and TESTS
3.1 Facility Description A detailed process diagram of the the first-year system is shown in Figure 3.1. The entire process setup is contained in a transportable enclosure that provides access to components through Lexan-Glass™ windows on each side of the module. Electrical power is supplied through a single power cord (208/120 volt, 100 amp), which can be disconnected and locked-out for electrical installations and maintenance. The module is ventilated with a variable-speed blower mounted on the BCTC Bay 9 roof. Airflow checks indicated that face velocities greater 100 ft/s can be achieved, even when two windows are open at medium fan speeds (about 1,500 scfm volumetric flow). An air damper is installed on the module to allow for up to 2,500 scfm of airflow. The multiple windows and damper provide excellent air draft throughout the enclosure with the ability to achieve 3 to 6 air turnovers per minute. The process system is mainly constructed of stainless steel vessels and tubing with typical Swagelok fittings. Equipment specifications are listed in Table 3.1. Figure 3.2 shows photos of the various facility components. A detailed equipment list and specifications are given in Table 3.1. Flow was established by applying positive pressures of less than 30 psig to the source flows. The pressure control regulator maintained the system pressure while regulating the total flow through the methanation reactor at approximately 0.25-5.0 slpm. Compressed gas mixtures supply reactant CO, CO2, CH4 and diluent/purge N2. Table 3.2 lists the gas composition used to support the testing in Year 1. After demonstrating the consistency of hydrogen gas generation and supply, all of the test hydrogen was supplied by the HTSE reactor in BCTC Bay 9. A hydrogen pump was used to compress the hydrogen to 45 psig. The pump was operated from the automatic control program to maintain the hydrogen tank pressure between 35 psig and 45 psig. Hydrogen make-up gas from compressed gas cylinders may also be provided (but, as stated, was not necessary for the tests conducted in Year 1). Spreadsheet calculations were used to determine individual reactant flow rates to attain desired operating conditions and reactant concentrations. Reactant and recycle gas compositions were achieved by mixing proper ratios of gases metered with calibrated mass-flow controllers and verified by on-line sample collection and monitoring at points marked in the process diagram. The system is equipped with pressure relief valves and check-flow valves to maintain pressure and flow balances in the process. Stream flow rates, compositions, pressure, and temperature conditions were continuously monitored and controlled to ensure safety conditions and experimental quality. Automatic shutoff solenoid actuated valves are installed in the system in the event reactor temperatures fall below safe limits designed to mitigate the formation of nickel carbonyl or in case that a hazardous gas leaks into the general occupancy area of the lab.

21
Steam is introduced into the system using a water evaporation flash pot. A metering pump semi-continuously injected a controlled amount of water into the heated steam generator vessel through a �” stainless steel tube. The water vaporized in the steam generator discharges into the main gas line downstream of the gas pre-heater. The steam generator is a 316 SST bolted-enclosure vessel with a design volume of 300 cm3, and a pressure rating of 1200 psi at 650°F. A 2” dip tube directs the water feed flow towards the bottom of the vessel. A stainless steel mesh is placed in the vessel to disengage moisture droplets ejected from the boiling film of water. The steam generator was heated with a 1000-watt ceramic-insulated band heater. The water inlet and steam outlet connections are located in the lid of the vessel, along with a thermowell that measures the temperature inside the steam generator.
Figure 3.1 LDRD HYTEST Phase I process equipment schematic
The methanation reactor is a High Pressure Equipment Company MS-19 Micro Series Reactor with an effective height of 20 inches and a 9/16” internal diameter. This tubular micro-reactor is fabricated from 316 SST with a design pressure rating of 1200 psi at 450°C. The reactor was charged with approximately 70 g of pelletized catalyst, supported over a stainless steel support screen. Process temperatures are continuously monitored by three evenly-spaced thermocouples at near the top, middle, and end of the catalyst bed. Automatically controlled
Gas cylinders 1. 15% CO2 in N2 2. 5% CH4 in N2 3. 10% H2 in N2 4. 9% CO in N2 5. UHP N2
4 3 2 1 5
G
water-cooled condenser
condensate drain
pressure control valve product gas
gas compressor
receiver tank
HTSE
gas
cool
er
product gas
band
hea
ters
synf
uels
re
acto
r
stea
m
H2O liquid
steam generator
tube
furn
ace
CO2 separation membrane
step
-dow
n pr
essu
re re
gula
tor
rotameter
G
to exhaust
200 psi 150-180 psi
30 psi
rotameter
G Gas sample point
Pressure relief valve
Manual valve
Check valve Thermocouple
Mass flow controller
Temperature controller
Pressure gauge
Automatic shut-off valve (reactor temperature)
Automatic shut-off valve (building monitor)
P Pressure transducer
G
step-down pressure regulator
P
G P
P
P
P
reforming reactor
P P
P
P
P
tube
furn
ace

22
band heaters are used to maintain reactor temperatures. Six 1-�” wide, 1” ID Watlow™ mineral-insulted band heaters are evenly spaced along the length of the reactor barrel. For the current tests, the reactor inlet and interior temperatures were maintained above 250°C to prevent possible formation of nickel-tetra carbonyl, Ni(CO)4, which can form at temperatures below approximately 150°C.
Synthetic product waxes and liquids with dew points at or slightly below the reactor temperature can be collected in the product-receiving vessel. Product gases are condensed and captured in the gas cooler.

23
Figure 3.2 HYTEST Phase I reactor system process components
Figure 3.2a HYTEST Phase I ventilated reactor enclosure.
Figure 3.2b Enclosure ventilation flow damper and electrical power connector.
Figure 3.2c Exhaust duct with flow rate monitor.
Figure 3.2d Variable frequency exhaust blower installed on BCTC Bay 9.

24
Figure 3.2e PLC panel for process monitoring and control.
Figure 3.2f HTSE compressed hydrogen tank. Tank is connected to HTSE for continuous hydrogen supply.
Figure 3.2g Compressed gas supply rack; enclosure custom exhaust duct.
Figure 3.2g CO/CO2/H2 synfuels controlled temperature profile reactor with product collector and condenser.
Figure 3.2h CO/CO2/H2 synfuels controlled temperature profile reactor with product collector and condenser (rear view).
Figure 3.2i PID power controllers for band heaters, liquid product ceramic heaters, steam generator, and heat tracing.
Figure 3.2j BASF methanation catalyst.

25
Figure 3.2k Synfuels reactor gas pre-heater.
Figure 3.2l Methane-reforming reactor and tube heater with PID controller power supply.
Figure 3.2m BASF methane-reforming catalyst.
Figure 3.2n CO2 separation reactor (metallic) and water injection pump (yellow).
Figure 3.2o Water flash steam generation pot and gas pre-heater tube furnace.
Figure 3.2p Inlet gas mass-flow controllers and flow pressure gauges.
Figure 3.2q Automatic shutoff solenoid valves.
Figure 3.2r Four Channel Micro-GC for multi-port on-line analysis of gas composition.
Figure 3.2s Pressure control valve.

26
Figure 3.2t Process monitoring and control screen and data logging interface.
Figure 3.2u Automatic control screen.

27
Figure 3.2w 10 cm x 10 cm x 10 cell HTSE solid oxide electrolysis cell stack before operation in high-temperature kiln.
Figure 3.2x HTSE kiln operating at 850°C.
�

28
Tabl
e 3.
1 H
YTES
T Ph
ase
I Equ
ipm
ent S
peci
ficat
ions
Item
M
anuf
actu
rer
Mod
el N
umbe
r D
escr
iptio
n N
2 Reg
ulat
or
Neo
n C
ontro
ls
Mod
el#
85-1
75U
S16
-580
H
igh
purit
y 2-
Sta
ge re
gula
tor,
Bra
ss,
200-
4000
ps
ig D
eliv
ery
Pre
ssur
e R
ange
, CG
A 5
80
Ar C
ompr
esse
d G
as
Reg
ulat
or
Sco
tt S
peci
alty
P
N:
5118
B-5
80
Mod
el#
18B
H
igh
purit
y 2-
stag
e re
gula
tor,
Bra
ss, 2
00-4
000
psig
, CG
A 5
80
CO
-N2 C
ompr
esse
d G
as M
ixtu
re
Mat
thes
on
Mod
el#
8-35
0 2-
stag
e re
gula
tor,
Bra
ss, 2
00-3
000
psig
, CG
A 3
50
CO
2-N
2 Com
pres
sed
Gas
Mix
ture
P
rost
ar
Mod
el P
RX
3024
3 2-
stag
e re
gula
tor,
Bra
ss, 2
50-3
000
psig
, CG
A 5
80
CH
4-N
2 Com
pres
sed
Gas
Mix
ture
C
ontro
ls
Cor
pora
tion,
A
mer
ica
Mod
el 4
1233
21-3
50
2-st
age
regu
lato
r, B
rass
, 200
-400
0 ps
ig, C
GA
350
H2-
N2 C
ompr
esse
d G
as
Mix
ture
S
cott
Spe
cial
ty
PN
. 511
5C-3
50
2-st
age
regu
lato
r, B
rass
, 100
-300
0 ps
ig, C
GA
350
Wat
er M
eter
ing
Pum
p LM
I Milt
on R
oy
Mod
el #
AA
961-
363S
P
120
V/ 1
.4 A
Ele
ctro
nic
Met
erin
g P
umo
2.0
GH
P M
ax;
50 p
si
Nitr
ogen
gas
mas
s-flo
w
cont
rolle
r
Sie
rra
Inst
rum
ents
84
0-2-
OV
1-S
V1-
E-V
1-S
1 S
N: 5
4721
0-
20 s
lpm
5-
30 p
sig
in
500
psig
max
imum
Hyd
roge
n-N
itrog
en G
as
mix
ture
mas
s-flo
w
cont
rolle
r
Sie
rra
Inst
rum
ents
84
0L-O
V1-
SV
1-E
-V1-
S1
SN
: 665
49
0-5
splm
5-
30 p
sig
in
500
psig
max
imum

29
Item
M
anuf
actu
rer
Mod
el N
umbe
r D
escr
iptio
n M
etha
ne g
as m
ixtu
re
mas
s-flo
w c
ontro
ller
Sie
rra
Inst
rum
ents
84
0L-O
V1-
SV
1-E
-V1-
S1
SN
: C31
011
0-5
splm
5-
30 p
sig
in
500
psig
max
imum
C
arbo
n di
oxid
e –
nitro
gen
gas
mix
ture
m
ass-
flow
con
trolle
r
Sie
rra
Inst
rum
ents
84
0M-O
V1-
SV
1-E
-V1-
S1
SN
: 547
20
0-20
spl
m
5-30
psi
g in
50
0 ps
ig m
axim
um
Car
bon
mox
ide-
nitro
gen
gas
mas
s-flo
w
cont
rolle
r
Sie
rra
Inst
rum
ents
C
100L
-NR
-2-O
V1-
SV
1-P
V2-
A1-
S1-
C10
-G5
0-10
spl
m
40 p
sig
in
500
psig
max
imum
R
emot
e D
ispl
ay/In
terfa
ce
Mod
ule
for m
ass-
flow
co
ntro
llers
Sie
rra
Inst
rum
ents
M
odel
# 10
0-R
D0
Ser
ies
100
Sm
art-T
rak
Rem
ote
Pilo
t Mod
ule
Dis
play
/Inte
rface
, 10'
RS
232
Com
mun
icat
ion
Cab
le
Hyd
roge
n ta
nk (H
2/N2)
ga
s m
ass-
flow
co
ntro
ller
Sie
rra
Inst
rum
ents
Hyd
roge
n Ta
nk
Buc
keye
Fa
bric
atio
n S
N 0
9-26
946
Max
imum
allo
wab
le w
orki
ng p
ress
ure
– 15
0 ps
ig
@ 3
00°F
Hyd
roge
n pu
mp
Air
Dim
ensi
ons
Mod
el#
EX
H 5
KC
36P
NB
429K
X
Sin
gle
phas
e co
ntin
uous
dut
y, 1
725
rpm
, 1/6
HP
, 11
5 V
/ 3.
6 FL
A
Gas
Pre
-hea
ter
Bar
nste
ad
Ther
mod
yne
Mod
el#
F211
35
Tube
Fur
nace
, PID
Con
trolle
r, 20
0-21
92 F
, 135
0 W
att,
120
VA
C
30
Item
M
anuf
actu
rer
Mod
el N
umbe
r D
escr
iptio
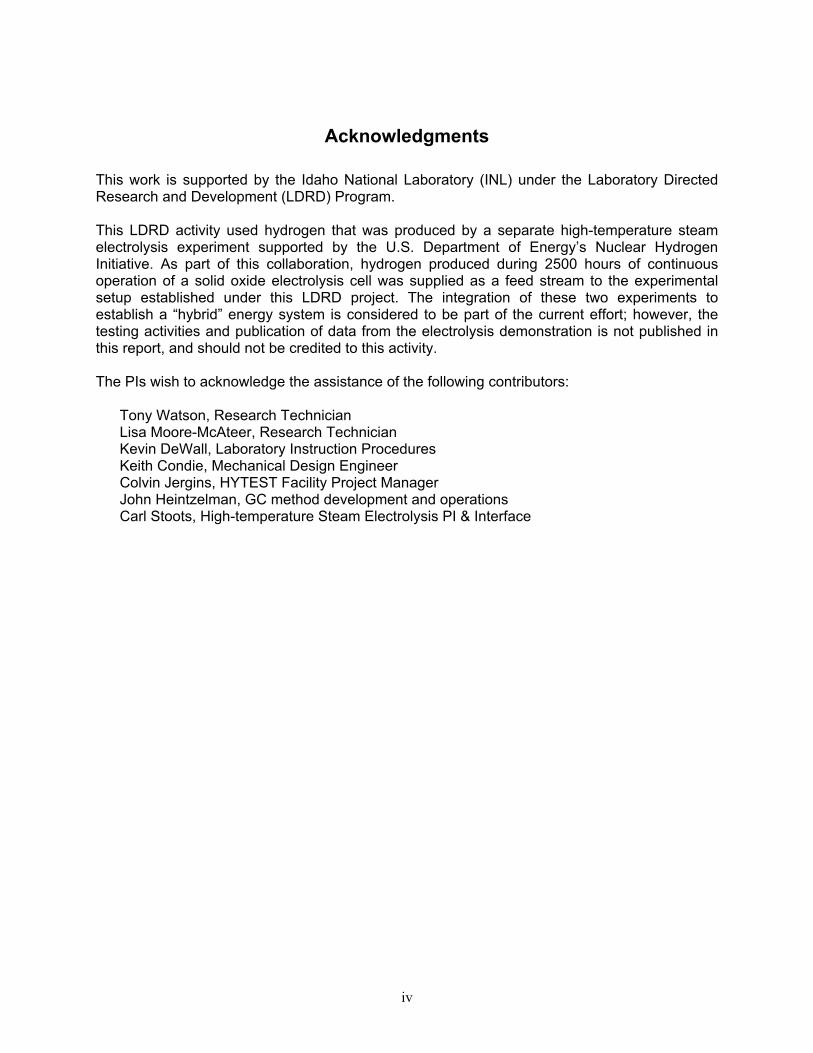
n S
team
Gen
erat
or
Hig
h P
ress
ure
Equ
ipm
ent
Com
pany
Mod
el#
BC
-1
Bol
ted
Clo
sure
Rea
ctor
, 300
cc,
316
SS
T, 1
200
psi
Des
ign
Pre
ssur
e, 6
50°F
Des
ign
Tem
pera
ture
, 1/4
" FN
PT
Con
nect
ions
in L
id, 1
/4"x
2" 3
16 S
ST
Pip
e D
ip T
ube,
The
rmow
ell,
Type
"K" T
herm
ocou
ple
w/0
.062
5" D
iam
eter
316
SS
T S
heat
h
Hea
ter f
or S
team
G
ener
ator
In
dust
rial H
eate
r C
orpo
ratio
n
Cer
amic
-Insu
late
d B
and
Hea
ter,
1000
Wat
t, 12
0 V
AC
, Typ
e "K
" The
rmoc
oupl
e fo
r Con
trol
Met
hana
tion
Cat
alyt
ic
Rea
ctor
H
igh
Pre
ssur
e E
quip
men
t C
ompa
ny
Mod
el#
MS
-19
Mic
ro S
erie
s R
eact
or, 8
1 m
L, 3
16 S
ST,
120
0 ps
i D
esig
n P
ress
ure,
800°F
Des
ign
Tem
pera
ture
, 1/2
" FN
PT
Inle
t/Out
let C
onne
ctio
ns, 1
/4" F
NP
T S
ampl
e P
ort i
n Lo
wer
Cou
plin
g,(3
) The
rmoc
oupl
e P
orts
w/
TC A
dapt
ers
Sea
l Wel
ded
to th
e V
esse
l Wal
l, (3
) Ty
pe "K
" The
rmoc
oupl
e w
/0.0
625"
Dia
met
er 3
16
SS
T S
heat
h P
re-F
itted
to L
ocat
e Ti
ps a
t the
C
ente
rline
of t
he V
esse
l.
Ban
d H
eate
rs fo
r C
atal
ytic
Rea
ctor
W
atlo
w
Mod
el#
MB
1A1J
N4
(6) M
I Ban
d H
eate
r, 1"
ID x
1 1
/2" W
ide,
48"
Hig
h-te
mpe
ratu
re S
tyle
B L
eads
, 12
0 V
/ 20
0 W
atts
PID
Hea
ter a
nd H
eat
Tape
Con
trolle
r Box
es
Col
e P
alm
er
Dig
i-Sen
se
PID
pow
er re
gula
tor/t
empe
ratu
re c
ontro
ller b
oxes
.
Liqu
id P
rodu
ct
Col
lect
ion
Pot
H
igh
Pre
ssur
e E
quip
men
t C
ompa
ny
Mod
el#
BC
-2
Bol
ted
Clo
sure
Rea
ctor
, 1 L
iter,
316
SS
T, 1
200
psi
Des
ign
Pre
ssur
e, 6
50 F
Des
ign
Tem
pera
ture
, 1/2
" FN
PT
Con
nect
ions
in L
id/B
otto
m S
ide
Out
let,
1"x3
" 31
6 S
ST
Pip
e O
utle
t Dip
Tub
e, T
herm
owel
l, Ty
pe
"K" T
herm
ocou
ple
w/0
.062
5" D
iam
eter
316
SS
T S
heat
h

31
Item
M
anuf
actu
rer
Mod
el N
umbe
r D
escr
iptio
n Li
quid
Pot
Cer
amic
W
rap-
arou
nd h
eate
r In
dust
rial H
eate
r C
orpo
ratio
n
Cer
amic
-Insu
late
d B
and
Hea
ter,
1500
Wat
t, 12
0 V
AC
, Typ
e "K
" The
rmoc
oupl
e fo
r Con
trol
Syn
gas
Coo
ler a
nd
Con
dens
er
Cus
tom
N
/A
Pyr
ex G
lass
tube
with
flan
ge e
nd e
nclo
sure
. C
apab
le to
75
psig
, hot
Met
hane
refo
rmer
R
eact
or /
Wat
er-G
as-
shift
reac
tor
Cus
tom
Rea
ctor
, In
cone
l and
S
tain
less
Ste
el
J&J,
B/S
B36
6 W
PN
CI-S
A60
0 H
T# 7
6363
0 S
40S
2�
“ x 1
”
Bel
l red
ucer
wel
ded
to S
S p
ipe
(app
rox.
7�
“) to
tal
leng
th 1
1”
App
roxi
mat
e vo
id v
olum
e of
1,3
00 c
m3
Ref
orm
er tu
be h
eate
r M
elle
n C
ompa
ny
Mod
el: P
S30
5-12
0-25
-E80
8 S
N: 8
9113
474
120V
/25
Am
p
Ref
orm
er tu
be h
eate
r po
wer
sup
ply
/ co
ntro
ller
Mel
len
Com
pany
M
odel
: M
elle
n 2-
301M
S
N: 8
9113
474
115V
/ 19
Am
p
Hea
t tra
ce
HTS
/Am
ptek
Co.
A
WH
-102
-060
DM
H
eavy
Am
ox In
sula
ted
Duo
-Tap
e 1”
wid
e, 6
’ Len
gth
Max
Tem
p 14
00°F
/ 76
0°C
2.
60 A
mp,
624
Wat
ts,
240
Vol
ts
Aut
otra
nsfo
rmer
S
taco
Ene
rgy
Pro
duct
s Ty
pe 3
PN
1010
V
aria
ble
auto
trans
form
er
Out
put 0
-120
V/1
40 V
, 10k
Va
Pre
ssur
e C
ontro
l Val
ve
(PC
V)
Bau
man
n M
odel
# 06
-510
00
PTF
E S
oft S
eat,
1/4"
Con
trol V
alve
, Cv=
0.03
, 316
S
ST
Bod
y, 1
/4" F
NP
T C
onne
ctio
ns, 4
-20
mA
Inpu
t

32
Item
M
anuf
actu
rer
Mod
el N
umbe
r D
escr
iptio
n P
ress
ure
Tran
smitt
er
Ros
emou
nt
Mod
el#
3051
S1T
G3A
2E11
A1A
B4D
1E5
M5T
1
Sca
labl
e U
ltra
In-L
ine
Gau
ge P
ress
ure
Tran
smitt
er,
-14.
7 to
800
psi
, 316
L S
ST
Bod
y/D
iaph
ragm
, 1/2
" FN
PT
Pro
cess
Con
nect
ion,
4-2
0 m
A O
utpu
t
Air
Reg
ulat
or fo
r PC
V
Fish
er C
ontro
ls
Mod
el#
67C
FR
67C
Ser
ies
Inst
rum
ent S
uppl
y R
egul
ator
, opt
iona
l pr
essu
re g
auge
Sam
ple
Line
Reg
ulat
or N
eon
Con
trols
M
odel
# 10
-223
J-1
6 H
igh
Pur
ity L
ine
Reg
ulat
or, 3
16L
SS
T, 1
-25
psig
D
eliv
ery
Pre
ssur
e R
ange
, Cv=
0.07
, Out
let V
alve
, 1/
4" F
NP
T C
onne
ctio
ns
Sam
ple
Line
Filt
er
W.A
. Ham
mon
d D
rierit
e C
ompa
ny
Sto
ck c
hem
ical
C
aSO
4
Gas
Chr
omat
ogra
ph
Agi
lent
Te
chno
logi
es
Mod
el 3
000,
4-c
hann
el
Cha
nnel
1 &
Cha
nnel
2 a
re id
entic
al.
Plo
t U/M
ole
Sie
ve, 5
A P
lot (
10 m
x 0
.32
mm
); 1
mL
bac
k-flu
sh; T
CD
det
ecto
r, fix
ed in
ject
or v
olum
e
Cha
nnel
3. P
lot Q
; (8
m x
.32
mm
), TC
D d
etec
tor;
varia
ble
volu
me
inje
ctor
Cha
nnel
4. P
lot U
; (8
m /
0.32
mm
), TC
D d
etec
tor,
varia
ble
volu
me
inje
ctor
Dis
tribu
ted
Con
trol
Sys
tem
N
atio
nal
Inst
rum
ents
Oth
er
La
bvie
w S
oftw
are
and
Com
pact
Fie
ld P
oint
H
ardw
are
for M
onito
ring
and
Sto
ring
Tem
pera
ture
, P
ress
ure
and
Flow
Rat
e D
ata.
Con
trolli
ng S
yste
m
Pre
ssur
e w
/PID
Con
trol L
oop,
Con
trolli
ng th
e O
pera
tion
of th
e m
ass-
flow
con
trolle
rs
Hig
h-te
mpe
ratu
re H
eat
Trac
e Te
mpe
ratu
re
Con
trolle
rs
Eut
ech
Inst
rum
ents
P
te L
td, S
inap
ore
Mod
el#
8900
0-10
D
igi-S
ense
Sta
ndar
d/A
dvan
ced
Tem
pera
ture
C
ontro
ller,
115
VA
C, 1
0 A
Max
Pow
er O
utpu
t, A
dvan
ced
Mod
el h
as (2
) 4-2
0 m
A R
ecor
der
Out
puts
33
Item
M
anuf
actu
rer
Mod
el N
umbe
r D
escr
iptio
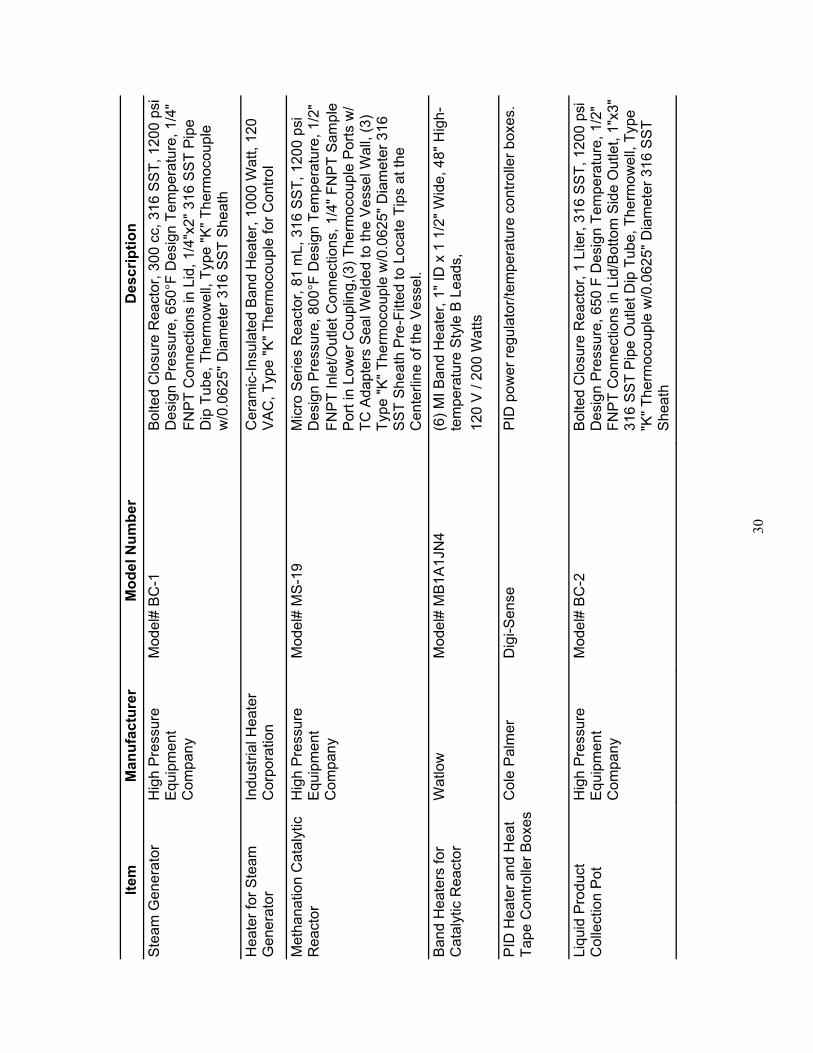
n C
O g
as m
onito
r D
rage
r P
ac II
I
CO
2/N2 s
epar
atio
n m
embr
ane
Air
Liqu
ide
4121
M
ED
ALTM
hol
low
-fibe
r mem
bran
e m
odul
e
34
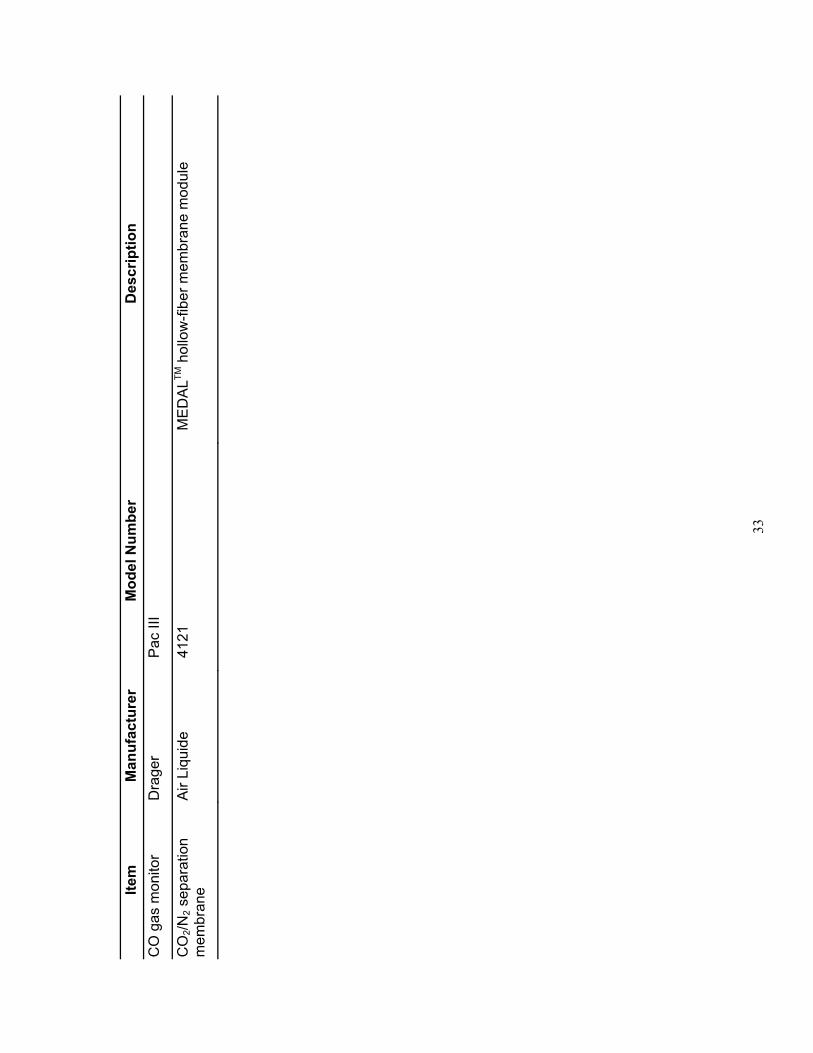
Table 3.2 Compressed Gases by Cylinder, Composition, and Pressures
Gas Composition Limits of Individual Species /
(vol. %)
Composition Vol. %
Nominal Initial Pressure
(psig)
Internal Volume @70°°F
(ft3) Purge Nitrogen gas cylinders UHP N2 2,200 220 H2/N2 mixture cylinder 10% H2, Bal N2 2,000 200 CO/N2 mixture cylinder 9% CO, Bal N2 2,000 200 CO2/N2 mixture cylinder 15% CO2, Bal N2 2,000 200 Methane/N2 Cylinder 15% CH4, Bal N2 2,000 200 Calibration Gas 1 Low Range
CH4 – 100 ppm CO2 – 500 ppm CO – 500 ppm H2 – 500 ppm Balance - Nitrogen
2,000 25
Calibration Gas 2 Medium Range
CH4 – 5% CO2 – 5% CO – 5% H2 – 5% Balance - Nitrogen
1,500 25
Calibration Gas 3 High Range (except methane)
CH4 – 0.5 % (5,000 ppm) N2 – 15% CO – 15% H2 – 15% Balance - CO2
1,500 15
Ultra-pure Ar for Micro GC 99.999 2,000 200
3.2 Experimental Approach and Procedures In accordance with the Laboratory Instruction for the test facility, prestart, operating, and shutdown instructions were developed to ensure safe operation and experimental data quality. The list of actions included:
• Monitoring equipment, mass-flow controllers, and steam generator were calibrated • Pressure relief valves were calibrated and checked • Hood ventilation flow rates were tested and approved by INL Industrial Hygiene • Auto-shutdown valves and logic were tested • Leak detection of pipes and vessels was performed before test operations • GC methods were developed and instrument was routinely calibrated • Reactor was pre-heated to test conditions • Gas flows were initiated in accordance with designated test concentrations • CO monitoring was actively performed in the model

35
Two operators attended the test operations. Data were collected by the control system and gas chromatograph. In addition, manual data sheets were created to record system flow rates, temperatures, pressures, controller settings, etc.
3.3 Commissioning Tests System operational readiness was verified by initiating flow and reactor heat-up with the control program and manual controllers. The system performed as designed in all cases. A test of the automatic shutoff valves was successfully completed to ensure reactive gas flows would be automatically stopped whenever a reactor temperature dropped below 250°C. This action was intended to prevent formation of nickel carbonyls. A steady supply of hydrogen from HTSE was confirmed. The hydrogen pump was programmed to maintain the pressure of hydrogen in the surge tank within a range of 35-45 psig. A flow rate of approximately 2 slpm was obtained from the exhaust vent. The composition in the H2-N2 mixture was routinely measured with the gas chromatograph to ensure that the pump was not back-drawing air from the HTSE exhaust line. The nominal composition of the HTSE was 45 vol.% hydrogen and 55 vol.% nitrogen. No other contaminants were detected in the hydrogen stream. Reactor heater controls were tested with nitrogen gas flowing to the reactors. The synfuels reactor is equipped with three thermocouples, located at the top, middle, and bottom of the catalyst bed. The band heaters and power controllers can effectively hold an isothermal profile in the methane reactor with all flows tested ranging from 1–10 slpm with actual space velocities ranging from 500 to 11,000 hr -1.
Reactor empty volume: 81.4 cm3 Void volume with catalyst pellet charge: 0.5 Space velocities at standard conditions:
Standard (0 psig, 25°C) 740 to 7,400 Low end conditions (25 psig, 275°C) 500 to 5,000 High end conditions (5 psig, 325°C) 1,100 to 11,000
Steam generation was accomplished with the pulsing water pump, which injected water into the steam generation flash pot. The low flow rates and low moisture percentage (about 5 vol.%) in the feed stream required about 2.5-10 cm3 per minute injection. This low flow rate resulting in intermittent injection times of only 2-3 injection pulses using the LMI Milton Roy pump. This resulted in steam surges from the generation pot. Steady steam generation was only possible at higher injection rates, with corresponding lower sweep nitrogen and higher moisture concentration. Intermittent moisture injection resulted in data scatter that is addressed in the experimental results section.

36
Tabl
e 3.
3 Te
st C
omm
issi
onin
g A
ctiv
ities
Test
ing
Act
ivity
R
eact
ors
used
G
as S
ourc
es
Dat
e Te
st
Tim
e To
tal T
est
Tim
e C
omm
ents
Syn
fuel
s re
acto
r and
ge
nera
l sys
tem
sh
aked
own
Syn
fuel
s R
eact
or
HTS
E
CO
-N2 m
ixtu
re
CO
2-N
2 mix
ture
H
2-su
rge
tank
S
team
ge
nera
tion
08/2
4-08
/26
N/A
N
/A
Com
pone
nt c
heck
out a
nd v
erifi
catio
n, fl
ow
mon
itorin
g, s
tream
com
posi
tion
verif
icat
ion,
H
TSE
hyd
roge
n su
pply
and
gas
com
posi
tion
mon
itorin
g, p
ress
ure
cont
rol l
oop
test
ing.
Ref
orm
er re
acto
r sh
aked
own
Ref
orm
er R
eact
or
HTS
E
CO
-N2 m
ixtu
re
CO
2-N
2 mix
ture
H
2 – s
urge
tank
S
team
ge
nera
tion
08/2
7
08/2
8 –
8/29
1526
–
1705
1840
–
2345
1015
–00
15
1.5 5 14
Goa
l: 2
0 ho
urs
of in
tegr
ated
test
ope
ratio
ns.
CO
2 con
vers
ion
to C
O w
ith H
2 fro
m H
TSE
us
ing
indi
rect
hea
ting
with
tube
furn
ace.
P
aram
etric
test
ing
para
met
ers-
tem
p, p
ress
., co
mpo
sitio
n, a
nd G
HS
V.
Cou
pled
reac
tor c
ontro
l and
gen
eral
sys
tem
st
abili
ty a
nd p
erfo
rman
ce o
bser
ved.
C
O2 s
epar
atio
n m
embr
ane
reac
tor
shak
edow
n /
Hig
h-te
mpe
ratu
re s
hift
reac
tion
CO
2 sep
arat
ion
mem
bran
e re
acto
r R
efor
mer
Rea
ctor
H
TSE
CO
2-N
2 mix
ture
H
2-su
rge
tank
S
team
ge
nera
tion
8/29
–
8/30
11
45 –
13
50
14
20 –
20
00
2 5.
5
Goa
l: 8
hou
rs o
f int
egra
ted
test
ope
ratio
ns
with
CO
2 cap
ture
and
recy
cle
for s
ynfu
els
prod
uctio
n. H
2 sup
plie
d fro
m H
TSE
. C
O2-
H2
mix
ture
reac
tor o
ver s
hift
cata
lyst
.
Met
hana
tion
reac
tor
para
met
ric te
sts
Syn
fuel
s R
eact
or
HTS
E
CO
-N2 m
ixtu
re
CO
2-N
2 mix
ture
H
2-su
rge
tank
S
team
ge
nera
tion
8/26
09/0
3
09/0
9
09/1
0
1830
–
2240
0830
–
0030
1025
–
1726
0830
–
1743
2 16 7 9
Goa
l: 2
0 ho
urs
of in
tegr
ated
test
ing.
In
vest
igat
e tra
nsie
nt c
ondi
tions
due
to
chan
ges
in te
mpe
ratu
re, p
ress
ure,
inle
t co
mpo
sitio
n (in
clud
ing
moi
stur
e), a
nd G
HS
V.
Inve
stig
ate
affe
ct o
f moi
stur
e on
tran
sien
t co
nditi
ons.
C
oupl
ed re
acto
r con
trol a
nd g
ener
al s
yste
m
stab
ility
obs
erva
tion.
Tota
l H
ours
62
In
tegr
ated
test
tim
e go
al o
f 40
hour
s.

37
Following initial startup, a shakedown methanation run was completed, wherein only low conversions were detected. The synfuels reactor was cleaned and the catalyst was replaced with fresh catalyst for subsequent runs. Catalyst deactivation was initially attributed to “irreversible” sulfur contamination as a result of previous uses of the synfuels reactor to produce elemental sulfur from H2S. The system was heated and conditioned with steam and hydrogen to de-sulfurize the system. Startup on fresh catalyst also failed to produce the significant methanation results. This was attributed to overheating the inlet gases containing CO or CO2. It is likely that carbon radicals were produced in the inlet gas pre-heat furnace, resulting in catalyst deactivation. Fortunately, the deactivation was reversible and the catalyst was regenerated by flowing moist nitrogen through the system. The time required to regenerate the catalyst was approximately 6 hours. This observation underscores the need to avoid carbon (coke) formation, both in the reactor as well as upstream gas conditioning and cleanup unit operations. This has bearing on the reuse of CO2 through reverse-shifting with hydrogen, which requires high temperatures similar to the range of pre-heat that was applied during the shakedown tests. Gas mass-flow control and system pressure control was verified for various flow and recycle configurations. The pressure control valve has previously been operated up to 500 psig. For the present low-pressure tests, the pressure was controlled to ±1.0 psig. Mass-flow control was consistently within ±3.0 percent of the set-point. The Agilent 3000 Micro Gas Chromatograph is configured with four channels.Two of the channels house identical mole sieve columns, allowing for analysis using two different carrier gases. In addition to the mole sieve columns, the GC is outfitted with one Plot Q column and one Plot U column. Argon carrier gas was used for all four of the channels in this test. Various GC methods and programs were developed and tested using the three calibration gases indicated in Table 3.1. This made it possible to cover the wide range of concentrations from ppm to 90 vol.%. Injection times were varied and to enable greater flexibility of range. Each of the gas species was detected on two or more columns of the GC, providing a useful check. Instrument calibration was performed weekly. Retention times and response factors remained relatively constant. Gas samples were diverted to the GC at the reactor exit, and routed through a small-volume vessel filled with dessicant to removed moisture prior to injection. The GC measurements, while providing a relatively complete speciation of the gas samples, suffered from slow sampling frequencies and long lag times. The GC required approximately 3� minutes to process a given sample. Additionally, the sample line and gas dryer resulted in a time delay, preventing instantaneous quantification of samples. These limitations prevented the GC from detecting rapid transient phenomena that occur during the first few minutes after reactor conditions changed. The GC was, however, capable of characterizing longer responses as the system evolved towards the steady state (roughly 10-15 minutes). Data logging was accomplished with the control program and gas chromatograph. In addition, manual data collection sheets were developed to keep periodic records of temperatures, pressures, flow rates, and gas species measurements.
38
3.4 Computational Model Two separate computational models were developed for this work. The first predicts reactive flow in a catalytic packed bed, and has been applied to the synthetic-fuels, high-temperature gas-shift, and methane-reforming reactors discussed in Section 1.3. The second model predicts mass transfer of multi-component gases through a porous-fiber membrane unit. This model is used in the current study to estimate separation of CO2 from an industrial flue gas.
3.4.1 Governing equations The models developed in this work are based on a system of one-dimensional partial differential equations (PDEs) that govern the flow of ideal gases through porous media. The following equations represent conservation of mass, chemical species, momentum, and energy, as well as a thermodynamic equation-of-state.
(1)
(2)
where and
(3)
(4)
(5)
Application of these general equations to different processes in the HYTEST experiment requires specification of the source terms that appear in equations (1), (2), and (4). In addition, each process under consideration warrants the application of different boundary and initial conditions. Process-specific modifications to the basic equations above are applied when warranted, including simplifications to the momentum equation (3), and in the treatment of the energy equation (4).
3.4.2 Transport properties Individual gas component viscosities are computed using the Chapman-Enskog theory of intermolecular collisions (see Reid et al. 1987)
(6)
ϕ∂ρ
∂t+ ϕ
∂ρu
∂x=
nS∑k=1
Sk
ϕ∂ρYk
∂t+ ϕ
∂ρuYk
∂x= ϕ
∂
∂x
(ραk
∂Yk
∂x
)+ Sk
ρ∂u
∂t= −∂p
∂x− μ
Kϕu − cFK−1/2ρ(ϕu)2
= −∂p
∂x− fK
ρ(ϕu)2
K1/2
fK =1
ReK+ cF ReK =
ρϕuK1/2
μ
(ρc)m∂T
∂t+ (ρc)f ϕu
∂T
∂x=
∂
∂x
(κm
∂T
∂x
)+ ST
p = ρRT
nS∑k=1
Yk/Mk
μk =516 (πRTMk)1/2
πσ2kΩv
39
The empirical relation developed by Neufeld et al. (1972) is used to estimate the species collision integrals . This low-pressure result is corrected for high-pressures following the work of Reichenberg (1975). The total dynamic viscosity in equation (3) is then obtained by a mass-based averaging of individual component viscosities
(7)
Other transport coefficients are estimated by assuming that the Lewis number and Schmidt number are unity for each component
(8)
Together these assumptions imply that
and for all k , (9) or that heat, mass, and momentum diffuse at the same rate. The energy equation (4) uses a single temperature to describe the fluid and solid phase temperatures, thus requiring the specification of overall transport properties for the combined fluid/solid volume. The overall heat capacity is taken as the arithmetic mean of the solid and fluid heat capacities.
(10) The overall thermal conductivity is obtained using a weighted geometric mean of the solid and fluid conductivities.
(11) This has been shown to provide reasonable estimates for the conductivity in porous media for a variety of solid particle structures and orientations (see Nield & Bejan, 1992).
3.4.3 Gas thermochemistry The temperature-dependent thermochemical properties of component gases are computed from the Shomate equation.
Ωv
μ =nS∑
k=1
μkYk
Lek =κ
ρcpαk= 1
Sck =μ
ραk= 1
κ = cpμ αk = μ/ρ
(ρc)m = (1 − ϕ)(ρc)s + ϕ(ρc)f
κm = κ1−ϕs κϕ
f

40
cP° = A + B � + C � 2 + D � 3 +E/ � 2 H° � H°298.15 = A � + B � 2/2 + C � 3/3 + D � 4/4 � E/ � + F � H S° = A ln(�) + B � + C � 2/2 + D � 3/3 � E/(2 � 2) + G
cP° = heat capacity (J/mol/K) H° = standard enthalpy (kJ/mol) S° = standard entropy (J/mol/K) � = temperature (K) / 1000
(10)
In the equation above, A, B, C, D, E, F, and G are regression coefficients that have been determined from empirical data over a large range of temperatures (Chase, 1998). This correlation provides estimates for the heat capacity, which is necessary to compute momentum and mass transport properties as described in the previous section. It also provides thermodynamic quantities such as enthalpy, entropy, and Gibbs energy that play a key role in determining reaction kinetics and chemical equilibrium.
3.4.4 Computational algorithm Equations (1)-(5) are approximated using second-order finite-difference formulae on a spatial grid of non-uniformly distributed points. The solutions are advanced in time using a semi-implicit, iterative algorithm, where multiple outer-iterations are employed at each time step to simultaneously satisfy the set of non-linear governing equations. A high-level description of the algorithm is presented below, where the superscript m denotes the mth iteration at the current time step.
FOR m=1:miter evaluate �, �, μ, �, cP given (p,T,Yk)
m-1 solve velocity : u m solve pressure : p m solve energy : T m solve species : Yk
m END
The velocity is determined by numerically evaluating the integral form of the continuity equation (1), given the most current estimate for the mass source term and a two-point backwards-difference approximation for .
(11)
Similarly, the pressure is determined by integrating the momentum equation (3) over the length of the domain.
(12)
A modified trapezoidal rule is then used to advance the energy and species transport equations.
(13)
∂ρ/∂t
(ρu)j − (ρu)0 =∫ xj
0
(−∂ρ
∂t+
1ϕ
nS∑k=1
Sk
)dx
pj − p0 =∫ xj
0
(−ρ
∂u
∂t− fK
ρ(ϕu)2
K1/2
)dx
φn+1 − φn
Δt=
12
(An+1φn+1 + Anφn
)+ S
(12(φn+1 + φn)
)

41
Here, � represents the vector of temperatures and mass fractions, A is the convection-diffusion operator, and S is the source term operator. This matrix-vector equation can be rearranged and solved to obtain the solution at the next time level, � n + 1.
(14)
In the current work, 3-5 outer-iterations at each time step were found to provide adequate convergence of the coupled system of equations.
3.4.5 Catalytic packed bed model This section describes the details of the one-dimensional catalytic packed bed model that was produced for this work. The model is a general framework to compute convection, diffusion, reaction, and heat transfer amongst gaseous species in a one-dimensional bed of solid catalyst. This model is applicable to the methantion, gas-shift, and steam reforming reactors discussed in Section 1.3.
3.4.5.1 Model details
The rate of reaction j in a chemical mechanism containing nR reactions and nS species is given by:
(15)
Here, kj
f and kj
r are the rate coefficients for the forward and reverse reactions, �jk is the overall stoichiometric coefficient for species k in reaction j, and �k is the mass rate-of-production for species k due to all of the reactions in the mechanism. In this work, the kinetic mechanism of Xu and Froment (1989) is used to describe the chemistry of methanation, methane steam reforming, and water-gas shift processes. The simplified mechanism was developed via rigorous thermodynamic analyses of a large number of possible mechanisms, and regression of data collected in a tubular reactor with Ni/MgAl2O4 catalyst. The statistically best model retained three global chemical reactions.
(16)
The rate equations for these reactions involve reaction equilibrium expressions (Kj), Arrhenius rate coefficients (kj), and van’t Hoff species adsorption coefficients (Kk).
(I − Δt
2An+1
)φn+1 =
(I +
Δt
2An
)φn + Δt S
(12(φn+1 + φn)
)
rj = kfj
nS∏k=1
(ρYk
Mk
)νreacjk
− krj
nS∏k=1
(ρYk
Mk
)νprodjk
ωk = Mk
nR∑j=1
νjk rj
νjk = νprodjk − νreac
jk
i. CH4 + H2O � CO + 3H2
ii. CO + H2O � CO2 + H2
iii. CH4 + 2H2O � CO2 + 4H2

42
(17)
Pre-exponential factors, activation energies, and adsorption enthalpies were determined from the Xu and Froment (1989) data. This leads to concise expressions for the production rate for each reaction in equation (16) per unit mass of catalyst and unit time.
(18)
The mass source term per unit volume and unit time that appears in equation (2) is obtained by multiplying the production rate by the bulk density of the catalyst.
(19) The energy source term is split into two contributions – one due to reaction and one due to heat exchange with the isothermal reactor wall.
(20)
The theoretical expression of Kaviany (1985) for the Nusselt number in confined flow through porous media is used to estimate the heat transfer coefficient in equation (20).
(21)
This result is strictly valid only for the laminar case, or cF=0 in equation (3). It is nevertheless used here without correction for Reynolds number effects.
Kj = exp
(−ΔG 0
j
RT
), j = 1, 2, 3 (reactions)
kj = Akj exp(− Ej
RT
), j = 1, 2, 3 (reactions)
Kk = AKkexp
(−ΔHk
RT
), k = CO, H2, CH4, H2O
r1 =k1
p2.5H2
(pCH4 pH2O − p3
H2pCO
K1
)/K2
r2 =k2
pH2
(pCO pH2O − pH2 pCO2
K2
)/K2
r3 =k3
p3.5H2
(pCH4 p2
H2O − p4H2
pCO2
K3
)/K2
K = 1 + KCO pCO + KH2 pH2
+ KCH4 pCH4 + KH2O pH2O/pH2
Sk = (1 − ϕ)ρsωk
ST = SrxnT + Swall
T
SrxnT = −(1 − ϕ)ρs
nR∑j=1
ΔHj rj
SwallT =
4h
D(T − Twall) =
4κmNuD
D2(T − Twall)
NuD =12S(S − tanh S)2
2S3 + 3S tanh2 S + 15 (tanh S − S)
S =12
( ϕ
Da
)1/2
, Da =K
D2, K = − μ
∇pϕu

43
A simplified form of the momentum equation in the packed bed model is also used. The modified equation assumes that transients in the velocity decay rapidly compared to the transport terms, resulting in an algebraic relationship between pressure, density, and velocity. This simplification results in the well-known Ergun equation for a packed bed, relating the pressure drop with the equivalent spherical diameter of the packing, Dp (see Nield & Bejan, 1992).
(22)
3.4.6 Membrane model This section describes the details of the one-dimensional membrane model that was produced for this work. The membrane model is applicable to hollow-fiber membrane modules as pictured in Figure 3.3. The membrane model is quite general, and can handle shell- or tube-side feed flows, and co- or counter-flow orientations. In the present work, the membrane model is applied to the separation of CO2 (fast gas) from nitrogen (slow gas).
Figure 3.3 Schematic of a tube-feed, hollow-fiber membrane module.
3.4.6.1 Model details
Membrane separation is a rich field, and different membrane systems exploit different physiochemical processes in order to effect the separation. In simple systems, the molar flux of species across the membrane, Jk, is driven by differences in the partial pressure of species on either side of the membrane (see King, 1980).
where
(23)
Here the superscript 1 refers to conditions on the feed-side of the membrane, while superscript 2 refers to the permeate-side of the membrane. The mass source term relevant to equations (1) and (2) is obtained by converting from moles to mass and multiplying by the membrane area-to-volume ratio, �.
Δp =(
150Rep
+ 1.75) (
Δx
Dp
) (1 − ϕ
ϕ
)ρu2
Rep =ρuDp
μ
(ϕ
1 − ϕ
)
Jk = Qk
(X
(1)k p(1) − Jk
Jtotp(2)
)Jtot =
nS∑k=1
Jk

44
(24)
Solution of the implicit molar flux equation (23) requires numerical inversion, which can be costly to perform at each spatial location and time step when the number of gas component species becomes large. Furthermore, in light of the iterative solution algorithm presented in Section 3.4.4, it doesn’t make sense to “exactly” solve the molar flux expression given that the pressure and species concentration fields are approximations that are evolving towards the true solution. Consequently, an iterative method is adopted for the molar flux term as well. In this approach, equation (23) is solved for the molar flux (neglecting the summation term), and the next estimate for Jk is computed using the current estimate for all other quantities in the equation.
(25)
This leads to an exact solution of equation (23) only in the limit as m � �. In practice, however, two or three outer-iterations are sufficient to obtain a stable and accurate solution.
3.4.6.2 Model validation
In order to gauge the performance of the membrane model, the model was applied to the experimental data of Haraya et al. (1988). In this experment, an H2/CO mixture is fed through a high-flux polyamide membrane module. The results of the comparison are shown in Figure 3.4.
Figure 3.4 Comparison of model prediction with experimental data of Haraya et al. (1988) for
H2/CO separation. • Experimental data, - - - Model prediction.
Sk = βJkMk
Jm+1k =
(QkX
(1)k p(1)
1 + Qkp(2)/Jtot
)m
� � � � �
�����
�
��
��
��
��
��� ������������������
������������������������������������ ������������������!�������

45
Figure 3.4 depicts the mole fraction of H2 in the permeate and retentate streams, as well as the stage cut, or the fraction of the molar feed flow that exits through the permeate stream. As can be seen from the figure, there is excellent agreement between the experiment and the model over a range of operating flow rates. This is a strong indication that the model equations and assumptions are valid, and that the model is performing as intended.
3.5 Experimental Results & Model Comparisons
3.5.1 Methanation Reactor The methanation synfuels reactor was operated in concert with the HTSE experiment for more than 30 hours of integrated testing. Figure 3.5 shows an example of data output from a typical day of testing (09-Sep-2009). The outlet pressure and an interior gas temperature from the synfuels reactor are shown in blue and red, respectively. During operation, the data acquisition computer recorded temperature and pressure data at 5-second intervals. Stream composition data were measured with the GC at a maximum frequency of approximately 3 minutes per sample. This relatively long sampling interval is due to the various conditioning steps that are required to process and analyze a GC sample. GC sampling times are indicated by the black “+” symbols near the bottom of the Figure 3.5. During this day of testing, data was collected at two nominal pressures and three temperatures. Information from the separate data collection systems is reconciled through the digital timestamp on the files.
Figure 3.5 Temperature and pressure history for methanation reactor on 09-Sep-2009.
0
5
10
15
20
25
30
pres
sure
[psi
g]
08:0
0
09:0
0
10:0
0
11:0
0
12:0
0
13:0
0
14:0
0
15:0
0
16:0
0
17:0
0 220
240
260
280
300
320
340
tem
pera
ture
[K]

46
Table 3.4 Methanation test conditions and outlet methane concentration
Test
Tinlet
[°C]
Treactor
[°C]
Pinlet
[psig]
9% CO
[slpm]
45% H2
[slpm]
100% N2
[slpm]
H2O
[slpm]
outlet
CH4 mol%
CO %
conversion
2 301.5 325.1 23.7 0.65 0.48 0.88 0 2.23 69.7
3 299.6 325.1 6.5 0.65 0.48 0.88 0 2.11 66.8
4 299.2 297.6 6.22 0.65 0.48 0.88 0 2.28 71.9
5 296.8 272.6 5.95 0.65 0.48 0.88 0 2.35 74.0
6 307.1 272.7 24.2 0.65 0.48 0.88 0 2.55 80.0
7 299.7 297.6 23.6 0.65 0.48 0.88 0 2.48 78.1
8 295.0 321.5 26.2 0.65 0.48 0.88 1.06 0.16 7.3
9 313.1 297.6 5.61 0.97 0.72 1.28 0 2.45 76.7
10 306.5 297.7 6.39 1.30 0.96 1.76 0 2.44 77.5
The test conditions and results from the methanation experiment are displayed in Table 3.4, with outlet concentrations of CH4 reported on a dry product basis. The temperature and pressure values represent time averages over the duration of each test. Two pressure ranges (roughly 25 psig and 5 psig) and three reactor temperatures (325, 300, and 275°C) were investigated. The inlet concentrations of reactants were held constant, excepting the addition of moisture during Test 8. Tests 9 and 10 explored the effects of reactor residence time, by increasing the base flow rate. In general, the fractional conversion of CO to CH4 was greater at higher pressures and lower temperatures (compare Tests 2,7,6 with 3,4,5). This is consistent with Le Chatelier’s principle for the exothermic methanation reaction where the total number of moles decreases with the extent of reaction. Likewise, the addition of the “product” H2O to the inlet flow suppresses the formation of methane (compare Test 7 with 8). Interestingly, reducing the residence time resulted in a slight increase in the methane yield (compare Test 4 with 9,10). The experimental data were compared with results from the one-dimensional packed bed model of Section 3.4.5. Figure 3.6 shows the steady-state spatial profiles of temperature, velocity, and mass fraction for Pinlet = 23.7 psig and Treactor = 325°C. These conditions roughly correspond to Test 2 in Table 3.4. The symbols along the various curves indicate the locations of the computational grid points, which adaptively evolve to resolve solution features. It is apparent from the computed concentrations that early in the reactor (for x/L<0.2), CO methanation (the reverse of reaction i in equation (16)) and the water-gas shift (reaction ii) proceed vigorously. In fact, reaction i proceeds at roughly twice the rate of reaction ii in this region of the reactor. Once the initial CO is spent (x/L>0.2), methanation continues via the reverse of reaction iii by consuming CO2 created by reaction ii. Figure 3.7 shows the progression of the temperature profile from its initial to its steady-state value. The early temperature deficit, caused by the sudden inflow of cold reactants is quickly erased by the heat release from the exothermic reaction and heat transfer to the isothermal walls. The gas in the last half of the reactor remains at a nearly constant temperature, indicating that convective heat transfer to the walls dominates additional heat release from reaction iii.

47
Figure 3.6 Steady-state spatial profiles of (top-to-bottom) temperature, velocity, and species
mass fractions in the synthetic fuels reactor. Treactor = 325°C, Pinlet = 23.7 psig.
Figure 3.7 Transient evolution of spatial temperature profiles in the synthetic fuels reactor.
Treactor = 325°C, Pinlet = 23.7 psig.
0 0.1 0.2 0.3 0.4 0.5 0.6 0.7 0.8 0.9 1550
600
650
T [K
]
0 0.1 0.2 0.3 0.4 0.5 0.6 0.7 0.8 0.9 10.38
0.4
0.42
0.44
u [m
/s]
0 0.1 0.2 0.3 0.4 0.5 0.6 0.7 0.8 0.9 10
0.01
0.02
0.03
Yk
x/L
COCO2H2H2OCH4
0 0.2 0.4 0.6 0.8 1570
580
590
600
610
620
630
x/L
T [K
]

48
Transient measurements of species concentrations at two different pressures (Tests 2 and 3) are compared with predictions from the model in Figure 3.8 and Figure 3.9. In both cases, the steady-state values from the model agree well with the experimental data. The general trends and qualitative behavior of the experiment are also reasonably captured in the computational model. Quantitatively, however, the advancement to the steady-state condition in the simulations is much faster than what was measured in the experiment. In fact, Figure 3.10, which shows an expanded view of the early conditions at the reactor exit, demonstrates that the model displays transient dynamics that are much faster than our current capability to measure experimentally. Several factors likely contribute to the apparent disagreements. First, there are differences between the catalyst used in the experiment and the catalyst used to deduce the model’s kinetic mechanism and reaction rates. The catalyst in the present experiment was a BASF methanation catalyst containing 25.4% NiO on Al2O3, while the catalyst used in the experiments of Xu and Froment (1989) contained 15.2% Ni on MgAl2O4 spinel. Differences in the adsorption rates and activation energies between the two catalysts are very likely. The exact initial conditions and “start time” of the experiment were also difficult to define and replicate in the model. For example, in the experiment there was likely significant dispersion and axial mixing of reactants in the complicated piping upstream of the synfuels reactor. This would present quite a different initial condition than the “plug flow” condition that was applied in the model. This could lead to significant changes in the early evolution of the flow. Other differences such as temperature boundary conditions and the exclusion of “dynamic” pressure and temperature fluctuations could also play a role. In addition, there is evidence that the GC data exhibited non-negligible “memory” effects when many samples were tested in rapid succession. For instance, at the end of a test after the flow of CO was discontinued, the GC would still detect CH4 for up to 15 minutes of sampling. This hysteresis is caused by time lags as materials flow from the reactant source locations, through the process piping and reactor volumes, and to the GC sampling locations. During sustained operations without sufficient time to purge the GC, material can deposit within the GC columns, causing test results from one sample to “bleed” into the next. Given the uncertainties of the current experimental setup, it is too soon to draw a conclusive appraisal of the performance of the current model.

49
Figure 3.8 Transient species concentrations at the exit of the synthetic fuels reactor.
Treactor = 325°C, Pinlet = 23.7 psig. • Experimental data, - - - Model prediction.
Figure 3.9 Transient species concentrations at the exit of the synthetic fuels reactor.
Treactor = 325°C, Pinlet = 6.5 psig.
0 20 40 600
0.05
0.1
time [min]
mol
e fr
actio
nH2
CO2
CH4
CO
0 20 40 600
0.05
0.1
time [min]
mol
e fr
actio
n
H2
CO2
CH4
CO
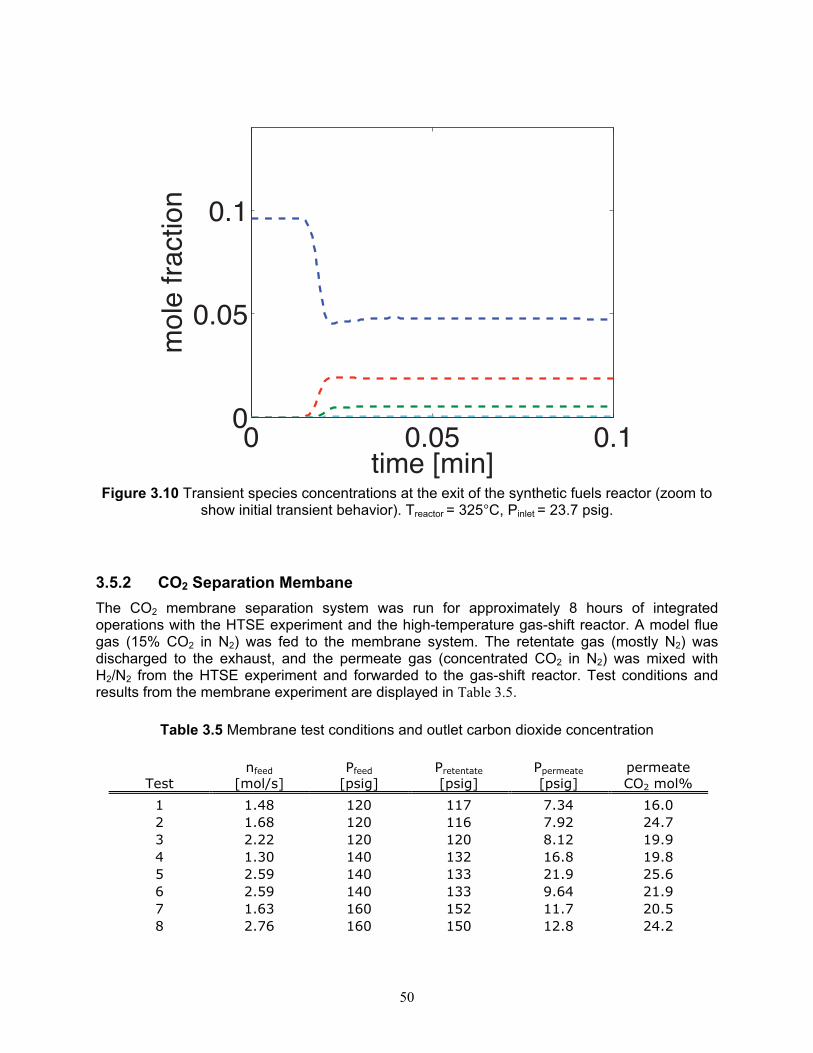
50
Figure 3.10 Transient species concentrations at the exit of the synthetic fuels reactor (zoom to
show initial transient behavior). Treactor = 325°C, Pinlet = 23.7 psig.
3.5.2 CO2 Separation Membane The CO2 membrane separation system was run for approximately 8 hours of integrated operations with the HTSE experiment and the high-temperature gas-shift reactor. A model flue gas (15% CO2 in N2) was fed to the membrane system. The retentate gas (mostly N2) was discharged to the exhaust, and the permeate gas (concentrated CO2 in N2) was mixed with H2/N2 from the HTSE experiment and forwarded to the gas-shift reactor. Test conditions and results from the membrane experiment are displayed in Table 3.5.
Table 3.5 Membrane test conditions and outlet carbon dioxide concentration
Test
nfeed
[mol/s]
Pfeed
[psig]
Pretentate
[psig]
Ppermeate
[psig]
permeate
CO2 mol%
1 1.48 120 117 7.34 16.0
2 1.68 120 116 7.92 24.7
3 2.22 120 120 8.12 19.9
4 1.30 140 132 16.8 19.8
5 2.59 140 133 21.9 25.6
6 2.59 140 133 9.64 21.9
7 1.63 160 152 11.7 20.5
8 2.76 160 150 12.8 24.2
0 0.05 0.10
0.05
0.1
time [min]
mol
e fr
actio
n

51
Predictions of the pressure in the retentate stream from the membrane model are compared with the measured data in Figure 3.11. Excellent agreement is achieved over the range of conditions that were tested. This suggests that the combination of the mass source terms in equations (1) and (2) and the momentum formulation in equation (3) provide an adequate characterization of the pressure drop and bulk split of material between the permeate and retentate streams. This could be further improved by careful “tuning” of the Darcy permeability factor, K, and the form-drag coefficient, cF , that appear in equation (3).
Figure 3.11 Comparison of experimental data and model prediction of retentate pressure for CO2/N2 separation. Maximum error: 6.1%, average error: 2.4%.
0.8 0.9 1 1.1 1.2
x 106
0.8
0.9
1
1.1
1.2x 10
6
experimental data
mod
el p
redi
ctio
n

52
Figure 3.12 Comparison of experimental data and model prediction of permeate mole fraction
for CO2/N2 membrane separation. Figure 3.12 compares the experimental concentration data with predictions from the membrane model. The mole fraction of CO2 in the permeate stream is plotted against the feed flow rate parameter nfeed/Pfeed. In these coordinates, the model predictions exhibit nearly linear dependence on the feed flow parameter. This agrees somewhat with the data at low flow rates, but the measurements at high flow rates are sporadic and don’t agree well with the model. The disparity is likely due to problems with the experimental setup. The rotameter-type flowmeter that was installed upstream of the membrane unit was inadequate to provide consistent quantification the flow of feed gas to the membrane. These unreliable measurements were difficult to reconcile with the composition data from the GC. A more complete account of the model results is presented in Table 3.6. Since the purpose of the membrane is to capture CO2 from the flue gas and recycle it to the reactor system, the concentration of CO2 in the exhaust (retentate) stream is of interest. Given the uncertainty in the experimental flow conditions and the lack of measurements for the retentate stream, the model results provide the best indication of the effectiveness of the proposed membrane system. In the model, the retentate CO2 concentration ranged from 0.1% in the best case to 4.55% in the worst case, providing strong evidence that a membrane could be effective at capturing CO2 in this system. Overall, results from the combined membrane experiments and modeling are encouraging. However, further testing with improved equipment and process controls is necessary.
� � ��
�����
��
���
��
���
��
�����
�� �������� ��
��
�� ��������������
��� ��
�
�
��������������� ��

53
Table 3.6 Membrane model results and predictions
Test
Pretentate
[psig] stage cut
retentate
CO2 mol%
permeate
CO2 mol%
1 117.3 0.656 0.46 22.7
2 116.2 0.586 0.94 24.9
3 111.9 0.459 2.42 29.8
4 138.6 0.793 0.18 18.9
5 129.5 0.415 4.55 29.7
6 130.4 0.459 2.25 30.1
7 157.8 0.762 0.10 19.7
8 150.7 0.483 1.93 29.0
3.5.3 Reverse-Shift Reactor Figure 3.13 and Figure 3.14 compare measured data with equilibrium conditions for test to determine the extent that CO2 can be converted back to CO with H2 following the water-gas shift reaction. Excess hydrogen supplied from the HTSE was combined with a CO2 in a dry inlet stream. This gave a maximum driving force for convert CO2 to CO. Data were collected as the furnace temperature was increased and then decreased. The flowrate was increased during the decent to investigate the affect of residence time and pressure. A tubular reactor was charged with the steam-methane-reforming catalysts. The temperatures investigated reached the limit of the tube furnace skin temperature of 1150°C, corresponding to a reactor exit temperature of 880°C. The experimental data indicate that the effects of chemical kinetics are important, with the reactions approaching equilibrium as the system approached higher temperatures. Because the water-gas shift reaction is stoichiometrically balanced, there should be no affect due to pressure. Despite this, higher pressures appear to increase the shift conversion at all of the temperatures that were tested. An explanation of this phenomenon is not possible with the limited data that have been collected thus far. Efforts to vary the residence time were limited to the operating ranges of the mass-flow controllers. A total flow rate of 7.2 slpm is near the lower end of that which can be achieved with the current setup. Higher flowrates were also difficult to achieve since they resulted in high pressure drops within the system.

54
Figure 3.13 Comparison of measured data with water-gas shift equilibrium conditions.
(temperature increasing with time)
Figure 3.14 Comparison of measured data with water-gas shift equilibrium conditions. (temperature increasing with time)
55
3.6 Further Observations and Discussion
The HYTEST Phase I facility operated in conjunction with the HTSE experiment for over 60 hours of testing. Throughout this time, the hydrogen supply from HTSE was remarkably consistent in composition and flow rate. This was more than sufficient for the low-pressure, integrated testing that was completed this year. In future efforts, where synthesis reactors will be operated at much higher pressures, the production, compression, and storage of hydrogen fuel will be more challenging.
During operation of the methanation reactor, proper conditioning of the inlet reactant stream was essential to the successful production of SNG. Excessively high-temperatures in the pre-heater were found to thoroughly inhibit synthesis reactions. The most plausible explanation for this observation is that extreme temperatures in the pre-heater caused dissociation of the CO and subsequent coking and deactivation of the catalyst. Careful control of the inlet stream to temperatures between 275°C and 325°C prevented this.
High temperatures in the methane-reforming/gas-shift reactor accelerated corrosion of the reactor vessel. After several days of exposure to high temperatures, the stainless steel reactor housing exhibited decarburization and spalling of the surface material. The InconelTM bell reducers were also visibly damaged by the thermal stresses. Subsequent testing was discontinued until a replacement reactor could be built. Future testing at high-temperatures will need to utilize more resilient alloys to mitigate high-temperature thermal and chemical corrosion.
4. DATA FUSION Modern critical infrastructure control and security systems have the capability to provide facility managers, operators, and security personnel with an abundance of monitoring data. This data comes from multiple sources including process controls and physical and cyber security monitors that are deployed at different levels within the system to provide both situational awareness and in-depth defense. Due to the complexity and sheer amounts of data, however, it is challenging for operators to quickly analyze a situation and respond appropriately as they are inundated with too much data and not enough information. This challenge will intensify as advanced monitoring technologies enable larger and larger amounts of situational data to be collected. The primary thrust of data fusion is to transform large amounts of information into timely, actionable intelligence. It is believed that a holistic data fusion process that encompasses and prioritizes information from the sources mentioned above would enhance the response of operators/managers and increase the overall stability and efficiency of the facility. This data fusion effort focuses on developing a way to amalgamate data from all possible information sources related to a critical infrastructure facility in such a way that it can be properly prioritized for presentation to and use by different levels of operators. This is a significant problem that has been addressed to some extent in the chemical process control industry without consideration of cyber aspects of the problem. Thus, the proposed effort is timely and important. Progress to date has been to develop a conceptual approach to the problem and to define a hypothetical physical facility with a baseline control system and scenarios of threats.

56
Using this surrogate system, a series of scenarios was developed representative of normal, off-normal, and emergency operating conditions involving process, physical security, and cyber security factors. Emphasis will be placed on cyber initiators having the potential to cause unavailability, damage, or plant systems instability. Consideration was given to blended attacks, i.e., those having a physical security and cyber security components. Fusion techniques are being developed to present key information to operators, maintain high levels of situation awareness, and support the implementation of mitigative measures.
5. LDRD PLANS AND RECOMMENDATIONS
In the second year, atmospheric co-electrolysis of CO2, and reforming of CH4 will be tested in a new solid oxide cell stack. A methanol catalyst will replace the methane catalyst in the synfuels reactor, and the facility will be operated to produce liquid fuels. The synfuels reactor, CO2 recycle, and CH4 reforming reactors will all be operated at higher pressure. These tests will contribute to a more complete understanding of hybrid systems with respect to:
• Recycle of CO2 and CH4 in either the HTSE and the reformer/shift reactor, and process control development for recycle flow and process changes
• Measurement, modeling, and assessment of reaction kinetics for liquid fuels production • System dynamics, stability, and control • Capture and recycle strategies for by-products • Further development of data collection, data analysis, and interactive process
assessment
In the third year, pressurized production of methanol and/or F-T fuels will continue. This will include pressurized reforming of CO2 and CH4. CO2 separation and/or high-pressure electrolysis will be demonstrated, contingent on plans by the coordinating hydrogen programs to design and build such systems. These tests will develop additional understanding of hybrid energy systems with respect to the operation of a fully integrated, pressurized system that demonstrates gas by-product recycling. Improved development and implementation of data measurement, process monitoring, and control systems will continue throughout Years 2 and 3. The systems that are envisioned for HYTEST will account for recycle dynamics and perturbations from process conditions.
5.1 Data Fusion Plans and Interface Efforts are ongoing to streamline the collection, processing, and analysis of information from the HYTEST Phase I facility. This not only aids operators and researchers in understanding the physical phenomena, but also contributes to information security and physical safety. To accomplish these goals, integration of the HYTEST transient process model into the data fusion system will be a priority in Year 2 efforts. Preliminary computer programs for processing and visualizing HYTEST data streams have already been written (see, for example, Figure 3.5). Follow-on efforts will include full hardware-in-the-loop data feeds from of the HYTEST system.

57
5.2 Future Possible Testing Capability
Future efforts will investigate several important and interesting questions related to synthetic fuels productions in hybrid energy systems. In particular, facilities and expertise will be expanded to address the following:
• Hybrid liquid synfuels production • C1 chemistry • Catalyst deactivation • Fast pyrolysis and pyrolysis hydrotreatment • Steam gasification • Material testing for high-temperature reactions • High-pressure operations (A four-stage compression system has been procured and is
ready for deployment next year. This system will allow pressures up to 3000 psi.) • Process controls needs:
- Continuous gas composition monitoring - Automatic pressure control - High-pressure transducers - Total condenser for gas outlet - Gas sample conditioning - Mass-flow controllers for high pressure - Enclosure monitors for flammable gas detection
A detailed discussion of these activities is beyond the scope of this progress report, however, planning and preparations for these activities are currently underway.
6. CONCLUSIONS The HYTEST Phase I facility at INL operated in conjunction with the HTSE experiment for over 60 hours of integrated testing. During operations, the synfuels reactor, CO2 membrane reactor, high-temperature-shift reactor, and steam-methane-reforming reactor were operated in several configurations to demonstrate various aspects related to hybrid energy systems and synfuels production. This facility represents a major accomplishment within the Energy Security Initiative, as it provides a flexible and reconfigurable test-bed for laboratory-scale demonstrations of hybrid-energy concepts and technologies. In parallel with the design and construction of the HYTEST lab facility, computational models for the key reactor components have been developed. Separate models for the synthetic fuels reactor, steam-methane-reforming reactor, high-temperature water-gas-shift reactor, and CO2 membrane separation reactor have been implemented. The models have been validated using transient and steady-state measurements from the HYTEST experiments. General agreement between the model results and the measured data was achieved, however, further efforts are needed in both modeling and experimentation. In particular, improved instrumentation for monitoring and controls is needed in order to provide consistent, accurate, and useful data to inform and direct future models. On the other hand, more sophisticated models are needed as HYTEST facilities expand in scope and capability. Undergirding both of these efforts, will be the development of tractable approaches to collect, analyze, and utilize process data. Successful

58
execution of these data fusion activities will be crucial to the advancement of HYTEST efforts in the coming years.
7. REFERENCES Boardman, R. D., and S. E. Aumeier: “INL Hybrid Energy Systems Development and Testing Plan,” INL/INT-09-16960, July 2009. Chase, M. W., Jr.: “NIST-JANAF Themochemical Tables (4th ed.),” J. Phys. Chem. Ref. Data, 9:1 (1998). Cherry, S. J. and C. G. Rieger: “Integrated Control System Data Fusion,” INL LDRD IC-107, commencing FY-2009. Haraya, K., K. Obata, T. Hakuta, and H. Yoshitome: Sep. Sci. Tech., 23:305 (1988). Herring, J. S., J. E. O’Brien, C. M. Stoots, G. L. Hawkes, J. J. Hartvigsen, and S. Mehrdad: Int. J. Hydrogen Energy, 32:440 (2007). Kaviany, M.: Int. J. Heat Mass Trans., 27:851 (1985). King, J.: Separation Processes (2nd ed.), McGraw-Hill, New York, 1980. Maskalick, N. J.: Int. J. Hydrogen Energy, 11:563 (1986). Nield, D. A., and A. Bejan: Convection in Porous Media, Springer-Verlag, New York, 1992. Neufeld, P. D., A. R. Janzen, and R. A. Aziz: J. Chem. Phys., 57:1100 (1972). Nelson, L.: “High-Temperature Gas-Cooled Reactor Integration Study,” INL/EXT-09-16942, September 2009. O’Brien, J. E.: “Comparison of a One-Dimensional Model of a High-Temperature Solid-Oxide Electrolysis Stack with CFD and Experimental Results,” Proc. Int. Mech. Eng. Congress & Exposition (IMECE2005), Orlando, FL, November 2005. O’Brien, J. E.: “Thermodynamic Considerations for Thermal Water Splitting Processes and High Temperature Electrolysis,” Proc. Int. Mech. Eng. Congress & Exposition (IMECE2008), Boston, MA, November 2008. O’Brien, J. E., C. M. Stoots, J. S. Herring, P. A. Lessing, J. J. Hartvigsen, and S. Elangovan: J. Fuel Cell Sci. Tech., 2:156 (2005). O’Brien, J. E., C. M. Stoots, J. S. Herring, J. J. Hartvigsen: J. Fuel Cell Sci. Tech., 3:213 (2006). Reid, R. C., J. M. Prausnitz, and B. E. Poling: The Properties of Gases & Liquids (4th ed.), McGraw-Hill, New York, 1987. Riechenberg, D.: “The Viscosities of Pure Gases at High Pressures,” Natl. Eng. Lab., Rept. Chem. 38, East Kilbride, Glasgow, Scotland, August 1975. Shunn, L. and R. D. Boardman: “Adaptive Process Modeling Using Parameter Estimation and Mechanism Sensitivity Analysis,” INL LDRD EI-112, commencing FY-2009. Xu, J., and G. F. Froment: AIChE J., 35:88 (1989).