Embed Size (px)
Citation preview

Engineering Structures 28 (2006) 1983–1996www.elsevier.com/locate/engstruct
Hysteretic behavior of exterior post-tensioned flat plate connections
Sang Whan Hana, Seong-Hoon Keea, Young-Mi Parka, Li-Hyung Leea, Thomas H.-K. Kangb,∗
a Division of Architectural Engineering, Hanyang University, Seoul, Republic of Koreab Department of Civil and Environmental Engineering, University of California, Los Angeles, CA 90095, USA
Received 17 October 2005; received in revised form 14 March 2006; accepted 22 March 2006Available online 3 May 2006
Abstract
The purpose of this study is to evaluate hysteretic behavior of exterior post-tensioned flat plate slab–column connections (PT connections)designed to resist only gravity loads. For this purpose, experimental studies were conducted using three approximately two-thirds-scale testspecimens; two exterior PT connection specimens having different tendon layouts and one exterior reinforced concrete flat plate slab–columnconnection (RC connection) specimen. Quasi-static cyclic loading was applied to the specimen with a constant gravity load. All specimenshad bottom bonded reinforcement around the column as required by ACI 352.1R-89. This study collects previous test results to draw a generalconclusion for the hysteretic behavior of the PT exterior connections. This study observed that the tendon layout influenced the hysteretic behaviorof PT exterior connections, which means that lateral drift capacity, dissipated energy, failure mechanism, and ductility vary with respect to tendonlayouts. Moreover, this study shows that the amount of bottom reinforcement specified by the ACI 352.1R-89 is sufficient for resisting positivemoments resulting from moment reversal under the cyclic loading. Shear strength of the test specimens is more accurately predicted by the shearstrength equation considering average compressive strength ( f pc) due to post-tensioning tendons than that without considering f pc.c© 2006 Elsevier Ltd. All rights reserved.
Keywords: Post-tensioned; Flat plate; Exterior connection; Bottom reinforcement; Tendon; Hysteretic behavior
1. Introduction
ACI 318-05 [1] defines flat plate slab systems in the categoryof Moment Frames that resist forces mainly by flexure. The flatplate slab systems are subdivided into two types—reinforcedconcrete (RC) flat plate systems and post-tensioned (PT) flatplate systems. The PT flat plate systems are more beneficialwith span-to-depth ratios and functional flexibility comparedto the RC flat plate systems, which already have advantagesover RC beam–column systems in terms of story height, andconstruction cost and time. Given these advantages, the PT flatplate slab systems are commonly used as a gravity- or lateral-force resisting system in the US [2].
In regions of low-to-moderate seismicity such as the easternUS (SDC-A and -B according to IBC-03 [3]), flat platesystems are often designed and constructed as a primarylateral force resisting system (LFRS) in compliance withdetailing requirements for Intermediate Moment Frames (IMF)
∗ Corresponding author.E-mail address: [email protected] (T.H.-K. Kang).
0141-0296/$ - see front matter c© 2006 Elsevier Ltd. All rights reserved.doi:10.1016/j.engstruct.2006.03.029
as specified by ACI 318-05 [1] Section 21.12. On the otherhand, in regions of high seismicity such as the western US(SDC-C, -D, and -E), flat plate systems are commonly usedfor a gravity force resisting system (GFRS), coupled with theLFRS (e.g., shear walls or ductility perimeter moment frames),assuming that the LFRS resists all seismic forces. For suchcombined systems, it is not necessary for the GFRS to satisfythe detailing requirements for the LFRS; however, the GFRSshould retain the ability to undergo the lateral deformationscompatible to the adjoining LFRS without loss of gravity loadcarrying capacity.
Prior experimental studies [2,4,5] reveal that the lateraldeformability and ductility of flat plate slab systems werestrongly influenced by the gravity shear stress on a criticalsection of a slab–column connection; hence punching shearfailures occurred at relatively small lateral displacement for theconnections with relatively high gravity shear ratios (Vg/φVc),where Vg is the gravity shear force transferred from slabsto a column, and Vc is the nominal concrete shear strengthaccording to ACI 318-05 [1] Section 11.12.2. Based on theseobservations, ACI 318-05 [1] Section 21.11.5 requires use

1984 S.W. Han et al. / Engineering Structures 28 (2006) 1983–1996
(a) Kang and Wallace (2005). (b) Trongtham and Hawkins (1997). (c) Martinez-Cruzado (1993). (d) Foutch et al. (1990).
Fig. 1. Prior experimental programs of PT exterior slab–column connections.
of shear reinforcement at a slab–column connection that ispart of the GFRS in the regions of high seismicity dependingon a combination of story drift ratio and gravity shear ratio(Vg/φVc). These requirements have been developed, mostlyusing the lateral load tests of conventional ‘RC’ slab–columnconnections. Although limited, prior tests of ‘PT’ connectionshave indicated that greater displacement capacity can beobtained for PT connections relative to the RC connectionsfor a given gravity shear ratio [6–8]; the need for this shearreinforcement requirement for the PT connections is not yetcertain.
According to ACI 318-05 [1] Chapter 18, minimum topbonded reinforcement is required for the PT gravity flat platesystems; however, for these PT gravity systems, minimumbottom reinforcement is usually not required in the connectionregions. For RC flat plate systems, ACI 318-05 [1] Section7.13.25 requires at least two continuous bottom reinforcing bars(for interior connections) or two bottom bars with 90 degreestandard hooks (for exterior connections) passing through thejoint core as an integrity steel requirement. ACI 352.1R-89 [9]supplements the ACI 318 integrity steel requirement in greaterdetail. It is noted that some engineers argue that the integritysteel requirement may also be applied to PT flat plate systems,since the ACI 318 [1] and 352 [9] provisions do not clearlystate that no bottom integrity reinforcement is required for PTslabs. Typically, it is believed that draped tendons precludecatastrophic collapse of PT slabs after punching failure sothat bottom bonded reinforcement is often not provided inpractice; however, the bottom reinforcement may be needed,not only for the purpose of collapse prevention, but also to resistpositive moments which may occur for the gravity systemssubjected to inelastic deformations. Until now, no experimentaland analytical studies have been conducted to determine theexplicit amount of the bottom reinforcement of PT exteriorslab–column connections in regions of high seismicity.
The arrangement of banded tendons in one direction anddistributed tendons in the other direction is common for PTsystems used for GFRS [10]. Despite popular use of thislayout, research on the impact of tendon layout on hystereticbehavior of a PT slab–column connection is scarce. Aswell, due to the paucity of seismic assessment of the effectof post-tensioning forces, ACI 318-05 [1] R11.12.2 makesrecommendations on the same nominal shear strength for post-tensioned ‘exterior’ connections as used for reinforced concrete‘exterior’ connections. However, some researchers [11–14]suggested that the shear strength of the PT exterior connection
could be increased due to the in-compression forces ( f ps)
generated by the post-tensioning.Given the issues described in the preceding paragraphs,
an experimental research program was conducted to inves-tigate hysteretic behavior of post-tensioned (PT) exteriorslab–column connections as part of the gravity-force resistingsystem (GFRS). For this study, three, approximately two-thirds-scale test specimens were subjected to cyclic lateral loading. Ofthe three specimens, two were the PT exterior connections (PB-D50 and PD-D50) and one represented the conventional RC ex-terior connection (RE-D50). The test results were evaluated andcompared with prior test results of the PT exterior connections.In particular, stresses in bonded reinforcement were monitoredadjacent to the slab–column connection to evaluate the neces-sity and quantity (if necessary) of the flexural bottom reinforce-ment for the PT exterior connections.
2. Review of prior experimental research
Prior experimental studies on PT exterior connectionswithout shear reinforcement subjected to lateral loading aresummarized in this section. Fig. 1 shows the configurationof the test programs conducted by different research groups,as well as the boundary and loading conditions for thespecimens. The prior PT exterior specimens were tested underquasi-static loads. No tests have been conducted for dynamicloadings, with the exception of the one, approximately one-third-scale, two story, post-tensioned flat plate frame testedby Kang and Wallace [15]. Although the frame tested byKang and Wallace [15] included eight PT exterior connections(Fig. 1(a)), the connections were provided with shear (stud-rail)reinforcement; therefore, the data are not directly comparedwith results from the specimens without shear reinforcement.
The test program conducted by Trongtham and Hawkins [16]included one, isolated, full-scale, PT exterior connection with-out shear reinforcement (Fig. 1(b)). A punching failure of theconnection occurred due to combined gravity and lateral (re-peated) loading. The study recommended that bottom bondedreinforcement should be the same amount of top reinforcementfor the case where more than 20% of the shear stress capacity(νc) is generated by unbalanced moment.
Foutch et al. [13] tested four, two-thirds-scale, PTexterior connections without shear reinforcement subjected tomonotonic loading (Fig. 1(c)). In this study, the impacts ofthe tendon layout and the moment-to-shear ratio on lateralload responses (e.g., stiffness, strength, and ductility) wereinvestigated. Based on the results, the stiffness and the

S.W. Han et al. / Engineering Structures 28 (2006) 1983–1996 1985
(a) Elevation. (b) Plan.
(c) Section ( ∼ 2/3 scaled specimen). (d) Plan (∼ 2/3 scaled specimen).
Fig. 2. Prototype structure and exterior connection specimen.
flexural strength of the PT exterior connections with bandedtendons were greater than those with distributed tendons,since more tendons were provided for the connections withbanded tendons. By considering post-tensioning forces, theshear strengths of the PT exterior connections were predictedmore closely with measured values. For the tests with highermoment-to-shear ratios, greater deformability and increasedductility were achieved.
Martinez-Cruzado [14] subjected two, approximately half-scale, PT exterior connections without shear reinforcement toquasi-static biaxial reversed loading (Fig. 1(d)). One of theprimary variables was the tendon distribution arrangement.Banded tendons reduced stiffness degradation and increasedlateral load strength; however, banded tendons acceleratedstrength decay after punching failure due to high localpressure. The gravity shear forces imposed on the slab–columnconnections were approximately 35% of the nominal shearstrength, and maximum vector drift ratios prior to punchingwere recorded as approximately 3.5%.
3. Experimental program
3.1. Prototype and specimen design
A ten story building in high seismic regions was consideredas a prototype building (Fig. 2). Special reinforced concrete
shear walls and flat plate slabs were designed to resistearthquake loads and gravity loads, respectively. Fig. 2 shows aplan and an elevation of the prototype building and an isolatedexterior connection specimen scaled from the correspondingactual prototype building. It is assumed that inflection pointsare located at column mid-height and slab mid-span. A slabthickness of 20 cm and a slab span-to-thickness ratio of 40were selected as used for typical PT gravity flat plate systemsin high seismic regions. Slab moments and shear forces dueto the design gravity loads were determined using a finiteelement program [17], and column and slab reinforcement weredesigned to carry the gravity moments and shear forces inaccordance with ACI 318-05 [1]. Given the balancing loadequal to 100% of dead load, the number of unbonded tendonsper span and the jacking force per tendon were determined,resulting in compressive stress in concrete due to effective post-tensioning ( f pc) of 1.2 MPa, which was within a range from0.86 to 3.44 MPa required by ACI 318-05 [1].
Two PT and one RC, approximately two-thirds-scalespecimens, were designed corresponding to the prototypedesign. Figs. 3 and 4 depict specimen dimensions and detailsof slab reinforcement. Table 1 indicates important properties ofgeometry and materials, as well as slab (bonded and unbonded)reinforcement ratios over an effective transfer width of c2 +3h,where c2 is the column width parallel to the slab edge and h

1986 S.W. Han et al. / Engineering Structures 28 (2006) 1983–1996
Fig. 3. Details of reinforcement of specimens PE-B50 and PE-D50.
Fig. 4. Details of reinforcement of specimen RE-50.
is the slab thickness. The slabs of the two PT specimens werereinforced with 12.7 mm diameter, seven-wire strands with adesign yield stress of 1861 MPa and 10 mm diameter, deformedreinforcing bars with a design yield stress of 390 MPa. Materialproperties measured for the concrete, the reinforcing bars, andthe seven-wire strand are summarized in Table 2, and theassociated stress–strain relations are shown in Fig. 5.
One PT specimen (PE-B50) contained banded tendons inthe direction of the applied loads and distributed tendons inthe other direction, whereas the other PT specimen (PE-D50)has an opposite tendon layout (Fig. 4). One RC specimen wasconstructed for a comparison of cyclic behavior between theRC and PT exterior connections with a similar level of gravityshear stress (Vg/φVc ≈ 0.5, where φ = 0.75). For the non-

S.W. Han et al. / Engineering Structures 28 (2006) 1983–1996 1987
Table 1Properties of specimens
Mark c1 = c2(mm)
h(mm)
(l1/2)
(cm)h1(cm)
dĎ
(mm)ρp(%)
ρs,top(%)
ρs,bottom(%)
f ′c
(MPa)f pc(MPa)
Vg(kN)
Vc(kN)
(Vg/Vc)
(kN)θy(%)
θu(%)
Presentstudy
PE-B50 300 130 240 210 110 0.64 0.61 0.23 32.3 1.21 84.2 248 0.34 1.7/−0.8 4.3/−3.3PE-D50 300 130 240 210 110 0.21 0.61 0.23 32.3 1.21 80.2 248 0.32 1.1/−0.6 2.7/−4.3RE-50 300 130 180 210 110 N.A. 1.24 0.31 32.3 N.A. 86.8 233 0.37 0.9/−1.1 2.4/−2.5
Foutchet al.(1990)
S1 305 102 137 203 84 0.89 0.69 0.23 50.3 4.49 309 58 0.19 −1.3 −4.5S2 305 102 137 203 84 0.89 0.69 0.23 42.7 4.77 303 83 0.28 −1.3 −3.8S3 305 102 137 203 84 0.25 0.69 0.23 42.1 1.79 220 67 0.31 −1.3 −5.0S4 305 102 137 203 84 0.25 0.69 0.23 48.3 1.82 233 114 0.49 −1.2 −2.1
Martinez(1993)
E1 195 92 187 160 74 0.93 0.55 0.00 33.1 1.38 114 40 0.35 No Y. −3.9a
E2 195 92 187 160 74 0.23 0.55 0.00 31.7 1.45 112 38 0.34 No Y. −3.8a
h: Slab thickness. (l1/2): Half of one slab span length in the direction normal to the slab edge (see Fig. 2). h1: Story height. dĎ Effective depth (dps ) of tendons inthe direction parallel to the slab edge (PT), average of effective depths in both directions (RC). ρ: Ratio of tendons (p) or top/bottom rebars (s, top/s, bottom) inthe slab within c2 + 3h. No Y.: No yielding of slab reinforcement.
a Vector drift ratio at punching. e.g., PE-B50; (P)—PT, (E)—Exterior, (B)—Banded, (50) − Vg/φVc ∼ 0.50 (φ = 0.75).
Table 2Properties of materials
Concrete
f ′c εo Esec (MPa)
32.3 (MPa) 0.00185 29,600
Steel rebar
db fy (MPa) εy Es (MPa) fu (MPa) εu
10 mm 466 0.0024 193,166 698 0.124525 mm 465 0.0027 172,222 584 0.0819
SWPC 7B strand
dps fy (MPa) εy Es (MPa) fu (MPa) εu
16 mm 1,555 0.0098 182,223 1,751 0.0049
f ′c : Mean compressive concrete strength at the time of testing. Esec: Secant concrete modulus of elasticity at 0.45 f ′
c . fy : Yield stress, fu : Ultimate stress. εo: Meanstrain at peak concrete strength, εy : Yield strain, εu : Ultimate strain. db or dps : Rebar or strand diameter. Es : Steel modulus of elasticity.
Fig. 5. Stress–strain relations of representative materials.
participating frame, shear reinforcement at the slab–columnconnections was not required according to ACI 318-02 [18].It is noted that the specimens were designed and built prior to
2005, when the provision for ‘Frame members not proportionedto resist forces induced by earthquake motions’ was changedto clarify the need for shear reinforcement at slab–column
1988
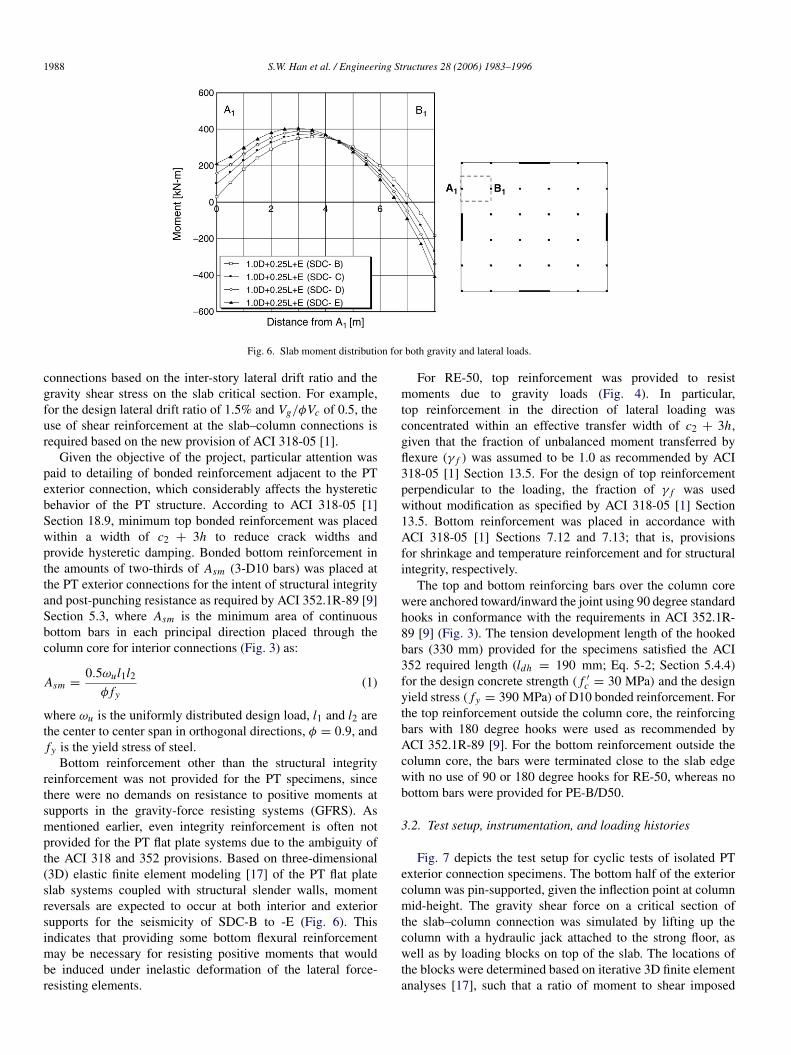
S.W. Han et al. / Engineering Structures 28 (2006) 1983–1996Fig. 6. Slab moment distribution for both gravity and lateral loads.
connections based on the inter-story lateral drift ratio and thegravity shear stress on the slab critical section. For example,for the design lateral drift ratio of 1.5% and Vg/φVc of 0.5, theuse of shear reinforcement at the slab–column connections isrequired based on the new provision of ACI 318-05 [1].
Given the objective of the project, particular attention waspaid to detailing of bonded reinforcement adjacent to the PTexterior connection, which considerably affects the hystereticbehavior of the PT structure. According to ACI 318-05 [1]Section 18.9, minimum top bonded reinforcement was placedwithin a width of c2 + 3h to reduce crack widths andprovide hysteretic damping. Bonded bottom reinforcement inthe amounts of two-thirds of Asm (3-D10 bars) was placed atthe PT exterior connections for the intent of structural integrityand post-punching resistance as required by ACI 352.1R-89 [9]Section 5.3, where Asm is the minimum area of continuousbottom bars in each principal direction placed through thecolumn core for interior connections (Fig. 3) as:
Asm =0.5ωul1l2
φ fy(1)
where ωu is the uniformly distributed design load, l1 and l2 arethe center to center span in orthogonal directions, φ = 0.9, andfy is the yield stress of steel.
Bottom reinforcement other than the structural integrityreinforcement was not provided for the PT specimens, sincethere were no demands on resistance to positive moments atsupports in the gravity-force resisting systems (GFRS). Asmentioned earlier, even integrity reinforcement is often notprovided for the PT flat plate systems due to the ambiguity ofthe ACI 318 and 352 provisions. Based on three-dimensional(3D) elastic finite element modeling [17] of the PT flat plateslab systems coupled with structural slender walls, momentreversals are expected to occur at both interior and exteriorsupports for the seismicity of SDC-B to -E (Fig. 6). Thisindicates that providing some bottom flexural reinforcementmay be necessary for resisting positive moments that wouldbe induced under inelastic deformation of the lateral force-resisting elements.
For RE-50, top reinforcement was provided to resistmoments due to gravity loads (Fig. 4). In particular,top reinforcement in the direction of lateral loading wasconcentrated within an effective transfer width of c2 + 3h,given that the fraction of unbalanced moment transferred byflexure (γ f ) was assumed to be 1.0 as recommended by ACI318-05 [1] Section 13.5. For the design of top reinforcementperpendicular to the loading, the fraction of γ f was usedwithout modification as specified by ACI 318-05 [1] Section13.5. Bottom reinforcement was placed in accordance withACI 318-05 [1] Sections 7.12 and 7.13; that is, provisionsfor shrinkage and temperature reinforcement and for structuralintegrity, respectively.
The top and bottom reinforcing bars over the column corewere anchored toward/inward the joint using 90 degree standardhooks in conformance with the requirements in ACI 352.1R-89 [9] (Fig. 3). The tension development length of the hookedbars (330 mm) provided for the specimens satisfied the ACI352 required length (ldh = 190 mm; Eq. 5-2; Section 5.4.4)for the design concrete strength ( f ′
c = 30 MPa) and the designyield stress ( fy = 390 MPa) of D10 bonded reinforcement. Forthe top reinforcement outside the column core, the reinforcingbars with 180 degree hooks were used as recommended byACI 352.1R-89 [9]. For the bottom reinforcement outside thecolumn core, the bars were terminated close to the slab edgewith no use of 90 or 180 degree hooks for RE-50, whereas nobottom bars were provided for PE-B/D50.
3.2. Test setup, instrumentation, and loading histories
Fig. 7 depicts the test setup for cyclic tests of isolated PTexterior connection specimens. The bottom half of the exteriorcolumn was pin-supported, given the inflection point at columnmid-height. The gravity shear force on a critical section ofthe slab–column connection was simulated by lifting up thecolumn with a hydraulic jack attached to the strong floor, aswell as by loading blocks on top of the slab. The locations ofthe blocks were determined based on iterative 3D finite elementanalyses [17], such that a ratio of moment to shear imposed

S.W. Han et al. / Engineering Structures 28 (2006) 1983–1996 1989
Fig. 7. Overview of test specimen and setup.
Fig. 8. Loading histories.
on the connection was similar to that expected in the prototypebuilding. A load cell was installed between the pin and the jackto measure axial force (i.e., direct shear force transferred fromthe slab to the column).
An actuator with a capacity of 250 kN was used to displacethe top of the exterior column, and rigid steel bars with pinsat both ends were installed to support a half-span slab at twocorner points (Fig. 7). Based on an elastic 3D finite elementanalysis [17], boundary conditions of the pin supports at thetwo corner points of the isolated specimens produced a similarmoment distribution to that of the prototype building. As shownin Fig. 8, monotonically increasing drift ratios (0.2% to 6%)were applied, with three cycles at each displacement level.Lateral displacements at the top and bottom of the columnswere measured by LVDTs, and a lateral force applied to thecolumn top, as well as axial and shear forces at the slab cornerpoints, were monitored using load cells. Strain gauges wereattached on selected slab bonded reinforcing bars to monitorstrains on reinforcing bars, whereas donut-shaped load cellswere mounted on unbonded tendons to measure the tendon
forces throughout the testing as well as the changes in thetendon forces during cyclic loading.
4. Test results
4.1. Damage observation
After placing blocks on the slab and lifting up the columnbottom, each specimen had an approximately 0.35(Vg/φVc)
with φ = 1.0. With this level of gravity shear, hairlinecracks on the slabs around the columns were observed. Asthe applied lateral loading was increased, the cracks wereenlarged. The pattern and degree of cracking and damagearound the slab–column connections were different dependingon the tendon layout (PE-B50 versus PE-D50) and the presenceof post-tensioning tendons (PE versus RE) (Fig. 9).
For the specimen PE-B50, flexural cracks parallel to thelateral loading were formed from the slab–column interfaceto the slab end at a drift ratio of 0.2%. Torsional cracks at45 degree angles were first observed at 0.75% drift ratio. Forincreasing lateral drifts, the width of the cracks increased;however, significant flexural cracking transverse to the loadingshas not been observed until a drift ratio of 1.2%. At 1.2%drift, severe transverse flexural cracks with about 70 cm lengthswere developed near the front face of the column, formingtrapezoidal crack patterns around the column. At a lateral driftof 3.3% when abrupt punching occurred, a critical section hasformed at approximately 20 mm far from the column front face.This section was part of the truncated cone that was torn apartfrom the slab. The truncated cone was fairly large relative tothat observed for RE-50, and the damage on the transverse slabswas observed outside the region containing the banded post-tensioning (Fig. 9).

1990 S.W. Han et al. / Engineering Structures 28 (2006) 1983–1996
Fig. 9. Damage observation.
For the specimen PE-D50, flexural cracks parallel to theloadings propagated across the span at a drift ratio of 0.6%,whereas flexural cracks perpendicular to the loadings with alength of 130 cm have formed at 0.8%–1.2% drifts. Torsionalcracks occurred at 1.5% drift, developing trapezoidal yieldlines consisting of torsional and flexural yield lines aroundthe connection. From 1.5% to 6.0% drifts, deteriorationwas concentrated around the connections, particularly on thetransverse slabs. Overall, the damage was slow and progressive,and the torsional damage was most significant (Fig. 9). Thisindicates that PE-D50 failed in torsion- and flexure-dominatedmodes.
For the specimen RE-50, minor flexural cracks parallelto the lateral loads as well as hairline torsional cracksoccurred prior to applying lateral displacement. As the appliedlateral displacement was increased, the cracks were magnified.Significant torsional cracks with 45 degree angles weredeveloped near the column and were extended to 60 cm awayfrom the corner of the column; however, there was no damageoutside of the farthest extent of the torsional cracks. Due tocyclic loading, opening and closing of the cracks within thetrapezoidal yield-line regions were repeated, resulting in severedisintegration of the slab around the column. At 2.5% drift,abrupt punching occurred (i.e., slab dropping) and a relativelysmall truncated cone remained attached to the column afterfailure.
4.2. Unbalanced moment due to lateral load versus drift ratiorelations
The specimens PE-B50, PE-D50, and RE-50 were gravity-loaded such that the gravity shear forces (Vg) were maintained
as approximately 50% of the factored shear strength (φVc) withφ = 0.75, followed by being subjected to lateral deformations.Fig. 10 depicts measured unbalanced moment due to lateralload (Mub,L) versus drift ratio relations for the specimens.The unbalanced moment (Mub,L) was obtained as the appliedlateral load times a scaled column height (h1) of 2.1 m(Fig. 2). The drift ratio was determined using the relative lateraldisplacement between the column top and bottom, divided bythe distance between two measured points. In Fig. 10, thehysteresis loops are plotted, along with the backbone curvesfor drift directions at which first punching occurred, as wellas its idealized bilinear relations used to define the drift ratiosat yielding (θy) and the ductility as proposed by Pan andMoehle [3]. The drift ratio at punching (θu) was taken as thedrift ratio at which the moment transfer abruptly began todegrade (for PE-B50 and RE-50) or 20% of the peak value ofMub,L was lost if the degradation was gradual (for PE-D50).Both positive and negative values of θy and θu correspondingto the positive and negative slab bending, respectively, areindicated in Table 1, since the hysteretic curves of the PT andRC exterior connection specimens are asymmetric.
For all specimens, nonlinear responses associated withyielding of slab bonded reinforcement were observed, includinga sudden drop of the moment capacity (i.e. punching failure).Fig. 10 reveals that the PT specimens were subjected todrift levels of approximately 4% prior to punching failures.For PE-B50 and PE-D50, the peak moments due to lateralloading (M−
ub,L) combined with the gravity moments (M−
G )
were close to the values of M−
n, f s , indicating that punchingdid not occur prior to reaching the flexural capacity of theslab over the full width. For RE-50, the peak value of

S.W. Han et al. / Engineering Structures 28 (2006) 1983–1996 1991
Fig. 10. Unbalanced moment due to lateral load versus drift ratio.
unbalanced moment (M−
ub,L + M−
G ) was not reached at M−
n, f s ,
but exceeded M−
n,c+3h . After yielding of the slab (bonded)reinforcement, the hysteretic dissipation and the loss of stiffnesswere apparent for PE-B/D50, whereas results for RE-50 revealearly punching failure (at approximately 2.5% drift) comparedto PE-B/D50. Based on the hysteretic curves, the presence oftendons (PE versus RE) and the pattern of tendon distribution(PE-B50 versus PE-D50) influenced hysteretic responses of thespecimens to lateral loads (e.g., the lateral load strength, thepost-yield behavior, and the lateral deformability and ductility).Detailed comparative studies of the impact of these parameterson the lateral load responses are discussed in the followingsection.
5. Comparative studies
5.1. Banded tendon arrangement versus distributed tendonarrangement
Based on observed damage and data assessment, thetendon layout significantly influenced failure mechanism andhysteretic behavior of the PT exterior connections. As shownin Fig. 9, crack patterns and apparent damage after punchingwere quite different between the specimens PE-B50 and PE-D50. For the specimen PE-B50, the significant punchingdamage was concentrated at the column front face. The bandedpost-tensioning tendons provided sufficient in-compressionforces to suppress torsional cracks on the transverse sidesof the connection, resulting in the increase of the torsionalrigidity. The increased rigidity induced rather brittle punchingfailure compared to PE-D50 which had no tendons near thecolumn in the loading directions. On the other hand, severedamage on the transverse slabs (i.e., torsional deterioration)was observed for PE-D50. The specimen PE-D50 eventuallyfailed in flexure, resulting in higher lateral drift capacity(corresponding to negative bending) than was achieved for PE-B50. The difference in the failure mechanism depending onthe tendon layout noted in these tests is consistent with priorfindings [13,14]. For example, in the test program conducted
by Foutch et al. [13], one specimen having concentration oftendons in the column regions exhibited the local failure at thefront of the column followed by significant concrete crushing,whereas the other specimen having an opposite tendon layoutdid not undergo such concrete crushing.
The values of the secant lateral load stiffness for PE-B50 and PE-D50 at a drift ratio of 0.6% were approximately75% and 45% of the initial stiffness (at a drift ratio of0.2%), respectively. The reduced stiffness degradation was alsonoted for the banded specimens tested by Foutch et al. [13]and Martinez-Cruzado [14]. Although the banded tendonsincreased initial stiffness, accumulated hysteretic energy forPE-B50 (21.0 kN m) was not as good as that obtained forPE-D50 (32.2 kN m). Furthermore, lateral load degradationafter punching was larger for PE-B50 than for PE-D50(Fig. 10), which is consistent with prior test results presentedby Martinez-Cruzado [14]. The relatively poorer hystereticresponses for the banded exterior connections (versus thedistributed exterior connections) were due to the higher localpressure around the column. Note that six tendons wereprovided within the effective transfer width of c2 + 3h for PE-B50, whereas two tendons were placed within c2 + 3h for PE-D50 (Fig. 3). Based on the cyclic tests described herein and theprior test results of PT exterior connections having distributedor banded tendons in loading direction, it is concluded thatthe PT exterior connection with a ‘distributed’ tendon layout issuperior in the lateral drift capacity (corresponding to negativebending), in the hysteretic energy dissipation capacity, and inthe post-punching resistance to the PT exterior connection witha ‘banded’ tendon layout, although the stiffness and the strengthtend to be somewhat reduced.
5.2. Uniaxial lateral loading versus biaxial lateral loading
Pan and Moehle [19] has reported that the lateral stiffness,strength, and drift capacity of reinforced concrete (RC)slab–column connections were reduced due to biaxial loading(versus uniaxial loading). In this study, the impact of biaxialloading on the lateral responses of PT exterior connectionsis evaluated using the test results from PE-B/D50 and prior

1992 S.W. Han et al. / Engineering Structures 28 (2006) 1983–1996
Fig. 11. Comparisons between uniaxial and biaxial loading tests.
results reported by Martinez-Cruzado [14]. Fig. 11 presents thecomparison of the hysteresis loops measured in the directionperpendicular to the slab edge under uniaxial (E1 and E2 ofMartinez-Cruzado [14]) and biaxial (PE-B/D50) lateral loadingconditions. The arrangement of banded tendons in the directionnormal to the slab edge and distributed tendons in the otherdirection was used for E1 and PE-B50 (vice versa for E2 andPE-D50). It is noted that the gravity shear ratios (Vg/φVc; φ =
1.0) for E1 and E2 lie within similar range as those used forPE-B/D50 (Table 1).
Since different scale factors were applied, the unbalancedmoments for E1 and E2 were scaled by (1.4)2 based on thesimilitude requirements. As well, the as-reported drift valuesfor E1 and E2 were modified by −1 to be consistent with themoment–drift curves for PE-B/D50. As shown in Fig. 11, therewere no significant discrepancies in the lateral stiffness andstrength of the PT exterior connections between under uniaxialand biaxial loadings. Although peak drifts in the directionnormal to the slab edge for E1 and E2 were 50% and 55% ofthose for PE-B50 and PE-D50, respectively, very large drifts inthe other direction were observed prior to punching, resultingin the ‘vector’ drift ratios at punching for E1 and E2 similarto those for PE-B/D50 (Table 1). Based on the comparison ofthe moment–drift relations, the capacity to dissipate the energyappears to be less for E1 and E2 than for PE-B50 and PE-D50,respectively. The reduced hysteretic energy dissipation capacityfor E1 and E2 might be caused by biaxial lateral loading, as wellas by the absence of bottom bonded reinforcement in specimensE1 and E2. Consequently, there was no clear evidence of theeffect of biaxial loading conditions on the lateral stiffness,strength, and drift capacity of PT exterior connections.
5.3. With bottom reinforcement versus without bottom rein-forcement
As discussed earlier, when a PT exterior connection issubjected to reversed-cyclic loading, positive moment atthe connection is anticipated. Thus, use of bottom bonded
Fig. 12. Strains in bonded slab reinforcement versus drift ratio.
reinforcement is necessary. However, there are no provisionsconcerning bottom reinforcement to resist moment reversalsthat may occur at PT slab–column connections. In this study,PE-D50 and PE-B50 included the structural integrity (bottom)reinforcement through the column in both directions as requiredby ACI 352 Committee Report [9].
Due to the gravity moments (M−
G ), top and bottom bondedreinforcement were in tension and compression, respectively,near at the slab–column connections (Fig. 12). As a lateraldrift increased, stresses in the bottom reinforcement changedfrom negative to positive values (i.e., moment reversal) at

S.W. Han et al. / Engineering Structures 28 (2006) 1983–1996 1993
Fig. 13. Gravity shear ratio versus drift ratio at punching (exterior slab–columnconnections).
0.4% and 0.6% drifts for PE-B50 and PE-D50, respectively.At a drift ratio of 2.5%, the bottom reinforcement reachedto the yield strains of 0.0025 for both PT specimens. Theseresults indicate that the bottom reinforcement provided for thespecimens was effective in resisting the positive moments thatoccurred at relatively low lateral drifts (0.4%–0.6%) and itsquantity was sufficient since yielding of the bottom bars hasnot occurred until 2.5% drifts (note that a typical allowabledesign drift ratio is 1.5%). For the PT exterior connectionswithout bottom bonded reinforcement [14], limited hystereticbehavior was observed (Fig. 11). This may be in part due tothe nonexistence of bottom reinforcement. As a result, concretespalling and damage on the bottom surface of the slab weremore severe and extensive than noted on the top surface.Based on the results from the specimens with and withoutbottom reinforcement, it is recommended that bottom bondedreinforcement be provided, in amounts specified for structuralintegrity by ACI 352.1R-89 [9], to resist positive moments thatare expected to occur for the PT exterior connections of theGFRS under inelastic deformations.
5.4. PT versus RC
Kang [7] has reported that drift capacities at punching ofPT slab–column connections were higher than those of RCslab–column connections for a given gravity shear ratio andthat the drift values for interior and exterior connections werereasonably consistent. As well, within the program, higherlateral drifts were reached for PE-B/D50 compared to RE-50(Table 1). Since RE-50 failed in punching shear at lower driftratio, the accumulated dissipated energy was only 45% and30% of those for PE-B50 and PE-D50, respectively. It is notedthat PE-B/D50 and RE-50 have the same boundary and loadingconditions, and relatively similar gravity shear ratios (Table 1).Fig. 13 shows that the test specimens achieved similar driftlevels prior to punching to the averages of the prior test results.Since there are very limited existing data on reversed-cyclictests of RC and PT exterior connections, the trend lines forRC interior connections and for all PT connection types were
used to compare with the results from RE-50 and PE-B/D50,respectively.
Two reasons appear to contribute to the larger drift valuesobtained for the PT exterior connections. First, larger slab span-to-thickness ratios (l1/h; Table 1) are used in PT flat plateconstruction, providing more flexibility, relative to RC flat plateconstruction [7,8]. Second, the in-plane compression forces( f pc) tend to increase the shear strength on the connectioncritical section (i.e., decrease of the gravity shear ratio). Basedon the relationship noted in Fig. 13, the decreased gravityshear ratios due to typical f pc values (1.0–1.4 MPa) lead tothe increase in the drift capacity of approximately 0.5%. Moredetailed studies of the effect of the span-to-thickness ratio(l1/h) and the in-plane compression forces ( f pc) on the driftcapacity at punching are provided by Kang [7].
6. Shear and flexural strengths of PT exterior connections
6.1. Shear strength of PT exterior connections
The compression forces due to post-tensioning ( f pc)
enhance shear strength of PT ‘interior’ connections [1];however, for PT exterior connections, the effect of f pc onshear strength is uncertain. For this reason, ACI 318-05 [1](R11.12.2.2) recommends that the shear strengths of both RCand PT ‘exterior’ connections be the same. However, priorresearchers [11–14] suggested that the shear strength of thePT ‘exterior’ connection appeared to be influenced by the in-plane compression forces ( f pc). Indicated in Table 3 are themaximum shear stress demands (νu ; column ¬) and the shearstress capacities with and without considering f pc (νc; columns and ®) for the cyclic tests and the prior tests. For calculationof the values in column ¬ of Table 3, the eccentric shear stressmodel was used in accordance with ACI 318-05 [1] as follows:
νu =Vu
bod±
γv,x Mu,ub,x c
Jc,x±
γv,y Mu,ub,yc
Jc,y(2)
γv = 1 −1
1 +23
√b1b2
(3)
where Vu is the gravity force to be transferred from the slabto the column, Mu,ub is the unbalanced moment acting aboutthe centroidal axis of critical section, γv is the portion ofMu,ub transferred by eccentric shear, c is the diameter fromthe centroid of the critical section to the perimeter criticalsection, Jc is the property of assumed critical section analogousto polar moment of inertia, bo is the perimeter of the criticalsection, d is the effective slab depth, b1 is the width of thecritical section parallel to loading direction, and b2 is thewidth of the critical section transverse to b1. In particular, forthe specimens of Martinez-Cruzado [14] subjected to biaxiallateral loading, the shear stress demands νu were derivedusing unbalanced moments in x- and y-directions (Mu,ub,x andMu,ub,y) monitored when punching occurred.
All available existing data on PT exterior connectionswere compiled in Fig. 14, consisting of results for isolatedconnection specimens [13,14,16] and results for exterior

1994 S.W. Han et al. / Engineering Structures 28 (2006) 1983–1996
Table 3Shear strength of post-tensioned exterior slab–column connections
Mark νu(MPa)¬
νc,1(MPa)
νc,2(MPa)®
νu/νc,1¯ = ¬/
νu/νc,2° = ¬/®
Presentstudy
PE-B50 3.01 2.01 1.89 1.49 1.59PE-D50 3.04 2.01 1.89 1.51 1.61RE-50a 3.28 N.A. 1.95 N.A. 1.68
Foutchet al.(1990)
S1 3.92 3.40 2.36 1.15 1.66S2 3.15 3.33 2.18 0.95 1.45S3 2.54 2.42 2.16 1.05 1.18S4 2.75 2.52 2.32 1.07 1.19
Martinez(1993)
E1 3.80 2.02 1.92 1.88 1.98E2 3.85 2.08 1.88 1.85 2.05
Gardner et al. (1998) 3.15 2.97 2.21 1.06 1.43
Kosutet al.(1985)
2 2.25 1.88 1.74 1.20 1.296 2.46 1.87 1.74 1.32 1.418 2.77 1.87 1.74 1.48 1.59
T&HĎ 2 1.61 1.97 1.55 0.82 1.04
LongandCleland(1993)
E1 2.78 2.52 2.08 1.10 1.34E2 4.11 2.53 2.10 1.62 1.96E3 4.94 2.88 2.09 1.72 2.36E4 3.32 2.18 2.10 1.15 1.58E5 4.60 2.45 2.00 1.88 2.30
T&HĎ Trongtham and Hawkins (1977). N.A.: Not available. νu = Maximumshear stress at the critical section caused by measured shear (Vu) andunbalanced moment (Mu,ub). νc,1 = 0.29
√f ′c + 0.3 f pc (MPa). νc,2 =
(1/3)√
f ′c (MPa). f pc = Average effective compressive stress in concrete.
a RC exterior connection.
Fig. 14. Shear strength of post-tensioned exterior slab–column connections.
connections in part of multiple bay subassemblies [11,12,20].Only the results from Burns and Hemakom [21] were excludedfrom this database, since the reported values did not accountfor the contribution of unbalanced moments transferred byeccentric shear. By comparing the demands and the capacities(Table 3; Fig. 14), it is concluded that the compression forcescontribute to the shear stress capacity of the PT exteriorconnection, and that the shear stress capacity was predictedbetter using the equation used for PT interior connections(columns in Table 3) than that used for RC interior or exteriorconnections (columns ® in Table 3).
6.2. Flexural strength of PT exterior connections
Flexural strength of a post-tensioned slab at the exteriorconnection (M±
n ) is determined based on the stress at ultimatein unbonded tendons ( f ps) and the yield stress of reinforcingbars ( fy) as follows:
M±n = Aps f ps
(dp −
a
2
)+ As fy
(ds −
a
2
)(4)
and according to ACI 318-05 [1] (Eq. 18-5), the ultimate stressof f ps is taken as:
f ps = fse + 70 +f ′c
300ρpMPa (5)
where Aps is the total area of tendons, dp is the effective depthof tendons, As is the total area of boned reinforcement, ds isthe effective depth of bonded reinforcement, a is the depthof equivalent stress block, fse is the effective stress in theunbonded tendon, and ρp is the ratio of tendons. The value off ps can not be taken greater than the yield stress of tendonsor ( fse + 200) MPa. Since unbonded tendons slip with respectto concrete, the stress increments caused by tendon elongationand friction are quite small compared to those for bondedreinforcement.
For the specimens PE-B50 and PE-D50, the stresses in theunbonded tendons gradually increased from the effective stress( fse) for increasing lateral drifts. Maximum values of ∆ f ps,LCmeasured using load cells were equal to approximately 85% ofthose calculated using (5) and the measured fse. These resultsindicate that the predicted flexural strengths using (4) and (5)are unconservative, although differences are modest.
Fig. 10 allows direct comparisons of the peak unbalancedmoments and the nominal flexural strengths determined usingas-measured material properties including ∆ f ps,LC for bothnegative and positive bending (M−
n, f s and M+
n, f s). The dottedlines that represent the flexural strengths were shifted to reflectthe moments due to gravity loads (M−
G ). As illustrated inFig. 10(a) and (b), flexural yielding is dominant for negativebending and the full negative flexural strengths were reachedfor PE-B50 and PE-D50. Based on the comparisons betweenthe peak negative moments at the column face (M−
u ; column¬ of Table 4) and the negative flexural strengths (M−
n, f s)
(columns and ® of Table 4), it is concluded that PE-B/D50and the specimens tested by Foutch et al. [13] essentially failedin flexure, followed by punching failures. For the specimenstested by Martinez-Cruzado [14], the full flexural capacities ofthe slabs were not reached, since premature punching failuresoccurred due to a lack of hysteretic damping.
7. Conclusions
Based on the experimental studies, the following conclu-sions were reached:
(1) The PT specimens (PE-B50 and PE-D50) achieved fullflexural capacity prior to punching, whereas the RCspecimen (RE-50) failed in a punching shear mode beforethe full flexural capacity was reached. As a result, PE-B50

S.W. Han et al. / Engineering Structures 28 (2006) 1983–1996 1995
Table 4Flexural strength of post-tensioned exterior slab–column connections
Mark M−u M−
n, f s M−
n, f s,aci M−u /M−
n, f s M−u /M−
n, f s,aci(kN m) (kN m) (kN m)¬ ® ¯ = ¬/ ° = ¬/®
Present studyPE-B50 66.7 67.0 62.8 0.99 1.06PE-D50 66.9 66.0 62.0 1.01 1.08RE-50a 73.1 85.7 72.3 0.85 1.10
Foutch et al. (1990)
S1 58.6 50.9 48.4 1.15 1.21S2 50.2 50.1 48.7 1.00 1.03S3 40.4 32.0 29.4 1.20 1.37S4 35.8 32.4 30.4 1.11 1.18
Martinez (1993)E1 27.0 31.1 30.9 0.87 0.87E2 24.4 33.4 31.9 0.73 0.76
Mu = Applied moment normal to slab edge at the slab–column interface based on measured shear (Vu) and unbalanced moment (Mu,ub). Mn, f s : Flexural negativemoment capacity of slab over full slab width calculated based on as-measured material properties and ∆ f ps,LC . Mn, f s,aci : Flexural negative moment capacity ofslab over full slab width calculated based on design material properties and ACI 318-05.
a RC exterior connections.
and PE-D50 achieved lateral drift ratios of approximately4% with modest strength degradation; however, RE-50 lostall moment transfer capacity beyond a drift ratio of 2.5%.Similar gravity shear stress ratio on the connection wasapplied for both the PT and RC specimens. Based on theseresults as well as previous test results, it is concluded thathigher drift ratios for PT exterior connections are obtainedcompared to RC exterior connections for a given gravityshear ratio. The higher drift ratios in PT connections werein-part due to the larger slab span-to-thickness ratios (l1/h)
than that commonly used for RC flat plate construction andhigher in-plane compression forces ( f pc) that increase theshear strength of the PT exterior connection.
(2) Based on the test results, the PT exterior connectionwith distributed tendon layout (PE-D50) was superior inlateral drift capacity (corresponding to negative bending),in hysteretic energy dissipation capacity, and in post-punching resistance to the PT exterior connection withbanded tendon layout (PE-B50). The specimen PE-B50experienced flexural yielding of slab bonded reinforcement,followed by abrupt punching failure, forming a relativelylarge critical section. On the other hand, PE-D50 failed inflexure in a ductile fashion, particularly deteriorating thetransverse slabs.
(3) For different loading conditions, there was no clearevidence of the effect of biaxial loading conditions on thelateral stiffness, strength, and drift capacity of PT exteriorconnections. The hysteretic energy dissipation capacitymight be reduced due to biaxial lateral loading (versusuniaxial lateral loading) as well as due to the absence ofbottom bonded reinforcement in specimens E1 and E2.
(4) Bottom bonded reinforcement provided for PE-B50 andPE-D50 as specified by ACI 352.1R-89 [9] was effectivein resisting positive moments in the slabs that occurredduring the cyclic tests, whereas the PT exterior connectionswithout bottom bonded reinforcement (E1 and E2) showedlimited hysteretic damping and suffered severe concretespalling and damage on the bottom surface of the slabs.These results indicate that the bottom bonded reinforcement
should be provided to resist moment reversals that mayoccur for the PT gravity systems in regions of highseismicity. However, the amount specified for structuralintegrity by ACI 352.1R-89 [9] is sufficient, since yieldingof bottom bonded reinforcement of PE-B50 and PE-D50has not occurred until a drift ratio of 2.5%.
(5) Shear strength of PT exterior connections is moreaccurately predicted by the shear strength equationconsidering average compressive strength ( f pc) due topost-tensioning tendons than that without considering f pc.Flexural strength of PT exterior connections is reasonablypredicted using the stress increment in unbonded tendonsestimated based on the ACI 318 equation, unless prematurepunching failure would preclude flexural failure.
Acknowledgements
The authors acknowledge the financial support providedby Hanyang University and 2006 KOSEF. Partial support bySRC/ERC (R11-2005-056-04002-0) is also appreciated by theauthors. The views expressed are those of the authors, and donot necessarily represent those of the sponsor.
References
[1] ACI committee 318. Building code requirements for reinforced concrete(ACI 318-05). Farmington Hills (MI): American Concrete Institute; 2005.
[2] Moehle JP. Seismic design considerations for flat-plate construction.In: Wight JK, Kreger ME, editors. ACI Publication SP-162. Mete A.Sozen Symposium. Farmington Hills (MI): American Concrete Institute;1996. p. 430.
[3] International code council. International building code (IBC-03). Whittier(CA); 2003. p. 656.
[4] Pan AD, Moehle JP. Lateral displacement ductility of reinforced concreteflat plates. Struct J, ACI 1989;86(3):250–8.
[5] Robertson IN, Kawai T, Lee J, Enomoto B. Cyclic testing of slab–columnconnections with shear reinforcement. Struct J, ACI 2002;99(5):605–13.
[6] Qaisrani AN. Interior post-tensioned flat-plate connections subjected tovertical and biaxial lateral loading. Ph.D. dissertation. The University ofCalifornia at Berkeley, Department of Civil Engineering; December 1993.p. 303.

1996 S.W. Han et al. / Engineering Structures 28 (2006) 1983–1996
[7] Kang THK. Shake table tests and analytical studies of reinforced and post-tensioned concrete flat plate frames. Ph.D. dissertation. The Universityof California at Los Angeles, Department of Civil and EnvironmentalEngineering; September 2004. p. 309.
[8] Kang THK, Wallace JW. Punching of reinforced and post-tensionedconcrete slab–column connections. Struct J, ACI 2006; (July–August) (inpress).
[9] Joint ACI-ASCE committee 352. Recommendation for design ofslab–column connections in monolithic reinforced concrete structures(ACI 352.1R-89). Farmington Hills (MI): American Concrete Institute;1997.
[10] Joint ACI-ASCE committee 423. Recommendations for concrete mem-bers prestressed with unbonded tendons (ACI 423.3R-96). FarmingtonHills (MI): American Concrete Institute; 1996. p. 19.
[11] Long AE, Cleland DJ. Post-tensioned concrete flat slabs at edge columns.Material J, ACI 1993;90(3):207–13.
[12] Gardner NJ, Kallage MR. Punching shear strength of continuous post-tensioned concrete flat plates. Struct J, ACI 1998;95(3):272–83.
[13] Foutch DA, Gamble WL, Sunidja H. Tests of post-tensioned concreteslab-edge column connections. Struct J, ACI 1990;87(18):167–79.
[14] Martinez-Cruzado JA. Experimental study of post-tensioned flat plateexterior slab–column connections subjected to gravity and biaxial loading.Ph.D. dissertation. The University of California at Berkeley, Departmentof Civil Engineering; December 1993. p. 378.
[15] Kang THK, Wallace JW. Dynamic responses of flat plate systems withshear reinforcement. Struct J, ACI 2005;102(5):763–73.
[16] Trongtham N, Hawkins NM. Moment transfer to columns in unbondedpost-tensioned prestressed concrete slabs. Report SM77-3. Seattle (WA):Univ. of Washington; 1977. p. 186.
[17] MIDAS IT. MIDAS/GENw user’s manual (Version 6.3.2). Seoul, Korea;2004.
[18] ACI committee 318. Building code requirements for reinforced concrete(ACI 318-02). Farmington Hills (MI): American Concrete Institute;2002.
[19] Pan AD, Moehle JP. An experimental study of slab–column connections.Struct J, ACI 1992;89(6):626–38.
[20] Kosut GM, Burns M, Winter CV. Test of four-panel post-tensioned flatplate. ASCE, J Struct Eng 1985;111(8):1916–29.
[21] Burns NH, Hemakom R. Test of post-tensioned flat plate with bandedtendons. ASCE, J Struct Eng 1985;111(9):1899–915.