Embed Size (px)
Citation preview
Hypothesis Testing
Dhon G. Dungca, PIE, M.Eng’g.

Hypothesis Testing
• Hypothesis – is an assumption about a population or an assertion about the possible value of a population parameter.
• Hypothesis Testing – is a statistical process of determining whether a hypothesis made is reasonable or not, based upon sample evidence.

Hypothesis Testing
• Example:– Hypothesis : “The mean of a population is 50”– Test: We decide to take 40 samples and
determine x to test if our hypothesis is valid.

Steps in Hypothesis Testing
• Step 1: Formulate the Null Hypothesis– Denoted by H0
– Is the hypothesis we hope to reject
– This is the hypothesis used for testing and is the starting point of the testing process
– Must always express the idea of a no significant difference or relationship
– It is a precise statement of equality, such as =10.
– We always first consider that the null hypothesis is true unless proven otherwise by sample evidence.
Steps in Hypothesis Testing
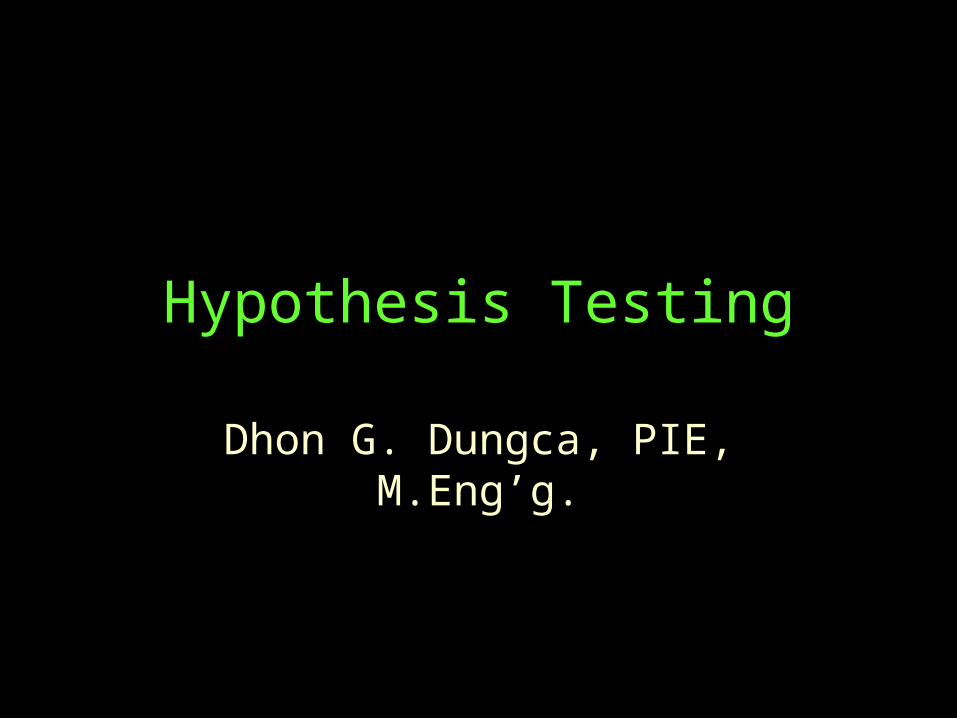
• Assuming k to be any constant, we have the following possible forms of the null hypothesis:– H0 : = K
– H0 : = K
• As a precaution, we never make hypothesis tests regarding the statistic. Hence, the null hypothesis H0 : x = K is not acceptable. We only hypothesize about the value of the population.

Steps in Hypothesis Testing
• Step 2: Formulate the Alternative Hypothesis– Denoted by H1
– Is opposite the null hypothesis– It specifies existence of a difference or a
relationship– The acceptance of H1 would mean that the
difference between the statistic and population parameter hypothesized is too great for us to allow the acceptance of H0.

Steps in Hypothesis Testing
• Assuming k to be any constant, we have the following possible forms of the alternative hypothesis:– H1 : = K– H1 : = K– H1 : < K or H1 : > K– H1 : < K or H1 : > K
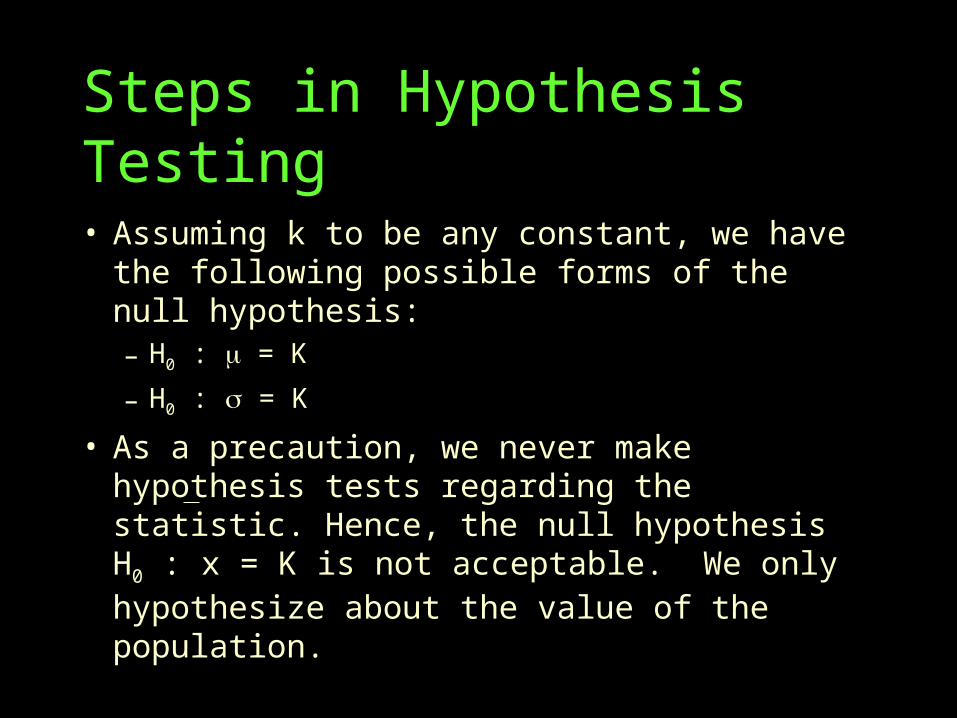
• If H1 is in the form of H1 : = K, we have a two-tailed test.
Steps in Hypothesis Testing
H0: = K
H1: = K
Two-tail Test
H0 is rejected H0 is rejected
H0 is not rejected

Steps in Hypothesis Testing
H0: = K
H1: < K
One-tail Test
H0 is rejected H0 is not rejected

Steps in Hypothesis Testing
H0: = K
H1: > K
One-tail Test
H0 is rejectedH0 is not rejected

Steps in Hypothesis Testing
• Step 3: Specify the level of significance, – Specifies the area within H1 is accepted.
– 1- is the Level of confidence is the Level of significance divides the graph into 2 regions, the region of
the acceptance of H0 and the region of the acceptance of H1 (critical region).
– It is customary to use an of 0.05 or 0.01.
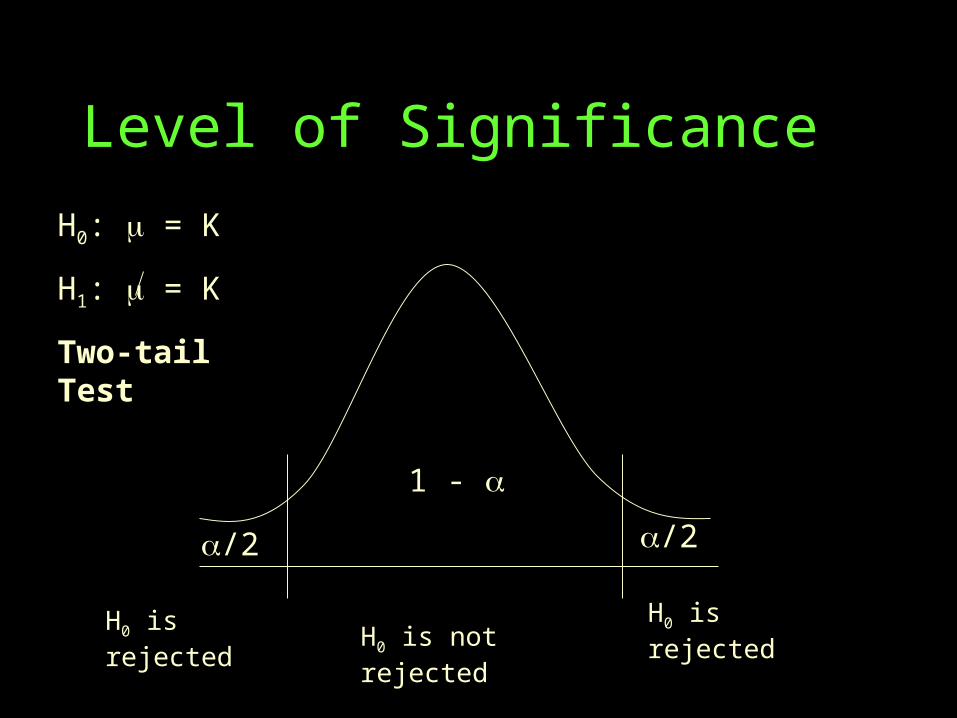
Level of Significance
H0: = K
H1: = K
Two-tail Test
1 -
/2 /2
H0 is not rejectedH0 is rejected H0 is rejected

Level of Significance
H0: = K
H1: < K
One-tail Test
1 -
H0 is rejected H0 is not rejected

Level of Significance
H0: = K
H1: > K
One-tail Test
1 -
H0 is not rejected H0 is rejected

Steps in Hypothesis Testing
• Step 4: Decide which sampling distribution to choose– Determine the appropriate test statistic whose
sampling distribution is known under the assumption that H0 is true.
– Parameter Tested Test Statistic Used z or t x2
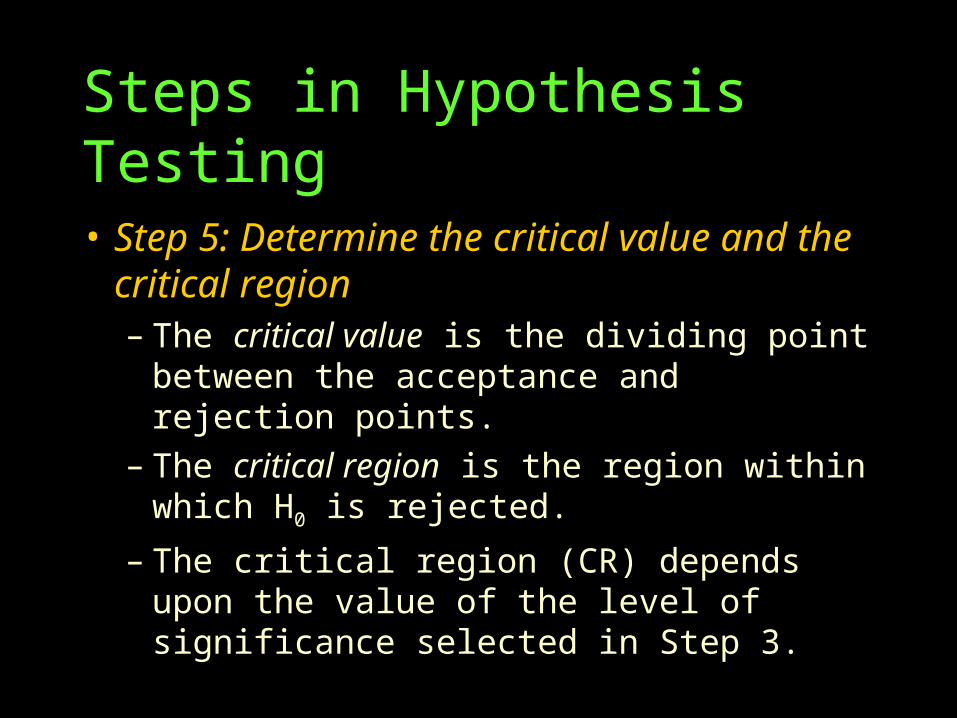
Steps in Hypothesis Testing
• Step 5: Determine the critical value and the critical region– The critical value is the dividing point between
the acceptance and rejection points.– The critical region is the region within which
H0 is rejected.
– The critical region (CR) depends upon the value of the level of significance selected in Step 3.

Critical Regions
H0: = K
H1: = K
Two-tail Test
H0 is rejected H0 is not rejected
1 -
/2 /2
-Z /2 Z 1-/2
CR: Z < -Z /2
Z > Z 1-/2
H0 is rejected

Critical Regions
H0: = K
H1: < K
One-tail Test
H0 is not rejected
1 -
-Z
CR: Z < -Z
H0 is rejected

Critical Regions
H0: = K
H1: > K
One-tail Test
H0 is not rejected
1 -
Z 1-
CR: Z > Z 1-
H0 is rejected
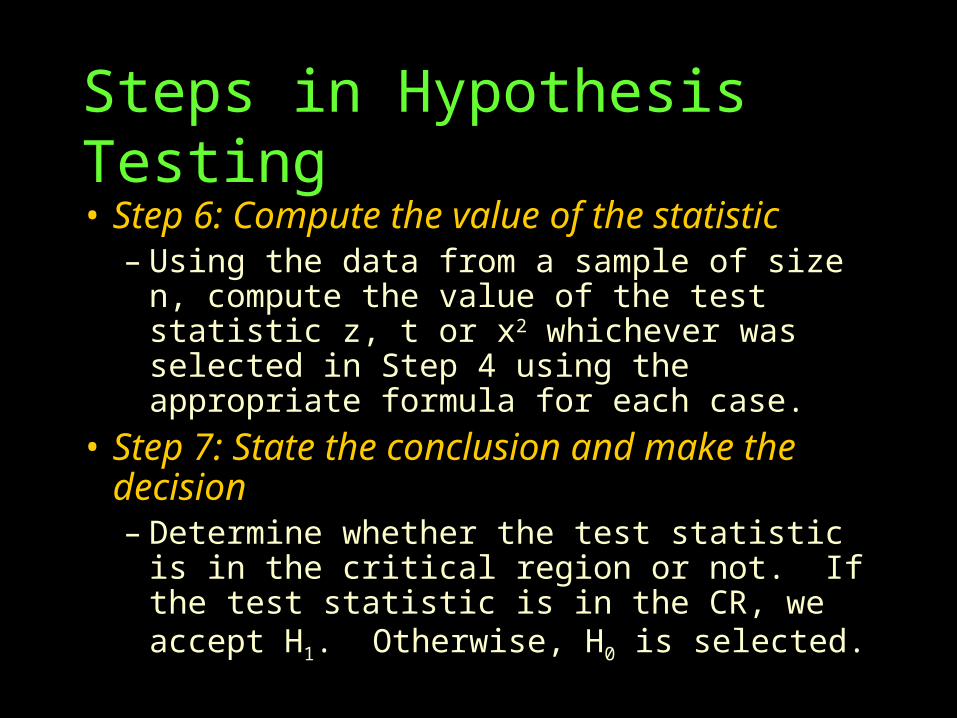
Steps in Hypothesis Testing
• Step 6: Compute the value of the statistic– Using the data from a sample of size n,
compute the value of the test statistic z, t or x2 whichever was selected in Step 4 using the appropriate formula for each case.
• Step 7: State the conclusion and make the decision– Determine whether the test statistic is in the
critical region or not. If the test statistic is in the CR, we accept H1. Otherwise, H0 is selected.

Test of Means
Gives us an indication of the true average of a population.

Test of Means (Summary)
H0: = K
H1: = K, < K or > K
: 0
CR: Z < -Z /2 or Z < -Z or Z > Z 1-
Z > Z 1-/2
t < -t /2 or t < -t or t > t
t > t /2

Test of Means (Summary)
Computations:
Used if n 30
z = x - or z = x -
/ n s / n
Used if n < 30
t = x -
s / n
Conclusion:

Example 1:
• A new process will be installed if its mean processing time is at most 20 minutes. The new procedure was tried. In a random sample of 50 trials, an average processing time of 22.2 minutes with a standard deviation of 4.3 minutes was obtained. At a level of significance =0.05, should the new process be installed?

Answer:H0: = 20 (install the new process)
H1: > 20 (do not install): 0.05CR: z > 1.645Computations:
z = 22.2 – 20 4.3 / 50
= 3.62Conclusion:
Since z is greater than 1.645, we reject H0. We should not install the new process.
1.6453.62
H0 is not rejected H0 is rejected

Example 2:
• A company that makes chocolates claims that the mean weight of a bag of chocolates is 240 grams with a standard deviation of 20.5 grams. Using a 0.05 significance level, would you agree with the company if a random sample of 50 bags of chocolates was found to have a mean weight of 230 grams?

Answer:H0: = 240
H1: 240: 0.05CR: z < -1.96 z > 1.96Computations:
z = 230-240 20.5 / 50
= -3.45Conclusion: Reject Ho. The claim of the manufacturer is not true
1.96-3.45
H0 is accepted
H1 is accepted
-1.96
H1 is accepted

Example 3:
• The Edison Electric Institute has published figures on the annual number of kilowatt-hours expended by various home appliances. It is claimed that a vacuum cleaner expends an average of 46 kilowatt-hours per year. If a random sample of 12 homes included in a planned study indicates that vacuum cleaners expend an average of 42 kilowatt-hours with a standard deviation of 11.9 kilowatt-hours, does this suggest at the 0.05 level of significance that vacuum cleaners expend, on the average, less than 46 kilowatt-hours annually?

Answer:H0: = 46
H1: < 46: 0.05CR: t < -1.796 w/ v = n-1 degrees of freedomComputations:
t = 42 - 46 11.9 / 12
= -1.16Conclusion: Do not reject Ho.
-1.16
H0 is acceptedH1 is accepted
-1.796

Example 4:
• A new process for producing synthetic diamonds can be operated at a profitable level only if the average weight of the diamonds is greater than 0.5K. To evaluate the profitability of the process, 6 diamonds are generated with a mean and a standard deviation of 0.53 and 0.0559 respectively. Do the 6 diamonds’ measurements present sufficient evidence to indicate that the average weight of the diamond produced by the process is in excess of 0.5K?

Answer:H0: = 0.5
H1: > 0.5: 0.05CR: t > 2.015 w/ v = 5 degrees of freedomComputations:
t = 0.53 – 0.5 .0559 / 6
= 1.32Conclusion: Do not reject Ho.
1.32
H0 is accepted
H1 is accepted
2.015

Test of Variance
Gives us the degree of dispersion of the population in consideration

Test of Variance (Summary)
H0: 2 = K
H1: 2 = K, 2 < K or 2 > K
: 0
CR: x2 < x2 1-/2 or x2 < x21- or x2 > x2
x2 > x2/2
Computations:
x2 = (n-1) S2
2
Conclusion:
Accept Ho

Test of Variance (Summary)
Accept Ho
Accept Ho
Accept Ho Accept H1
Accept H1
Accept H1
Accept H1
x2 < x21-
x2 > x2
x2 < x2 1-/2
x2 > x2/2
x21- x2
x2 1-/2 x2 /2
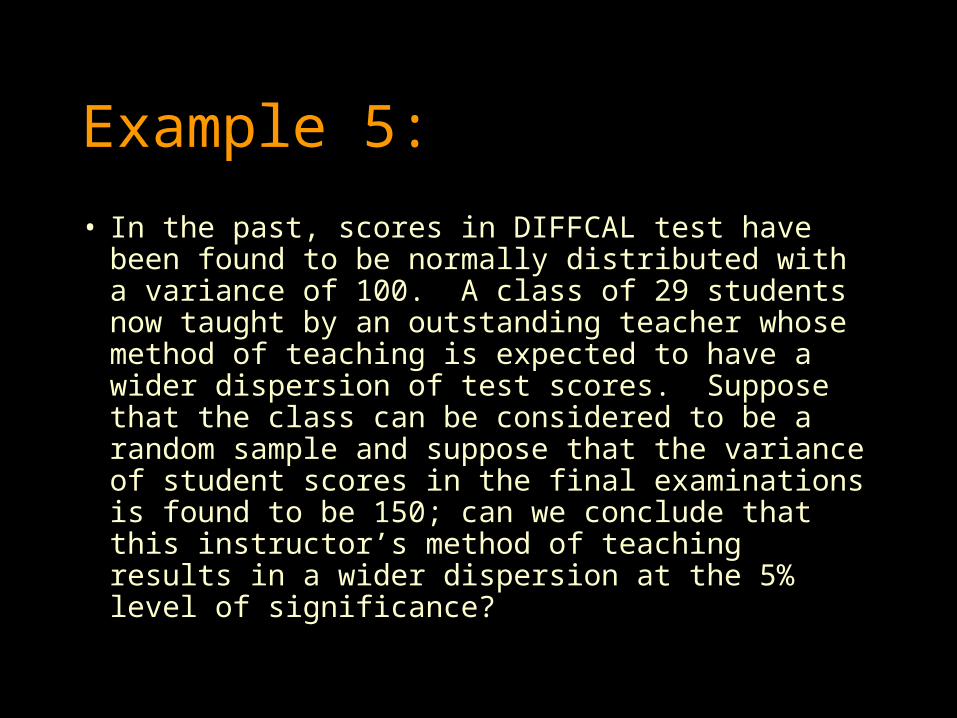
Example 5:
• In the past, scores in DIFFCAL test have been found to be normally distributed with a variance of 100. A class of 29 students now taught by an outstanding teacher whose method of teaching is expected to have a wider dispersion of test scores. Suppose that the class can be considered to be a random sample and suppose that the variance of student scores in the final examinations is found to be 150; can we conclude that this instructor’s method of teaching results in a wider dispersion at the 5% level of significance?

Answer:H0: 2 = 100 (no wider dispersion)
H1: 2 > 100 (there is wider dispersion): 0.05
CR: x2 > 41.337 (x20.05 at v = 29-1 = 28)
degrees of freedomComputations:
x2 = (29-1)(150) 100
= 42Conclusion: Reject Ho. Teaching method results in a wider dispersion42
Accept Ho
Accept H1
41.337

Example 6:
• The volume of containers of a particular lubricant is known to be normally distributed with a variance of 0.03 liter. Test the hypothesis that 2 = 0.03 against the alternative that 2 0.03 for the random sample of 10 containers if their variance is 0.06. Use 0.01 level of significance.

Answer:H0: 2 = 0.03
H1: 2 0.03: 0.01
CR: x2 < 1.735 (x20.995 at v = 10-1 = 9)
x2 > 23.589 (x20.005 at v = 10-1 = 9)
Computations: x2 = (10-1)(0.06)
0.03= 18
Conclusion: Do not reject Ho.
18
Accept Ho Accept H1
23.5891.735
Accept H1

Example 7:
• Past experience indicates that the time for high school seniors to complete a standardized test is normal random variable with a standard deviation of 6 minutes. Test the hypothesis that = 6 against the alternative that < 6 if a random sample of 20 high school seniors has a standard deviation s = 4.51. Use a 0.05 level of significance.

Answer:H0: 2 = 36
H1: 2 < 36: 0.05
CR: x2 < 10.117 (x20.95 at v = 20-1 = 19)
Computations: x2 = (20-1)(20.34)
36= 10.74
Conclusion: Do not reject Ho.
10.74
Accept Ho
10.117
Accept H1

Extra Challenge 1:• For some years now, a certain hospital has been using
Formula for patients known to have a certain type of disease. It has been proven that the mean recovery time of patients under Formula is equal to 20 days with a standard deviation of 4 days. A new type of treatment is now available. This new type of treatment is branded as Formula . A random sample of 25 patients was created with this new formula and showed a mean recovery time of 18 days with a standard deviation of 3.5 days. The hospital is not willing to gamble on new formula unless it is proven to be better than the old formula as far as mean recovery time and variability are concerned. Decide whether the hospital should employ the new formula at the 5% level of significance. (Hint: 2 tests)

Extra Challenge 2:• The specifications for a component of a particular
item provide that the mean length should not be less than 4 cm with a standard deviation 0.45 cm. A random sample of 50 components drawn from a very large shipment showed a mean length of 3.95 cm and a standard deviation of 0.45 cm. If you were the manufacturer of this item who had received this shipment, would you accept it? Assume 5% level of significance. What if the standard deviation is 0.55 cm?