Embed Size (px)
Citation preview

Hypothesis Construction
Claude Oscar Monet: The Blue House in Zaandam, 1871.
Propositions and Hypotheses
1. Definitions
• Theoretical Proposition: An empirically falsifiable, abstract statement about reality.• “The greater the self actualization the
greater the life satisfaction.”• Hypothesis: A falsifiable, specific statement
about reality that follows from a theoretical proposition.• “The greater the self-esteem, the greater the
marital satisfaction.”
Hypotheses
1. Statement About Reality
• Typically, an hypothesis is a stated relationship between just two variables.• One can test just two variables at a time.• An apparent exception to this rule is an
hypothesis of the form, “The theory fits the data.” This form is common to advanced data analysis such as multiple regression or structural equation modeling.
Hypotheses
1. Statement About Reality (Continued)
• Researchers often state “short-cut” hypotheses that include more than two variables to imply a set of separate hypotheses.
Hypotheses
2. Falsifiable
• In principle, hypotheses must be able to be falsified.
• In reality, just as one can never prove an hypothesis, one can never disprove it either.
• Thus, hypothesis testing always includes a margin of error. In sociology, this margin of error typically equals 5%.
Hypotheses
3. Causality
• Hypotheses need not state causality.• Some hypotheses merely state concurrence• For example, this hypothesis, “Self-esteem
and locus-of-control are correlated,” means that the two variables are found in common (i.e., people with high self-esteem will also have high locus-of-control), but self-esteem does not cause locus-of-control.
• When hypotheses state causality, direction and valence (+ or -) of causality must be specified.
The Research and Null Hypotheses
1. Research (Ha)• The research, or “alternative,” hypothesis is the
statement about reality to be assessed through analysis of quantitative or qualitative data. • This is the “claim” made by the theory.
2. Null (H0)• The null hypothesis is the one tested.
• The null is tested in recognition that no claim about reality can be tested directly.
• One can only falsify the null to lend support to the research hypothesis.
Formatting Hypotheses
1. Suggestions and Terminology• Suggestions are offered for formatting
hypotheses. Other ways work just as well; these are easy to follow.
• “x” refers to the independent variable.• “y” refers to the dependent variable.• Hypotheses can be constrained within a range
of data by the use of a modifier.• Among protestants, the greater the self-
esteem the greater the marital satisfaction.• In this example, “protestants” is a constant.
Formatting Hypotheses
2. Quantitative and Qualitative Data• The suggestions offered here generally imply
the use of quantitative data, either collected as such or derived from qualitative data.
• Certainly, hypotheses can be tested using qualitative data. • For example, a researcher might claim, after
conducting many in-depth interviews with married persons, “I conclude that the greater the self-esteem the greater the marital satisfaction,” wherein both variables were measured as qualitative impressions.
Formatting Hypotheses
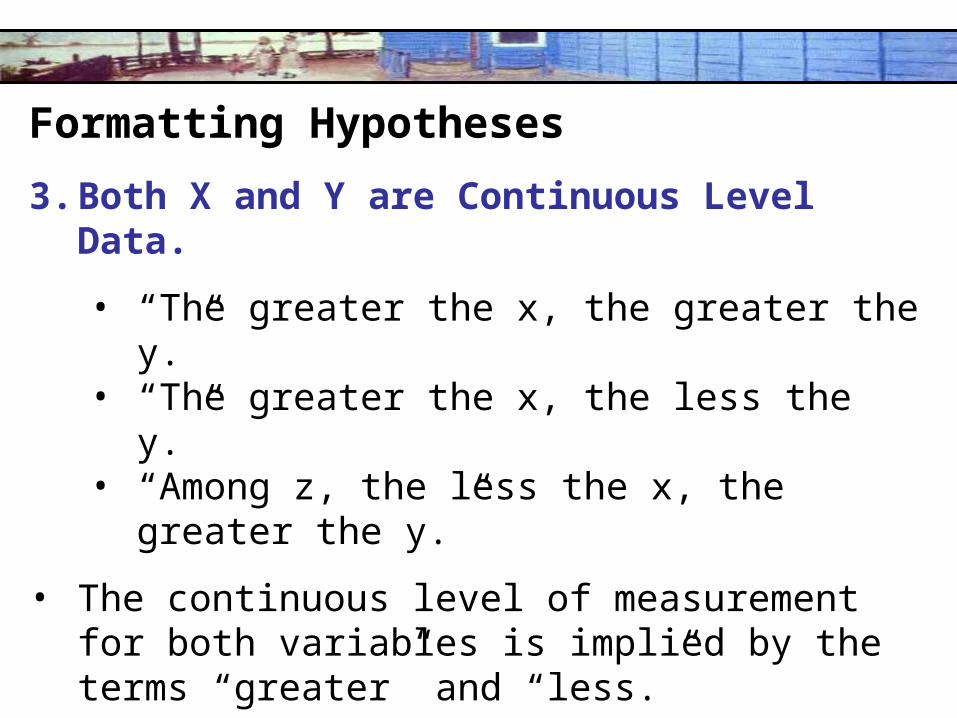
3. Both X and Y are Continuous Level Data.
• “The greater the x, the greater the y.”• “The greater the x, the less the y.”• “Among z, the less the x, the greater the y.”
• The continuous level of measurement for both variables is implied by the terms “greater” and “less.”
• Null: There is no relationship between x and y.• Test statistic: T-ratio.

Formatting Hypotheses
4. One Categorical and One Continuous Variable.
• “Category x1 will have a higher/lower score on y than category x2.”• “Males will score higher on self-esteem than
will females.”
• Null: There is no relationship between x and y.• Test statistic: T-test for difference in means.
Formatting Hypotheses
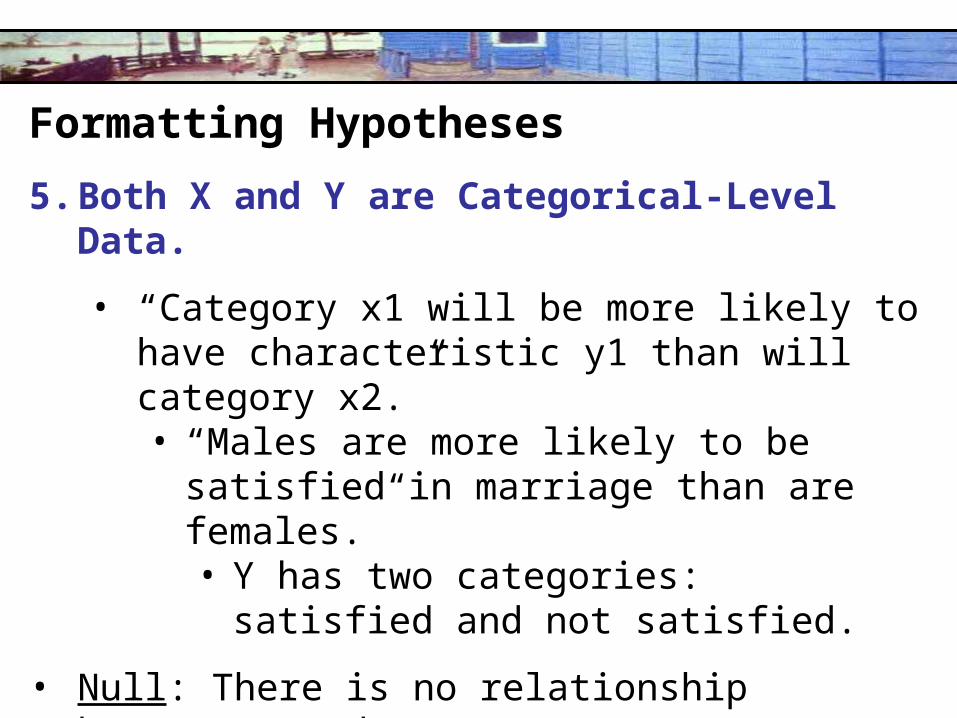
5. Both X and Y are Categorical-Level Data.
• “Category x1 will be more likely to have characteristic y1 than will category x2.”• “Males are more likely to be satisfied in
marriage than are females.”• Y has two categories: satisfied and not
satisfied.
• Null: There is no relationship between x and y.• Test statistic: Chi-square goodness-of-fit.
Formatting Hypotheses
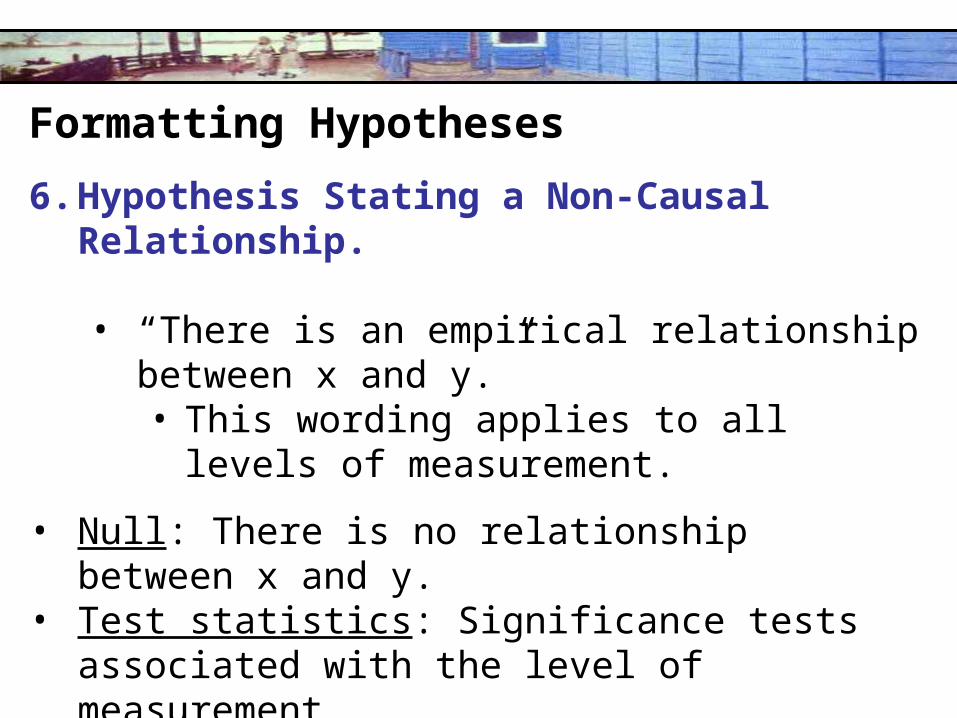
6. Hypothesis Stating a Non-Causal Relationship.
• “There is an empirical relationship between x and y.”• This wording applies to all levels of
measurement.
• Null: There is no relationship between x and y.• Test statistics: Significance tests associated with
the level of measurement.
Type-I and Type-II Errors
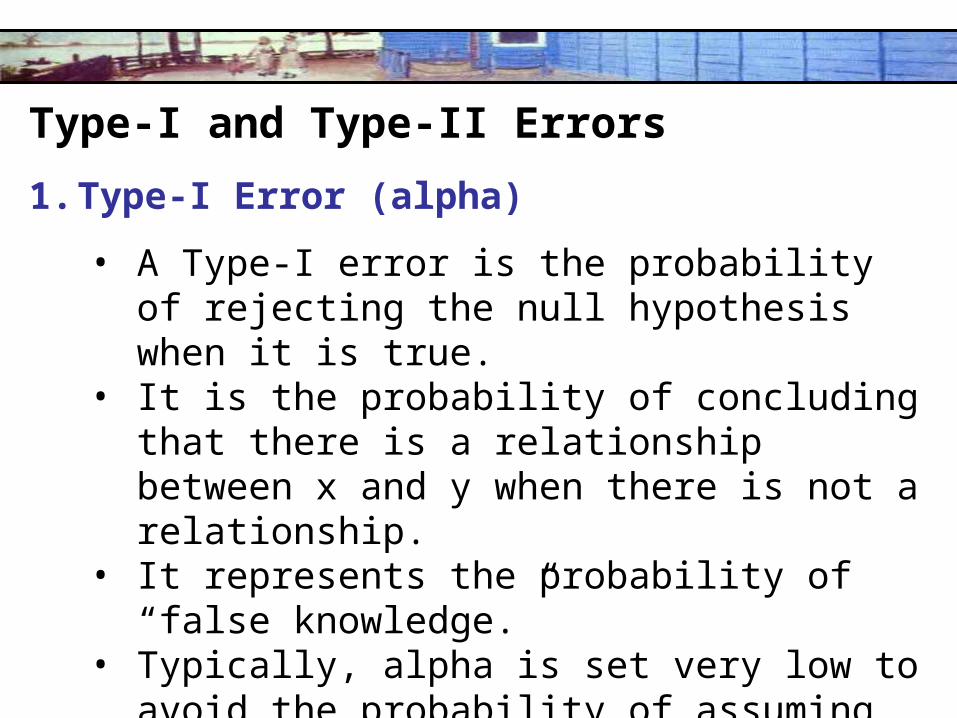
1. Type-I Error (alpha)
• A Type-I error is the probability of rejecting the null hypothesis when it is true.
• It is the probability of concluding that there is a relationship between x and y when there is not a relationship.
• It represents the probability of “false knowledge.”
• Typically, alpha is set very low to avoid the probability of assuming causality when there is none.
Type-I and Type-II Errors
2. Type-II Error (beta; 1-alpha)
• A Type-II error is the probability of not rejecting the null hypothesis when it should be rejected.
• It is the probability of concluding that there is a not relationship between x and y when there is a relationship.
• It represents the probability of “not realizing there is causality.”
• Typically, scientists are much less concerned about making a Type-II error than they are about making a Type-I error.
Statistical and Substantive Significance
1. Statistical Significance
• Statistical significance is determined by whether an estimate is sufficiently different from zero, given its standard error and a specified level of Type-I error (alpha).
• It means, “Empirically, for a certain level of alpha, we can trust that this difference from zero did not occur by chance.”

Statistical and Substantive Significance
1. Substantive Significance
• With many observations, even very small differences from zero will be determined to be statistically significant because the larger the sample size, the smaller the standard error and the larger the t-ratio.
• The key question to ask when working with many observations, therefore, is, “Is this statistically significant difference from zero actually a theoretically important difference from zero?”