Embed Size (px)
Citation preview

Volume 3 • Issue 7 • 1000191J Food Process TechnolISSN:2157-7110 JFPT, an open access journal
Open AccessResearch Article
Bisoi et al., J Food Process Technol 2012, 3:11 DOI: 10.4172/2157-7110.1000191
Keywords: Cereals; Millets; Fiber; Glucose Adsorption Capacity;Hypolipidemic Effect
IntroductionThe present global pandemic of Diabetes is accounted for by
westernization of life style, population growth, ageing and urbanization, with consequent dietary change, sedentary life style and obesity. Diabetes Mellitus(DM) is also a common endocrine disease in middle aged to older cats and is often called as “sugar diabetes’’. In dogs with naturally occurring insulin dependent DM a high insoluble fiber diet may aid in glycemic control. Incidence of DM is lower in population with high fiber intake mostly in rural areas and tribal belt which might be due to feeding of different cereals and millets with high fiber content. The term dietary fiber was first adopted in 1953 by Hipsley to describe the plant cell wall components of food. Millets are small sized grains, containing large proportions of husk and bran; require dehusking and debranning prior to consumption [1]. The nutritive value of millets is comparable to other cereals, some of them are even better with regard to average protein and mineral contents [2].
The protein contents of the dehusked millets varied between 8.7% (kodo millet) and 13.8% (pearl millet), whereas in case of milled grains it varied from 5.8% (finger millet) to 12.7% (pearl millet). Milled grains contained nearly 70% of total fat of whole seeds. The calcium and phosphorus contents of milled millets varied from 2.3 mg% to 162.8
mg% and 105 mg% to 425 mg%, respectively. Milling removed nearly 50% calcium and about 65% of phosphorus from whole seeds. The bran fraction from small millets other than finger millet, contain 23.0-27.0% oil. Whereas pearl millet bran contain 15% oil. The total dietary fiber content of debranned millets is ranging from 9.0 to 16.0 %. This indicates the millets, even after removal of husk and major portion of bran, contained appreciable amounts of dietary fiber. The millet bran, besides containing considerably higher proportion of oil, appears to be a good source of dietary fiber, out of which 10-15% was soluble fraction [3].
Dietary fibers are not uniform chemically or in their nutritive and biological properties, the only common ground being their resistance
*Corresponding author: Das C, Orissa University of Agriculture & Technology, Odisha, India, E-mail: [email protected]
Received August 27, 2012; Accepted September 28, 2012; Published October 06, 2012
Citation: Bisoi PC, Sahoo G, Mishra SK, Das C, Das KL (2012) Hypoglycemic Effects of Insoluble Fiber Rich Fraction of Different Cereals and Millets. J Food Process Technol 3:191. doi:10.4172/2157-7110.1000191
Copyright: © 2012 Bisoi PC, et al. This is an open-access article distributed under the terms of the Creative Commons Attribution License, which permits unrestricted use, distribution, and reproduction in any medium, provided the original author and source are credited.
AbstractDietary fibers are important for their hypoglycemic effect, hypolipidemic effect; lowering serum cholesterol
hence helps in prevention of atherosclerosis, antitoxic effect and anti-cancerous effect. It also helps in control of gastro intestinal disorders like gall stone, irritable bowel syndrome, constipation, inflammatory bowel disease etc. Beneficial effects of cereal fibers are frequently discussed in the context of whole grain consumption; unrefined whole grains and bran products are highly complex substances containing both soluble and insoluble dietary fiber as well as other biologically active substances e.g. polyphenols, antioxidants, vitamins, trace minerals, phytoestrogens, lipids, proteins, and starch. Research on minor millets and its food value is in its infancy and its potential vastly untapped. So the present study was undertaken to evaluate the in-vitro hypoglycemic effect of insoluble fibers from locally available whole grain of millets and cereals like kodo millet (Paspalum scrobiculatum), Proso millet (Panicum miliaceum), Barnyard millet (Echinochloa frumentaceae), Finger millet (Elusine coracana), wheat (Triticum aestivum) and Great millet (Sorghum vulgare) from tribal belt of Odisha. Proximate analysis of the cereals and millet grains revealed that these grains are rich in crude fiber, total ash and crude protein content. The nutritional composition is better than most of the commonly used grains. In general the crude fiber and ash content of the bran samples were more as compared to the grains. Glucose adsorption capacity (GAC) at 5 Millimole/l concentration of glucose was almost similar in IDF of all the millets and wheat ranging from 0.04 ± 0.01 in case of Barnyard millet IDF to 0.06 ± 0.01 in Sorghum, Ragi and Kodo. Glucose absorption capacity at 5 Millimole/l concentration of glucose was highest in Ragi fibers but at higher concentration of glucose it was highest in wheat fibres. GAC increases with increase in glucose concentration in all the cases studied. In most samples WIS showed maximum GAC. Maximum GAC was found at 50 mM/lit in Ragi (Finger millet) IDF and lowest value was found at 10 mM/lit in jhipiri (Barnyard millet) IDF and wheat AIS. In case of glucose diffusion and GDRI, in all types of fiber, it showed decrease in glucose concentration in the dialysate with addition of fiber than in control (without fiber), indicating that addition of fiber decreased diffusion of glucose through dialysis membrane which simulates the function of membrane of small intestine. The glucose concentration in the dialysate though increases with increase in time but remains lower to that of glucose value in control. When GDRI values were compared it showed lowest value in case of IDF than AIS and WIS in all the six samples. Effect of insoluble fibers on alpha-amylase activity indicate that glucose production rate is highest in kodo (kodo millet) AIS but lowest in sorghum (Great millet) IDF. When residual amylase activity was compared it showed highest values in Ragi (Finger millet) AIS and lowest values in gunji (Proso millet) IDF.
Hypoglycemic Effects of Insoluble Fiber Rich Fraction of Different Cereals and MilletsBisoi PC, Sahoo G, Mishra SK, Das C* and Das KL
Orissa University of Agriculture & Technology, Odisha, India
Journal of FoodProcessing & TechnologyJo
urna
l of F
ood Processing &
Technology
ISSN: 2157-7110

Citation: Bisoi PC, Sahoo G, Mishra SK, Das C, Das KL (2012) Hypoglycemic Effects of Insoluble Fiber Rich Fraction of Different Cereals and Millets. J Food Process Technol 3:191. doi:10.4172/2157-7110.1000191
Page 2 of 11
Volume 3 • Issue 7 • 1000191J Food Process TechnolISSN:2157-7110 JFPT, an open access journal
to mammalian digestive enzymes. The AOAC [4] method for total fiber is subjected to interference from ash, protein, tannins, and resistant starches. These interferences can be reduced by urea enzymatic dialysis. The measurement of soluble and insoluble fiber is nutritionally relevant since physical properties greatly modify dietary effects of fiber. Insoluble fiber is conveniently measured as neutral detergent fiber. This procedure has been improved by reducing the starch interference and the time of analysis. Physical and biological properties of dietary fiber can be measured by using relevant procedures for hydration capacity and rate of fermentation. The lignin and tannin content modify the characteristics of dietary fiber [5]. Breads made from a combination of wheat potato and/or oat has relatively high in total dietary fiber. Wheat breads with different ash contents or breads made from a combination of wheat and rye had clearly higher total dietary fiber content [6]. Schieber et al. [7] has pointed out that agricultural byproducts could be exploited as a potential source of fibers and functional compounds for food application. Dietary fiber is unique among feed constituents because it is defined only on a nutritional basis (i.e. in terms of digestive and physiological effects that it elicits) but must be measured chemically. The usefulness of dietary fiber results vary from its value as an indicator of physiological health benefits to its value as a predictor of digestibility and energy value of feeds. Numerous methods have been proposed for measuring dietary fiber and some have become routine analyses for research and practical use. Fiber extraction methods are typically categorized in to three types (chemical-gravimetric, enzymatic-gravimetric or enzymatic-chemical) based on ways fibrous residues are isolated and measured. Isolation of dietary fiber residue is done by extraction in chemical solution, enzymatic hydrolysis of non-fibrous constituents or a combination of two. After fibrous residue is isolated it is measured either gravimetrically (weighing the residue) or chemically (hydrolyzing the residue and measuring individual components such as sugars and lignin) [8]. There are several AOAC official methods for measuring total dietary fiber (TDF), Insoluble dietary fiber (IDF), soluble dietary fiber (SDF). The first AOAC method for TDF is 985.29–Total dietary fiber in food, enzymatic gravimetric method which did not allow separation of dietary fiber in to soluble and insoluble fraction. Insoluble fraction can be determined using AOAC official method 991.42–Insoluble dietary fiber in foods and food products, enzymatic gravimetric method [8]. Certain physiological responses have been associated with the consumption of dietary fiber and physical and chemical properties of individual dietary fiber compounds appear to be important in determining the physiological response to sources of dietary fiber in the diet [9]. The post prandial glycemic response is most effectively reduced with sources of viscous polysaccharides. The importance of viscosity in this response has been demonstrated in several studies suggesting that the ability to form a gel matrix may be important in mediating the physiological response to these fiber sources. Also the physical properties of digestibility are key determinants in the metabolism of fiber rich diets. Fiber modulates and slows the rate of digestion and absorption by at least three mechanisms. 1) The rate of gastric filling and emptying can be slowed by certain fibers; 2) The activity of digestive enzymes in the small intestine could be diminished in presence of fibers; 3) The diffusion and absorption of nutrients enzymes and substrates in the intestinal tract may be altered by certain fibers via these mechanisms and its fermentation in the large intestine. Fibers affect the metabolic process [10]. The fermentability of polysaccharides as well as their bulking ability in the large bowel is important for determining the physiological effects of soluble versus insoluble fibers. In this part of gut soluble fibers can be readily degraded by bacteria because the water holding capacity allows the bacteria penetrate the fiber matrix. The increase in bacterial mass due to
fermentability leads to increase in faecal bulk. In contrast insoluble fiber cannot be penetrated as well by bacteria and cannot be broken down as extensively hence a residual fiber is present and a matrix is maintained in large bowel content and bacterial mass is increased [11]. The rate at which food is emptied from the stomach determines the rate of nutrient absorption from the intestine. Hence a delay in gastric emptying determines the rate of nutrient absorption from the intestine [9]. The findings that several dietary fibers can decrease the activity of human pancreatic amylase, lipase, trypsin, and chymotrypsin may be attributable at least in part to enzyme inhibitors [12]. Alternatively this decreased activity after incubation with several dietary fibers could be due to nonspecific adsorption of enzyme molecules [13]. With high fiber intake glucose absorption is slowed down and spread out along a greater length of the intestine. This allows uptake of glucose by the intestine keeping in pace with the gastrointestinal absorption after initial stimulation of insulin release there by regulating plasma glucose level [14-16]. Dietary fibers coming from various sources do not seem to be equally effective in delaying glucose absorption in intestine. Tanchoco et al. [17] It is estimated that more than 50% post prandial insulin secretion is triggered by intestinal peptide hormone. In presence of elevated blood glucose, glucagons like peptide 1 (GLP-1) stimulates the release of insulin by interacting with specific receptors on pancreatic beta cells. In addition to potentiating glucose induced insulin secretion GLP-1 stimulates proinsulin gene expression and proinsulin biosynthesis [18]. By stimulating insulin release and increasing insulin dependent glucose disposal, GLP-1 enhances glucose tolerance [19]. The potential action of this hormone on carbohydrate metabolism makes it potentially applicable in the treatment of non-insulin dependent diabetes mellitus. It is found that long term ingestion of dietary fiber by rats ingesting similar amounts of energy, proteins, lipid, glucose, vitamins and minerals stimulates small chain fatty acids (SCFA) production and proglucagon m-RNA abundance and increases post prandial glucagons like peptide 1, insulin and c-peptide concentration. High carbohydrate/high fiber diet significantly improves blood glucose control and reduces plasma cholesterol levels in diabetic patients compared with a low carbohydrate low fiber diet. In addition a high carbohydrate/high fiber diet does not increase plasma and triglyceride concentration despite the higher consumption of carbohydrate. Ability of dietary fiber to retard food digestion and nutrient absorption certainly has an important influence on lipid and carbohydrate metabolism. The fiber content and physical form of the food can influence the accessibility of nutrients by digestive enzymes thus delaying digestion and absorption. The fiber content and physical form of the food can influence the accessibility of nutrients by digestive enzymes thus delaying digestion and absorption. The identification of these foods with a low glycemic response would help to enlarge the list of foods particularly suitable for diabetic patients [20]. The polysaccharides composing the major part of dietary fiber in fruits and vegetables are beneficial to diabetes and heart patients since the fibers lower blood sugar and serum cholesterol levels [21,22]. In fact the most likely explanation for the reduction of post prandial hyperglycemia by viscous fibers is decreased amylase activity [23] and a direct delaying effect on glucose absorption in the gastro-intestinal tract due to alternation in the diffusion of digestion end product with the lumen [24,25]. Starch degradation and glucose diffusion are delayed in the presence of mango fiber. Viscous solutions which reduce starch digestibility in vitro can decrease glycemic post prandial response. Hence mango fiber could be of potential benefit in controlling plasma glucose [26].
Citation: Bisoi PC, Sahoo G, Mishra SK, Das C, Das KL (2012) Hypoglycemic Effects of Insoluble Fiber Rich Fraction of Different Cereals and Millets. J Food Process Technol 3:191. doi:10.4172/2157-7110.1000191
Page 3 of 11
Volume 3 • Issue 7 • 1000191J Food Process TechnolISSN:2157-7110 JFPT, an open access journal
Materials and MethodsCollection of sample
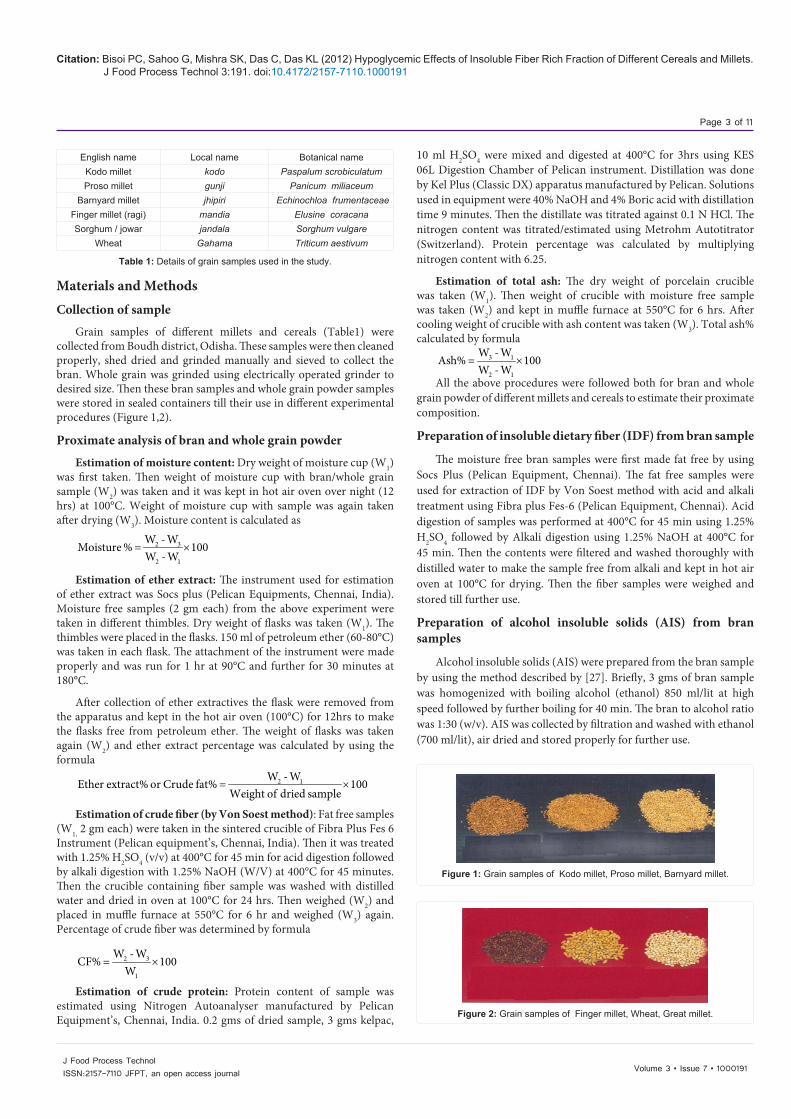
Grain samples of different millets and cereals (Table1) were collected from Boudh district, Odisha. These samples were then cleaned properly, shed dried and grinded manually and sieved to collect the bran. Whole grain was grinded using electrically operated grinder to desired size. Then these bran samples and whole grain powder samples were stored in sealed containers till their use in different experimental procedures (Figure 1,2).
Proximate analysis of bran and whole grain powder
Estimation of moisture content: Dry weight of moisture cup (W1) was first taken. Then weight of moisture cup with bran/whole grain sample (W2) was taken and it was kept in hot air oven over night (12 hrs) at 100°C. Weight of moisture cup with sample was again taken after drying (W3). Moisture content is calculated as
2 3
2 1
W - WMoisture % = 100
W - W×
Estimation of ether extract: The instrument used for estimation of ether extract was Socs plus (Pelican Equipments, Chennai, India). Moisture free samples (2 gm each) from the above experiment were taken in different thimbles. Dry weight of flasks was taken (W1). The thimbles were placed in the flasks. 150 ml of petroleum ether (60-80°C) was taken in each flask. The attachment of the instrument were made properly and was run for 1 hr at 90°C and further for 30 minutes at 180°C.
After collection of ether extractives the flask were removed from the apparatus and kept in the hot air oven (100°C) for 12hrs to make the flasks free from petroleum ether. The weight of flasks was taken again (W2) and ether extract percentage was calculated by using the formula
2 1W - WEther extract% or Crude fat% = 100Weight of dried sample
×
Estimation of crude fiber (by Von Soest method): Fat free samples (W1, 2 gm each) were taken in the sintered crucible of Fibra Plus Fes 6 Instrument (Pelican equipment’s, Chennai, India). Then it was treated with 1.25% H2SO4 (v/v) at 400°C for 45 min for acid digestion followed by alkali digestion with 1.25% NaOH (W/V) at 400°C for 45 minutes. Then the crucible containing fiber sample was washed with distilled water and dried in oven at 100°C for 24 hrs. Then weighed (W2) and placed in muffle furnace at 550°C for 6 hr and weighed (W3) again. Percentage of crude fiber was determined by formula
2 3
1
W - WCF% = 100
W×
Estimation of crude protein: Protein content of sample was estimated using Nitrogen Autoanalyser manufactured by Pelican Equipment’s, Chennai, India. 0.2 gms of dried sample, 3 gms kelpac,
10 ml H2SO4 were mixed and digested at 400°C for 3hrs using KES 06L Digestion Chamber of Pelican instrument. Distillation was done by Kel Plus (Classic DX) apparatus manufactured by Pelican. Solutions used in equipment were 40% NaOH and 4% Boric acid with distillation time 9 minutes. Then the distillate was titrated against 0.1 N HCl. The nitrogen content was titrated/estimated using Metrohm Autotitrator (Switzerland). Protein percentage was calculated by multiplying nitrogen content with 6.25.
Estimation of total ash: The dry weight of porcelain crucible was taken (W1). Then weight of crucible with moisture free sample was taken (W2) and kept in muffle furnace at 550°C for 6 hrs. After cooling weight of crucible with ash content was taken (W3). Total ash% calculated by formula
3 1
2 1
W - WAsh% = 100
W - W×
All the above procedures were followed both for bran and whole grain powder of different millets and cereals to estimate their proximate composition.
Preparation of insoluble dietary fiber (IDF) from bran sample
The moisture free bran samples were first made fat free by using Socs Plus (Pelican Equipment, Chennai). The fat free samples were used for extraction of IDF by Von Soest method with acid and alkali treatment using Fibra plus Fes-6 (Pelican Equipment, Chennai). Acid digestion of samples was performed at 400°C for 45 min using 1.25% H2SO4 followed by Alkali digestion using 1.25% NaOH at 400°C for 45 min. Then the contents were filtered and washed thoroughly with distilled water to make the sample free from alkali and kept in hot air oven at 100°C for drying. Then the fiber samples were weighed and stored till further use.
Preparation of alcohol insoluble solids (AIS) from bran samples
Alcohol insoluble solids (AIS) were prepared from the bran sample by using the method described by [27]. Briefly, 3 gms of bran sample was homogenized with boiling alcohol (ethanol) 850 ml/lit at high speed followed by further boiling for 40 min. The bran to alcohol ratio was 1:30 (w/v). AIS was collected by filtration and washed with ethanol (700 ml/lit), air dried and stored properly for further use.
English name Local name Botanical nameKodo millet kodo Paspalum scrobiculatumProso millet gunji Panicum miliaceum
Barnyard millet jhipiri Echinochloa frumentaceaeFinger millet (ragi) mandia Elusine coracanaSorghum / jowar jandala Sorghum vulgare
Wheat Gahama Triticum aestivum
Table 1: Details of grain samples used in the study.
Figure 1: Grain samples of Kodo millet, Proso millet, Barnyard millet.
Figure 2: Grain samples of Finger millet, Wheat, Great millet.
Citation: Bisoi PC, Sahoo G, Mishra SK, Das C, Das KL (2012) Hypoglycemic Effects of Insoluble Fiber Rich Fraction of Different Cereals and Millets. J Food Process Technol 3:191. doi:10.4172/2157-7110.1000191
Page 4 of 11
Volume 3 • Issue 7 • 1000191J Food Process TechnolISSN:2157-7110 JFPT, an open access journal
Preparation of water insoluble solid (WIS) from bran sample
The water insoluble solids (WIS) were prepared according to the method of [28]. WIS was separated from bran samples by homogenizing the bran in cold distilled water (1:10 w/v) at high speed for 1 min. After filtration WIS was washed with ethanol (700 ml/lit), air dried and stored for further use.
Study of hypoglycemic activity in vitro
Determination of glucose adsorption capacity (GAC): The glucose adsorption capacity (milimoles per gram) was determined according to method described by [28] with slight modification. 0.1 gm of fiber sample was mixed with 10 ml of glucose solution of different concentration (i.e. 5 mmol/lit, 10 mmol/lit, 25 mmol/lit, and 50 mmol/lit ) and then incubated for 5 hrs at 37°C using constant shaker cum incubator (Rotek-LIS, Pelican Equipments, Chennai ). The final glucose content in the supernatant was measured after centrifuging at 3500 rpm for 15 min by glucose assay kit (Corals glucose assay kit, GOD-POD method) to estimate the amount of glucose adsorbed on fiber sample. A control test was done without addition of fiber.
Determination of glucose diffusion and glucose dialysis retardation index (GDRI): Glucose dialysis retardation index was determined on the basis of [28] with slight modifications. A mixture solution was prepared by mixing 0.125 gm of fiber sample in 6.25 ml of glucose solution (10 mmol/lit) and was dialyzed against 40 ml of distilled water at 37°C using a dialysis membrane with a molecular weight cut off value of 12,000 D. After incubation of 10, 30, 60, and 120 min the glucose content in the dialysate was measured by glucose assay kit (Corals glucose assay kit, GOD-POD Method) for estimation of GDRI. A control test was also prepared without addition of fiber. GDRI was calculated using formula
GDRI = 100 -Glucose content in dialysate with fiber 100Glucose content in dialysate of control
×
Determination of starch digestibility: The effect of different fibers on starch digestibility was determined as per [28] with slight modifications. A mixture was prepared by mixing 0.1 gm of fiber and 0.02 gm of diastase in 5 ml of potato starch solution (4 gm/100 ml) and was dialyzed against 100 ml of distilled water at 37°C using a dialysis membrane with molecular weight cut off value of 12,000 D. After incubation of 10, 30, 60 and 120 min the glucose content in the dialysate was determined using glucose assay kit (Coral glucose assay kit, GOD-POD Method). A control experiment was also performed without addition of fiber.
Determination of residual amylase activity: The effect of fiber on glucose production rate and residual amylase activity was determined as per [28], with slight modifications. An incubation mixture containing 0.25 gm of fiber sample and 1 mg of diastase in 10 ml of potato starch solution (4 gm/100 ml) was incubated at 37°C for 60 min. Starch digestion then stopped by addition of 20 ml of 0.1 N NaOH. Then it was centrifuged at 3500 rpm for 15 min and glucose content of supernatant was measured by Glucose Assay kit (Corals glucose assay kit, GOD-POD method). A control experiment was also done without addition of fiber. The residual amylase activity was defined as the percentage of glucose production rate with fiber addition over the control.
ResultsProximate composition
The proximate composition of whole grains and bran samples were
shown in percentage (Table 2 and 3) for whole grain and bran samples respectively. Moisture content in whole grains varied slightly ranging from 7.63 ± 0.581% to 8.89 ± 0.12%, barnyard millet being the highest in moisture content and kodo millet being the lowest. Highest crude fiber content (17.42 ± 1.066%) was found in finger millet and was lowest in sorghum (10.48 ± 0.494%). The dry matter content was highest in kodo millet (92.37 ± 0.581%) and lowest in barnyard millet (91.11 ± 0.068%). The ether extractives were highest in barnyard millet (4.35 ± 0.164%) and lowest in Proso millet (1.003 ± 0.057%) whereas, the crude protein content was highest in barnyard millet (10.39 ± 0.248%) and was lowest in kodo millet (5.48 ± 0.449%). The total ash content was found to be highest in both kodo millet (3.59 ± 0.246%) and Proso millet (3.59 ± 0.234%) and lowest in sorghum (1.29 ± 0.085%). The NFE content was highest in Sorghum (78.47 ± 0.968%) but lowest in barnyard millet (70.47 ± 0.747%).
From the proximate composition of bran samples (Table 3) it was observed that the moisture content was highest in finger millet (9.22 ± 0.56%) and lowest in kodo millet (5.53 ± 0.67%) and the dry matter content was highest in kodo millet (94.47 ± 0.67%) and lowest in Ragi (90.78 ± 0.56%). The ether extract content was highest in sorghum (4.69 ± 0.60%) but lowest in Proso millet (2.8 ± 0.53%). The crude fiber content in bran samples varied from 38.4 ± 0.66% to 11.32 ± 0.73, barnyard millet bran being the highest and wheat bran being the lowest whereas, the crude protein content was highest in wheat bran (12.19 ± 0.62%) and was lowest in Proso millet bran (4.13 ± 0.56%). The total ash content was found to be highest in finger millet bran (10.49 ± 0.85%) and lowest in kodo millet bran (7.74 ± 0.89%). The bran sample of Sorghum was highest in NFE (63.51 ± 0.48%) but the barnyard millet contained lowest NFE (43.29 ± 1.48%). From proximate composition analysis of both whole grains and bran samples it was clear that the crude fiber content was more in bran samples than the corresponding whole grains so the bran samples were used for the extraction of fibers for further studies.
Hypoglycemic effect of insoluble fibers in vitro
In vitro Hypoglycemic effect of insoluble fibers of different cereal and millet samples was studied by assessing the effect various fibers on glucose adsorption capacity (GAC), glucose diffusion, GDRI (Glucose dialysis retardation index). Starch digestibility and alpha-amylase activity.
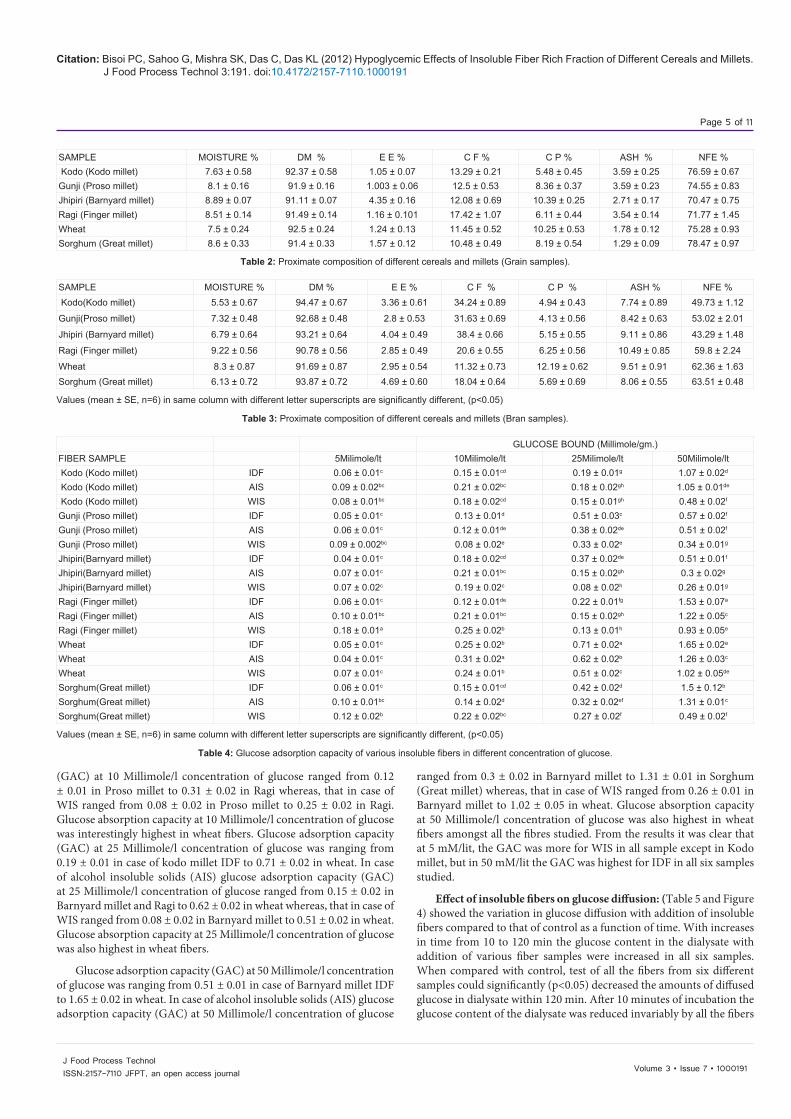
Effect of insoluble fibers on glucose adsorption capacity in vitro: A Series of different concentration of glucose (5 Millimole/l, 10 Millimole/l, 25 Millimole/l and 50 Millimole/l) were used to investigate the in vitro glucose adsorption capacity (Table 4, Figure 3). The results showed that all the dietary fibers could bind glucose and the adsorption capacity also increases in almost all the samples studied with increase in concentration of glucose. Glucose adsorption capacity (GAC) at 5 Millimole/l concentration of glucose was almost similar in IDF of all the millets and wheat ranging from 0.04 ± 0.01 in case of Barnyard millet IDF to 0.06 ± 0.01 in Sorghum, Ragi and Kodo. In case of alcohol insoluble solids (AIS) glucose adsorption capacity (GAC) at 5 Millimole/l concentration of glucose ranged from 0.04 ± 0.01 in wheat to 0.10 ± 0.01 in Ragi and sorghum whereas, that in case of WIS ranged from 0.07 ± 0.02 in Barnyard millet and wheat to 0.18 ± 0.01 in Ragi. Glucose absorption capacity at 5 Millimole/l concentration of glucose was highest in Ragi fibers. Glucose adsorption capacity (GAC) at 10 Millimole/l concentration of glucose was ranging from 0.12 ± 0.01 in case of Ragi IDF to 0.25 ± 0.02 in wheat which is interestingly reverse as compared to the 5 Millimole/l concentration of glucose. In case of alcohol insoluble solids (AIS) glucose adsorption capacity
Citation: Bisoi PC, Sahoo G, Mishra SK, Das C, Das KL (2012) Hypoglycemic Effects of Insoluble Fiber Rich Fraction of Different Cereals and Millets. J Food Process Technol 3:191. doi:10.4172/2157-7110.1000191
Page 5 of 11
Volume 3 • Issue 7 • 1000191J Food Process TechnolISSN:2157-7110 JFPT, an open access journal
(GAC) at 10 Millimole/l concentration of glucose ranged from 0.12 ± 0.01 in Proso millet to 0.31 ± 0.02 in Ragi whereas, that in case of WIS ranged from 0.08 ± 0.02 in Proso millet to 0.25 ± 0.02 in Ragi. Glucose absorption capacity at 10 Millimole/l concentration of glucose was interestingly highest in wheat fibers. Glucose adsorption capacity (GAC) at 25 Millimole/l concentration of glucose was ranging from 0.19 ± 0.01 in case of kodo millet IDF to 0.71 ± 0.02 in wheat. In case of alcohol insoluble solids (AIS) glucose adsorption capacity (GAC) at 25 Millimole/l concentration of glucose ranged from 0.15 ± 0.02 in Barnyard millet and Ragi to 0.62 ± 0.02 in wheat whereas, that in case of WIS ranged from 0.08 ± 0.02 in Barnyard millet to 0.51 ± 0.02 in wheat. Glucose absorption capacity at 25 Millimole/l concentration of glucose was also highest in wheat fibers.
Glucose adsorption capacity (GAC) at 50 Millimole/l concentration of glucose was ranging from 0.51 ± 0.01 in case of Barnyard millet IDF to 1.65 ± 0.02 in wheat. In case of alcohol insoluble solids (AIS) glucose adsorption capacity (GAC) at 50 Millimole/l concentration of glucose
ranged from 0.3 ± 0.02 in Barnyard millet to 1.31 ± 0.01 in Sorghum (Great millet) whereas, that in case of WIS ranged from 0.26 ± 0.01 in Barnyard millet to 1.02 ± 0.05 in wheat. Glucose absorption capacity at 50 Millimole/l concentration of glucose was also highest in wheat fibers amongst all the fibres studied. From the results it was clear that at 5 mM/lit, the GAC was more for WIS in all sample except in Kodo millet, but in 50 mM/lit the GAC was highest for IDF in all six samples studied.
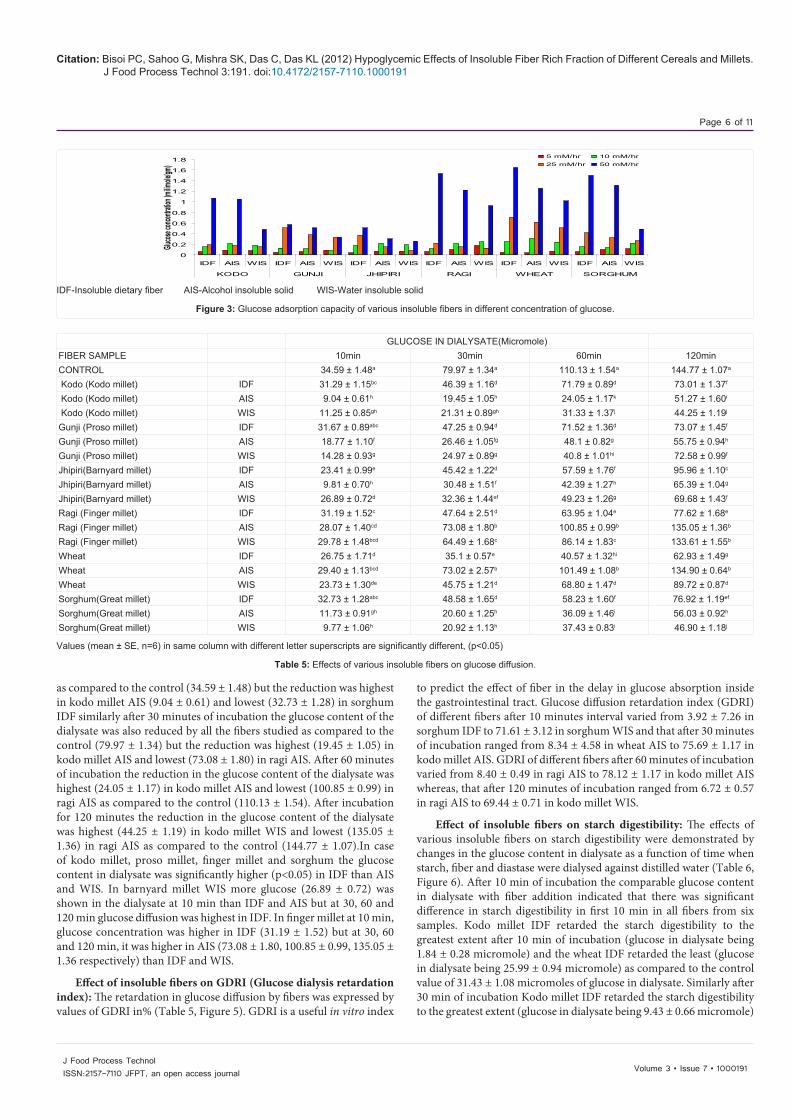
Effect of insoluble fibers on glucose diffusion: (Table 5 and Figure 4) showed the variation in glucose diffusion with addition of insoluble fibers compared to that of control as a function of time. With increases in time from 10 to 120 min the glucose content in the dialysate with addition of various fiber samples were increased in all six samples. When compared with control, test of all the fibers from six different samples could significantly (p<0.05) decreased the amounts of diffused glucose in dialysate within 120 min. After 10 minutes of incubation the glucose content of the dialysate was reduced invariably by all the fibers
SAMPLE MOISTURE % DM % E E % C F % C P % ASH % NFE % Kodo (Kodo millet) 7.63 ± 0.58 92.37 ± 0.58 1.05 ± 0.07 13.29 ± 0.21 5.48 ± 0.45 3.59 ± 0.25 76.59 ± 0.67Gunji (Proso millet) 8.1 ± 0.16 91.9 ± 0.16 1.003 ± 0.06 12.5 ± 0.53 8.36 ± 0.37 3.59 ± 0.23 74.55 ± 0.83Jhipiri (Barnyard millet) 8.89 ± 0.07 91.11 ± 0.07 4.35 ± 0.16 12.08 ± 0.69 10.39 ± 0.25 2.71 ± 0.17 70.47 ± 0.75Ragi (Finger millet) 8.51 ± 0.14 91.49 ± 0.14 1.16 ± 0.101 17.42 ± 1.07 6.11 ± 0.44 3.54 ± 0.14 71.77 ± 1.45Wheat 7.5 ± 0.24 92.5 ± 0.24 1.24 ± 0.13 11.45 ± 0.52 10.25 ± 0.53 1.78 ± 0.12 75.28 ± 0.93Sorghum (Great millet) 8.6 ± 0.33 91.4 ± 0.33 1.57 ± 0.12 10.48 ± 0.49 8.19 ± 0.54 1.29 ± 0.09 78.47 ± 0.97
Table 2: Proximate composition of different cereals and millets (Grain samples).
SAMPLE MOISTURE % DM % E E % C F % C P % ASH % NFE % Kodo(Kodo millet) 5.53 ± 0.67 94.47 ± 0.67 3.36 ± 0.61 34.24 ± 0.89 4.94 ± 0.43 7.74 ± 0.89 49.73 ± 1.12
Gunji(Proso millet) 7.32 ± 0.48 92.68 ± 0.48 2.8 ± 0.53 31.63 ± 0.69 4.13 ± 0.56 8.42 ± 0.63 53.02 ± 2.01
Jhipiri (Barnyard millet) 6.79 ± 0.64 93.21 ± 0.64 4.04 ± 0.49 38.4 ± 0.66 5.15 ± 0.55 9.11 ± 0.86 43.29 ± 1.48
Ragi (Finger millet) 9.22 ± 0.56 90.78 ± 0.56 2.85 ± 0.49 20.6 ± 0.55 6.25 ± 0.56 10.49 ± 0.85 59.8 ± 2.24
Wheat 8.3 ± 0.87 91.69 ± 0.87 2.95 ± 0.54 11.32 ± 0.73 12.19 ± 0.62 9.51 ± 0.91 62.36 ± 1.63Sorghum (Great millet) 6.13 ± 0.72 93.87 ± 0.72 4.69 ± 0.60 18.04 ± 0.64 5.69 ± 0.69 8.06 ± 0.55 63.51 ± 0.48
Values (mean ± SE, n=6) in same column with different letter superscripts are significantly different, (p<0.05)
Table 3: Proximate composition of different cereals and millets (Bran samples).
GLUCOSE BOUND (Millimole/gm.)FIBER SAMPLE 5Milimole/lt 10Milimole/lt 25Milimole/lt 50Milimole/lt Kodo (Kodo millet) IDF 0.06 ± 0.01c 0.15 ± 0.01cd 0.19 ± 0.01g 1.07 ± 0.02d
Kodo (Kodo millet) AIS 0.09 ± 0.02bc 0.21 ± 0.02bc 0.18 ± 0.02gh 1.05 ± 0.01de
Kodo (Kodo millet) WIS 0.08 ± 0.01bc 0.18 ± 0.02cd 0.15 ± 0.01gh 0.48 ± 0.02f
Gunji (Proso millet) IDF 0.05 ± 0.01c 0.13 ± 0.01d 0.51 ± 0.03c 0.57 ± 0.02f
Gunji (Proso millet) AIS 0.06 ± 0.01c 0.12 ± 0.01de 0.38 ± 0.02de 0.51 ± 0.02f
Gunji (Proso millet) WIS 0.09 ± 0.002bc 0.08 ± 0.02e 0.33 ± 0.02e 0.34 ± 0.01g
Jhipiri(Barnyard millet) IDF 0.04 ± 0.01c 0.18 ± 0.02cd 0.37 ± 0.02de 0.51 ± 0.01f
Jhipiri(Barnyard millet) AIS 0.07 ± 0.01c 0.21 ± 0.01bc 0.15 ± 0.02gh 0.3 ± 0.02g
Jhipiri(Barnyard millet) WIS 0.07 ± 0.02c 0.19 ± 0.02c 0.08 ± 0.02h 0.26 ± 0.01g
Ragi (Finger millet) IDF 0.06 ± 0.01c 0.12 ± 0.01de 0.22 ± 0.01fg 1.53 ± 0.07a
Ragi (Finger millet) AIS 0.10 ± 0.01bc 0.21 ± 0.01bc 0.15 ± 0.02gh 1.22 ± 0.05c
Ragi (Finger millet) WIS 0.18 ± 0.01a 0.25 ± 0.02b 0.13 ± 0.01h 0.93 ± 0.05e
Wheat IDF 0.05 ± 0.01c 0.25 ± 0.02b 0.71 ± 0.02a 1.65 ± 0.02a
Wheat AIS 0.04 ± 0.01c 0.31 ± 0.02a 0.62 ± 0.02b 1.26 ± 0.03c
Wheat WIS 0.07 ± 0.01c 0.24 ± 0.01b 0.51 ± 0.02c 1.02 ± 0.05de
Sorghum(Great millet) IDF 0.06 ± 0.01c 0.15 ± 0.01cd 0.42 ± 0.02d 1.5 ± 0.12b
Sorghum(Great millet) AIS 0.10 ± 0.01bc 0.14 ± 0.02d 0.32 ± 0.02ef 1.31 ± 0.01c
Sorghum(Great millet) WIS 0.12 ± 0.02b 0.22 ± 0.02bc 0.27 ± 0.02f 0.49 ± 0.02f
Values (mean ± SE, n=6) in same column with different letter superscripts are significantly different, (p<0.05)
Table 4: Glucose adsorption capacity of various insoluble fibers in different concentration of glucose.
Citation: Bisoi PC, Sahoo G, Mishra SK, Das C, Das KL (2012) Hypoglycemic Effects of Insoluble Fiber Rich Fraction of Different Cereals and Millets. J Food Process Technol 3:191. doi:10.4172/2157-7110.1000191
Page 6 of 11
Volume 3 • Issue 7 • 1000191J Food Process TechnolISSN:2157-7110 JFPT, an open access journal
as compared to the control (34.59 ± 1.48) but the reduction was highest in kodo millet AIS (9.04 ± 0.61) and lowest (32.73 ± 1.28) in sorghum IDF similarly after 30 minutes of incubation the glucose content of the dialysate was also reduced by all the fibers studied as compared to the control (79.97 ± 1.34) but the reduction was highest (19.45 ± 1.05) in kodo millet AIS and lowest (73.08 ± 1.80) in ragi AIS. After 60 minutes of incubation the reduction in the glucose content of the dialysate was highest (24.05 ± 1.17) in kodo millet AIS and lowest (100.85 ± 0.99) in ragi AIS as compared to the control (110.13 ± 1.54). After incubation for 120 minutes the reduction in the glucose content of the dialysate was highest (44.25 ± 1.19) in kodo millet WIS and lowest (135.05 ± 1.36) in ragi AIS as compared to the control (144.77 ± 1.07).In case of kodo millet, proso millet, finger millet and sorghum the glucose content in dialysate was significantly higher (p<0.05) in IDF than AIS and WIS. In barnyard millet WIS more glucose (26.89 ± 0.72) was shown in the dialysate at 10 min than IDF and AIS but at 30, 60 and 120 min glucose diffusion was highest in IDF. In finger millet at 10 min, glucose concentration was higher in IDF (31.19 ± 1.52) but at 30, 60 and 120 min, it was higher in AIS (73.08 ± 1.80, 100.85 ± 0.99, 135.05 ± 1.36 respectively) than IDF and WIS.
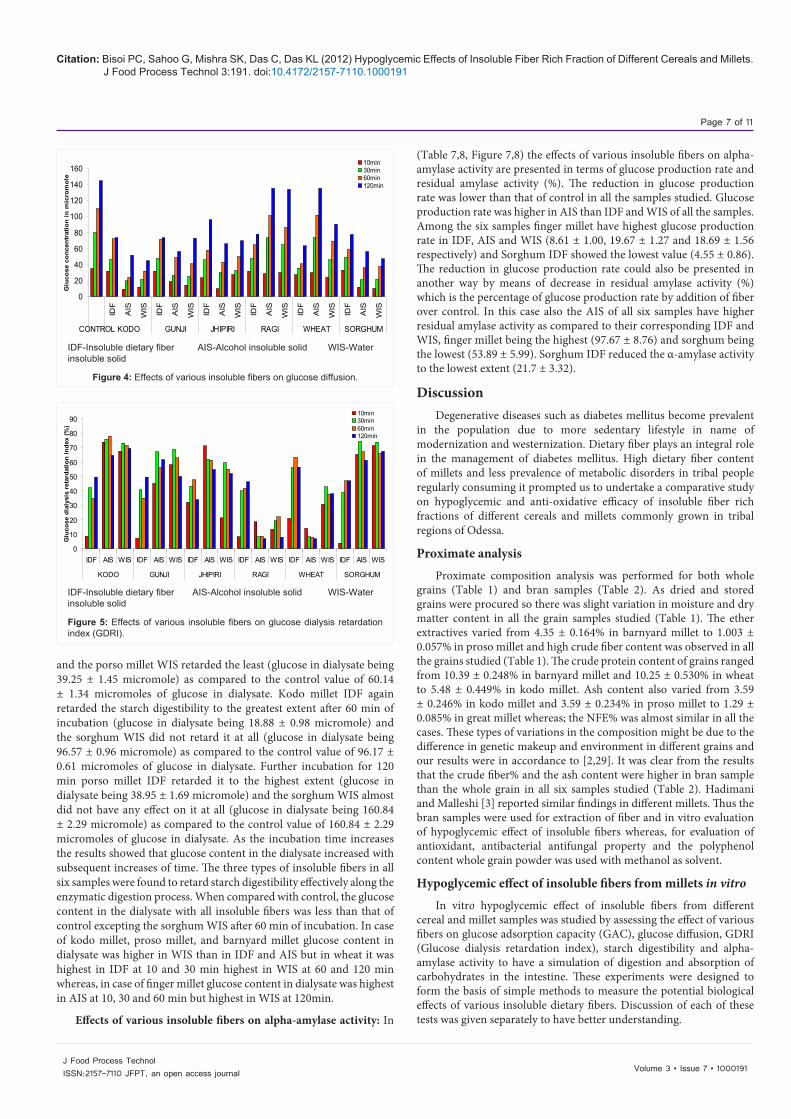
Effect of insoluble fibers on GDRI (Glucose dialysis retardation index): The retardation in glucose diffusion by fibers was expressed by values of GDRI in% (Table 5, Figure 5). GDRI is a useful in vitro index
to predict the effect of fiber in the delay in glucose absorption inside the gastrointestinal tract. Glucose diffusion retardation index (GDRI) of different fibers after 10 minutes interval varied from 3.92 ± 7.26 in sorghum IDF to 71.61 ± 3.12 in sorghum WIS and that after 30 minutes of incubation ranged from 8.34 ± 4.58 in wheat AIS to 75.69 ± 1.17 in kodo millet AIS. GDRI of different fibers after 60 minutes of incubation varied from 8.40 ± 0.49 in ragi AIS to 78.12 ± 1.17 in kodo millet AIS whereas, that after 120 minutes of incubation ranged from 6.72 ± 0.57 in ragi AIS to 69.44 ± 0.71 in kodo millet WIS.
Effect of insoluble fibers on starch digestibility: The effects of various insoluble fibers on starch digestibility were demonstrated by changes in the glucose content in dialysate as a function of time when starch, fiber and diastase were dialysed against distilled water (Table 6, Figure 6). After 10 min of incubation the comparable glucose content in dialysate with fiber addition indicated that there was significant difference in starch digestibility in first 10 min in all fibers from six samples. Kodo millet IDF retarded the starch digestibility to the greatest extent after 10 min of incubation (glucose in dialysate being 1.84 ± 0.28 micromole) and the wheat IDF retarded the least (glucose in dialysate being 25.99 ± 0.94 micromole) as compared to the control value of 31.43 ± 1.08 micromoles of glucose in dialysate. Similarly after 30 min of incubation Kodo millet IDF retarded the starch digestibility to the greatest extent (glucose in dialysate being 9.43 ± 0.66 micromole)
0
0.2
0.4
0.6
0.8
1
1.2
1.4
1.6
1.8
IDF AIS WIS IDF AIS WIS IDF AIS WIS IDF AIS WIS IDF AIS WIS IDF AIS WIS
KODO GUNJI JHIPIRI RAGI WHEAT SORGHUM
Glucos
e conc
entrati
on (mi
limole
/gm)
5 mM/hr 10 mM/hr
25 mM/hr 50 mM/hr
IDF-Insoluble dietary fiber AIS-Alcohol insoluble solid WIS-Water insoluble solid
Figure 3: Glucose adsorption capacity of various insoluble fibers in different concentration of glucose.
GLUCOSE IN DIALYSATE(Micromole)FIBER SAMPLE 10min 30min 60min 120minCONTROL 34.59 ± 1.48a 79.97 ± 1.34a 110.13 ± 1.54a 144.77 ± 1.07a
Kodo (Kodo millet) IDF 31.29 ± 1.15bc 46.39 ± 1.16d 71.79 ± 0.89d 73.01 ± 1.37f
Kodo (Kodo millet) AIS 9.04 ± 0.61h 19.45 ± 1.05h 24.05 ± 1.17k 51.27 ± 1.60i
Kodo (Kodo millet) WIS 11.25 ± 0.85gh 21.31 ± 0.89gh 31.33 ± 1.37j 44.25 ± 1.19j
Gunji (Proso millet) IDF 31.67 ± 0.89abc 47.25 ± 0.94d 71.52 ± 1.36d 73.07 ± 1.45f
Gunji (Proso millet) AIS 18.77 ± 1.10f 26.46 ± 1.05fg 48.1 ± 0.82g 55.75 ± 0.94h
Gunji (Proso millet) WIS 14.28 ± 0.93g 24.97 ± 0.89g 40.8 ± 1.01hi 72.58 ± 0.99f
Jhipiri(Barnyard millet) IDF 23.41 ± 0.99e 45.42 ± 1.22d 57.59 ± 1.76f 95.96 ± 1.10c
Jhipiri(Barnyard millet) AIS 9.81 ± 0.70h 30.48 ± 1.51f 42.39 ± 1.27h 65.39 ± 1.04g
Jhipiri(Barnyard millet) WIS 26.89 ± 0.72d 32.36 ± 1.44ef 49.23 ± 1.26g 69.68 ± 1.43f
Ragi (Finger millet) IDF 31.19 ± 1.52c 47.64 ± 2.51d 63.95 ± 1.04e 77.62 ± 1.68e
Ragi (Finger millet) AIS 28.07 ± 1.40cd 73.08 ± 1.80b 100.85 ± 0.99b 135.05 ± 1.36b
Ragi (Finger millet) WIS 29.78 ± 1.48bcd 64.49 ± 1.68c 86.14 ± 1.83c 133.61 ± 1.55b
Wheat IDF 26.75 ± 1.71d 35.1 ± 0.57e 40.57 ± 1.32hi 62.93 ± 1.49g
Wheat AIS 29.40 ± 1.13bcd 73.02 ± 2.57b 101.49 ± 1.08b 134.90 ± 0.64b
Wheat WIS 23.73 ± 1.30de 45.75 ± 1.21d 68.80 ± 1.47d 89.72 ± 0.87d
Sorghum(Great millet) IDF 32.73 ± 1.28abc 48.58 ± 1.65d 58.23 ± 1.60f 76.92 ± 1.19ef
Sorghum(Great millet) AIS 11.73 ± 0.91gh 20.60 ± 1.25h 36.09 ± 1.46i 56.03 ± 0.92h
Sorghum(Great millet) WIS 9.77 ± 1.06h 20.92 ± 1.13h 37.43 ± 0.83i 46.90 ± 1.18j
Values (mean ± SE, n=6) in same column with different letter superscripts are significantly different, (p<0.05)
Table 5: Effects of various insoluble fibers on glucose diffusion.
Citation: Bisoi PC, Sahoo G, Mishra SK, Das C, Das KL (2012) Hypoglycemic Effects of Insoluble Fiber Rich Fraction of Different Cereals and Millets. J Food Process Technol 3:191. doi:10.4172/2157-7110.1000191
Page 7 of 11
Volume 3 • Issue 7 • 1000191J Food Process TechnolISSN:2157-7110 JFPT, an open access journal
and the porso millet WIS retarded the least (glucose in dialysate being 39.25 ± 1.45 micromole) as compared to the control value of 60.14 ± 1.34 micromoles of glucose in dialysate. Kodo millet IDF again retarded the starch digestibility to the greatest extent after 60 min of incubation (glucose in dialysate being 18.88 ± 0.98 micromole) and the sorghum WIS did not retard it at all (glucose in dialysate being 96.57 ± 0.96 micromole) as compared to the control value of 96.17 ± 0.61 micromoles of glucose in dialysate. Further incubation for 120 min porso millet IDF retarded it to the highest extent (glucose in dialysate being 38.95 ± 1.69 micromole) and the sorghum WIS almost did not have any effect on it at all (glucose in dialysate being 160.84 ± 2.29 micromole) as compared to the control value of 160.84 ± 2.29 micromoles of glucose in dialysate. As the incubation time increases the results showed that glucose content in the dialysate increased with subsequent increases of time. The three types of insoluble fibers in all six samples were found to retard starch digestibility effectively along the enzymatic digestion process. When compared with control, the glucose content in the dialysate with all insoluble fibers was less than that of control excepting the sorghum WIS after 60 min of incubation. In case of kodo millet, proso millet, and barnyard millet glucose content in dialysate was higher in WIS than in IDF and AIS but in wheat it was highest in IDF at 10 and 30 min highest in WIS at 60 and 120 min whereas, in case of finger millet glucose content in dialysate was highest in AIS at 10, 30 and 60 min but highest in WIS at 120min.
Effects of various insoluble fibers on alpha-amylase activity: In
(Table 7,8, Figure 7,8) the effects of various insoluble fibers on alpha-amylase activity are presented in terms of glucose production rate and residual amylase activity (%). The reduction in glucose production rate was lower than that of control in all the samples studied. Glucose production rate was higher in AIS than IDF and WIS of all the samples. Among the six samples finger millet have highest glucose production rate in IDF, AIS and WIS (8.61 ± 1.00, 19.67 ± 1.27 and 18.69 ± 1.56 respectively) and Sorghum IDF showed the lowest value (4.55 ± 0.86). The reduction in glucose production rate could also be presented in another way by means of decrease in residual amylase activity (%) which is the percentage of glucose production rate by addition of fiber over control. In this case also the AIS of all six samples have higher residual amylase activity as compared to their corresponding IDF and WIS, finger millet being the highest (97.67 ± 8.76) and sorghum being the lowest (53.89 ± 5.99). Sorghum IDF reduced the α-amylase activity to the lowest extent (21.7 ± 3.32).
DiscussionDegenerative diseases such as diabetes mellitus become prevalent
in the population due to more sedentary lifestyle in name of modernization and westernization. Dietary fiber plays an integral role in the management of diabetes mellitus. High dietary fiber content of millets and less prevalence of metabolic disorders in tribal people regularly consuming it prompted us to undertake a comparative study on hypoglycemic and anti-oxidative efficacy of insoluble fiber rich fractions of different cereals and millets commonly grown in tribal regions of Odessa.
Proximate analysis
Proximate composition analysis was performed for both whole grains (Table 1) and bran samples (Table 2). As dried and stored grains were procured so there was slight variation in moisture and dry matter content in all the grain samples studied (Table 1). The ether extractives varied from 4.35 ± 0.164% in barnyard millet to 1.003 ± 0.057% in proso millet and high crude fiber content was observed in all the grains studied (Table 1). The crude protein content of grains ranged from 10.39 ± 0.248% in barnyard millet and 10.25 ± 0.530% in wheat to 5.48 ± 0.449% in kodo millet. Ash content also varied from 3.59 ± 0.246% in kodo millet and 3.59 ± 0.234% in proso millet to 1.29 ± 0.085% in great millet whereas; the NFE% was almost similar in all the cases. These types of variations in the composition might be due to the difference in genetic makeup and environment in different grains and our results were in accordance to [2,29]. It was clear from the results that the crude fiber% and the ash content were higher in bran sample than the whole grain in all six samples studied (Table 2). Hadimani and Malleshi [3] reported similar findings in different millets. Thus the bran samples were used for extraction of fiber and in vitro evaluation of hypoglycemic effect of insoluble fibers whereas, for evaluation of antioxidant, antibacterial antifungal property and the polyphenol content whole grain powder was used with methanol as solvent.
Hypoglycemic effect of insoluble fibers from millets in vitro
In vitro hypoglycemic effect of insoluble fibers from different cereal and millet samples was studied by assessing the effect of various fibers on glucose adsorption capacity (GAC), glucose diffusion, GDRI (Glucose dialysis retardation index), starch digestibility and alpha-amylase activity to have a simulation of digestion and absorption of carbohydrates in the intestine. These experiments were designed to form the basis of simple methods to measure the potential biological effects of various insoluble dietary fibers. Discussion of each of these tests was given separately to have better understanding.
0
20
40
60
80
100
120
140
160
IDF
AIS
WIS
IDF
AIS
WIS
IDF
AIS
WIS
IDF
AIS
WIS
IDF
AIS
WIS
IDF
AIS
WIS
CONTROL KODO GUNJI JHIPIRI RAGI WHEAT SORGHUM
Glu
cose
con
cent
ratio
n in
mic
rom
ole
10min30min60min120min
IDF-Insoluble dietary fiber AIS-Alcohol insoluble solid WIS-Water insoluble solid
Figure 4: Effects of various insoluble fibers on glucose diffusion.
0
10
20
30
40
50
60
70
80
90
IDF AIS WIS IDF AIS WIS IDF AIS WIS IDF AIS WIS IDF AIS WIS IDF AIS WIS
KODO GUNJI JHIPIRI RAGI WHEAT SORGHUM
Glu
cose
dia
lysi
s re
tard
atio
n in
dex
(%)
10min30min60min120min
IDF-Insoluble dietary fiber AIS-Alcohol insoluble solid WIS-Water insoluble solid
Figure 5: Effects of various insoluble fibers on glucose dialysis retardation index (GDRI).
Citation: Bisoi PC, Sahoo G, Mishra SK, Das C, Das KL (2012) Hypoglycemic Effects of Insoluble Fiber Rich Fraction of Different Cereals and Millets. J Food Process Technol 3:191. doi:10.4172/2157-7110.1000191
Page 8 of 11
Volume 3 • Issue 7 • 1000191J Food Process TechnolISSN:2157-7110 JFPT, an open access journal
Effect of insoluble fibers on glucose adsorption capacity: (Table 3 Figure 1) revealed that all fiber samples at different glucose concentration (5, 10, 25 and 50 milimol/lit) could bind glucose effectively and amount of glucose bound to these fibers were concentration dependant and increased with higher concentration of glucose. There is significant difference (P<0.05) in the glucose adsorption capacity (GAC) of different insoluble dietary fibers in all the concentrations of glucose (Table 3). Ou et al [30] have reported that insoluble fiber derived from wheat bran could adsorb glucose at different concentrations to decrease the concentration of glucose available in small intestine. The finger millet WIS showed highest GAC (0.18 ± 0.01 mM/g) at normal (5 mM/l) concentration whereas, at a higher glucose concentration of 50 mM/l wheat IDF exhibited highest GAC (1.65 ± 0.02 mM/g). At low concentration of glucose WIS in all cases showed higher adsorption of glucose but interestingly it was reversed at higher concentration of glucose and IDF in all grain samples showed high GAC. Adsorption of glucose by insoluble fibers might be attributed to the increased water holding capacity of the fibers. When the glucose concentration reduced to 5 mmol/litre, the GAC found to be very low which indicated that the insoluble fiber might help to retain glucose to small extent in the intestinal lumen even at a low glucose concentration. Our findings were in binding with the findings of [31]. Further validation of these
effects in vivo is required to confirm the hypoglycemic ability of these fibers.
Effect of insoluble fibers on diffusion of glucose: Diffusion of glucose from the dialysis membrane was affected by dietary fibers (Table 4, Figure 2). Diffused glucose for different insoluble fibers was less affected at 10 and 30 minutes but at 60 and 120 minutes it was much affected and showed higher retardation in glucose diffusion in all the cases as compared to control. By hypothesis the effect of dietary fiber on diffusion was mainly due to their viscosity. The diffusion rate would decrease as time increased because of the gradual increase in viscosity of the medium. The diffusion rate of glucose was decreased by insoluble fibers even if they contribute less to viscosity [30]. This phenomenon can be explained by adsorption of dietary fiber for glucose. Some authors indicated that the retardation in glucose diffusion and absorption due to fibers was affected by viscosity of intestinal content [32]. The retardation effect of insoluble fibers which contribute little to viscosity of solution might be probably attributed to their adsorption capacity. At beginning of dialysis glucose diffusion might be affected by adsorption of glucose on fiber and viscosity so diffusion rate was slow (though glucose concentration is higher inside the dialysis bag) with progress of time diffusion of glucose affected by only viscosity of fiber. The retardation of glucose diffusion might be due to the physical
FIBER SAMPLE 10min 30min 60min 120min Kodo (Kodo millet) IDF 8.67 ± 5.35d 42.03 ± 0.63d 34.72 ± 1.48h 49.59 ± 0.62g
Kodo (Kodo millet) AIS 73.89 ± 1.19a 75.69 ± 1.17a 78.12 ± 1.17a 64.55 ± 1.28b
Kodo (Kodo millet) WIS 67.43 ± 2.17ab 73.37 ± 0.91ab 71.61 ± 0.89b 69.44 ± 0.71a
Gunji (Proso millet) IDF 7.14 ± 6.28d 40.82 ± 1.65d 35.06 ± 0.87h 49.54 ± 0.82g
Gunji (Proso millet) AIS 45.15 ± 4.19bc 66.93 ± 1.09bc 56.27 ± 1.04e 61.5 ± 0.41cd
Gunji (Proso millet) WIS 58.03 ± 3.93b 68.78 ± 0.94b 62.89 ± 1.24d 49.86 ± 0.66fg
Jhipiri(Barnyard millet) IDF 32.02 ± 2.77c 43.23 ± 0.94d 47.7 ± 1.43f 33.72 ± 0.43j
Jhipiri(Barnyard millet) AIS 71.07 ± 3.03ab 61.97 ± 1.34c 61.42 ± 1.53d 54.83 ± 0.66c
Jhipiri(Barnyard millet) WIS 21.31 ± 4.83cd 59.54 ± 1.61c 55.25 ± 1.36e 51.88 ± 0.76f
Ragi (Finger millet) IDF 8.19 ± 8.09d 40.13 ± 3.98d 41.9 ± 0.93g 46.34 ± 1.47h
Ragi (Finger millet) AIS 18.55 ± 3.71cd 8.34 ± 3.58f 8.40 ± 0.49j 6.72 ± 0.57k
Ragi (Finger millet) WIS 13.21 ± 5.23d 19.06 ± 3.52e 21.82 ± 0.69i 7.72 ± 0.57k
Wheat IDF 20.99 ± 8.48cd 56.09 ± 0.45c 63.17 ± 0.99d 56.55 ± 0.80e
Wheat AIS 14 ± 5.58d 8.34 ± 4.58f 7.79 ± 1.04j 6.78 ± 1.13k
Wheat WIS 30.73 ± 4.88c 42.67 ± 2.01d 37.48 ± 1.49h 38.03 ± 0.38i
Sorghum(Great millet) IDF 3.92 ± 7.26d 39.02 ± 2.97d 47.01 ± 2.01f 46.88 ± 0.53h
Sorghum(Great millet) AIS 65.45 ± 3.75a 74.28 ± 1.35ab 67.14 ± 1.67c 61.27 ± 0.83d
Sorghum(Great millet) WIS 71.61 ± 3.12ab 73.9 ± 1.09ab 65.98 ± 0.91cd 67.58 ± 0.93a
Values (mean ± SE, n=6) in same column with different letter superscripts are significantly different, (p<0.05)
Table 6: Effects of various insoluble fibers on glucose dialysis retardation index (GDRI).
0
20
40
60
80
100
120
140
160
180
IDF AIS WIS IDF AIS WIS IDF AIS WIS IDF AIS WIS IDF AIS WIS IDF AIS WIS
CONTROL KODO GUNJI JHIPIRI RAGI WHEAT SORGHUM
Gluc
ose
conc
entra
tion
in m
icro
mol
e
10min30min60min120min
IDF-Insoluble dietary fiber AIS-Alcohol insoluble solid WIS-Water insoluble solid
Figure 6: Effects of various insoluble fibers on starch digestibility.

Citation: Bisoi PC, Sahoo G, Mishra SK, Das C, Das KL (2012) Hypoglycemic Effects of Insoluble Fiber Rich Fraction of Different Cereals and Millets. J Food Process Technol 3:191. doi:10.4172/2157-7110.1000191
Page 9 of 11
Volume 3 • Issue 7 • 1000191J Food Process TechnolISSN:2157-7110 JFPT, an open access journal
obstacle presented by fiber particles and entrapment of glucose within the network of fibers [33,34]. Thus we can conclude that insoluble fibers have effects delaying glucose diffusion and subsequently decrease glucose absorption in gastrointestinal tract and millets have sufficient capacity to reduce glucose diffusion and adsorption inside the gastrointestinal tract.
Effect of insoluble fibers on glucose dialysis retardation index (GDRI): (Table 5, Figure 3) showed the variation in GDRI with the addition of different insoluble fibers. GDRI is a useful in vitro index to predict the effect of fibers on the delay in the gastro intestinal tract [34]. After 10 minutes interval, the GDRI of WIS and AIS of all the samples was significantly (P<0.05) higher than that of IDF. As the time increased to 30, 60 and 120 min, the trend in the values of GDRI was
similar to that of 10 minutes (Table 5). All these results revealed that all the insoluble fibers could effectively hinder the glucose from diffusing out of the dialysis membrane and might be efficient in retarding the glucose absorption. The dialysis experiments mimic events occurring in the small intestine. Movements in these systems is not by true diffusion but is assisted by the convective activity of intestinal contractions in vivo or by stirring of in vitro models [35]. Our experimental design with stirring simulates the biological system more closely than an unstirred system. The glucose dialysis studies mimic events occurring in the jejunum. In this experiment nutrient absorption was modeled by in vitro measurements of the solute flow from a dialysis bag. The retardation of the nutrient flow into the external medium is an indication of the modulating effect of the fibers on glucose absorption
GLUCOSE INDIALYSATE(Micromole)FIBER SAMPLE 10min 30min 60min 120minCONTROL 31.43 ± 1.08a 60.14 ± 1.34a 96.17 ± 0.61a 164.61 ± 0.99ab
Kodo (Kodo millet) IDF 1.84 ± 0.28i 9.43 ± 0.66h 18.88 ± 0.98h 44.76 ± 1.39j
Kodo (Kodo millet) AIS 3.06 ± 0.29i 18 ± 0.5618 49.19 ± 1.56e 108.18 ± 2.18f
Kodo (Kodo millet) WIS 14.67 ± 0.60e 31.48 ± 1.58cd 73.73 ± 1.65b 131.37 ± 1.15d
Gunji (Proso millet) IDF 4.51 ± 0.79hi 13.87 ± 1.20g 26.38 ± 1.64g 38.95 ± 1.69k
Gunji (Proso millet) AIS 12.79 ± 0.79ef 21.09 ± 1.09ef 52.26 ± 1.58d 105.63 ± 1.35f
Gunji (Proso millet) WIS 19 ± 0.75d 39.25 ± 1.45b 55.43 ± 0.89d 139.59 ± 1.03c
Jhipiri(Barnyard millet) IDF 7.99 ± 0.84gh 18.78 ± 1.48f 34.43 ± 1.44f 60.88 ± 1.62i
Jhipiri(Barnyard millet) AIS 11.50 ± 1.17f 30.16 ± 1.12c 58.69 ± 1.33d 97.76 ± 1.08g
Jhipiri(Barnyard millet) WIS 13.47 ± 0.79e 32.74 ± 1.99c 63.23 ± 1.28c 101.21 ± 1.90g
Ragi (Finger millet) IDF 6.02 ± 0.89h 17.86 ± 1.40f 35.34 ± 1.05f 64.71 ± 1.96hi
Ragi (Finger millet) AIS 10.09 ± 0.85f 22.75 ± 1.16e 56.15 ± 2.00d 134.5 ± 1.13d
Ragi (Finger millet) WIS 5.64 ± 0.91h 17.43 ± 1.57fg 55.26 ± 1.41d 140.47 ± 1.96c
Wheat IDF 25.99 ± 0.94b 37.12 ± 1.13b 50.97 ± 1.18e 68.68 ± 1.12h
Wheat AIS 5.93 ± 0.77h 18.74 ± 1.11f 48.73 ± 1.09e 121.51 ± 1.68e
Wheat WIS 7.45 ± 0.94gh 31.15 ± 1.13cd 75.00 ± 1.06b 136.51 ± 1.74c
Sorghum(Great millet) IDF 8.98 ± 0.74g 18.00 ± 1.33f 33.27 ± 1.35f 57.89 ± 1.25i
Sorghum(Great millet) AIS 5.03 ± 0.84hi 28.33 ± 1.40d 94.86 ± 1.11a 159.25 ± 1.46b
Sorghum(Great millet) WIS 22.51 ± 0.99c 32.08 ± 1.25c 96.57 ± 0.96a 160.84 ± 2.29b
Values (mean ± SE, n=6) in same column with different letter superscripts are significantly different, (p<0.05)
Table 7: Effects of various insoluble fibers on starch digestibility.
GLUCOSE PRODUCTION RATE(µmole/hr) RESIDUAL AMYLASE ACTIVITY (%)CONTROL 20.47 ± 0.95a FIBER SAMPLE Kodo (Kodo millet) IDF 5.01 ± 0.75e Kodo (Kodo millet) IDF 24.17 ± 3.02e
Kodo (Kodo millet) AIS 19.86 ± 1.43a Kodo (Kodo millet) AIS 97.37 ± 6.48a
Kodo (Kodo millet) WIS 17.78 ± 1.05ab Kodo (Kodo millet) WIS 87.19 ± 4.57ab
Gunji (Proso millet) IDF 4.59 ± 0.79e Gunji (Proso millet) IDF 22.55 ± 3.95e
Gunji (Proso millet) AIS 11.93 ± 1.53c Gunji (Proso millet) AIS 58.01 ± 6.56c
Gunji (Proso millet) WIS 11.12 ± 1.21cd Gunji (Proso millet) WIS 54.13 ± 5.45cd
Jhipiri(Barnyard millet) IDF 5.27 ± 0.71e Jhipiri(Barnyard millet) IDF 25.39 ± 2.67e
Jhipiri(Barnyard millet) AIS 15.50 ± 1.17b Jhipiri(Barnyard millet) AIS 77.09 ± 8.29b
Jhipiri(Barnyard millet) WIS 8.94 ± 1.09c Jhipiri(Barnyard millet) WIS 43.18 ± 4.09cd
Ragi (Finger millet) IDF 8.61 ± 1.00d Ragi (Finger millet) IDF 41.59 ± 3.86d
Ragi (Finger millet) AIS 19.67 ± 1.27a Ragi (Finger millet) AIS 97.67 ± 8.76a
Ragi (Finger millet) WIS 18.69 ± 1.56a Ragi (Finger millet) WIS 92.37 ± 9.42ab
Wheat IDF 4.91 ± 1.03e Wheat IDF 23.18 ± 4.01e
Wheat AIS 10.87 ± 1.15cd Wheat AIS 53.68 ± 6.22cd
Wheat WIS 15.33 ± 1.28b Wheat WIS 74.84 ± 5.09b
Sorghum(Great millet) IDF 4.55 ± 0.86e Sorghum(Great millet) IDF 21.7 ± 3.32e
Sorghum(Great millet) AIS 11.14 ± 1.54cd Sorghum(Great millet) AIS 53.89 ± 5.99cd
Sorghum(Great millet) WIS 9.37 ± 1.30c Sorghum(Great millet) WIS 45.36 ± 5.12cd
Values (mean ± SE, n=6) in same column with different letter superscripts are significantly different, (p<0.05)
Table 8: Effect of various insoluble fibers on alpha-amylase activity.

Citation: Bisoi PC, Sahoo G, Mishra SK, Das C, Das KL (2012) Hypoglycemic Effects of Insoluble Fiber Rich Fraction of Different Cereals and Millets. J Food Process Technol 3:191. doi:10.4172/2157-7110.1000191
Page 10 of 11
Volume 3 • Issue 7 • 1000191J Food Process TechnolISSN:2157-7110 JFPT, an open access journal
in the jejunum. Ability of these fibres to retard the absorption of glucose in the gastrointestinal tract is a function of their viscosity [36]. The modest effects on glucose dialysis retardation index seen with insoluble fibres are in keeping with their effect on glucose absorption in man. Based on these results, it was conceived that these insoluble fibers could effectively adsorb glucose, delay the glucose diffusion and subsequently postpone the glucose absorption in the gastro-intestinal tract.
Effect of insoluble fibers on starch digestibility: The effects of various insoluble fibers on starch digestibility were presented in (Table 6, Figure 4) IDF of all the grains excepting wheat retarded the starch digestibility significantly (P<0.05), even at 10 minutes of incubation there was 70 to >90% retardation of starch digestibility. Similar was the case with increasing time to 30, 60 and 120 minutes (Table 6). According to view of [37] dietary fibers can be adsorbed to starch and thus hinder hydrolysis of starch by alpha-amylase.
The various millet fiber fractions modified enzymatic starch digestion similarly. Compared to control initial rate of starch digestion was not modified by the presence of AIS and WIS fibers but a decrease in final rate and total starch degradation was noted. This decrease may be attributed to a direct effect of fiber on amylase activity due to adsorption of enzyme on the fibers or a decrease in activity due to viscosity or pH modification of medium. Presence of fiber might have also influenced the accessibility of the enzyme to its substrate. In the present study, the apparent reduction in the glucose contents in the dialysate by the presence of insoluble fibers indicated that both the starch degradation and glucose diffusion could be delayed by the insoluble fibers of the millets, even though glucose is actually absorbed into the small intestine through an active process in the human body.
In most of the millets taken, the IDF has more effect on decreasing starch digestibility. The apparent reduction in glucose content in the
dialysate by presence of insoluble fibers (Table 6) indicated that both the starch degradation and glucose diffusion could be delayed by the insoluble fibers even through glucose is actually absorbed into the small intestine through an active process in the human body.
Effect of insoluble fibers on alpha-amylase activity: Effect of various insoluble fibers from different millet species showed that the IDF insoluble fibers could exhibit significant (P<0.05) effect in decreasing the alpha-amylase activity (Table 7, Figure 5 and 6) and starch digestibility (Table 6, Figure 4) This effect of insoluble fibers of millets might be due to several possible factors such as fiber concentration, presence of inhibitor on fibers, capsulation of starch and enzyme by fibers, reduced accessibility of the starch and direct adsorption of enzyme on fibers leading to the decrease in amylase activity [31]. The variation in the inhibitory activity to α-amylase among the different insoluble fibers suggested that the inhibition depended on the kind of fiber.
In this in vitro study the abilities of insoluble fibers from millet to adsorb glucose, slowed down glucose diffusion and starch digestibility and decrease the activity of alpha-amylase suggested that they might have hypoglycemic effects in delaying release of glucose from starch, reducing rate of glucose adsorption and hence controlling concentration of post prandial serum glucose [33].
The potential hypoglycemic effects of these fibers suggested that they could be incorporated as low-calories bulk ingredient in high fiber foods to lower post prandial serum glucose level and reduce calories levels. Further detailed studies are needed to investigate whether the insoluble fibers from the millets and cereals studied are competent inhibitors of α-amylase or simply act as a barrier between the amylase and starch.
Conclusion• In-vitro studies on hypoglycemic effects of insoluble fibers
of different cereals and millets (kodo millet, proso millet, barnyard millet, finger millet, wheat and sorghum) indicated that,
• All these grains are having nutritional composition either comparable or better than most of the commonly used grains so could be used as staple food.
• All the three types of insoluble fibers from the six millet and cereal samples taken have potent hypoglycemic effect. Thus they can be included in diet having low carbohydrate and high fiber content, which will be beneficial in management of diabetes both in human being and pet animals.
References
1. Hulse JH, Laing EM, Pearson OE (1980) Sorghum and the millets: Their composition and Nutritive value. Academic press Inc., New York.
2. Gordon DT (1989) Functional properties Vs physiological action of total dietary fiber. Cereal foods world 34: 517-525.
3. Hadimani NA, Malleshi NG (1993) Studies on milling, physico-chemical properties, Nutrient composition and dietary fibre content of millets. J. Food Sci. Technol 30: 17-20.
4. AOAC (1995) Official methods of analysis (16th ed.); Washington, DC: Association of Official Analytical Chemists.
5. Jeraci JL, Van Soest PJ (1990) Improved methods for analysis and biological characterization of fiber. Adv Exp Med Biol 270: 245-263.
6. Plaami S, Kumpulainen J (1994) Soluble and insoluble Dietary fiber contents of various breads, pastas, and rye flours on the Finnish market, 1990-1991. J. of Food composition and analysis 7: 134-143.
0
5
10
15
20
25
CONTROLKODO
GUNJI
JHIPIRIRAGI
WHEAT
SORGHUM
Gluc
ose C
once
ntrati
on (M
icrom
ole/hr
)
IDFAISWIS
IDF-Insoluble dietary fiber AIS-Alcohol insoluble solid WIS-Water insoluble solid
Figure 7: Effect of insoluble fibers on alpha amylase activity showing glucose production rate.
0
20
40
60
80
100
120
KODO GUNJI JHIPIRI RAGI WHEAT SORGHUM
Amyla
se act
ivity
(%)
IDFAISWIS
Figure 8: Effect of insoluble fibers on alpha amylase activity showing Residual amylase activity in %.
Citation: Bisoi PC, Sahoo G, Mishra SK, Das C, Das KL (2012) Hypoglycemic Effects of Insoluble Fiber Rich Fraction of Different Cereals and Millets. J Food Process Technol 3:191. doi:10.4172/2157-7110.1000191
Page 11 of 11
Volume 3 • Issue 7 • 1000191J Food Process TechnolISSN:2157-7110 JFPT, an open access journal
7. Schieber A, Stirtzing FC, Carle R (2001) By-products of plant food processing as a source of functional compounds - recent developments. Trends. Food. Science. Technol 12: 401-413.
8. Mertens DR (2003) Challenges in measuring insoluble dietary fiber. J Anim Sci 81: 3233-3249.
9. Schneeman BO (1987) Soluble vs Insoluble Fiber--Different Physiological Responses. Food Technology 81-82.
10. Schneeman BO (1986) Dietary fiber: Physical and chemical properties, Methods of analysis, and physiological effects. Food Technology 104-110.
11. Stephen A (1985) Constipation, in “Dietary fiber, fiber-depleted foods and disease.” Academic Press, London.
12. Liener IE, Kakade ML (1980) Protease Inhibitors. In: Liener IE, ed. Toxic constituents of plant food stuff, Second ed, New York: Academic Press.
13. Dunaif G, Schneeman BO (1981) The effect of dietary fiber on human pancreatic enzyme activity in vitro. Am J Clin Nutr 34: 1034-1035.
14. Miranda PM, Horwitz DL (1978) High-fiber diets in the treatment of diabetes mellitus. Ann Intern Med 88: 482-486.
15. Jenkins DJ, Wolever TM (1981) Slow release carbohydrate and the treatment of diabetes. Proc Nutr Soc 40: 227-235.
16. Poplin LE (1982) Diabetes that first occurs in older people. Nutrition Today 17: 4-13.
17. Tanchoco C, Bassig CC, Castro MCA, Rodrigieez MP, Quimpo JA (1994) Effects of unpolished rice with varying levels of fibres on blood glucose. Phil. J. Internal medicine 32: 35-46.
18. Drucker DJ, Philippe J, Mojsov S, Chick WL, Habener JF (1987) Glucagon-like peptide I stimulates insulin gene expression and increases cyclic AMP levels in a rat islet cell line. Proc Natl Acad Sci U S A 84: 3434-3438.
19. D’Alessio DA, Kahn SE, Leusner CR, Ensinck JW (1994) Glucagon-like peptide 1 enhances glucose tolerance both by stimulation of insulin release and by increasing insulin-independent glucose disposal. J Clin Invest 93: 2263-2266.
20. Riccardi G, Rivellese AA (1991) Effects of dietary fiber and carbohydrate on glucose and lipoprotein metabolism in diabetic patients. Diabetes Care 14: 1115-1125.
21. Jenkins DJ, Wolever TM, Leeds AR, Gassull MA, Haisman P, et al. (1978) Dietary fibres, fibre analogues, and glucose tolerance: importance of viscosity. Br Med J 1: 1392-1394.
22. Stasse-Wolthuis M, Albers HF, van Jeveren JG, Wil de Jong J, Hautvast JG, et al. (1980) Influence of dietary fiber from vegetables and fruits, bran or citrus pectin on serum lipids, fecal lipids, and colonic function. Am J Clin Nutr 33: 1745-1756.
23. Isaksson G, Lundquist I, Ihse I (1982) Effect of dietary fiber on pancreatic enzyme activity in vitro. Gastroenterology 82: 918-924.
24. Blackburn NA, Redfern JS, Jarjis H, Holgate AM, Hanning I, et al. (1984) The mechanism of action of guar gum in improving glucose tolerance in man. Clin Sci (Lond) 66: 329-336.
25. Wood PJ, Braaten JT, Scott FW, Riedel D, Poste LM (1990) Comparisons of viscous properties of oat and guar gum and the effects of these and oat bran on glycemic index. J. Agric. Food Chem 38: 753-757.
26. Gourgue CMP, Champ MJM, Lozano Y, Laval JD (1992) Dietary fiber from mango Byproducts: Characterization and hypoglycemic effects determined by in vitro methods. J.Agri.Food.Chem 40: 1864-1868.
27. Chau CF, Chen CH, Lee MH (2004) Comparison of the characterstics, functional propoties & in vitro hypoglycemic effects of various Carrot insoluble fibre rice fractions. Lebensm-wis., U-Technol 37: 155-160.
28. Chau CF, Chen CH, Lin CY (2004) Insoluble fiber rich factions derived from Averrhoa Carambola: hypoglycemic effects determined by in vitro method. Leben. Wissen & Technol 37: 331-335.
29. Hulse JH, Laing EM, Pearson OE (1980) Sorghum and the millets: Their composition and Nutritive value, Academic press Inc., New York.
30. Ou S, Kwok K, Li Y, Fu L (2001) In vitro study of possible role of dietary fiber in lowering postprandial serum glucose. J Agric Food Chem 49: 1026-1029.
31. Chau CF, Chen CH, Lee MH (2004) Comparison of the characterstics, functional propoties & in vitro hypoglycemic effects of various Carrot insoluble fibre rice fractions. Lebensm-wis., U-Technol 37: 155-160.
32. Jenkins DJA, Jenkins MJA, Wolver TMS, Taylor RH, Ghafari H (1986) Slow release carbohybrate: mechanism of action of viscous fiber. J. Clin. Nutr. Gastroenterol 1: 237-241.
33. Nishimune T, Yakushiji T, Sumimoto T, Taguchi S, Konishi Y, et al. (1991) Glycemic response and fiber content of some foods. Am J Clin Nutr 54: 414-419.
34. Lopez G, Ros G, Rinicon F, Periago MJ, Mertinez MC et al. (1996) Relationship between physical and hydration properties of soluble and insoluble fiber of artichoke. J. Agri. Food. Chem 44: 2773-2778.
35. Adiotomre J, Eastwood MA, Edwards CA, Brydon WG (1990) Dietary fiber: in vitro methods that anticipate nutrition and metabolic activity in humans. Am J Clin Nutr 52: 128-134.
36. Jenkins DJA, Jenkins MJA, Wolver TMS, Taylor RH, Ghafari H (1986) Slow release carbohybrate: mechanism of action of viscous fiber. J. Clin. Nutr. Gastroenterol 1: 237-241.
37. Annison G, Topping DL (1994) Nutritional role of resistant starch: chemical structure vs physiological function. Annu Rev Nutr 14: 297-320.
![U. Matter 11 · [EURO]] • Further analysis of the gravimetric PM filters on the SOluble Fraction (SOF), INSOluble Fraction (INSOF) and sulfates using X-Ray Diffraction (XRD) •](https://img.dokumen.tips/doc/110x75/606b659c85547e5176759ea3/u-matter-11-euro-a-further-analysis-of-the-gravimetric-pm-filters-on-the-soluble.jpg)