Embed Size (px)
Citation preview

1
Hypera Pharma grows 12.6% in 2Q18, with Gross Margin expansion and 12.1% EBITDA and
22.3% Net Income from Continuing Operations growth
São Paulo, July 27, 2018 – Hypera S.A. (“Hypera Pharma” or “Company”; BM&FBovespa: HYPE3; Reuters: HYPE3.SA;
Bloomberg: HYPE3 BZ; ISIN: BRHYPEACNOR0; ADR: HYPMY) announces its financial results for the second quarter of
2018. Financial data disclosed here are taken from the Consolidated Quarterly Financial Statements of Hypera S.A.,
prepared in accordance with the Brazilian Accounting Pronouncement Committee (CPC) and International Financial
Reporting Standards (IFRS) issued by the International Accounting Standards Board (IASB).
Highlights
Net Revenue of R$920.1 million in the quarter, up 12.6% year over year
Gross Profit of R$668.5 million in 2Q18, with 0.5 percentage point of gross margin expansion over 2Q17
EBITDA from Continuing Operations of R$339.5 million in the quarter, with 36.9% EBITDA margin
Net Income from Continuing Operations of R$278.8 million, a 22.3% increase over 2Q17
Operating Cash Flow of R$344.9 million, up 12.5% over 2Q17
Table 1
(R$ million) 2Q17 % NR 2Q18 % NR ∆ % 1H17 % NR 1H18 % NR ∆ %
Net Revenue 817.4 100.0% 920.1 100.0% 12.6% 1,632.3 100.0% 1,847.9 100.0% 13.2%
Gross Profit 590.2 72.2% 668.5 72.7% 13.2% 1,191.7 73.0% 1,358.1 73.5% 14.0%
S,G&A (ex-Marketing) (155.8) -19.1% (163.9) -17.8% 5.2% (307.6) -18.8% (330.7) -17.9% 7.5%
Marketing (168.1) -20.6% (206.5) -22.4% 22.8% (343.6) -21.0% (387.7) -21.0% 12.8%
EBITDA from Continuing Operations 302.9 37.1% 339.5 36.9% 12.1% 593.4 36.4% 702.2 38.0% 18.3%
Net Income from Continuing Operations 228.0 27.9% 278.8 30.3% 22.3% 441.5 27.0% 581.0 31.4% 31.6%
Earnings per Share from Continuing Operations 0.36 - 0.44 - 21.6% 0.70 - 0.92 - 31.0%
Cash Flow from Operations 306.6 37.5% 344.9 37.5% 12.5% 549.8 33.7% 598.4 32.4% 8.8%

2
Operating Scenario
Hypera Pharma grew 12.6% in the second quarter compared to 2Q17, reaching Net Revenue of R$920.1 million. In the
quarter, sales growth occurred in all of the Company's business units, with emphasis on the Branded Prescription and
Generics & Similars.
In the case of Hypera Pharma, the truck drivers' strike in 2Q18 did not have a material impact on the production
process and on the delivery of goods to customers due to adequate levels of raw material and finished products in
inventories. Similarly, despite the strike, the pharmaceutical market grew 11.5% in the quarter, according to IQVIA
data.
In Branded Prescription, products for chronic and dermocosmetic treatments were sales highlights in the quarter, in
addition to the brands Predsim, Alivium and Mioflex-A.
In Generics & Similars, sales growth was fostered by the leading brands Torsilax, Neosoro, Doralgina, Flavonid and
Histamin. This performance has been benefited by the internal initiatives to increase the production capacity in
Anápolis and by the Company's strategy to focus on molecules with lower competition, in addition to maintaining a
healthy discount policy for the business.
In the quarter, EBITDA from Continuing Operations grew 12.1% and totaled R$339.5 million. This growth was mainly
due to the combination of the dilution of Sales, General and Administrative Expenses with Gross Profit growth, which
was not materially affected by the depreciation of Real against the Dollar in 2Q18, since the greater part of the raw
material consumed in the period was formed prior to this.
In 2Q18, in line with the Company's strategy to return capital to shareholders, the distribution of Interest on Capital in
the amount of R$129.8 million was approved, which contributed to the reduction of the effective tax rate in the period
and to the 22.3% growth of Net Income from Continuing Operations. Free Cash Flow increased 31.3%, which
contributed to the Company’s 2Q18 Net Cash positon of R$732.8 million, or 0.6x LTM EBITDA from Continuing
Operations.
The Company has been consistently improving its return on equity (ROE). In 2Q18, ROE was 15.8%, or 4.8 percentage
points higher than 2Q17.
Finally, the Board of Directors approved the appointment of the members of the Independent Committee constituted
to coordinate the internal investigation of the facts related to the Material Fact of April 10, 2018 and to the Notice to
the Market of April 20, 2018, published by the Company. The Independent Committee has already begun the
investigation process and, at the end of its activities, will present its conclusions to the Board of Directors.
3
Innovation & Launches
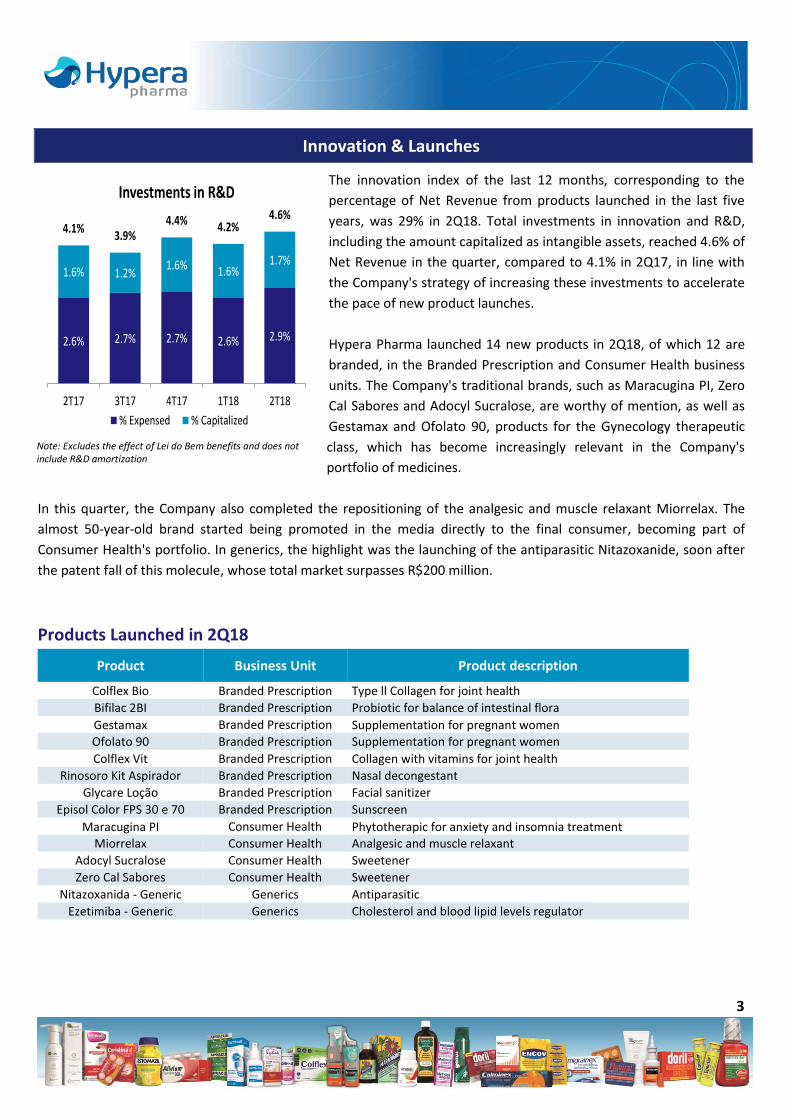
The innovation index of the last 12 months, corresponding to the
percentage of Net Revenue from products launched in the last five
years, was 29% in 2Q18. Total investments in innovation and R&D,
including the amount capitalized as intangible assets, reached 4.6% of
Net Revenue in the quarter, compared to 4.1% in 2Q17, in line with
the Company's strategy of increasing these investments to accelerate
the pace of new product launches.
Hypera Pharma launched 14 new products in 2Q18, of which 12 are
branded, in the Branded Prescription and Consumer Health business
units. The Company's traditional brands, such as Maracugina PI, Zero
Cal Sabores and Adocyl Sucralose, are worthy of mention, as well as
Gestamax and Ofolato 90, products for the Gynecology therapeutic
class, which has become increasingly relevant in the Company's
portfolio of medicines.
In this quarter, the Company also completed the repositioning of the analgesic and muscle relaxant Miorrelax. The
almost 50-year-old brand started being promoted in the media directly to the final consumer, becoming part of
Consumer Health's portfolio. In generics, the highlight was the launching of the antiparasitic Nitazoxanide, soon after
the patent fall of this molecule, whose total market surpasses R$200 million.
Products Launched in 2Q18
Product Business Unit Product description
Colflex Bio Branded Prescription Type ll Collagen for joint health
Bifilac 2BI Branded Prescription Probiotic for balance of intestinal flora
Gestamax Branded Prescription Supplementation for pregnant women
Ofolato 90 Branded Prescription Supplementation for pregnant women
Colflex Vit Branded Prescription Collagen with vitamins for joint health
Rinosoro Kit Aspirador Branded Prescription Nasal decongestant
Glycare Loção Branded Prescription Facial sanitizer
Episol Color FPS 30 e 70 Branded Prescription Sunscreen
Maracugina PI Consumer Health Phytotherapic for anxiety and insomnia treatment
Miorrelax Consumer Health Analgesic and muscle relaxant
Adocyl Sucralose Consumer Health Sweetener
Zero Cal Sabores Consumer Health Sweetener
Nitazoxanida - Generic Generics Antiparasitic
Ezetimiba - Generic Generics Cholesterol and blood lipid levels regulator
Note: Excludes the effect of Lei do Bem benefits and does not include R&D amortization
2.6% 2.7% 2.7% 2.6% 2.9%
1.6% 1.2%1.6% 1.6%
1.7%
4.1%3.9%
4.4% 4.2%4.6%
2T17 3T17 4T17 1T18 2T18
Investments in R&D
% Expensed % Capitalized

4
Earnings Discussion
Income Statement
The following table is a summary of Hypera Pharma’s Income Statement:
Table 2
(R$ million) 2Q17 % NR 2Q18 % NR ∆ % 1H17 % NR 1H18 % NR ∆ %
Net Revenue 817.4 100.0% 920.1 100.0% 12.6% 1,632.3 100.0% 1,847.9 100.0% 13.2%
Gross Profit 590.2 72.2% 668.5 72.7% 13.2% 1,191.7 73.0% 1,358.1 73.5% 14.0%
Marketing Expenses (168.1) -20.6% (206.5) -22.4% 22.8% (343.6) -21.0% (387.7) -21.0% 12.8%
Selling Expenses (109.0) -13.3% (117.1) -12.7% 7.4% (216.0) -13.2% (237.4) -12.8% 9.9%
General and Administrative Expenses (46.8) -5.7% (46.9) -5.1% 0.2% (91.6) -5.6% (93.3) -5.1% 1.8%
Other Operational Net Expenses 17.8 2.2% 16.6 1.8% -6.8% 17.2 1.1% 17.7 1.0% 2.8%
Equity in Subsidiaries 0.3 0.0% 3.2 0.3% 883.0% 0.5 0.0% 3.2 0.2% 554.6%
EBIT from Continuing Operations 284.5 34.8% 317.8 34.5% 11.7% 558.1 34.2% 660.7 35.8% 18.4%
Net Financial Expenses 26.0 3.2% (1.8) -0.2% - 40.0 2.5% (0.7) 0.0% -
Income Tax and CSLL (82.5) -10.1% (37.1) -4.0% -55.0% (156.7) -9.6% (79.0) -4.3% -49.6%
Net Income (Loss) from Continuing Operations 228.0 27.9% 278.8 30.3% 22.3% 441.5 27.0% 581.0 31.4% 31.6%
Net Income from Discontinued Operations (43.6) -5.3% (1.0) -0.1% -97.7% (87.7) -5.4% (3.4) -0.2% -96.1%
Net Income (Loss) 184.4 22.6% 277.8 30.2% 50.7% 353.8 21.7% 577.6 31.3% 63.2%
EBITDA from Continuing Operations 302.9 37.1% 339.5 36.9% 12.1% 593.4 36.4% 702.2 38.0% 18.3%

5
Net Revenue
Graph 1
817.4
920.1
2Q17 2Q18
Net Revenue (R$ mm)
12.6%Δ 2Q18 vs 2Q17
Graph 2
1,632.3
1,847.9
1H17 1H18
Net Revenue (R$ mm)
13.2%Δ 1S18 vs 1S17
Table 3
(R$ million) 2Q17 2Q18 ∆ % 1H17 1H17 ∆ %
Net Revenue 817.4 920.1 12.6% 1,632.3 1,847.9 13.2%
Net Revenue grew 12.6% compared to 2Q17, especially on the Branded Prescription and Generics & Similars business units. This growth is mainly due to volume expansion, combined with price increase. In the Branded Prescription business unit, products for chronic treatments and dermocosmetics were highlights of the quarter, in addition to Predsim, Alivium and Mioflex-A. In Generics & Similars, growth was boosted by the performance of Similars, especially the leading brands Torsilax, Neosoro, Doralgina, Flavonid and Histamin. In Consumer Health, the performance was driven by the launches of traditional brands, such as Tamarine Zero Geleia and Biotônico Fontoura Sabores, in addition to Gelol, Estomazil and Epocler.

6
Gross Profit
Graph 3
590.2
668.5
2Q17 2Q18
Gross Profit (R$ mm)
Δ 2Q18 vs 2Q17 13.2%
Graph 4
72.2% 72.7%
2Q17 2Q18
Gross Margin (%)
Δ 2Q18 vs 2Q17 0.5 p.p.
Graph 5
1,191.7
1,358.1
1H17 1H18
Gross Profit (R$ mm)
Δ 1S18 vs 1S17 14.0%
Graph 6
73.0% 73.5%
1H17 1H18
Gross Margin (%)
Δ 1S18 vs 1S17 0.5 p.p.
Table 4
(R$ million) 2Q17 % NR 2Q18 % NR ∆ % ∆ p.p. 1H17 % NR 1H18 % NR ∆ % ∆ p.p.
Gross Profit 590.2 72.2% 668.5 72.7% 13.2% 0.5 p.p. 1,191.7 73.0% 1,358.1 73.5% 14.0% 0.5 p.p.
Gross Profit growth was 0.6 percentage points higher than Net Revenue growth, which resulted in a Gross Margin expansion, reaching 72.7% in 2Q18, against 72.2% in 2Q17. This expansion was mainly due to the price increase in this period, which was higher than the increase in costs.

7
Marketing Expenses
Table 5
(R$ million) 2Q17 % NR 2Q18 % NR ∆ % 1H17 % NR 1H18 % NR ∆ %
Marketing Expenses (168.1) -20.6% (206.5) -22.4% 22.8% (343.6) -21.0% (387.7) -21.0% 12.8%
Advertisement and Consumer Promotion (72.1) -8.8% (94.6) -10.3% 31.2% (147.4) -9.0% (159.2) -8.6% 8.0%
Trade Deals (13.3) -1.6% (18.3) -2.0% 37.3% (24.6) -1.5% (32.9) -1.8% 33.7%
Medical Visits, Promotions and Samples (82.7) -10.1% (93.6) -10.2% 13.2% (171.6) -10.5% (195.6) -10.6% 14.0%
Marketing Expenses accounted for 22.4% of Net Revenue in 2Q18, or 1.8 percentage point above 2Q17. This variation
is a result of the increase in Advertising and Consumer Promotion expenses, mainly due to the greater concentration
of advertisements related to TV Globo's soccer package, combined with the greater number of Trade Deals made at
the points of sale. In 1H18, Marketing Expenses accounted for 21.0% of Net Revenue, same level recorded in 1H17.
Selling Expenses
Table 6
(R$ million) 2Q17 % NR 2Q18 % NR ∆ % 1H17 % NR 1H18 % NR ∆ %
Selling Expenses (109.0) -13.3% (117.1) -12.7% 7.4% (216.0) -13.2% (237.4) -12.8% 9.9%
Commercial Expenses (68.0) -8.3% (76.7) -8.3% 12.7% (135.1) -8.3% (153.6) -8.3% 13.7%
Freight and Logistics Expenses (20.0) -2.5% (22.5) -2.4% 12.4% (38.3) -2.3% (42.1) -2.3% 9.8%
Research & Development (21.0) -2.6% (17.9) -1.9% -14.7% (42.6) -2.6% (41.7) -2.3% -2.0%
Selling Expenses decreased by 0.6 percentage points compared to 2Q17, as a percentage of Net Revenue. This
decrease was mainly due to the lower Research and Development Expenses due to the usage of R$8.5 million benefit
from Lei do Bem, Federal Law that gives tax incentives for companies carrying out innovation. Excluding the effect of
this benefit, these expenses accounted for 2.9% of Net Revenue in 2Q18, 0.3 percentage points higher than in 2Q17.
In the quarter, total investments in innovation and R&D, including the amount capitalized as intangible assets, reached
4.6% of net revenue, compared to 4.1% in 2Q17, in line with the Company's strategy to increase investments in
innovation to accelerate the pace of new product launches.
General and Administrative Expenses & Other Operating Revenues / Expenses, Net
Table 7
(R$ million) 2Q17 % NR 2Q18 % NR ∆ % 1H17 % NR 1H18 % NR ∆ %
General & Administrative Expenses (46.8) -5.7% (46.9) -5.1% 0.2% (91.6) -5.6% (93.3) -5.1% 1.8%
Other Operating Revenues (Expenses) 17.8 2.2% 16.6 1.8% -6.8% 17.2 1.1% 17.7 1.0% 2.8%
General and Administrative Expenses reduced by 0.5 as a percentage of Net Revenue compared to 2Q17, as a result of the combination of Net Revenue growth and the stability of these expenses. In 2Q18, Other Operating Revenues (Expenses) was mainly affected by the non-recurring return of Eletrobrás compulsory loan.

8
EBITDA from Continuing Operations
Graph 7
302.9 339.5
2Q17 2Q18
EBITDA (R$ mm)
12.1%Δ 2Q18 vs 2Q17
Graph 8
37.1% 36.9%
2Q17 2Q18
EBITDA Margin (%)
Δ 2Q18 vs 2Q17 -0.2 p.p.
Graph 9
593.4
702.2
1H17 1H18
EBITDA (R$ mm)
18.3%Δ 1S18 vs 1S17
Graph 10
36.4%38.0%
1H17 1H18
EBITDA Margin (%)
Δ 1S18 vs 1S17 1.6 p.p.
Table 8 –EBITDA from Continuing Operations Reconciliation
(R$ million) 2Q17 % NR 2Q18 % NR ∆ % 1H17 % NR 1H18 % NR ∆ %
Net Income 184.4 22.6% 277.8 30.2% 50.7% 353.8 21.7% 577.6 31.3% 63.2%
(-) Net Income from Discontinued Operations 43.6 5.3% 1.0 0.1% -97.7% 87.7 5.4% 3.4 0.2% -96.1%
(+) Income Tax and CSLL 82.5 10.1% 37.1 4.0% -55.0% 156.7 9.6% 79.0 4.3% -49.6%
(+) Net Interest Expenses (26.0) -3.2% 1.8 0.2% - (40.0) -2.5% 0.7 0.0% -
EBIT from Continuing Operations 284.5 34.8% 317.8 34.5% 11.7% 558.1 34.2% 660.7 35.8% 18.4%
(+) Depreciations / Amortizations 18.4 2.3% 21.7 2.4% 17.9% 35.3 2.2% 41.5 2.2% 17.6%
EBITDA from Continuing Operations 302.9 37.1% 339.5 36.9% 12.1% 593.4 36.4% 702.2 38.0% 18.3%
EBITDA from Continuing Operations reached R$339.5 million in 2Q18, with a margin of 36.9%, slightly lower than 2Q17. This margin variation was a result of Gross Margin gain and General and Administrative and Other Expenses dilution, offset mainly by the increase in Marketing investments, which were higher than the growth of Net Revenue in the period. In the first half, EBITDA from Continuing Operations increased by 18.3% to R$702.2 million, or 52% of the guidance set for the year, of around R$1,350.0 million. This growth, which was higher than the Net Revenue growth, came mainly from Gross Margin expansion and General and Administrative Expenses dilution.

9
Net Financial Expenses
Table 9
(R$ million) 2Q17 % NR 2Q18 % NR ∆ R$ 1H17 % NR 1H18 % NR ∆ R$
Net Financial Expenses 26.0 3.2% (1.8) -0.2% (27.9) 40.0 2.5% (0.7) 0.0% (40.7)
Net Interest Expenses 37.1 4.5% 7.9 0.9% (29.2) 67.6 4.1% 18.3 1.0% (49.3)
Cost of Hedge and FX Gains (Losses) (2.3) -0.3% (1.5) -0.2% 0.9 (8.3) -0.5% (3.7) -0.2% 4.6
Other (8.7) -1.1% (8.2) -0.9% 0.4 (19.3) -1.2% (15.4) -0.8% 4.0
The Financial Result for 2Q18 was R$1.8 million negative, compared to a positive result of R$26.0 million in 2Q17. This
reduction is mainly due to lower financial income, consequence of the lower level of Brazilian interest rates and the
reduction of the Company's net cash position in the last 12 months. This lower net cash position was due to: (i) the
Company's capital reduction in July 2017, in the amount of R$821.9 million; and (ii) the payment of Interest on Capital
on January 9, 2018, in the amount of R$581.3 million, related to the fiscal year of 2017.
Net Income
Table 10
(R$ million) 2Q17 2Q18 ∆ % 1H17 1H18 ∆ %
EBIT from Continuing Operations 284.5 317.8 11.7% 558.1 660.7 18.4%
(-) Net Financial Expenses 26.0 (1.8) - 40.0 (0.7) -
(-) Income Tax and Social Contribution (82.5) (37.1) -55.0% (156.7) (79.0) -49.6%
Net Income from Continuing Operations 228.0 278.8 22.3% 441.5 581.0 31.6%
(+) Net Income from Discontinued Operations (43.6) (1.0) -97.7% (87.7) (3.4) -96.1%
Net Income 184.4 277.8 50.7% 353.8 577.6 63.2%
EPS 0.29 0.44 49.8% 0.56 0.91 62.5%
EPS from Continuing Operations 0.36 0.44 21.6% 0.70 0.92 31.0%
Net Income from Continuing Operations was R$278.8 million in the quarter, an increase of 22.3% over 2Q17. This
growth is related to the combination of the increase in operating income and the reduction of the effective income tax
rate because of the approval of Interest on Capital distribution in the amount of R$129.8 million.

10
Cash Flow (Continuing and Discontinued Operations)
Graph 11
306.6
344.9
2Q17 2Q18
Cash Flow from Operations (R$ mm)
Δ 2Q18 vs 2Q17 38.3
Graph 12
549.8 598.4
1H17 1H18
Cash Flow from Operations (R$ mm)
Δ 1S18 vs 1S17 48.6
Graph 13
223.2
293.0
2Q17 2Q18
Free Cash Flow (R$ mm)
Δ 2Q18 vs 2Q17 69.9
Graph 14
1236.3
483.6
1H17 1H18
Free Cash Flow (R$ mm)
Δ 1S18 vs 1S17 -752.7
Table 11
(R$ million) 2Q17 2Q18 1H17 1H18
Cash Flow from Operations 306.6 344.9 549.8 598.4
Purchase of Property, Plant and Equipment (35.9) (28.6) (97.2) (65.1)
Purchase of Intangible Assets (14.1) (18.8) (19.6) (34.5)
Sale of Property, Plant and Equipment (33.5) (4.5) 803.3 (15.2)
(=) Free Cash Flow 223.2 293.0 1,236.3 483.6
Operating Cash Flow was R$344.9 million in 2Q18, 12.5% higher than 2Q17 and 0.4 percentage point higher than EBITDA growth in the period. Free Cash Flow increased by 31.3% and was impacted by the greater investments in fixed assets for the Company's new innovation center (Hynova) in 2Q17.

11
Net Debt
Table 12
Loans and Financing (428.3)
Notes Payable (18.2)
Gross Debt (446.5)
Cash and Cash Equivalents 1,179.3
Net Cash / (Debt) 732.8
(R$ million) 2Q18
The Net Cash position ended the quarter at R$732.8 million, mainly a result of the R$293.0 million free cash
generation in the quarter. At the end of the period, Net Cash represented 0.6x EBITDA from Continuing Operations in
the last 12 months.

12
Investor Relations Agenda
Earnings Conference Call
Upcoming events
Table 13
Date Event City10-11-sept Morgan Stanley GEM Conference London
12-sept BofA Merrill Lynch Global Healthcare Conference London
13-14-nov Bradesco CEO Forum New York
Contact Information
Phone: +55 (11) 3627-4242
Email: [email protected]
Website: www.hypera.com.br/ir
Portuguese English
Date: July 30, 2018 July 30, 2018
Time: 11:00 (Brasília) 11:00 (Brasília)
10:00 (New York) 10:00 (New York)
Phone: +55 (11) 2188-0155
+1 (646) 843-6054
Code:
Hypera
Hypera
Webcast: Click here Click here
Replay: +55 (11) 2188-0400
+55 (11) 2188-0400
Replay Code: Hypera
Hypera
13
Disclaimer
This release contains forward-looking statements that are exclusively related to the prospects of the business, its
operating and financial results, and prospects for growth. These data are merely projections and, as such, based
exclusively on our management's expectations for the future of the business and its continued access to capital to
fund its business plan. These forward-looking statements substantially depend on changing market conditions,
government regulations, competitive pressures, the performance of the Brazilian economy and the industry, among
other factors, as well as the risks shown in our filed disclosure documents, and are therefore subject to change
without prior notice.
Unaudited information herein reflects management's interpretation of information taken from its quarterly
information and their respective adjustments, which were prepared in accordance with market practices and for the
sole purpose of a more detailed and specific analysis of our results. Therefore, these additional points and data must
also be analyzed and interpreted independently by shareholders and market agents, who should carry out their own
analysis and draw their own conclusions from the results reported herein. No data or interpretative analysis provided
by our management should be treated as a guarantee of future performance or results and are merely illustrative of
our directors' vision of our results.
Our management is not responsible for compliance or accuracy of the management financial data discussed in this
report, which must be considered as for informational purposes only, and should not override the analysis of our
audited consolidated financial statements or our reviewed quarterly information for purposes of a decision to invest in
our stock, or for any other purpose.

14
Consolidated Income Statement (R$ thousand)
Table 14
2Q17 2Q18 1H17 1H18
Net Revenue 817,389 920,058 1,632,297 1,847,914
Cost of Goods Sold (227,140) (251,602) (440,646) (489,774)
Gross Profit 590,249 668,456 1,191,651 1,358,140
Selling and Marketing Expenses (277,136) (323,587) (559,591) (625,055)
General and Administrative Expenses (46,763) (46,873) (91,645) (93,320)
Other Operating Income (Expenses) 17,795 16,589 17,234 17,715
Equity in Subsidiaries 323 3,175 485 3,175
Operating Income Before Equity Income and
Financial Result284,468 317,760 558,134 660,655
Net Financial Expenses 26,046 (1,846) 40,000 (733)
Financial Expenses (28,214) (18,990) (67,550) (40,244)
Financial Income 54,260 17,144 107,550 39,511
Profit Before Income Tax and Social Contribution 310,514 315,914 598,134 659,922
Income Tax and Social Contribution (82,520) (37,114) (156,673) (78,952)
Net Income from Contining Operations 227,994 278,800 441,461 580,970
Net Income from Discontinued Operations (43,635) (1,003) (87,650) (3,415)
Income for the Period 184,359 277,797 353,811 577,555
Earnings per Share – R$ 0.29 0.44 0.56 0.91

15
Consolidated Balance Sheet (R$ thousand)
Table 15
Assets 31/12/2017 31/06/2018 Liabilities and Shareholders' Equity 31/12/2017 31/06/2018
Current Assets 3,927,541 3,695,280 Current Liabilities 1,710,737 1,087,166
Cash and Cash Equivalents 1,522,135 1,179,265 Suppliers 178,271 185,384
Accounts Receivables 1,224,227 1,280,547 Suppliers' Assignment of Receivables 124,304 174,233
Inventories 454,776 529,096 Loans, Financing and Debentures 337,813 123,329
Recoverable Taxes 355,194 341,506 Salaries Payable 161,843 137,931
Financial Derivatives 10,132 22,731 Income Tax and Social Contribution 2,944 4,637
Other Assets 358,136 340,895 Taxes Payable 53,919 36,474
Assets Held for Sale 2,941 1,240 Accounts Payable 200,649 149,658
Related Parties 0 0 Dividends Payable 581,299 245,923
Notes Payable 19,669 18,171
Financial Derivatives 818 284
Liabilities Held for Sale 49,208 11,142
Non-Current Assets 6,202,896 6,188,020 Non-Current Liabilites 681,941 733,638
Long Term Assets 330,336 261,134 Suppliers 2,348 4,470
Deferred Income Tax and Social Contribution 30,331 34,649 Loans, Financing and Debentures 318,516 304,987
Recoverable Taxes 147,184 57,529 Deferred Income Tax and Social Contribution 184,418 249,420
Other Assets 152,821 168,956 Taxes Payable 6,773 6,517
Accounts Payable 11,855 6,568
Provisions for Contingencies 158,031 161,676
Investments 5,872,560 5,926,886 Shareholders' Equity 7,737,759 8,062,496
Investments 6,186 9,361 Capital 4,448,817 4,448,817
Investment Properties 156,726 155,960 Capital Reserve 1,276,978 1,284,104
Other Investments 564 369 Equity Valuation Adjustments (254,975) (254,895)
Property, Plants and Equipments 906,770 937,030 Profit Reserves 2,279,920 2,279,920
Intangible Assets 4,802,314 4,824,166 Treasury Stock (12,981) (6,459)
Income for the Period 0 311,009
Total Assets 10,130,437 9,883,300 Total Liabilities and Shareholders' Equity 10,130,437 9,883,300

16
Consolidated Cash Flow Statement (R$ thousand)
Table 16
2Q17 2Q18 1H17 1H18
Cash Flows from Operating Activities
Income (Loss) Before Income Taxes including Discontinued Operations 249,137 314,057 471,021 657,115
Depreciation and Amortization 17,268 21,742 39,728 41,507
Asset Impairment 6,134 1,672 5,492 1,666
Gain on Permanent Asset Disposals 53,678 3,002 127,378 4,964
Equity Method (407) (5,851) (1,328) (6,576)
Foreign Exchange (Gains) Losses 2,432 1,470 9,904 3,668
Interest and Related Expense (24,330) 423 (44,280) (2,873)
Expenses Related to Share Based Remuneration 169 3,409 761 6,229
Provisions (Delinquency, Inventories and Contingencies) 23,778 (6,176) 22,059 (9,157)
Adjusted Results 327,859 333,748 630,735 696,543
Decrease (Increase) in Assets 70,536 83,266 211,510 (362)
Trade Accounts Receivable 27,567 8,702 183,825 (52,256)
Inventories (5,693) (37,244) 59,545 (85,368)
Recoverable Taxes 15,802 37,426 14,732 112,461
Judicial Deposits and Others (6,175) (713) (10,537) (2,936)
Other Accounts Receivable 39,035 75,095 (36,055) 27,737
Increase (Decrease) in Liabilities (91,793) (72,101) (292,450) (97,828)
Suppliers (22,861) (38,102) (35,802) (12,072)
Suppliers' Assignment of Receivables (9,677) 49,305 (98,329) 48,228
Financial Derivatives (3,624) 2,307 (29,096) 1,539
Income Tax and Social Contribution Paid (1,701) (5,422) (10,536) (13,288)
Taxes Payable 2,510 (17,687) 12,972 (17,175)
Salaries and Payroll Charges 4,917 11,921 (4,913) (23,916)
Accounts Payable (19,013) (76,764) (99,950) (104,988)
Operations Interest Paid 200 (1,617) 9,886 4,103
Other Accounts Payable (42,544) 3,958 (36,682) 19,741
Net Cash Provided by Operating Activities 306,602 344,913 549,795 598,353
Cash flows from Investing Activities
Acquisitions of Property, Plant and Equipment (35,880) (28,554) (97,207) (65,094)
Intangible Assets (14,065) (18,847) (19,566) (34,473)
Proceeds from the Sale of Assets with Permanent Nature (33,461) (4,465) 803,283 (15,202)
Interest and Others 40,158 10,064 73,942 20,722
Net Cash Used in Investing Activities (43,248) (41,802) 760,452 (94,047)
Cash Flows from Financing Activities
Borrowings 107 0 0 0
Treasury Stock Purchase / Sale (31,648) (4,282) (115,565) 7,419
Repayment of Loans - Principal (217,285) (59,464) (256,869) (234,507)
Repayment of Loans - Interest (19,386) (8,985) (90,878) (25,108)
Dividends Paid (31,796) (17,926) (409,831) (599,217)
Loan Derivatives (19,970) (5,378) 330,191 4,237
Net Cash Used in Financing Activities (319,978) (96,035) (542,952) (847,176)
Net Increase (Decrease) in Cash and Cash Equivalents (56,624) 207,077 767,295 (342,870)
Statement of Increase in Cash and Cash Equivalents, Net
Cash and Cash Equivalents at the Beginning of the Period 2,171,927 972,189 1,348,008 1,522,135
Cash and Cash Equivalents at the End of the Period 2,115,303 1,179,265 2,115,303 1,179,265
Change in Cash and Cash Equivalent (56,624) 207,076 767,295 (342,870)

17
Other Information
Cash Conversion Cycle – Continuing Operations
Table 17
(Days) 2Q17 3Q17 4Q17 1Q18 2Q18
Receivables (1) 103 103 99 114 115
Inventories (2) 159 174 155 189 189
Payables (2) (3) (103) (104) (104) (125) (130)
Cash Conversion Cycle 158 172 151 178 174
(R$ million) 2Q17 3Q17 4Q17 1Q18 2Q18
Receivables 1,005 1,101 1,224 1,285 1,281
Inventories 401 429 455 501 529
Payables (3) (260) (258) (305) (330) (364)
Working Capital 1,145 1,272 1,374 1,456 1,446
% of Annualized Net Revenue (4) 35% 38% 37% 38% 39%
(1) Calculated based on Continuing Operations Gross Revenue, Net of Discounts.
(2) Calculated based on Continuing Operations COGS
(3) Includes Suppliers’ Assignment of Receivables
(4) Annualized Net Revenue for the last 6 months
Goodwill Amortization for Fiscal Purposes / Tax Credits
The Company holds R$368.9 million in goodwill to be amortized for fiscal purposes over the coming years, generating
a cash effect of R$125.4 million, according to the following table:
Table 18
Period R$ million
2018 250.6
2019 118.2
Total 368.9
Tax Rate 34%
Cash Effect 125.4
Source: Hypera
In addition, the Company holds the following tax credits:
i) Federal Recoverable Taxes: R$236.2 million (please refer to Explanatory Note 13 of the Financial Statements);
ii) Cash effect of Income Tax and Social Contribution Losses Carryforward: R$1,138.9 million (please refer to
Explanatory Note 23(a) of the Financial Statements).