Embed Size (px)
Citation preview

Hynix Semiconductor Inc.Separate Financial StatementsDecember 31, 2011

Hynix Semiconductor Inc.IndexDecember 31, 2011
Page(s)
Report of Independent Auditors ......................................................................................................1 - 2
Separate Financial Statements
Separate Statements of Financial Position..........................................................................................3
Separate Statements of Comprehensive Income................................................................................4
Separate Statements of Changes in Equity.........................................................................................5
Separate Statements of Cash Flows ...................................................................................................6
Notes to Separate Financial Statements ......................................................................................7 - 81
Report on Review of Internal Accounting Control System..............................................................82
Report on the Operations of the Internal Accounting Control System ..........................................83

Samil PricewaterhouseCoopers, LS Yongsan Tower, 191, Hangangno 2Seoul 140-702, Korea (Yongsan P.O Box 266, 140
Samil PricewaterhouseCoopers is the Korean network firm of PricewaterhouseCoopers International Limited (PwCIL). “Pricewaterhnetwork of member firms of PwCIL. Each member firm is a separate legal entity
To the Shareholders and Board of Directors of
Hynix Semiconductor Inc.
We have audited the accompanying
Inc. (the “Company”) as of December 31, 20
comprehensive income, changes in equity and cash flows for the year then ended, expressed in
Korean won. These financial statements are the responsibility of the Company's management. Our
responsibility is to express an opinion on these
statements of the Company as of and for the year ended December 31, 20
comparative purposes, were audited by other auditors whose report dated
an unqualified opinion on those statements.
We conducted our audit in accordance with auditing standards generally accepted in the Republic of
Korea. Those standards require that we plan and perform the audit to obtain reasonable assurance
about whether the financial statements are free of material misstatement. An audit includes
examining, on a test basis, evidence supporting the amounts and disclosures in the financial
statements. An audit also includes assessing the accounting principles used and significant e
made by management, as well as evaluating the overall financial statement presentation. We believe
that our audit provides a reasonable basis for our opinion.
In our opinion, the separate financial statements, referred to above, present fairly, i
respects, the financial position of Hynix Semiconductor Inc. as of December 31, 20
performance and cash flows for the year then ended in accordance with Korean IFRS.
Samil PricewaterhouseCoopers, LS Yongsan Tower, 191, Hangangno 2-ga, Yongsan-gu,702, Korea (Yongsan P.O Box 266, 140-600), www.samil.com
Samil PricewaterhouseCoopers is the Korean network firm of PricewaterhouseCoopers International Limited (PwCIL). “PricewaterhouseCoopers” and “PwC” refer to thenetwork of member firms of PwCIL. Each member firm is a separate legal entity and does not act as an agent of PwCIL or any other member firm.
Report of Independent Auditors
To the Shareholders and Board of Directors of
We have audited the accompanying separate statement of financial position of Hynix Semiconductor
) as of December 31, 2011, and the related separate
comprehensive income, changes in equity and cash flows for the year then ended, expressed in
Korean won. These financial statements are the responsibility of the Company's management. Our
responsibility is to express an opinion on these financial statements based on our audit. The financial
statements of the Company as of and for the year ended December 31, 2010, presented herein for
comparative purposes, were audited by other auditors whose report dated March 12
alified opinion on those statements.
We conducted our audit in accordance with auditing standards generally accepted in the Republic of
Korea. Those standards require that we plan and perform the audit to obtain reasonable assurance
ncial statements are free of material misstatement. An audit includes
examining, on a test basis, evidence supporting the amounts and disclosures in the financial
statements. An audit also includes assessing the accounting principles used and significant e
made by management, as well as evaluating the overall financial statement presentation. We believe
that our audit provides a reasonable basis for our opinion.
financial statements, referred to above, present fairly, i
respects, the financial position of Hynix Semiconductor Inc. as of December 31, 20
performance and cash flows for the year then ended in accordance with Korean IFRS.
gu,
ouseCoopers” and “PwC” refer to theand does not act as an agent of PwCIL or any other member firm.
statement of financial position of Hynix Semiconductor
arate statements of
comprehensive income, changes in equity and cash flows for the year then ended, expressed in
Korean won. These financial statements are the responsibility of the Company's management. Our
financial statements based on our audit. The financial
, presented herein for
March 12, 2012, expressed
We conducted our audit in accordance with auditing standards generally accepted in the Republic of
Korea. Those standards require that we plan and perform the audit to obtain reasonable assurance
ncial statements are free of material misstatement. An audit includes
examining, on a test basis, evidence supporting the amounts and disclosures in the financial
statements. An audit also includes assessing the accounting principles used and significant estimates
made by management, as well as evaluating the overall financial statement presentation. We believe
financial statements, referred to above, present fairly, in all material
respects, the financial position of Hynix Semiconductor Inc. as of December 31, 2011, and its financial
performance and cash flows for the year then ended in accordance with Korean IFRS.

2
As discussed in Note 42 to the separate financial statements, the Share Management Council and the
Company entered into a share purchase agreement with SK Telecom Co., Ltd., on November 14,
2011. In accordance with the terms of the agreement, SK Telecom Co., Ltd., on February 14, 2012,
purchased 44.25 million shares of the Company from the Share Management Council and acquired
newly issued 101.85 million shares of the Company through an allotment to a third party.
Consequently, SK Telecom Co., Ltd. acquired 146.1 million shares of common stock of the Company,
representing approximately 21.05% of the outstanding common stock and became a largest
shareholder of the Company.
Auditing standards and their application in practice vary among countries. The procedures and
practices used in the Republic of Korea to audit such financial statements may differ from those
generally accepted and applied in other countries. Accordingly, this report is for use by those who are
informed about Korean auditing standards and their application in practice.
Seoul, KoreaMarch 12, 2012
This report is effective as of March 12, 2012, the audit report date. Certain subsequent events or
circumstances, which may occur between the audit report date and the time of reading this report,
could have a material impact on the accompanying separate financial statements and notes thereto.
Accordingly, the readers of the audit report should understand that there is a possibility that the
above audit report may have to be revised to reflect the impact of such subsequent events or
circumstances, if any.

Hynix Semiconductor Inc.
Separate Statements of Financial Position
December 31, 2011 and 2010, and January 1, 2010
Notes
Assets
Current assets
Cash and cash equivalents 5, 13 \ 980,359 \ 960,046 \ 1,085,991
Short-term financial instruments 6, 13 588,528 844,368 242,612
Trade receivables 7, 12, 13, 36 1,417,886 1,389,394 1,455,805
Loans and other receivables 7, 12, 13, 36 307,753 196,678 125,362
Inventories 8 928,891 926,456 783,741
Assets classified as held for sale 17 5 24,449 86,566
Other current assets 9 83,772 95,961 104,870
4,307,194 4,437,352 3,884,947
Non-current assets
Investments in subsidiaries, jointly controlled entities
and associates
Available-for-sale financial assets 10, 13 47,327 50,477 56,469
Property, plant and equipment 14 7,902,653 7,277,397 6,468,334
Intangible assets 16 705,807 601,988 472,965
Investment property 15 31,168 37,186 38,502
Loans and other receivables 7, 12, 13 30,208 142,508 90,503
Other financial assets 6, 13, 38 3,436 8,017 4,712
Deferred income tax assets 24 221,935 328,734 412,875
Other non-current assets 9 154,319 119,273 141,705
12,086,716 11,566,908 10,141,781
Total assets 16,393,910 16,004,260 14,026,728
Liabilities
Current liabilities
Trade payables 13, 36 840,146 868,338 943,395
Other payables 13, 36 489,684 693,626 459,304
Other non-trade payables 13, 18, 36 320,395 456,164 216,447
Provisions 20 449,696 535,290 646,305
Other financial liabilities 13, 21, 38 34,315 42,426 33,164
Borrowings 13, 19, 36 2,343,892 1,999,534 2,703,088
Other current liabilities 22, 36 18,855 22,625 292,108
4,496,983 4,618,003 5,293,811
Non-current liabilities
Borrowings 13, 19, 36 3,130,094 2,584,237 2,741,240
Other non-trade payables 13, 18, 36 70,617 197,301 190,963
Defined benefit liabilities 23 448,430 353,486 275,884
Other financial liabilities 13, 21, 38 7,796 54,561 62,890
Other non-current liabilities 22 36,929 29,626 27,415
3,693,866 3,219,211 3,298,392
Total liabilities 8,190,849 7,837,214 8,592,203
Equity
Capital stock 25 2,978,498 2,969,023 2,965,833
Capital surplus 25 1,267,257 1,231,064 1,219,742
Accumulated other comprehensive income 27 10,375 2,469 15,427
Other components of equity 40 5,762 5,762 5,769
Retained earnings 26 3,941,169 3,958,728 1,227,754
Total equity 8,203,061 8,167,046 5,434,525
Total liabilities and equity \ 16,393,910 \ 16,004,260 \ 14,026,728
January 1, 2010
2,455,716
December 31, 2011 December 31, 2010(in millions of Korean won)
2,989,863 3,001,32811
The accompanying notes are an integral part of these separate financial statements.
3

Hynix Semiconductor Inc.
Separate Statements of Comprehensive Income
Years Ended December 31, 2011 and 2010
(in millions of Korean won, except per share amounts) Notes 2010
Net sales 36 \ 10,188,162 \ 11,973,426
Cost of sales 30, 36 8,492,945 7,487,386
Gross profit 1,695,217 4,486,040
Selling, administration and ordinary development expenses 30, 31 (1,424,298) (1,320,820)
Other operating income 32 351,434 114,807
Other operating expenses 30, 32 (110,836) (151,660)
Operating income 29 511,517 3,128,367
Financial income 33 521,195 719,419
Financial expenses 33 (786,628) (837,157)
Other non-operating income 1,621 47,263
Other non-operating expenses (11,392) (190,305)
Profit before income tax 236,313 2,867,587
Income tax expense 34 107,171 81,642
Profit for the year \ 129,142 \ 2,785,945
Other comprehensive income(loss)
Available-for-sale financial assets 10, 27 7,906 (12,958)
Actuarial loss on defined benefit liability 23 (58,160) (54,971)
Total comprehensive income for the year \ 78,888 \ 2,718,016
Earnings per share 35
Basic earnings per share \ 218 \ 4,720
Diluted earnings per share 218 4,433
2011
The accompanying notes are an integral part of these separate financial statements.
4

Hynix Semiconductor Inc.
Separate Statements of Changes in Equity
Years Ended December 31, 2011 and 2010
Notes
(in millions of Korean won)
Balance at January 1, 2010 \ 2,965,833 \ 1,219,742 \ 15,427 \ 5,769 \ 1,227,754 \ 5,434,525
Comprehensive income
Profit for the year - - - - 2,785,945 2,785,945
Actuarial loss on defined benefit liabilities 23 - - - - (54,971) (54,971)
Gain(loss) on the valuation ofavailable-for-sale financial assets
10- - (12,958) - -
(12,958)
Total comprehensive income - - (12,958) - 2,730,974 2,718,016
Exercise of stock options 25 13 7 - (7) - 13
Exercise of conversion rights 25 3,177 11,315 - - - 14,492
Balance at December 31, 2010 \ 2,969,023 \ 1,231,064 \ 2,469 \ 5,762 \ 3,958,728 \ 8,167,046
Balance at January 1, 2011 \ 2,969,023 \ 1,231,064 \ 2,469 \ 5,762 \ 3,958,728 \ 8,167,046
Comprehensive income
Profit for the year - - - - 129,142 129,142
Actuarial loss on defined benefit liabilities 23 - - - - (58,160) (58,160)
Gain(loss) on the valuation ofAvailable-for-sale financial assets
10- - 7,906 - - 7,906
Total comprehensive income - - 7,906 - 70,982 78,888
Dividends 28 - - - - (88,541) (88,541)
Exercise of conversion rights 25 9,475 36,193 - - - 45,668
Balance at December 31, 2011 \ 2,978,498 \ 1,267,257 \ 10,375 \ 5,762 \ 3,941,169 \ 8,203,061
RetainedComprehensive
Earnings
Capital
Surplus
Paid-in
Capital
Other
Income (loss)
Components
Other
Total
of Equity Equity
The accompanying notes are an integral part of these separate financial statements.
5

Hynix Semiconductor Inc.
Separate Statements of Cash Flows
Years Ended December 31, 2011 and 2010
(in millions of Korean won) Notes
Cash flows from operating activities
Cash generated from operations 39 \ 1,972,710 \ 4,554,332
Interest received 65,503 53,007
Interest paid (231,595) (275,792)
Income tax refunded - 3,796
Dividends received 8,882 687
Net cash generated from operating activities 1,815,500 4,336,030
Cash flows from investing activities
Decrease in short-term financial assets 1,983,348 1,475,068
Proceeds from derivatives 19,013 -
Decrease in loans and other receivables 11,661 -
Proceeds from disposal of non-current assets held for sale 6,931 18,158
Proceeds from disposal of available-for-sale financial assets - -
Proceeds from disposal of investments in subsidiaries,
jointly controlled entities and associates
Proceeds from disposal of property, plant and equipment 9,207 34,785
Proceeds from disposal of investment property 12,151 -
Proceeds from disposal of intangible assets 10,107 -
Increase in short-term financial assets (1,727,508) (2,079,009)
Payments from derivatives (51,381) (29,572)
Acquisition of available-for-sale financial assets (11,163) (9,557)
Acquisition of investment in subsidiaries,
jointly controlled entities and associates
Acquisition of property, plant and equipment (2,613,485) (2,579,900)
Acquisition of intangible assets (175,242) (148,568)
Increase in loans and other receivables (320) (28,271)
Payments from other investing activities (1,464) (51,833)
Net cash used in investing activities (2,526,151) (3,944,311)
Cash flows from financing activities
Proceeds from borrowings 1,990,943 1,183,462
Proceeds from stock issuance (share options) - 13
Repayments of borrowings (1,171,438) (1,701,139)
Dividends paid (88,541) -
Net cash provided by (used in) financing activities 730,964 (517,664)
Net increase (decrease) in cash and cash equivalents 20,313 (125,945)
Cash and cash equivalents at the beginning of year 960,046 1,085,991
Cash and cash equivalents at the end of year \ 980,359 \ 960,046
(12,426) (806,243)
2011 2010
14,420 260,631
The accompanying notes are an integral part of these separate financial statements.
6

Hynix Semiconductor Inc.Notes to Separate Financial StatementsDecember 31, 2011 and 2010, and January 1, 2010
7
1. General Information
General information about Hynix Semiconductor Inc. (the “Company”) is as follows:
The Company is engaged in the manufacture, distribution and sales of semiconductor products and
its shares are listed on the Korea Exchange since 1996. The Company’s headquarters are located in
Icheon, South Korea, and the Company has manufacturing facilities in Icheon and Cheongju, South
Korea.
As of December 31, 2011, the shareholders of the Company and their shareholdings are as follows:
Shareholder Number of shares
Percentage
of ownership (%)
Share Management Council1: 88,500,000 14.9
Individual investors 503,671,582 85.1
592,171,582 100.0
1As of December 31, 2011, the number of shares held by each member of Share Management
Council is as follows:
Shareholder Number of shares
Percentage
of ownership (%)
Korea Exchange Bank 20,185,000 3.4
Woori Bank 19,722,000 3.3
Korea Finance Corporation 15,281,000 2.6
Shinhan Bank 14,963,000 2.5
Other financial institutions 18,349,000 3.1
88,500,000 14.9
In accordance with the resolution of the Share Management Council, the members of the Share
Management Council are restricted from selling their respective shares to the public (Note 37). As
discussed in Note 42, the Share Management Council sold a part of their shares after the reporting
period.

Hynix Semiconductor Inc.Notes to Separate Financial StatementsDecember 31, 2011 and 2010, and January 1, 2010
8
2. Significant Accounting Policies
The principal accounting policies applied in the preparation of these separate financial statements are
set out below. These policies have been consistently applied to all the periods presented, unless
otherwise stated.
2.1 Basis of Preparation
The Company maintains its accounting records in Korean won and prepares statutory financial
statements in the Korean language (Hangul) in accordance with the International Financial Reporting
Standards as adopted by the Republic of Korea (“Korean IFRS”). The accompanying separate
financial statements have been condensed, restructured and translated into English from the Korean
language financial statements.
Certain information attached to the Korean language financial statements, but not required for a fair
presentation of the Company's financial position, financial performance or cash flows, is not presented
in the accompanying separate financial statements.
The Company’s financial statements for the annual period beginning on January 1, 2011, have been
prepared in accordance with Korean-IFRS. These are the standards, subsequent amendments and
related interpretations issued by the International Accounting Standards Board ("IASB") that have
been adopted by the Republic of Korea.
The separate financial statements of the Company were prepared in accordance with Korean-IFRS
and are subject to Korean-IFRS1101, ‘First-time Adoption of Korean-IFRS’. The transition date,
according to Korean-IFRS1101, from the previous accounting principles generally accepted in the
Republic of Korea (“Previous K-GAAP”) to Korean-IFRS is January 1, 2010. Reconciliations and
descriptions of the effect of the transition from previous K-GAAP to Korean IFRS on the Company’s
equity, comprehensive income and cash flows are described in Note 41.
The preparation of financial statements requires the use of certain critical accounting estimates. It
also requires management to exercise judgment in the process of applying the Company’s accounting
policies. The areas involving a higher degree of judgment or complexity, or areas where assumptions
and estimates are significant to the separate financial statements are disclosed in Note 3.
New standards, amendments and interpretations issued but not effective for the financial year
beginning January 1, 2011, and not early adopted by the Company are as follows:
- Amendments to Korean-IFRS1101, Hyperinflation and Removal of Fixed Dates for first-time
adopters
As an exception to retrospective application requirements, this amendment to Korean-IFRS1101
allows a prospective application of derecognition of financial assets for transactions occurring on or
after the date of transition to Korean IFRS, instead of fixed date (January 1, 2004). Accordingly, the

Hynix Semiconductor Inc.Notes to Separate Financial StatementsDecember 31, 2011 and 2010, and January 1, 2010
9
Company is not required to restate and recognize those assets or liabilities that were derecognized as
a result of a transaction that occurred before the dated of transition to Korean-IFRS. This amendment
will be effective for the Company as of July 1, 2011. The Company expects that the application of this
amendment would not have material impact on its separate financial statements.
- Amendments to Korean-IFRS1012, Income Taxes
According to the amendments to Korean-IFRS1012, Income Taxes, for the investment property that is
measured using the fair value model, the measurement of deferred tax liability and deferred tax asset
should reflect the tax consequences of recovering the carrying amount of the investment property
entirely through sale, unless evidences support otherwise. This amendment will be effective for the
Company as of January 1, 2012. The Company expects that the application of this amendment would
not have material impact on its separate financial statements.
- Amendments to Korean-IFRS1019, Employee Benefits
According to the amendments to Korean-IFRS1019, Employee Benefits, use of a ‘corridor’ approach
is no longer permitted, and therefore all actuarial gains and losses incurred are immediately
recognized in other comprehensive income. All past service costs incurred from changes in pension
plan are immediately recognized, and expected returns on interest costs and plan assets that used to
be separately calculated are now changed to calculating net interest expense(income) by applying
discount rate used in measuring defined benefit obligation in net defined benefit liabilities(assets).
This amendment will be effective for the Company as of January 1, 2013, and the Company is
assessing the impact of application of the amended Korean-IFRS1019 on its separate financial
statements as of the report date.
- Amendments to Korean-IFRS1107, Financial Instruments: Disclosures
According to the amendment, an entity should provide the required disclosures of nature, carrying
amount, risk and rewards associated with all transferred financial instruments that are not
derecognized from an entity’s financial statements. In addition, an entity is required to disclose
additional information related to transferred and derecognized financial instruments for any continuing
involvement in transferred assets. This amendment is effective for the Company as of January 1,
2012. The Company is assessing the impact of application of the amended Korean-IFRS1107 on its
separate financial statements as of the report date.
- Amendments to Korean-IFRS1113, Fair-value measurement
Korean-IFRS1113, Fair value measurement, aims to improve consistency and reduce complexity by
providing a precise definition of fair value and a single source of fair value measurement and
disclosure requirements for use across Korean-IFRSs. Korean-IFRS1101 does not extend the use of
fair value accounting but provides guidance on how it should be applied where its use is already
required or permitted by other standards within Korean-IFRSs. This amendment will be effective for

Hynix Semiconductor Inc.Notes to Separate Financial StatementsDecember 31, 2011 and 2010, and January 1, 2010
10
the Company as of January 1, 2013, and the Company expects that it would not have a material
impact on the Company.
2.2 Subsidiaries, associates, and joint ventures
The financial statements of the Company are separate financial statements based on Korean IFRS
1027, Consolidated and non-consolidated financial statements. Investments in subsidiaries, jointly
controlled entities, and associates are recognised at cost under the direct equity method.
Management applied the carrying amounts under the previous K-GAAP at the time of first adoption of
the Korean IFRS as deemed cost of investments. The Company recognizes dividend income from
subsidiaries, jointly controlled entities or associates in profit or loss when its right to receive dividend
is established.
2.3 Foreign Currency Translation
(a) Functional and presentation currency
Items included in the financial statements of the Company are measured using the currency of the
primary economic environment in which the entity operates (“the functional currency”). The separate
financial statements are presented in ‘Korean won’, which is the Company’s functional and
presentation currency.
(b) Transactions and balances
Foreign currency transactions are translated into the functional currency using the exchange rates
prevailing at the dates of the transactions or valuation where items are re-measured. Foreign
exchange gains and losses resulting from the settlement of such transactions and from the translation
at the end of each reporting period monetary assets and liabilities denominated in foreign currencies
are reflected in current operations, except qualifying cash flow hedges which are recognized in other
comprehensive income. Foreign exchange gains and losses are reported in ‘financial income and
expenses’ in the statement of comprehensive income.
Changes in the fair value of monetary securities denominated in foreign currency classified as
available-for-sale are analyzed between translation differences resulting from changes in the
amortized cost of the security and other changes in the carrying amount of the security. Translation
differences related to changes in amortized cost are recognized in profit or loss, and other changes in
carrying amount are recognized in equity.
Translation differences on non-monetary financial assets and liabilities, such as equities held at fair
value through profit or loss, are reflected in current operations as part of the fair value gain or loss.
Translation differences on non-monetary financial assets, such as equities classified as available-for-
sale, are included in the equity.

Hynix Semiconductor Inc.Notes to Separate Financial StatementsDecember 31, 2011 and 2010, and January 1, 2010
11
2.4 Cash and Cash Equivalents
Cash and cash equivalents include cash in hand, deposits held at call with banks, and other short-
term highly liquid investments with original maturities of less than three months.
2.5 Trade Receivables
Trade receivables are amounts due from customers for merchandise sold or services performed in the
ordinary course of business. If collection is expected in one year or less, they are classified as current
assets. If not, they are presented as non-current assets. Trade receivables are recognized initially at
fair value and subsequently measured at amortized cost using the effective interest method, less
allowance for doubtful accounts.
2.6 Inventories
Inventories are stated at the lower of cost and net realizable value. Cost is determined using the
weighted-average method, except for inventories in-transit which is determined using the specific
identification method. The cost of finished goods and work in progress consists of raw materials,
direct labor, other direct costs and related production overheads (based on normal operating capacity).
It excludes borrowing costs. Net realizable value is the estimated selling price in the ordinary course
of business, less applicable variable selling expenses.
2.7 Financial Assets
2.7.1 Classification
The Company classifies its financial assets in the following categories: at fair value through profit or
loss, loans and receivables, available-for-sale, and held-to-maturity. The classification depends on the
purpose for which the financial assets were acquired. Management determines the classification of its
financial assets at initial recognition.
(a) Financial assets at fair value through profit or loss
Financial assets at fair value through profit or loss are financial assets held for trading. A financial
asset is classified in this category if acquired principally for the purpose of selling in the short term.
Derivatives or embedded derivatives are also categorized as held for trading unless they are
designated as hedges. Assets in this category are classified as current assets.
(b) Loans and receivables
Loans and receivables are non-derivative financial assets with fixed or determinable payments that
are not quoted in an active market. They are included in current assets, except for maturities greater
than 12 months after the end of the reporting period. These are classified as non-current assets. The
Company’s loans and receivables comprise ‘cash and cash equivalents’, ‘short-term financial
instruments’, ‘trade and other receivables’ in the statements of financial position.

Hynix Semiconductor Inc.Notes to Separate Financial StatementsDecember 31, 2011 and 2010, and January 1, 2010
12
(c) Held-to-maturity investments
Held-to-maturity financial investments are non-derivative financial assets with fixed or determinable
payments and fixed maturities that the Company’s management has the positive intention and ability
to hold to maturity and are classified as ‘other financial assets’ in the statements of financial position.
If the Company were to sell other than an insignificant amount of held-to-maturity financial
investments, the whole category would be tainted and reclassified as available-for-sale. Held-to-
maturity financial investments are included in non-current assets, except for those with maturities of
less than 12 months after the end of the reporting period, which are classified as current assets.
(d) Available-for-sale financial assets
Available-for-sale financial assets are non-derivatives that are either designated in this category or not
classified in any of the other categories. They are included in non-current assets unless the
investment matures or management intends to dispose of it within 12 months after the end of the
reporting period.
2.7.2 Recognition and Measurement
Regular purchases and sales of financial assets are recognized on the trade date. Investments are
initially recognized at fair value plus transaction costs for all financial assets not carried at fair value
through profit or loss. Financial assets carried at fair value through profit or loss are initially
recognized at fair value, and transaction costs are reflected in current operations in the statements of
comprehensive income. Financial assets are derecognized when the rights to receive cash flows from
the investments have expired or have been transferred and the Company has transferred
substantially all risks and rewards of ownership. Available-for-sale financial assets and financial
assets at fair value through profit or loss are subsequently carried at fair value. Loans and receivables
are subsequently carried at amortized cost using the effective interest rate method.
When securities classified as available-for-sale are sold or impaired, the accumulated fair value
adjustments recognized in equity are reported in the statements of comprehensive income as
‘financial income and expenses’.
Interest on available-for-sale and held-to-maturity securities calculated using the effective interest
method is recognized in the statements of comprehensive income as part of ‘financial income’.
Dividends on available-for-sale equity instruments are recognized in the statements of comprehensive
income as part of ‘financial income’ when the Company’s right to receive payments is established.
2.7.3 Offsetting of Financial Instruments
Financial assets and liabilities are offset and the net amount is reported in the statements of financial
position when there is a legally enforceable right to offset the recognized amounts and there is an
intention to settle on a net basis or realize the asset and settle the liability simultaneously.

Hynix Semiconductor Inc.Notes to Separate Financial StatementsDecember 31, 2011 and 2010, and January 1, 2010
13
2.7.4 Derecognition
Financial assets are derecognized when the contractual rights to receive cash flows from the
investments have expired or have been transferred and the Company has substantially transferred all
risks and rewards of ownership.
Collaterals (trade receivables and other) provided in transactions of discount and factoring of trade
receivables do not meet the requirements for asset derecognition if risks and rewards do not
substantially transfer in the event the debtor defaults. Financial liabilities recognized in relation to
these transactions are included as borrowings in the Company’s statements of financial position.
2.8 Impairment of Financial Assets
(a) Assets carried at amortized cost
The Company assesses at the end of each reporting period whether there is objective evidence that a
financial asset or a group of financial assets is impaired. A financial asset or a group of financial
assets is impaired and impairment losses are incurred only if there is objective evidence of
impairment as a result of one or more events that occurred after the initial recognition of the asset (a
‘loss event’) and that loss event has an impact on the estimated future cash flows of the financial
asset or a group of financial assets that can be reliably estimated.
The criteria that the Company uses to determine that there is objective evidence of an impairment
loss include:
Significant financial difficulty of the issuer or obligor;
A breach of contract, such as a default or delinquency in interest or principal payments;
For economic or legal reasons relating to the borrower’s financial difficulty, granting to the
borrower a concession that the lender would not otherwise consider;
It becomes probable that the borrower will enter bankruptcy or other financial reorganization;
The disappearance of an active market for that financial asset because of financial difficulties; or
Observable data suggesting that there is a measurable decrease in the estimated future cash
flows from a portfolio of financial assets since the initial recognition of those assets, even though
the decrease cannot be identified with respect to the individual financial assets in the portfolio,
including:
(i) adverse changes in the payment status of borrowers in the portfolio;
(ii) national or local economic conditions that correlate with defaults on the assets in the portfolio.
The amount of the loss is measured as the difference between the assets’ carrying amount and the
present value of estimated future cash flows (excluding future credit losses that have not been
incurred) discounted at the financial asset’s original effective interest rate. The carrying amount of the
asset is reduced and the amount of the loss is recognized in the statements of comprehensive income.
Also, the Company may measure impairment on the basis of an instrument’s fair value using an
observable market price.

Hynix Semiconductor Inc.Notes to Separate Financial StatementsDecember 31, 2011 and 2010, and January 1, 2010
14
If, in a subsequent period, the amount of impairment loss decreases and the decrease can be related
objectively to an event occurring after the impairment was recognized such as an improvement in
debtor’s credit rating, the reversal of the previously recognized impairment loss is reflected in the
statements of comprehensive income.
(b) Assets classified as available-for-sale
The Company assesses at the end of each reporting period whether there is objective evidence that a
financial asset or a group of financial assets is impaired. For debt securities, the Company uses the
criteria refer to (a) above. In the case of equity investments classified as available-for-sale, a
significant or prolonged decline in the fair value of the security below its cost is also evidence that the
asset is impaired. If any such evidence exists for available-for-sale financial assets, the cumulative
loss – measured as the difference between the acquisition cost and the current fair value, less any
impairment loss on that financial asset previously recognized in profit or loss – is removed from equity
and recognized in the statements of comprehensive income. Impairment losses recognized in the
statements of comprehensive income on equity instruments are not reversed through the statements
of comprehensive income. If, in a subsequent period, the fair value of a debt instrument classified as
available-for-sale increases and the increase can be objectively related to an event occurring after the
impairment loss was recognized in profit or loss, the impairment loss is reversed through the
statements of comprehensive income.
2.9 Derivative Financial Instruments and Hedging Activities
Derivatives are initially recognized at fair value on the date a derivative contract is entered into and
are subsequently re-measured at their fair value. The method of recognizing the resulting gain or loss
depends on whether the derivative is designated as a hedging instrument, and the nature of the item
being hedged. The resulting gain or loss is recognized in 'financial income and expenses' in the
statements of comprehensive income.
2.10 Property, Plant and Equipment
All property, plant and equipment are stated at historical cost less depreciation, and accumulated
impairment loss. Historical cost includes expenditures directly attributable to the acquisition of the
items.
Subsequent costs are included in the asset’s carrying amount or recognized as a separate asset, as
appropriate, only when it is probable that future economic benefits associated with the item will flow to
the Company and the cost of the item can be measured reliably. The carrying amount of the replaced
part is derecognized. All other repairs and maintenance are charged to the statement of
comprehensive income during the financial period in which they are incurred.
Land is not depreciated. Depreciation on other assets is calculated using the straight-line method to
allocate the difference between their cost and their residual values over their estimated useful lives,
as follows:

Hynix Semiconductor Inc.Notes to Separate Financial StatementsDecember 31, 2011 and 2010, and January 1, 2010
15
Buildings 10 - 50 years
Structures 10 - 20 years
Machinery 5 - 15 years
Vehicles 5 years
Other 5 - 10 years
The assets’ depreciation method residual values and useful lives are reviewed, and adjusted if
appropriate, at the end of each reporting period. An asset’s carrying amount is written down
immediately to its recoverable amount if the asset’s carrying amount is greater than its estimated
recoverable amount. Gains and losses on disposals are determined by comparing the proceeds with
the carrying amount and are recognized within ‘other operating income and expenses’ in the
statements of comprehensive income.
2.11 Borrowing Costs
The Company capitalizes borrowing costs directly attributable to the acquisition or construction of a
qualifying asset as part of the cost of that asset during an extended period in which it prepares an
asset for its intended use. A qualifying asset is an asset that necessarily takes a substantial period of
time to get ready for its intended use or sale. When a particular borrowing is specifically associated
with expenditure on the qualifying asset, the amount of borrowing costs capitalized is limited to the
actual borrowing costs less any investment income on the temporary investment of those borrowings.
The Company recognizes other borrowing costs as an expense in the period in which they are
incurred.
2.12 Government Grants
Grants from a government are recognized at their fair value where there is a reasonable assurance
that the grant will be received and the Company will comply with all attached conditions.
Government grants relating to property, plant and equipment are presented as a deduction of related
assets and are credited to depreciation over the expected lives of the related assets.
Government grants relating to costs are deferred and recognized in the statements of comprehensive
income over the period necessary to match them with the costs that they are intended to compensate.
2.13 Intangible Assets
(a) Goodwill
Goodwill is initially measured as the excess of the aggregate of the consideration transferred and the
fair value of non-controlling interest over the net identifiable assets acquired and liabilities assumed.
Goodwill is tested annually for impairment and carried at cost less accumulated impairment losses.
For the purpose of impairment testing, goodwill acquired in a business combination is allocated to
each of the cash-generating units or groups of cash-generating units that are expected to benefit from
the synergies of the combination. Goodwill is monitored at the operating segment level.

Hynix Semiconductor Inc.Notes to Separate Financial StatementsDecember 31, 2011 and 2010, and January 1, 2010
16
Goodwill impairment reviews are undertaken annually or more frequently if events or changes in
circumstances indicate a potential impairment. The carrying value of goodwill is compared to the
recoverable amount, which is the higher of value in use and the fair value less costs to sell. Any
impairment is recognized immediately as an expense and is not subsequently reversed.
(b) Industrial rights
Industrial rights are shown at historical cost. Industrial rights in a business combination are
recognized as fair value at acquisition. Industrial rights have a finite useful life and are carried at cost
less accumulated amortization. Amortization is calculated using the straight-line method to allocate
the cost of industrial rights over their estimated useful lives.
Acquired computer software licenses are capitalized on the basis of the costs incurred to acquire and
bring to use the specific software. These costs are amortized over their estimated useful lives.
(c) Development Costs
Costs associated with research activities are recognized as an expense as incurred. Costs that are
individually identifiable, controllable and directly attributable to development projects are recognized
as intangible assets when all the following criteria are met:
It is technically feasible to complete the development project so that it will be available for use;
Management intends to complete the development project;
There is an ability to use or sell the development project;
It can be demonstrated how the development project will generate probable future economic
benefits;
Ability to obtain adequate technical financial and other resources to complete or use or sell the
development project
The expenditure attributable to the individual project during its development can be reliably
measured.
Other development expenditures that do not meet these criteria are recognized as an expense as
incurred. Amortization of development costs based on the straight-line method over their useful lives
begins at the commencement of the commercial production of related development products. The
Company tests annually for impairment of development cost.
(d) Membership rights
Membership rights are regarded as intangible assets with indefinite useful life and not amortized
because there is no foreseeable limit to the period over which the asset is expected to be utilized.
2.14 Investment Property
Investment property is held to earn rentals or for capital appreciation or both. Investment property also
includes property that is being constructed or developed for future use as investment property.
Investment property is measured initially at its cost including transaction costs incurred in acquiring

Hynix Semiconductor Inc.Notes to Separate Financial StatementsDecember 31, 2011 and 2010, and January 1, 2010
17
the asset. After recognition as an asset, investment property is carried at cost less accumulated
depreciation and impairment losses.
Subsequent costs are include in the asset’s carrying amount or recognized as a separate asset, only
when it is probable that future economic benefits associated with the item will flow to the Company
and the cost of the item can be measured reliably. The carrying amount of the replaced part is
derecognized. All other repairs and maintenance are charged to the statements of comprehensive
income during the financial period in which they are incurred.
Land held for investment is not depreciated. Investment property, except for land, is depreciated using
straight-line method over their estimated useful lives.
The depreciation method, the residual value and the useful life of an asset are reviewed at the end of
each financial year and, if management judges that previous estimates should be adjusted, the
change is accounted for as a change in an accounting estimate.
Gains and losses on disposals are determined by comparing the proceeds with the carrying amount
and are recognized within ‘other operating income and expenses’ in the statements of comprehensive
income.
2.15 Impairment of Non-financial Assets
Goodwill or intangible assets with indefinite useful lives are not subject to amortization and are tested
annually for impairment. Assets that are subject to amortization are reviewed for impairment
whenever events or changes in circumstances indicate that the carrying amount may not be
recoverable. An impairment loss is recognized for the amount by which the asset’s carrying amount
exceeds its recoverable amount. The recoverable amount is the higher of an asset’s fair value less
costs to sell and value in use. For the purposes of assessing impairment, assets are grouped at the
lowest levels for which there are separately identifiable cash flows (cash-generating units). Non-
financial assets, other than goodwill, that suffered impairment are reviewed for possible reversal of the
impairment at each reporting date.
2.16 Non-current Assets Held for sale
Non-current assets are classified as assets held for sale when their carrying amount is to be
recovered principally through a sale transaction and a sale is considered highly probable. They are
stated at the lower of carrying amount and fair value less costs to sell.
2.17 Trade Payables
Trade payables are obligations to pay for goods or services that have been acquired in the ordinary
course of business from suppliers. Trade payables are classified as current liabilities if payment is due
within one year. If not, they are presented as non-current liabilities. Trade payables are recognized
initially at fair value and subsequently measured at amortized cost using the effective interest method.

Hynix Semiconductor Inc.Notes to Separate Financial StatementsDecember 31, 2011 and 2010, and January 1, 2010
18
2.18 Financial Liabilities
(a) Financial liabilities at fair value through profit or loss
Financial liabilities at fair value through profit or loss are financial instruments held for trading.
Financial liabilities are classified as financial liabilities at fair value through profit or loss when incurred
principally for the purpose of repurchasing it in the near term. Derivatives or embedded derivatives
are also categorized as this category unless they are designated as hedges.
(b) Financial liabilities carried at amortized cost
The Company classifies non-derivative financial liabilities, except for financial liabilities at fair value
through profit or loss and financial liabilities that arise when a transfer of a financial asset does not
qualify for derecognition, as financial liabilities carried at amortized cost and as ‘trade payables’, ‘other
payables’, ‘borrowings’ and ‘other financial liabilities’ in the statement of financial position. In case
when a transfer of a financial asset does not qualify for derecognition, the transferred asset is
continuously recognized as asset and the consideration received is recognized as financial liabilities.
Financial liabilities carried at amortized cost are included in non-current liabilities, except for liabilities
with maturities less than 12 months after the end of the reporting period, which are classified as
current liabilities.
2.19 Financial Guarantee Contract
Financial guarantee contracts are contracts that require the issuer to make specified payments to
reimburse the holder for a loss it incurs because a specified debtor fails to make payments when due,
in accordance with the terms of a debt instrument.
Financial guarantees are initially recognized in the financial statements at fair value on the date the
guarantee was given. Subsequent to initial recognition, the Company’s liabilities under such
guarantees are measured at the higher of the amounts below. Any increase in the liability relating to
guarantees is reported as other financial liabilities.
amount calculated in accordance with Korean-IFRS 1037, Provisions, Contingent Liabilities andContingent Assets; or
the initial amount, less accumulated amortization recognized in accordance with Korean-IFRS1018, Revenue.
2.20 Borrowings
Borrowings are recognized initially at fair value, net of transaction costs incurred. Borrowings are
subsequently carried at amortized cost; any difference between the proceeds (net of transaction costs)
and the redemption value is recognized in the statements of comprehensive income over the period of
the borrowings using the effective interest method. The Company recognizes borrowings as current
assets unless it has an unconditional right to delay the settlement of the borrowing more than 12
month after the end of the reporting period.

Hynix Semiconductor Inc.Notes to Separate Financial StatementsDecember 31, 2011 and 2010, and January 1, 2010
19
2.21 Compound Financial Instruments
Compound financial instruments issued by the Company comprise convertible notes that can be
converted to share capital at the option of the holder, and the number of shares to be issued does not
vary with changes in their fair value.
The liability component of a compound financial instrument is recognized initially at the fair value of a
similar liability that does not have an equity conversion option. The equity component is recognised
initially at the difference between the fair value of the compound financial instrument as a whole and
the fair value of the liability component. Any directly attributable transaction costs are allocated to the
liability and equity components in proportion to their initial carrying amounts.
Subsequent to initial recognition, the liability component of a compound financial instrument is
measured at amortized cost using the effective interest method. The equity component of a
compound financial instrument is not re-measured subsequent to initial recognition except on
conversion or expiry.
At the point of issuing convertible bonds, if the amount of share premium (Capital surplus) is defined,
the conversion component is classified as equity, if not, the conversion component is classified as
financial liability. The Company classifies the instrument as derivative if the conversion component is
classified as financial liability and an embedded derivative can be separated from the host contract.
2.22 Provisions
Provisions are recognized when: the Company has a present legal or constructive obligation as a
result of past events; it is probable that an outflow of resources will be required to settle the obligation;
and the amount has been reliably estimated. Provisions are not recognized for future operating losses.
Provisions are measured at the present value of the expenditures expected to be required to settle
the obligation using a pre-tax rate that reflects current market assessments of the time value of
money and the risks specific to the obligation. The increase in the provision due to passage of time is
recognized as interest expense.
2.23 Current and Deferred Income Tax
The tax expense for the period comprises current and deferred tax. Tax is recognized in the
statements of comprehensive income, except to the extent that it relates to items recognized in other
comprehensive income or directly in equity. In this case the tax is also recognized in other
comprehensive income or directly in equity.
The current income tax charge is calculated on the basis of the tax laws enacted or substantively
enacted at the reporting date. Management periodically evaluates positions taken in tax returns with
respect to situations in which applicable tax regulation is subject to interpretation. It establishes
provisions where appropriate on the basis of amounts expected to be paid to the tax authorities.

Hynix Semiconductor Inc.Notes to Separate Financial StatementsDecember 31, 2011 and 2010, and January 1, 2010
20
Deferred income tax is recognized on temporary differences arising between the tax bases of assets
and liabilities and their carrying amounts in the separate financial statements. It represents future tax
consequences that will arise when recovering or settling the carrying amount of its assets and
liabilities. However, the deferred income tax is not accounted for if it arises from initial recognition of
an asset or liability in a transaction other than a business combination that at the time of the
transaction affects neither accounting nor taxable profit or loss. Deferred income tax is determined
using tax rates and laws that have been enacted or substantially enacted by the end of the reporting
period and are expected to apply when the related deferred income tax asset is realized or the
deferred income tax liability is settled.
Deferred income tax assets are recognized only to the extent that it is probable that future taxable
profit will be available against which the temporary differences can be utilized.
Deferred income tax is provided on temporary differences arising on investments in subsidiaries and
associates, except for deferred income tax liability where the timing of the reversal of the temporary
difference is controlled by the Company and it is probable that the temporary difference will not
reverse in the foreseeable future.
Deferred income tax assets and liabilities are offset when there is a legally enforceable right to offset
current tax assets against current tax liabilities and when the deferred income taxes assets and
liabilities relate to income taxes levied by the same taxation authority on either the same taxable entity
or different taxable entities where there is an intention to settle the balances on a net basis.
2.24 Employee Benefits
(a) Defined benefit liability
The Company operates defined benefit plan. Typically defined benefit plans define an amount of
pension benefit that an employee will receive on retirement, usually dependent on one or more factors
such as years of service and compensation.
The liability recognized in the statement of financial position in respect of defined benefit pension
plans is the present value of the defined benefit obligation at the end of the reporting period less the
fair value of plan assets, together with adjustment for unrecognized past-service costs. The defined
benefit obligation is calculated annually by independent actuaries using the projected unit credit
method. The present value of the defined benefit obligation is determined by discounting the
estimated future cash outflows using interest rates of high-quality corporate bonds that are
denominated in the currency in which the benefits will be paid, and that have terms to maturity
approximating to the terms of the related pension obligation.
Actuarial gains and losses arising from experience adjustments and changes in actuarial assumptions
are charged or credited to equity in other comprehensive income in the period in which they arise.
Past-service costs are recognized over the vesting period.
Hynix Semiconductor Inc.Notes to Separate Financial StatementsDecember 31, 2011 and 2010, and January 1, 2010
21
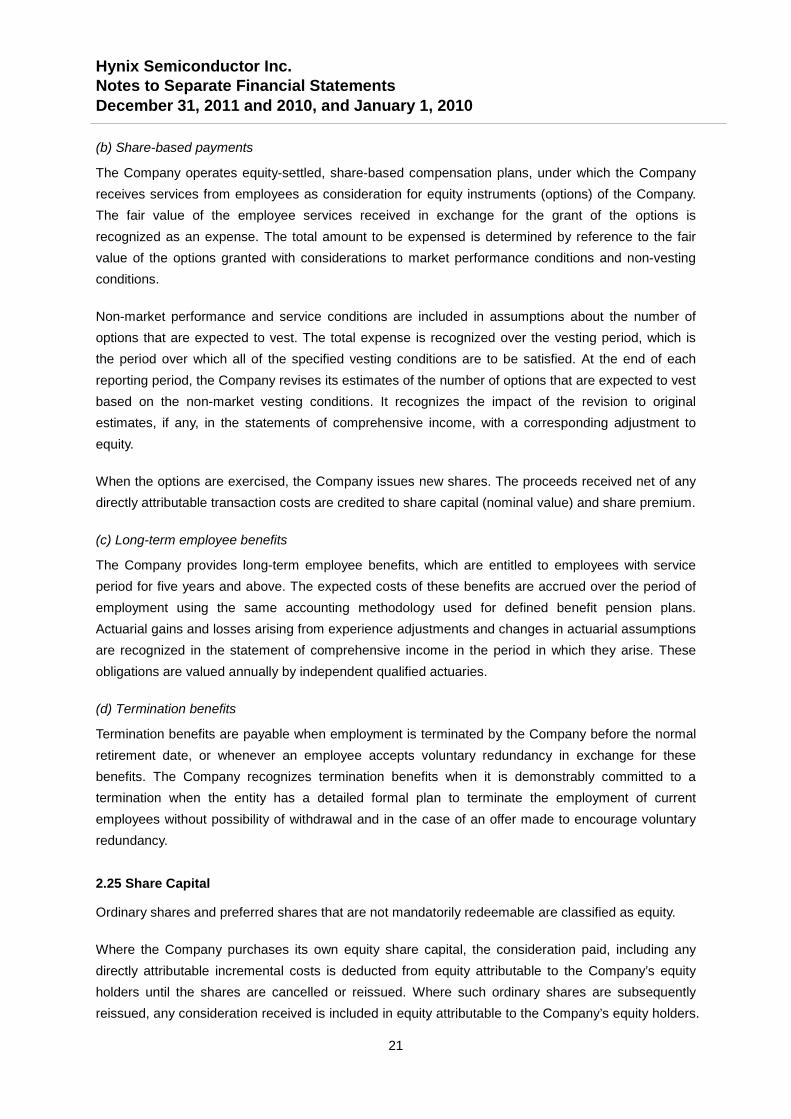
(b) Share-based payments
The Company operates equity-settled, share-based compensation plans, under which the Company
receives services from employees as consideration for equity instruments (options) of the Company.
The fair value of the employee services received in exchange for the grant of the options is
recognized as an expense. The total amount to be expensed is determined by reference to the fair
value of the options granted with considerations to market performance conditions and non-vesting
conditions.
Non-market performance and service conditions are included in assumptions about the number of
options that are expected to vest. The total expense is recognized over the vesting period, which is
the period over which all of the specified vesting conditions are to be satisfied. At the end of each
reporting period, the Company revises its estimates of the number of options that are expected to vest
based on the non-market vesting conditions. It recognizes the impact of the revision to original
estimates, if any, in the statements of comprehensive income, with a corresponding adjustment to
equity.
When the options are exercised, the Company issues new shares. The proceeds received net of any
directly attributable transaction costs are credited to share capital (nominal value) and share premium.
(c) Long-term employee benefits
The Company provides long-term employee benefits, which are entitled to employees with service
period for five years and above. The expected costs of these benefits are accrued over the period of
employment using the same accounting methodology used for defined benefit pension plans.
Actuarial gains and losses arising from experience adjustments and changes in actuarial assumptions
are recognized in the statement of comprehensive income in the period in which they arise. These
obligations are valued annually by independent qualified actuaries.
(d) Termination benefits
Termination benefits are payable when employment is terminated by the Company before the normal
retirement date, or whenever an employee accepts voluntary redundancy in exchange for these
benefits. The Company recognizes termination benefits when it is demonstrably committed to a
termination when the entity has a detailed formal plan to terminate the employment of current
employees without possibility of withdrawal and in the case of an offer made to encourage voluntary
redundancy.
2.25 Share Capital
Ordinary shares and preferred shares that are not mandatorily redeemable are classified as equity.
Where the Company purchases its own equity share capital, the consideration paid, including any
directly attributable incremental costs is deducted from equity attributable to the Company’s equity
holders until the shares are cancelled or reissued. Where such ordinary shares are subsequently
reissued, any consideration received is included in equity attributable to the Company’s equity holders.

Hynix Semiconductor Inc.Notes to Separate Financial StatementsDecember 31, 2011 and 2010, and January 1, 2010
22
2.26 Revenue Recognition
Revenue is measured at the fair value of the consideration received or receivable, and represents
amounts receivable for goods and services supplied, stated net of discounts, returns and value added
taxes.
The Company recognizes revenue when the amount of revenue can be reliably measured; when it is
probable that future economic benefits will flow to the entity, and when specific criteria have been met
for each of the Company’s activities, as described below. The revenue can be reliably measured only
when any contingency related to sales is resolved. The Company bases its estimates on historical
results, taking into consideration the type of customer, the type of transaction and the specifics of
each arrangement.
(a) Sales of goods
The Company manufactures and sells semiconductor products. Sales of goods are recognized when
the Company has transferred to the customers the significant risks and rewards of ownership of the
goods.
The products are often sold with volume discounts and customers have a right to return faulty
products. Accumulated experience is used to estimate and provide for the discounts and returns.
The Company recognizes provisions for sales returns based on reasonable expectation reflecting
sales return rates incurred historically.
(b) Interest income
Interest income is recognized using the effective interest method. When receivables are impaired, the
Company reduces the carrying amount to its recoverable amount and continues unwinding the
discount as interest income. Interest income on impaired receivables is recognized using the original
effective interest rate.
(c) Dividend income
Dividend income is recognized when the right to receive payment is established.
(d) Royalty income
Royalty income is recognized on an accrual basis in accordance with the substance of the relevant
agreements.
2.27 Leases
Leases in which a significant portion of the risks and rewards of ownership are retained by the lessor
are classified as operating leases. Payments made under operating leases are charged to the
statements of comprehensive income on a straight-line basis over the period of the lease.
Leases of property, plant and equipment where the Company has substantially all the risks and

Hynix Semiconductor Inc.Notes to Separate Financial StatementsDecember 31, 2011 and 2010, and January 1, 2010
23
rewards of ownership are classified as finance leases. Finance leases are capitalized at the lease’s
commencement at the lower of the fair value of the leased property and the present value of the
minimum lease payments.
Each lease payment is allocated between the liability and finance charges. The corresponding rental
obligations, net of finance charges, are included in ‘borrowings’. The interest element of the finance
cost is charged to the statements of comprehensive income over the lease period so as to produce a
constant periodic rate of interest on the remaining balance of the liability for each period. The property,
plant and equipment acquired under finance leases are depreciated over the shorter of the useful life
of the asset and the lease term.
2.28 Dividend Distribution
Dividend distribution to the Company’s shareholders is recognized as a liability in the financial
statements in the period in which the dividends are approved by the Company’s shareholders.
2.29 Approval of Issuance of the Financial Statements
The issuance of the December 31, 2011 financial statements of the Company was approved by the
Board of Directors on February 1, 2012.
3. Critical Accounting Estimates and Judgments
The Company makes estimates and assumptions concerning the future. The resulting accounting
estimates will, by definition, seldom equal the related actual results. Estimations and assumptions are
continuously evaluated with consideration to factors such as events reasonably predictable in the
foreseeable future within the present circumstance according to historical experience. The estimates
and assumptions that have a significant risk of causing a material adjustment to the carrying amounts
of assets and liabilities within the next financial year are addressed below.
(a) Income taxes
The Company is operating in numerous countries and the income generated from these operations is
subject to income taxes based on tax laws and interpretations of tax authorities in numerous
jurisdictions. There are many transactions and calculations for which the ultimate tax determination is
uncertain. The Company recorded, based on its best estimate, current taxes and deferred taxes that
the Company will be liable in the future for the operating results as of the financial year end. However,
the final tax outcome in the future may be different from the amounts that were initially recorded. Such
differences will impact the current and deferred income tax assets and liabilities in the period in which
such determination is made.
(b) Fair value of financial instruments
The fair value of financial instruments that are not traded in an active market is determined by using
valuation techniques. The Company uses its judgment to select a variety of methods and make
assumptions that are mainly based on market conditions existing at the end of each reporting period.

Hynix Semiconductor Inc.Notes to Separate Financial StatementsDecember 31, 2011 and 2010, and January 1, 2010
24
(c) Estimated impairment of goodwill
The Company tests annually whether goodwill has suffered any impairment in accordance with the
accounting policy stated in Note 2.13. The recoverable amounts of cash-generating units have been
determined based on value-in-use calculations. These calculations require the use of estimates (Note
16).
(d) Provisions
Provisions for legal claims are recognized when the Company has a present legal or constructive
obligation as a result of past events and it is probable that an outflow of resources will be required to
settle the obligation and the amount has been reliably estimated.
The Company estimates the expected sales return reasonably and adjusts to sales and cost of sales
and estimated expenses are recorded as provisions.
(e) Defined benefit liability
The present value of the defined benefit liability depends on a number of factors that are determined
on an actuarial basis using a number of assumptions. The assumptions used in determining the net
cost (income) for pensions include the discount rate. Any changes in these assumptions will impact
the carrying amount of the defined benefit liability. The Company determines the appropriate discount
rate at the end of each year. This is the interest rate that is used to determine the present value of
estimated future cash outflows expected to be required to settle the defined benefit liability. In
determining the appropriate discount rate, the Company considers the interest rates of high-quality
corporate bonds that are denominated in the currency in which the benefits will be paid, and that have
terms to maturity approximating the terms of the related pension liability. Other key assumptions for
defined benefit liability are based in part on current market conditions. Additional information is
disclosed in Note 23.
4. Financial Risk Management
4.1 Financial Risk Factors
The Company’s activities are exposed to a variety of financial risks: market risk (including currency
risk, fair value interest rate risk, cash flow interest rate risk and price risk), credit risk and liquidity risk.
The Company’s overall risk management program focuses on the unpredictability of financial markets
and seeks to minimize potential adverse effects on the Company’s financial performance. The
Company uses derivative financial instruments to hedge certain risk exposures.
Risk management is carried out by a central treasury department under policies approved by the
board of directors. The Company treasury identifies, evaluates and hedges financial risks in close co-
operation with the Company’s operating units. The board provides written principles for overall risk
management, as well as written policies covering specific areas, such as foreign exchange risk,
interest rate risk, and credit risk, use of derivative financial instruments and non-derivative financial

Hynix Semiconductor Inc.Notes to Separate Financial StatementsDecember 31, 2011 and 2010, and January 1, 2010
25
instruments, and investment of excess liquidity.
(a) Market risk
i) Foreign exchange risk
The Company operates internationally and is exposed to foreign exchange risk arising from various
currency exposures, primarily with respect to the US dollar, Euro and Japanese Yen. Foreign
exchange risk arises from future commercial transactions and recognized assets and liabilities in
foreign currencies and net investments in foreign operations.
At December 31, 2011, if the currency had weakened/strengthened by 10% against the US dollar with
all other variables held constant, profit before income tax for the year would have been \ 277,161
million (2010: \ 239,623 million) lower/higher, mainly as a result of foreign exchange gains/losses on
translation of US dollar-denominated trade receivables and foreign exchange losses/gains on
translation of US dollar-denominated borrowings and payables.
At December 31, 2011, if the currency had weakened/strengthened by 10% against the Japanese Yen
with all other variables held constant, profit before income tax for the year would have been \ 29,776
million (2010: \ 15,328 million) lower/higher, mainly as a result of foreign exchange gains/losses on
translation of Japanese Yen-denominated trade receivables and foreign exchange losses/gains on
translation of Japanese Yen-denominated trade payables.
At December 31, 2011, if the currency had weakened/strengthened by 10% against the Euro with all
other variables held constant, profit before income tax for the year would have been \ 10,873 million
(2010: \ 12,306 million) lower/higher, mainly as a result of foreign exchange gains/losses on
translation of Euro-denominated trade receivables and foreign exchange losses/gains on translation
of Euro-denominated trade payables.
ii) Price risk
The Company is exposed to equity securities price risk because of investments held by the Company
and classified on the separate statement of financial position either as available-for-sale or at fair
value through profit or loss. To manage its price risk arising from investments in equity securities, the
Company diversifies its portfolio.
The listed securities held by the Company are traded in active markets such as KOSPI stock index,
KOSDAQ stock index and TWSE(Taiwan) index.
The table below summarizes the impact of increases/decreases in the Company’s equity as a result
of the changes in the price per share at the active market on the securities held by the Company.
2011 2010
(in millions of Korean won) 20% increase 20% decrease 20% increase 20% decrease
Effects in equity 5,458 (5,458) 7,486 (7,486)

Hynix Semiconductor Inc.Notes to Separate Financial StatementsDecember 31, 2011 and 2010, and January 1, 2010
26
Other components of equity would increase/ decrease as a result of changes in the price of the equity
securities classified as available for sale.
iii) Interest rate risk
The Company’s cash flow interest rate risk arises from borrowings. Borrowings issued at variable
rates expose the Company to cash flow interest rate risk which is partially offset by cash held at
variable rates.
The Company manages its cash flow interest rate risk by using floating-to-fixed interest rate swaps.
Such interest rate swaps have the economic effect of converting borrowings from floating rates to
fixed rates. Generally, the Company raises long-term borrowings at floating rates and swaps them into
fixed rates that are lower than those available if the Company borrowed at fixed rates directly. Under
the interest rate swaps, the Company agrees with other parties to exchange, at specified intervals
(primarily quarterly), the difference between fixed contract rates and floating-rate interest amounts
calculated by reference to the agreed notional amounts.
As of December 31, 2011, the Company is in a net borrowing position and is partially exposed to a
risk of increase in interest rates. However, the Company adequately minimizes risks from changes in
interest rate fluctuations by matching variable interest bearing short-term borrowings with variable
interest-bearing financial deposits.
As of December 31, 2011, if interest rates on borrowings had been 100 basis points higher/lower with
all other variables held constant, profit before income tax for the year would have been \ 8,540
million (2010: \ 11,005 million) lower/higher, mainly as a result of higher/lower interest expense on
floating rate borrowings.
(b) Credit risk
The Company is exposed to credit risk which arises from counterparty’s non-performance of
obligation. The credit risk mainly arises from operating activities and financial activities.
i) Trade and other Receivables
Credit risk is managed on group basis, and the Company is managing and analyzing the credit risk for
each of new clients before standard payment and delivery terms and conditions are offered. The
Company operates a consistent trade receivables policy (TR Policy) to manage credit risk exposure.
The purpose of the TR policy is to support timely decision-making and minimize loss by securing
payment of TR. Assumed TR risk is especially mitigated with credit insurance, guarantees/collateral
and internal credit limits. In order to manage the risk, Global Credit Insurance Program is structured
with a credit insurance company, Korea Trade Insurance Corporation.
ii) Other assets
Credit risk arises from cash and cash equivalents, financial instruments and deposits with banks and
financial institutions, as well as credit exposures from short-term and long-term loans. For banks and
financial institutions, only independently rated parties with a high credit rating are accepted, and

Hynix Semiconductor Inc.Notes to Separate Financial StatementsDecember 31, 2011 and 2010, and January 1, 2010
27
accordingly management does not expect any losses from non-performance by these counterparties.
(c) Liquidity risk
Liquidity risk is defined as the risk that the Company is unable to meet its short-term payment
obligations on time due to deterioration of its business performance or inability to access financing.
The Company forecasts its cash flow and liquidity status and sets action plans on a regular base to
manage liquidity risk proactively.
Surplus cash held by the operating entities over and above balance required for working capital
management are transferred to the Company treasury. The Company treasury invests surplus cash in
interest bearing current accounts, time deposits, demand deposits, marketable available-for-sale
securities, choosing instruments with appropriate maturities or sufficient liquidity to provide sufficient
head-room as determined by the above-mentioned forecasts. As of December 31, 2011, the Company
held cash equivalents and short-term financial instruments of approximately \ 729,310 million (2010:
\ 770,365 million) and \ 570,000 million (2010: \ 785,000 million), respectively, that are expected
to readily generate cash inflows for managing liquidity risk.
The analysis of the Company’s liquidity risk as of December 31, 2011 and 2010, and January 1, 2010,
are as follows:
December 31, 2011
(in millions of Korean won)
Less than
1 year
Between
1 year and
2 years
Between
2 years and
5 years
Over
5 yearsTotal
Borrowings
(other than finance lease)2,465,082 1,034,609 1,683,164 576,920 5,759,775
Finance lease liabilities 84,726 114,380 169,647 - 368,753
Derivatives 35,640 - - - 35,640
Trade payables 840,146 - - - 840,146
Other payables 500,950 - - - 500,950
Other non-trade payables 320,395 30,760 40,833 17,014 409,002
Financial guarantee contract 15,807 - - - 15,807
4,262,746 1,179,749 1,893,644 593,934 7,930,073

Hynix Semiconductor Inc.Notes to Separate Financial StatementsDecember 31, 2011 and 2010, and January 1, 2010
28
December 31, 2010
(in millions of Korean won)
Less than
1 year
Between
1 year and
2 years
Between
2 years and
5 years
Over
5 yearsTotal
Borrowings
(other than finance lease)1,410,224 970,826 1,504,822 569,573 4,455,445
Finance lease liabilities 127,503 64,605 113,552 - 305,660
Derivatives 69,688 - - - 69,688
Trade payables 868,338 - - - 868,338
Other payables 711,019 - - - 711,019
Other non-trade payables 456,164 148,474 48,353 29,143 682,134
Financial guarantee contract 60,047 - - - 60,047
3,702,983 1,183,905 1,666,727 598,716 7,152,331
January 1, 2010
(in millions of Korean won)
Less than
1 year
Between
1 year and
2 years
Between
2 years and
5 years
Over
5 yearsTotal
Borrowings
(other than finance lease)1,972,875 754,753 1,883,179 583,988 5,194,795
Finance lease liabilities 86,196 93,059 108,064 - 287,319
Derivatives 92,306 - - - 92,306
Trade payables 943,395 - - - 943,395
Other payables 482,197 - - - 482,197
Other non-trade payables 216,447 102,840 87,752 42,097 449,136
Financial guarantee contract 60,595 - - - 60,595
Total 3,854,011 950,652 2,078,995 626,085 7,509,743
The table above analyses the Company’s non-derivative financial liabilities and net-settled derivative
financial liabilities into relevant maturity groupings based on the remaining period at the statement of
financial position date to the contractual maturity date. The amounts disclosed in the table are the
contractual undiscounted cash flows. The Company’s trading portfolio derivative instruments have
been included at their fair value of \ 35,640 million (December 31, 2010: \ 69,688 million; January 1,
2010: \ 92,306 million) within the less than one year time bucket. This is because the contractual
maturities are not essential for an understanding of the timing of the cash flows. These contracts are
managed on a net-fair value basis rather than by maturity date. Net settled derivatives comprise
interest rate swaps used by the Company to manage the Company’s interest rate profile.
4.2 Capital Risk Management
The Company’s objectives when managing capital are to safeguard the Company’s ability to continue
as a going concern in order to provide returns for shareholders and benefits for other stakeholders
and to maintain an optimal capital structure to reduce the cost of capital.

Hynix Semiconductor Inc.Notes to Separate Financial StatementsDecember 31, 2011 and 2010, and January 1, 2010
29
In order to maintain or adjust the capital structure, the Company may adjust the amount of dividends
paid to shareholders, return capital to shareholders, issue new shares or sell assets to reduce debt.
The debt/equity ratio and net borrowing ratio as of December 31, 2011 and 2010, and January 1,
2010, are as follows:
(in millions of Korean won) December 31, 2011 December 31, 2010 January 1, 2010
Total liabilities (A) 8,190,849 7,837,214 8,592,203
Total equity (B) 8,203,061 8,167,046 5,434,525
Cash and cash equivalentsand others (C)
1 1,568,887 1,804,414 1,328,603
Total borrowings (D) 5,473,986 4,583,771 5,444,328
Debt ratio (A/B) 99.85% 95.96% 158.10%
Net borrowing ratio (D-C)/B 47.61% 34.03% 75.73%1Cash and cash equivalents includes short-term financial instruments.
4.3 Fair Value Measurement
The table below analyzes financial instruments carried at fair value, by valuation method. The different
levels have been defined as follows:
Level 1: Quoted prices (unadjusted) in active markets for identical assets or liabilities.
Level 2: Inputs other than quoted prices included within level 1 that are observable for the asset or
liability, either directly (that is, as prices) or indirectly (that is, derived from prices).
Level 3: Inputs for the assets or liabilities that are not based on observable market data (that is,
unobservable inputs).
The following table presents the Company’s assets and liabilities that are measured at fair value at
December 31, 2011 and 2010, and January 1, 2010:
December 31, 2011(in millions of Korean won) Level 1 Level 2 Level 3 Total
AssetsFinancial assets at fair value throughprofit or loss
Trading derivatives - 3,114 - 3,114
Available-for-sale financial assets
Equity securities (at fair value) 34,498 - - 34,498
34,498 3,114 - 37,612
Liabilities
Financial liabilities at fair valuethrough profit or lossTrading derivatives - 42,111 - 42,111
- 42,111 - 42,111

Hynix Semiconductor Inc.Notes to Separate Financial StatementsDecember 31, 2011 and 2010, and January 1, 2010
30
December 31, 2010
(in millions of Korean won) Level 1 Level 2 Level 3 Total
AssetsFinancial assets at fair value throughprofit or loss
Trading derivatives - 7,695 - 7,695
Available-for-sale financial assets
Equity securities (at fair value) 44,379 - - 44,379
44,379 7,695 - 52,074
LiabilitiesFinancial liabilities at fair valuethrough profit or loss
Trading derivatives - 96,987 - 96,987
- 96,987 - 96,987
January 1, 2010
(in millions of Korean won) Level 1 Level 2 Level 3 Total
AssetsFinancial assets at fair value throughprofit or loss
Trading derivatives - 4,390 - 4,390
Available-for-sale financial assets
Equity securities (at fair value) 49,077 - - 49,077
49,077 4,390 - 53,467
LiabilitiesFinancial liabilities at fair valuethrough profit or loss
Trading derivatives - 96,054 - 96,054
- 96,054 - 96,054
The fair value of financial instruments traded in active markets is based on quoted market prices at
the statement of financial position date. A market is regarded as active if quoted prices are readily and
regularly available from an exchange, dealer, broker, an entity within the same industry, pricing
service, or regulatory agency, and those prices represent actual and regularly occurring market
transactions on an arm’s length basis. The quoted market price used for financial assets held by the
Company is the current bid price. These instruments are included in Level 1. Instruments included in
Level 1 consist primarily of KOSPI and KOSDAQ equity investments classified as trading securities or
available-for-sale.
The fair value of financial instruments that are not traded in an active market (for example, over-the-
counter derivatives) is determined by using valuation techniques. These valuation techniques
maximize the use of observable market data where it is available and rely as little as possible on
entity specific estimates. If all significant inputs required to fair value of instrument are observable, the
instrument is included in Level 2.
If one or more of the significant inputs is not based on observable market data, the instrument is
included in level 3.

Hynix Semiconductor Inc.Notes to Separate Financial StatementsDecember 31, 2011 and 2010, and January 1, 2010
31
Specific valuation techniques used to value financial instruments include:
Quoted market prices or dealer quotes for similar instruments. The fair value of interest rate swaps is calculated as the present value of the estimated future
cash flows based on observable yield curves. The fair value of forward foreign exchange contracts is determined using forward exchange rates
at the statement of financial position date, with the resulting value discounted back to presentvalue.
Other techniques, such as discounted cash flow analysis, are used to determine fair value for theremaining financial instruments.
The following table presents available-for-sale financial assets that are valued at historical cost as of
December 31, 2011 and 2010, and January 1, 2010.
(in millions of Korean won)
December 31,
2011
December 31,
2010
January 1,
2010
Novelis Korea Ltd. 1,699 1,699 1,699
Itest Co., Ltd. - 1,166 1,166
Futures Corp Technology Co., Ltd. - - 300
ZMOS Technology - - 994
JNT Frontier Private Equity Unit 700 - -
SV M&A No.1 Equity Unit 715 - -
Intellectual Discovery, Ltd. 4,000 - -
Anobit Technologies Ltd. 3,123 3,123 3,123
Seoul Investment Early & Green
Venture Fund
950 - -
TS 2011-4 Technology Transfer &
Business Buildup Fund
800 - -
Others 842 110 110
Total 12,829 6,098 7,392
The range of reasonable fair value estimates is significant and the probabilities of the various
estimates cannot be reasonably assessed, and therefore, above instruments are measured at cost.

Hynix Semiconductor Inc.Notes to Separate Financial StatementsDecember 31, 2011 and 2010, and January 1, 2010
32
5. Cash and cash equivalents
Cash and cash equivalents as of December 31, 2011 and 2010, and January 1, 2010, are as follows:
(in millions of Korean won) December 31, 2011 December 31, 2010 January 1, 2010
Cash on hand 8 8 8
Ordinary deposits 6 56 1
Time deposits 740,639 700,751 658,634
Specified money trust 60,000 172,000 115,001
RP 10,000 40,000 60,000
CD - - 240,000
CMA 9,977 6,966 2,325
MMDA 159,729 40,265 10,022
Total 980,359 960,046 1,085,991
Restricted deposits as of December 31, 2011 and 2010, and January 1, 2010, are as follows:
(in millions of Korean won)
December 31,
2011
December 31,
2010
January 1,
2010 Description
Time deposits 251,041 189,673 -Pledge for guarantee relating
to Rambus litigation
6. Short-term Financial Instruments and Other Financial Assets
Short-term financial instruments and other financial assets as of December 31, 2011 and 2010, and
January 1, 2010, are as follows:
(in millions of Korean won)
December 31,
2011
December 31,
2010
January 1,
2010
Short-term financial instruments
Time deposits 487,000 646,945 68,380
Specified money trust 40,000 65,000 3,000
RP 60,000 130,000 110,000
CD - - 60,000
MMDA 1,528 2,423 1,232
588,528 844,368 242,612
Other financial assets
Non-current Assets
Time deposits 308 308 308
Bank overdraft guarantee deposits 14 14 14
Derivative assets 3,114 7,695 4,390
3,436 8,017 4,712
591,964 852,385 247,324

Hynix Semiconductor Inc.Notes to Separate Financial StatementsDecember 31, 2011 and 2010, and January 1, 2010
33
Restricted short-term financial instruments and other financial assets as of December 31, 2011 and
2010, and January 1, 2010, are as follows:
(in millions of Koreanwon)
December 31,2011
December 31,2010
January 1,2010 Description
Short-term financial
instruments
1,528 2,423 1,232Restricted for government
grants
- 56,945 58,380Pledged for Rambus
litigation
17,000 - -Restricted for support
small business
18,528 59,368 59,612
Other financial assets308 308 308 Pledged for borrowings
14 14 14Bank overdraft guarantee
deposit
322 322 322
18,850 59,690 59,934
7. Trade and Other receivables
Details of current and non-current loans and other receivables as of December 31, 2011 and 2010,
and January 1, 2010, are as follows:
(in millions of Korean won) December 31, 2011 December 31, 2010 January 1, 2010Current
Other receivables 113,020 123,031 88,362
Accrued income 7,301 16,198 5,853
Short-term loans 106,436 57,449 31,147
Short-term Guarantee deposits - - -
Deposits 80,996 - -
307,753 196,678 125,362
Non-current
Long-term other receivables 23,129 37 111
Long-term loans 1,252 60,877 58,623
Long-term accrued income - 202 -
Guarantee deposits 5,105 3,658 3,267
Other deposits 722 77,734 28,502
30,208 142,508 90,503
337,961 339,186 215,865
The Company has entered into trade receivable discounting agreements for borrowings with several
financial institutions. Outstanding trade receivables discounted but not yet matured amount to
\ 422,213 million as of December 31, 2011.
The Company is obliged to redeem upon default of the counterparties and accordingly, accounted for
the above transactions as collaterized borrowings (Note 19).

Hynix Semiconductor Inc.Notes to Separate Financial StatementsDecember 31, 2011 and 2010, and January 1, 2010
34
Trade receivables, and loans and other receivables, net of provision for impairment, as of December
31, 2011 and 2010, and January 1, 2010, are as follows:
(in millions of Korean won)December 31,
2011
December 31,
2010
January 1,
2010
Trade receivables 1,420,119 1,391,009 1,456,699
Less : provision for impairment (2,233) (1,615) (894)
Trade receivables - net 1,417,886 1,389,394 1,455,805
Current loans and other receivables 312,677 201,465 129,430
Less : provision for impairment (4,924) (4,787) (4,068)
Current other receivables - net 307,753 196,678 125,362
Non-current loans and other
receivables41,500 153,607 118,839
Less : provision for impairment (11,292) (11,099) (28,336)
Non-current other receivables - net 30,208 142,508 90,503
1,755,847 1,728,580 1,671,670
Movements in the provision for impairment of trade receivables for the years ended December 31,
2011 and 2010, are as follows:
(in millions of Korean won) 2011 2010
Beginning 1,615 894
Provision for receivables impairment 618 721
Receivables written off during the year as uncollectible - -
Unused amounts reversed - -
Effect of exchange rates - -
Ending 2,233 1,615
Movements in the provision for impairment of current loans and other receivables for the years ended
December 31, 2011 and 2010, are as follows:
(in millions of Korean won) 2011 2010
Beginning 4,787 4,068
Provision for receivables impairment 137 719
Receivables written off during the year as uncollectible - -
Unused amounts reversed - -
Effect of exchange rates - -
Ending 4,924 4,787
Movements in the provision for impairment of non-current loans and other receivables for the years
ended December 31, 2011 and 2010, are as follows:
(in millions of Korean won) 2011 2010
Beginning 11,099 28,336
Provision for receivables impairment 249 59
Receivables written off during the year as uncollectible - (17,284)
Unused amounts reversed (56) (12)
Ending 11,292 11,099

Hynix Semiconductor Inc.Notes to Separate Financial StatementsDecember 31, 2011 and 2010, and January 1, 2010
35
8. Inventories
Details of inventories as of December 31, 2011 and 2010, and January 1, 2010, are as follows:
(in millions of Korean won) December 31, 2011 December 31, 2010 January 1, 2010
Finished goods 331,139 295,770 227,173
Less: valuation (44,913) (30,214) (26,866)
Finished goods - net 286,226 265,556 200,307
Work in progress 515,525 530,356 495,135
Less : valuation (50,292) (21,843) (19,965)
Work in progress - net 465,233 508,513 475,170
Raw materials 95,291 89,307 73,819
Less : valuation (620) (659) (551)
Raw materials - net 94,671 88,648 73,268
Supplies 15,111 13,884 8,352
Less : valuation - - -
Supplies - net 15,111 13,884 8,352
Goods in transit 68,145 49,963 26,646
Less : valuation (495) (108) (2)
Goods in transit - net 67,650 49,855 26,644
928,891 926,456 783,741
For the year ended December 31, 2011, \ 43,496 million of inventory valuation allowance was
recognized as ‘cost of sales’ (2010: \ 5,440 million).
For the year ended December 31, 2011, the cost of inventories recognized as expense and included
in ‘cost of sales’ amounted to \ 8,388,114 million (2010: \ 7,482,832 million).
9. Other Current and Non-current Assets
Details of other current and non-current assets as of December 31, 2011 and 2010, and January 1,
2010, are as follows:
(in millions of Korean won) December 31, 2011 December 31, 2010 January 1, 2010
Current Assets
Advance payments 3,211 1,796 5,556
Prepaid expenses 65,707 79,510 84,661
Others 14,854 14,655 14,653
83,772 95,961 104,870
Non-current Assets
Long-term prepaid expenses 132,890 84,239 92,017
Others 21,429 35,034 49,688
154,319 119,273 141,705
238,091 215,234 246,575

Hynix Semiconductor Inc.Notes to Separate Financial StatementsDecember 31, 2011 and 2010, and January 1, 2010
36
10. Available-for-sale Financial Assets
Available-for-sale financial assets as of December 31, 2011 and 2010, and January 1, 2010, are as
follows:
(in millions of Korean won)
December 31, 2011December 31,
2010January 1,
2010
Number ofStock
Ownership(%)
Acquisitioncost
Bookvalue Book value Book value
Hyundai InformationTechnology Co., Ltd.
1,160,180 2.30 3,481 2,593 4,583 1,079
Hyundai Logiem Co., Ltd. 15,115 0.08 76 98 98 98
EQ bestech Co.,Ltd. 2,000 1.67 10 10 10 10
Novelis Korea Ltd. 63,600 0.14 1,699 1,699 1,699 1,699
Itest Co., Ltd. 481,780 1.04 1,166 1,604 1,166 1,166
Hyundai IT Corp. 2,528 0.03 63 3 11 18
Fidelix Co., Ltd. 1,605,854 8.79 3,560 3,099 2,473 3,236
Futures Corp TechnologyCo., Ltd.
60,000 10.44 300 - - 300
C&S Technology Co., Ltd. 1,031,590 3.91 4,508 4,395 6,138 3,817
ZMOS Technology 2,000,000 5.11 995 - - 995
Phison Electronics Corp. 3,277,054 1.83 11,661 22,804 20,875 27,007
Anobit Technologies Ltd. 204,248 2.80 3,123 3,123 3,123 3,123
ProMos 201,600,000 7.93 21,847 - 10,299 13,919
JNT Frontier PrivateEquity Unit
Certificate - 700 700 - -
SV M&A No.1 Equity Unit Certificate - 715 715 - -
Daishin Aju IB InvestmentCo., Ltd.
Certificate - 172 172 - -
Intellectual Discovery, Ltd. 800,000 11.41 4,000 4,000 - -
Seoul Investment Early &Green Venture Fund
Certificate - 950 950 - -
TS 2011-4 TechnologyTransfer & BusinessBuildup Fund
Certificate - 800 800 - -
IMM Investment Certificate - 240 240 - -
SL Investment Certificate - 320 320 - -
Others - - 2,567 2 2 2
62,953 47,327 50,477 56,469
Changes in the book value of available-for-sale securities for the years ended December 31, 2011
and 2010, are as follows:
(in millions of Korean won) 2011 2010
At January 1 50,477 56,469
Acquisitions 11,163 9,558
Changes in the unrealized gain or loss1
(748) (14,255)
Impairment loss (13,565) (1,295)
At December 31 47,327 50,477

Hynix Semiconductor Inc.Notes to Separate Financial StatementsDecember 31, 2011 and 2010, and January 1, 2010
37
1Net of income tax effect of \ 371 million (2010: \ 1,297 million).
Changes in accumulated impairment loss on available-for-sale securities for the years ended
December 31, 2011 and 2010, are as follows:
(in millions of Korean won) 2011 2010
At January 1 (15,883) (14,588)
Write-off 8,747 -
Impairment loss (21,847) (1,295)
At December 31 (28,983) (15,883)
The Company transferred \ 8,282 million (2010: nil) of losses on available-for-sale financial assets
from other comprehensive income to the current operations due to impairment.
11. Investments in Subsidiaries, Associates and Jointly Controlled Entities
Details of investments in associates and jointly controlled entities as of December 31, 2011 and 2010,
and January 1, 2010, are as follows:
(in millions of Korean won) December 31, 2011December31, 2010
January1, 2010
Type InvesteeNumber of
Stock
Owner-ship(%)
Acquisitioncost
Netassetvalue
Bookvalue
Bookvalue
Bookvalue
AssociateSiliconfile
TechnologiesInc.1
2,358,832 29.69 22,835 7,161 8,138 18,775 18,775
Jointlycontrolled
entity
HITECHSemiconductor(Wuxi) Co.,Ltd.
(HITECH)
Certificate 45.00 90,149 97,385 92,608 80,427 80,427
112,984 104,54 100,746 99,202 99,202
1As of December 31, 2011, fair value on the active market amounted to \ 8,138 million (2010:
\ 5,921 million).
Changes in investments in associates and jointly controlled entities for the years ended December 31,
2011 and 2010, are as follows:
2011
(in millions of Korean won)Siliconfile
Technologies Inc. HITECH
At January 1 18,775 80,427
Acquisition - 12,181
Impairment loss (10,637) -
At December 31 8,138 92,608

Hynix Semiconductor Inc.Notes to Separate Financial StatementsDecember 31, 2011 and 2010, and January 1, 2010
38
2010
(in millions of Korean won)Siliconfile
Technologies Inc. HITECH
At January 1 18,775 80,427
Acquisition - -
Impairment loss - -
At December 31 18,775 80,427
Details of investments in the Company’s subsidiaries as of December 31, 2011 and 2010, and
January 1, 2010, are as follows:
Names of subsidiaries
Loca-
tions
Number of
Shares
Percentage of
Ownership(%)
Book Value
December31, 2011
December31, 2010
January1, 2010
Hynix Engineering Co., Ltd. Korea 671,932 99.65 15,074 15,074 28,890
Hystech Co., Ltd. Korea 236,408 99.65 5,127 5,127 5,127
Ami Power Co., Ltd. Korea 524,852 99.65 13,816 13,816 -
Hynix HRD Co., Ltd. Korea 59,102 99.65 1,169 1,169 1,169
Hylogitech Co., Ltd. Korea 39,401 99.65 431 431 431
Hyundai Display TechnologyCo, Ltd.(Hydis)1 - - - - 13,254 13,254
Hynix Semiconductor America Inc.(HSA)
U.S.A 6,286,000 97.74 31 31 31
Hynix SemiconductorManufacturing America Inc(HSMA) 2
U.S.A 100,000 0.05 - - -
Hynix Semiconductor EuropeHolding Ltd (HSE)
U.K. 335,640,000 100.00 1,811 1,811 1,811
Hynix Semiconductor DeutschlandGmbH (HSD)
Germany Certificate 100.00 22,011 22,011 22,011
Hynix Semiconductor Asia Pte.Ltd. (HSS)
Singapore 196,303,500 100.00 52,380 52,380 52,380
Hynix Semiconductor IndianSubcontinent Private Ltd (HSIS) 3 India 10,000 1.00 5 - -
Hynix Semiconductor Hong KongLtd (HSH)
Hongkong 170,693,661 100.00 32,624 32,624 32,624
Hynix Semiconductor (Shanghai)Co., Ltd (HSCS)
China Certificate 100.00 4,032 4,032 4,032
Hynix Semiconductor Japan Inc(HSJ)
Japan 20,000 100.00 42,905 42,905 42,905
Hynix Semiconductor Taiwan Inc(HST)
Taiwan 35,725,000 100.00 37,562 37,562 37,562
Hynix Semiconductor China Ltd.(HSCL)
China Certificate 90.26 2,421,631 2,421,391 1,615,385
Hynix Semiconductor (Wuxi) Ltd.(HSMC)
China Certificate 100.00 238,271 238,271 498,902
Hynix (Wuxi) Semiconductor SalesLtd. (HSCW)
China Certificate 100.00 237 237 -
2,889,117 2,902,126 2,356,514
1Liquidation of Hyundai Display Technology Co., Ltd. was completed during the year 2011.
2Subsidiary of Hynix Semiconductor America Inc. (HSA).
3Subsidiary of Hynix Semiconductor Asia Pte. Ltd. (HSS).

Hynix Semiconductor Inc.Notes to Separate Financial StatementsDecember 31, 2011 and 2010, and January 1, 2010
39
Changes in investments in subsidiaries for the years ended December 31, 2011 and 2010, are as
follows:
(in millions of Korean won) 2011 2010
At January 1 2,902,126 2,356,514
Addition 245 806,243
Liquidation (13,254) -
Capital reduction - (260,631)
At December 31 2,889,117 2,902,126
12. Credit Risk of Financial Instruments
The aging analysis of trade receivables, loans and other receivables as of December 31, 2011 and
2010, and January 1, 2010 are as follows:
December 31, 2011
(in millions of Korean won) Not past due Impaired Total
Trade receivables 1,419,234 885 1,420,119
Current loans and other receivables 308,180 4,497 312,677
Non-current loans and other receivables 30,491 11,009 41,500
1,757,905 16,391 1,774,296
December 31, 2010
(in millions of Korean won) Not past due Impaired Total
Trade receivables 1,390,124 885 1,391,009
Current loans and other receivables 196,944 4,521 201,465
Non-current loans and other receivables 142,598 11,009 153,607
1,729,666 16,415 1,746,081
January 1, 2010
(in millions of Korean won) Not past due Impaired Total
Trade receivables 1,456,432 267 1,456,699
Current loans and other receivables 125,561 3,869 129,430
Non-current loans and other receivables 90,535 28,304 118,839
1,672,528 32,440 1,704,968
The maximum exposure to credit risk at the reporting date is the carrying value of each class of
receivable mentioned above.
As of December 31, 2011, maximum exposure of credit risk relating guarantees provided by the
Company is \ 15,807 million (December 31, 2010: \ 60,047 million) which will be paid upon request
of warrantee as mentioned in Note 37.
The Company has an export sales insurance contract with Korea Trade Insurance Corporation and
holds the counterparty’s collateral as security.

Hynix Semiconductor Inc.Notes to Separate Financial StatementsDecember 31, 2011 and 2010, and January 1, 2010
40
13. Financial Instruments by Categories
Details of financial assets by category as of December 31, 2011 and 2010, and January 1, 2010, are
as follows:
(in millions of Korean won)
December 31, 2011
Assets at fairvalue through theprofit and loss
Available-for-sale financial
assetsLoans andreceivables Total
Cash and cash equivalents - - 980,359 980,359Short-term financialinstruments - - 588,528 588,528
Other financial assets 3,114 - 322 3,436
Trade receivables - - 1,417,886 1,417,886
Other receivables - - 337,961 337,961
Available-for-sale financialassets
- 47,327 - 47,327
3,114 47,327 3,325,056 3,375,497
December 31, 2010
(in millions of Korean won)
Assets at fairvalue through the
profit and loss
Available-for-sale financial
assetsLoans andreceivables Total
Cash and cash equivalents- -
960,046 960,046Short-term financialinstruments - - 844,368 844,368
Other financial assets 7,695 - 322 8,017
Trade receivables - - 1,389,394 1,389,394
Other receivables - - 339,186 339,186
Available-for-sale financialassets
- 50,477 - 50,477
7,695 50,477 3,533,316 3,591,488
January 1, 2010
(in millions of Korean won)
Assets at fairvalue through the
profit and loss
Available-for-sale financial
assetsLoans andreceivables Total
Cash and cash equivalents - - 1,085,991 1,085,991Short-term financialinstruments - - 242,612 242,612
Other financial assets 4,390 - 322 4,712
Trade receivables - - 1,455,805 1,455,805
Other receivables - - 215,865 215,865
Available-for-sale financialassets
- 56,469 - 56,469
4,390 56,469 3,000,595 3,061,454

Hynix Semiconductor Inc.Notes to Separate Financial StatementsDecember 31, 2011 and 2010, and January 1, 2010
41
Details of financial liabilities by category as of December 31, 2011 and 2010, and January 1, 2010,
are as follows:
(in millions of Korean won)
December 31, 2011
Liabilities at fair valuethrough the profit and loss
Liabilities measuredat amortized cost
Total
Trade payables - 840,146 840,146
Other payables - 489,684 489,684
Other non-trade payables - 391,012 391,012
Borrowings - 5,473,986 5,473,986
Other financial liabilities 42,111 - 42,111
42,111 7,194,828 7,236,939
(in millions of Korean won)
December 31, 2010
Liabilities at fair valuethrough the profit and loss
Liabilities measuredat amortized cost
Total
Trade payables - 868,338 868,338
Other payables - 693,626 693,626
Other non-trade payables - 653,465 653,465
Borrowings - 4,583,771 4,583,771
Other financial liabilities 96,987 - 96,987
96,987 6,799,200 6,896,187
(in millions of Korean won)
January 1, 2010
Liabilities at fair valuethrough the profit and loss
Liabilities measuredat amortized cost
Total
Trade payables - 943,395 943,395
Other payables - 459,304 459,304
Other non-trade payables - 407,410 407,410
Borrowings - 5,444,328 5,444,328
Other financial liabilities 96,054 - 96,054
96,054 7,254,437 7,350,491

Hynix Semiconductor Inc.Notes to Separate Financial StatementsDecember 31, 2011 and 2010, and January 1, 2010
42
Details of gain and loss of financial assets and liabilites by category for the years ended December 31,
2011 and 2010, are as follows:
(in millions of Korean won) 2011 2010
Loans and receivablesInterest income 55,617 69,552
Foreign exchange difference 10,128 (11,417)Impairment loss (948) (1,487)
64,797 56,648Available-for-saleOther comprehensive income(Loss) 7,535 (14,255)Gain or loss on disposal - 441Interest income 785 -Dividend income 44 687Impairment (21,847) (1,295)
(13,483) (14,422)Assets at fair value through
the profit and lossGain(loss) on valuation of derivatives (4,581) 3,305Gain on derivative transactions - -
(4,581) 3,305Liabilities measured at amortized cost
Interest expense (271,753) (299,813)Loss on redemption of debenture - (27,266)Foreign exchange difference (59,305) 74,778
(331,058) (252,301)Liabilities at fair value
through the profit and lossGain(loss) on valuation of derivatives 12,451 58,760Gain on derivative transactions 10,057 (155)
22,508 58,605(261,817) (148,165)

Hynix Semiconductor Inc.Notes to Separate Financial StatementsDecember 31, 2011 and 2010, and January 1, 2010
43
14. Property, Plant and Equipment
Details of changes in property, plant and equipment for the years ended December 31, 2011 and
2010, are as follows:
2011
(in millions of Korean won) Land Buildings Structures Machinery Vehicles Others CIP Total
At January 1
Acquisition Cost 441,033 1,333,609 329,788 15,837,519 1,145 481,574 500,234 18,924,902
Accumulated depreciation - (308,232) (223,131) (10,449,232) (846) (354,353) - (11,335,794)
Accumulated impairment - (23,877) (19,105) (257,323) - (2,387) - (302,692)
Government grants - - - (9,019) - - - (9,019)
Net book amount 441,033 1,001,500 87,552 5,121,945 299 124,834 500,234 7,277,397
Changes during 2011
Additions - 71 2 23,463 9 1,731 2,619,783 2,645,059
Disposals - (189) - (3,960) - (64) (7,057) (11,270)
Impairment loss - - - (14,230) - - - (14,230)
Depreciation charge - (36,025) (15,973) (1,907,944) (96) (51,334) - (2,011,372)
Transfers - 31,069 13,752 2,587,146 1 63,441 (2,678,340) 17,069
Closing net bookamount
441,033 996,426 85,333 5,806,420 213 138,608 434,620 7,902,653
At December 31
Acquisition Cost 441,033 1,364,443 343,542 18,540,716 1,125 520,956 434,620 21,646,435
Accumulated depreciation - (344,140) (239,104) (12,431,423) (912) (380,011) - (13,395,590)
Accumulated impairment - (23,877) (19,105) (294,597) - (2,337) - (339,916)
Government grants - - - (8,276) - - - (8,276)
Net book amount 441,033 996,426 85,333 5,806,420 213 138,608 434,620 7,902,653

Hynix Semiconductor Inc.Notes to Separate Financial StatementsDecember 31, 2011 and 2010, and January 1, 2010
44
Depreciation expense of \ 1,789,888 million (2010: \ 1,561,558 million) has been charged to ‘cost
of sales’, \ 190,832 million (2010: \ 229,438 million) to ‘selling, administration and ordinary
development expenses’ and \ 30,652 million (2010: \ 5,141 million) has been capitalized as
development cost for the year ended December 31, 2011.
Certain amount of the property, plant and equipment are pledged as collateral for borrowings of the
Company as of December 31, 2011 (Note 37).
During the year, the Company has capitalized borrowing costs amounting to \ 31,574 million (2010:
\ 24,325 million) on qualifying assets. Borrowing costs were capitalized at the weighted average rate
of its general borrowings of 6.50% (2010: 6.75%) for the year ended December 31, 2011.
The Company leases certain machinery and others from HP Financial Service Co., Ltd. under sale
and leaseback agreements in a form of finance lease. The Company also leases certain machinery
and others from GE Capital under finance lease agreements.
In addition, Hynix Semiconductor (Wuxi) Ltd. (HSMC) sold its machinery and equipment to HITECH
Semiconductor (Wuxi) Co., Ltd., a joint venture of the Company and Taiji Industry Ltd. The Company
recorded those assets as finance lease.
The book value of the machinery and others subject to finance lease agreement, amounted to
\ 337,535 million (December 31, 2010: \ 289,038 million) as of December 31, 2011. The machinery
2010
(in millions ofKorean won)
Land Buildings Structures Machinery Vehicles Others CIP Total
At January 1
Acquisition Cost 441,033 1,300,724 447,605 15,199,305 933 449,363 132,660 17,971,623
Accumulateddepreciation
- (274,215) (288,426) (10,251,338) (803) (319,647) - (11,134,429)
Accumulatedimpairment
- (23,877) (59,337) (272,225) - (3,659) - (359,098)
Governmentgrants
- - - (9,762) - - - (9,762)
Net book amount 441,033 1,002,632 99,842 4,665,980 130 126,057 132,660 6,468,334
Changes during2010
Additions - 184 93 - 154 - 2,603,793 2,604,224
Disposals - (3,699) (1,212) (8,199) - (252) - (13,362)
Depreciationcharge
- (35,089) (15,948) (1,691,670) (94) (53,336) - (1,796,137)
Transfers - 37,472 4,777 2,155,834 109 52,365 (2,236,219) 14,338
Closing net bookamount
441,033 1,001,500 87,552 5,121,945 299 124,834 500,234 7,277,397
At December 31
Acquisition Cost 441,033 1,333,609 329,788 15,837,519 1,145 481,574 500,234 18,924,902
Accumulateddepreciation
- (308,233) (223,131) (10,449,232) (846) (354,353) - (11,335,795)
Accumulatedimpairment
- (23,876) (19,105) (257,323) - (2,387) - (302,691)
Governmentgrants
- - - (9,019) - - - (9,019)
Net book amount 441,033 1,001,500 87,552 5,121,945 299 124,834 500,234 7,277,397

Hynix Semiconductor Inc.Notes to Separate Financial StatementsDecember 31, 2011 and 2010, and January 1, 2010
45
are pledged as collateral for the finance lease liabilities.
The Company leases certain machinery and others from GE Capital and Macquarie Capital under
operating lease agreements. The payment schedule of minimum lease payments under operating
lease as of December 31, 2011, is as follows:
(in millions of Korean won) Total lease payment
No later than 1 year 23,911
Later than 1 year 14,069
37,980
As of December 31, 2011, certain inventories, property, plant and equipment, and investment
properties are insured and details of insurance assets are as follows:
(in millions of Korean won) Insured assetsInsuredamount
Insurancecompany
Package insurance Property, plant and equipment, 21,606,872Hyundai Marine &
Fire Insurance Co.,
Ltd. and other
Inventories and other
Fire Insurance Property, plant and equipment,
investment property
6,036
21,612,908
The insurance policies of the Company have been provided to the Korea Exchange Bank and other
creditors as collaterals for borrowings as of December 31, 2011.
15. Investment Property
Details of changes in investment property during the years ended December 31, 2011 and 2010, are
as follows:
2011
(in millions of Korean won) Land Buildings Structures Total
At January 1
Acquisition Cost 3,439 55,195 2,571 61,205
Accumulated depreciation - (17,700) (1,793) (19,493)
Accumulated impairment - (3,748) (778) (4,526)
Net book amount 3,439 33,747 - 37,186
Changes during 2011
Disposals (3,439) (1,266) - (4,705)
Depreciation charge - (1,313) - (1,313)
Closing net book amount - 31,168 - 31,168
At December 31
Acquisition Cost - 48,390 - 48,390
Accumulated depreciation - (17,222) - (17,222)
Accumulated impairment - - - -
Net book amount - 31,168 - 31,168

Hynix Semiconductor Inc.Notes to Separate Financial StatementsDecember 31, 2011 and 2010, and January 1, 2010
46
2010
(in millions of Korean won) Land Buildings Structures Total
At January 1
Acquisition Cost 3,439 55,195 2,571 61,205
Accumulated depreciation - (16,384) (1,793) (18,177)
Accumulated impairment - (3,748) (778) (4,526)
Net book amount 3,439 35,063 - 38,502
Changes during 2010
Depreciation charge - (1,316) - (1,316)
Closing net book amount 3,439 33,747 - 37,186
At December 31
Acquisition Cost 3,439 55,195 2,571 61,205
Accumulated depreciation - (17,700) (1,793) (19,493)
Accumulated impairment - (3,748) (778) (4,526)
Net book amount 3,439 33,747 - 37,186
The depreciation expense of \ 1,313 million (2010: \ 1,316 million) has been charged in the
statement of comprehensive income for the year ended December 31, 2011.
Rental income from investment property during the year ended December 31, 2011, is \ 4,859
million (2010: \ 4,759 million).
16. Intangible Assets
Intangible assets as of December 31, 2011 and 2010, are as follows:
2011
(in millions of Koreanwon) Goodwill
Industrialproperty rights
Developmentcosts Others Total
At January 1
Acquisition Cost 386,450 185,541 120,503 14,120 706,614Accumulated amortizationand impairment
- (100,762) (3,514) (350) (104,626)
Net book amount 386,450 84,779 116,989 13,770 601,988
Changes during 2011
Additions - 20,645 154,592 5 175,242
Disposals - (5,738) - - (5,738)
Impairment charge - - - (728) (728)
Amortization charge - (15,286) (49,671) - (64,957)
Closing net bookamount
386,450 84,400 221,910 13,047 705,807
At December 31
Acquisition Cost 386,450 187,565 275,095 14,124 863,234Accumulated amortizationand impairment
- (103,165) (53,185) (1,077) (157,427)
Net book amount 386,450 84,400 221,910 13,047 705,807

Hynix Semiconductor Inc.Notes to Separate Financial StatementsDecember 31, 2011 and 2010, and January 1, 2010
47
2010(in millions of Koreanwon) Goodwill
Industrialproperty rights
Developmentcosts Others Total
At January 1
Acquisition Cost 386,450 168,405 - 11,472 566,327Accumulated amortizationand impairment
- (93,362) - - (93,362)
Net book amount 386,450 75,043 - 11,472 472,965
Changes during 2010
Additions - 28,064 120,503 2,648 151,215
Disposals - (3,406) - - (3,406)
Impairment charge - - - (350) (350)
Amortization charge - (14,922) (3,514) - (18,436)
Closing net bookamount
386,450 84,779 116,989 13,770 601,988
At December 31
Acquisition Cost 386,450 185,541 120,503 14,120 706,614Accumulated amortizationand impairment
- (100,762) (3,514) (350) (104,626)
Net book amount 386,450 84,779 116,989 13,770 601,988
Amortization of \ 64,957 million (2010: \ 18,436 million) is recorded as ‘selling, administration and
ordinary development expenses’ in the statement of comprehensive income for the year ended
December 31, 2011.
Among costs associated with research and development activities, \ 154,592 million (2010:
\ 120,503 million), that were directly attributable and met capitalization criteria, were capitalized as
development cost for the year ended December 31, 2011. However, other development expenditures
that did not meet the criteria amounted to \ 857,849 million (2010: \ 804,511 million) and were
recognized as an expense as incurred in the statement of comprehensive income for the year ended
December 31, 2011.
The Company allocates goodwill into the semiconductor operating segment. The Company used the
same goodwill allocation method for both years ended December 31, 2011 and 2010. Goodwill
impairment reviews are undertaken annually. Impairment test suggests that the carrying value of cash
generating units does not exceed the recoverable amount. The recoverable amounts of cash
generating units have been determined based on the net realizable value, which exceeds the value in
use. The value in use calculations use pre-tax cash flow projections based on financial budgets
approved by management covering a four-year period.

Hynix Semiconductor Inc.Notes to Separate Financial StatementsDecember 31, 2011 and 2010, and January 1, 2010
48
17. Non-current assets held for sale
Details of changes in non-current assets held for sale during the years ended December 31, 2011 and
2010, are as follows:
(in millions of Korean won) 2011 2010
At January 1 24,449 86,566
Transfer1
(17,068) (14,338)
Disposal (7,376) (40,389)
Impairment - (7,390)
At December 31 5 24,449
1Non-current assets held for sale were transferred to the property, plant and equipment as these
assets were no longer held for sale as of December 31, 2011.
18. Other Non-trade Payables
Details of other non-trade payables as of December 31, 2011 and 2010, and January 1, 2010, are as
follows:
(in millions of Korean won) December 31, 2011 December 31, 2010 January 1, 2010
Current
Accrued expense 320,395 456,164 216,447
320,395 456,164 216,447
Non-current
Long-term other payables 62,964 120,820 184,738
Long-term accrued expense 6,073 74,664 3,503
Rent deposit payables 1,580 1,817 2,722
70,617 197,301 190,963
391,012 653,465 407,410
19. Borrowings
Details of borrowings as of December 31, 2011 and 2010, and January 1, 2010, are as follows:
(in millions of Korean won) December 31, 2011 December 31, 2010 January 1, 2010
Current
Short-term borrowings 1,318,410 348,609 1,429,741
Current maturities of debentures 299,844 549,619 69,898Current maturities of convertiblebonds
40,418 491,329 645,247
Current maturities of long-termborrowings
685,220 609,977 558,202
2,343,892 1,999,534 2,703,088
Non-current
Long-term borrowings 666,879 879,531 805,654
Debentures 1,489,999 1,186,628 1,453,375
Convertible bonds 973,216 518,078 482,211
3,130,094 2,584,237 2,741,240
5,473,986 4,583,771 5,444,328

Hynix Semiconductor Inc.Notes to Separate Financial StatementsDecember 31, 2011 and 2010, and January 1, 2010
49
Details of short-term borrowings as of December 31, 2011 and 2010, and January 1, 2010, consist of:
(in millions of Korean won)Financial
Institutions
AnnualInterest Rate(%)
at 2011December 31,
2011December 31,
2010January 1,
2010
Usance borrowingsKorea
DevelopmentBank and other
0.66 ~ 3.63 873,131 271,693 579,541
Borrowings on importfinancing
Export ImportBank of Korea
3M Libor + 2.40 23,066 68,334 70,056
Borrowings onTrade receivablescollateral
Shinhan Bankand other
3M Libor +1.20~3.30
422,213 - 471,562
Syndicated LoansKorea
DeveolopmentBank and other
- - - 300,000
Other Hydis - - 8,582 8,582
1,318,410 348,609 1,429,741
Details of long-term borrowings as of December 31, 2011 and 2010, and January 1, 2010, consist of:
(in millions of Koreanwon)
FinancialInstitutions
AnnualInterest Rate(%)
at 2011December 31,
2011December 31,
2010January 1,
2010
Local currency loans
Borrowing for housing Kookmin Bank 5.2 38 46 52
Funds for equipment Kookmin Bank CD(91days)+2.00 12,857 38,571 90,000
Borrowings forchildcare facilities
NH Bank 2.0 308 308 308
Funds for equipmentKorea Finance
CorporationIndustrial Financial
Debentures(1year)+1.6150,000 200,000 -
Finance lease liabilitiesMacquarie CapitalKorea Co.,Ltd.
5.00 140,086 - -
Finance lease liabilitiesHP Financial
Services Co., Ltd.5.80 ~ 6.49 1,390 5,898 19,907
304,679 244,823 110,267
Foreign currencyloans
General borrowingsExport Import
Korea Bank- - 203,104 242,666
General borrowings NH Bank 3M Libor + 0.69 38,412 75,893 116,760
General borrowings1 SC First Bank 3M Libor + 3.00~3.90 168,382 56,945 -
General borrowings Hana Bank 3M Libor + 3.10 51,899 - -
General borrowingsKorea DevelopmentBank
3M Libor + 3.24 115,330 - -
Syndicated loansKorea Exchange
Bank and other3M Libor + 1.90 345,990 478,338 630,504
Mortgage loans HITECH 7.90 ~ 15.73 193,471 239,109 -
Finance lease liabilities HITECH, GE Capital 5.18 ~ 15.34 171,260 248,946 267,412
1,084,744 1,302,335 1,257,342
Less: Discount on present value (37,324) (57,650) (3,753)
Current maturities (685,220) (609,977) (558,202)
Long-term borrowings 666,879 879,531 805,654
1The Company entered into interest swap contracts with SC First Bank for the interest on the foreign
currency loans.

Hynix Semiconductor Inc.Notes to Separate Financial StatementsDecember 31, 2011 and 2010, and January 1, 2010
50
Details of debentures as of December 31, 2011 and 2010, and January 1, 2010, are as follows:
(in millions of Korean won)Maturity
Date
AnnualInterest Rate(%)
At 2011December31, 2011
December31, 2010
January1, 2010
Unsecured notes in localcurrency:
202nd1 May 25, 2012 5.70 150,000 150,000 150,000
203rd Sep. 5, 2012 6.19 150,000 150,000 150,000
204th Dec. 20. 2010 - - - 70,000
205th Feb. 15, 2011 - - 150,000 150,000
206th May 15, 2011 - - 200,000 200,000
208th Oct. 6, 2011 - - 200,000 200,000
209th Sep. 9, 2013 6.35 300,000 300,000 -
210th Jan. 14, 2015 6.35 200,000 - -
211th May 6, 2016 6.20 400,000 - -
Unsecured notes in foreignCurrency
Foreign 5th2 June 27, 2017 7.88 576,650 569,450 583,800
1,776,650 1,719,450 1,503,800
Add: Adjust embeddedderivatives2 20,426 23,060 26,397
Less: Discount on debentures (7,233) (6,263) (6,924)
Current maturities (299,844) (549,619) (69,898)
Debentures 1,489,999 1,186,628 1,453,375
1The Company entered into interest swap contracts with Korea Exchange Bank, Korea Development
Bank and Woori Bank for the principal and interest of the local currency loans.
2Compound financial instruments in which callable options (early settlement options) are accounted
for as embedded derivatives.
Details of convertible bonds as of December 31, 2011 and 2010, and January 1, 2010, are as follows:
(in millions of Korean won)Maturity
Date
AnnualInterestRate(%)at 2011
December31, 2011
December31, 2010
January1, 2010
Convertible bondin local currency
207th Sep.05, 2013 3.00 440,741 484,964 499,786
Convertible bondin foreign currency
Foreign 6th Dec.14, 2012 4.50 41,173 40,659 681,178
Foreign 7th May 14, 2015 2.65 576,650 569,450 -
1,058,564 1,095,073 1,180,964
Add: Call premium on bonds 70,991 78,114 80,502
Less: Conversion rightsadjustment
(107,473) (151,941) (123,965)
Discount on bonds (8,448) (11,839) (10,043)
Current maturities (40,418) (491,329) (645,247)
Convertible bonds 973,216 518,078 482,211

Hynix Semiconductor Inc.Notes to Separate Financial StatementsDecember 31, 2011 and 2010, and January 1, 2010
51
Details of terms and conditions of conversion rights of convertible bonds as of December 31, 2011,
are as follows:
Details
Local 207th Foreign 6th Foreign 7th
Face value of convertible bond KRW 440,741,000,000 USD 35,700,000 USD 500,000,000
Convertible rate at face value 100% 100% 100%
Conversion term(Per share) Par value of ₩23,328Par value of ₩ 35,862
(KRW 919.9/USD)
Par value of ₩ 34,394
(KRW 1,133.8/USD)
Number of convertible shares 18,893,000 shares 916,000 shares 16,483,000 shares
Convertible periods Oct.5,2008~Aug.5,2013 Dec.15,2008~Nov.29,2012 May 15,2011~Apr.28,2015
Deemed exercise dateThe first date of year of
conversionThe first date of year of
conversionThe first date of year of
conversion
Finance lease liability
Lease liabilities are effectively secured as the rights to the leased asset revert to the lessor in the
event of default.
Details of minimum lease payments to the lessor as of December 31, 2011 and 2010, are as follows:
(in millions of Korean won) December 31, 2011 December 31, 2010
Total minimum lease payment
No later than 1 year 84,726 129,287
Between 1 and 5 years 284,027 176,373
Later than 5 years - -
368,753 305,660
Unearned finance income (56,017) (50,816)
Net minimum lease payment
No later than 1 year 59,889 106,306
Between 1 and 5 years 252,847 148,538
Later than 5 years - -
312,736 254,844
Details of book value and fair value of non-current borrowings as of December 31, 2011 and 2010, are
as follows:
(in millions of Korean won) 2011 2010
Book value Fair value Book value Fair value
Long-term borrowings 666,879 666,879 879,531 879,531
Debentures 1,489,999 1,534,502 1,186,628 1,182,078
Convertible bond 973,216 1,054,442 518,078 580,985
Total 3,130,094 3,255,823 2,584,237 2,642,594

Hynix Semiconductor Inc.Notes to Separate Financial StatementsDecember 31, 2011 and 2010, and January 1, 2010
52
20.Provisions
Details of changes in provisions during the years ended December 31, 2011 and 2010, are as follows:
2011
(in millions of Koreanwon)
Purchasecommitments Sales returns Legal claims Total
At January 1 4,074 13,369 517,847 535,290
Addition 91,293 - 52,584 143,877
Reversal and utilization - (8,701) (293,743) (302,444)Foreign exchangedifference and other
- - 72,973 72,973
At December 31 95,367 4,668 349,661 449,696
2010
(in millions of Koreanwon)
Purchasecommitments Sales returns Legal claims Total
At January 1 409 11,346 634,550 646,305
Addition 3,665 2,023 40,291 45,979
Reversal and utilization - - (108,899) (108,899)Foreign exchangedifference and other
- - (48,095) (48,095)
At December 31 4,074 13,369 517,847 535,290
Provisions for sales returns
The Company estimates the expected sales returns based on historical results, and adjusts sales and
cost of sales, respectively. Accordingly, related gross profit and estimated expenses are recorded as
provisions for sales returns.
Provisions for legal claims
The Company recognizes provisions for legal claims when the Company has a present legal or
constructive obligation as a result of past events and an outflow of resources required to settle the
obligation is probable and the amount can be reliably estimated (Note 37).
Accrual for loss on purchase commitment
The Company is committed to purchase wafers from its overseas subsidiary, Hynix Semiconductor
China Ltd. (HSCL). For the finished goods and work-in-process which will be purchased from the
subsidiary, the Company records provisions for expected losses if the total manufacturing costs are
expected to be greater than the sale price of finished products at the reporting date.
The Company and its domestic subsidiaries, Hynix Engineering and Ami Power, entered into
agreements under which Ami Power provides steam and electricity (“Energy”) to the Company. In
November 2011, Ami Power received notice of the cancellation of a contract related the purchase of
Energy from the Company. Accordingly, Ami Power is scheduled to dispose of the related facility and
will be liquidated. In connection with the onerous contract, the Company charged \ 30,530 million of

Hynix Semiconductor Inc.Notes to Separate Financial StatementsDecember 31, 2011 and 2010, and January 1, 2010
53
indemnity for expected losses and recorded as provision.
21. Other Financial Liabilities
Details of other financial liabilities as of December 31, 2011 and 2010, and January 1, 2010, are as
follows:
(in millions of Korean won)December 31,
2011December 31,
2010January 1,
2010
Current
Derivative liabilities (Note 38) 34,315 42,426 33,164
Non-current
Derivative liabilities (Note 38) 7,796 54,561 62,890
42,111 96,987 96,054
22. Other Current and Non-current Liabilities
Details of other current and non-current liabilities as of December 31, 2011 and 2010, and January 1,
2010, are as follows:
(in millions of Korean won)December 31,
2011December 31,
2010January 1,
2010
Current
Unearned income 2,509 2,928 5,173
Withholdings 15,335 13,613 19,756
Deposits received 512 - -
Advance receipts 499 6,084 267,179
Other - - -
18,855 22,625 292,108
Non-current
Long-term withholdings 4,133 3,789 3,693
Other long-term employee benefit liabilities 32,796 25,837 23,722
36,929 29,626 27,415
55,784 52,251 319,523
23. Defined Benefit Liabilities
Defined benefit liabilities recognized in the statements of financial position as of December 31, 2011
and 2010, and January 1, 2010, are determined as follows:
(in millions of Korean won)December 31,
2011December 31,
2010January 1,
2010
Present value of obligations 453,865 359,381 282,379
Fair value of plan assets1
(5,435) (5,895) (6,495)
Liability in the statement of financial position 448,430 353,486 275,884
1Includes deposits to the National Pension Fund in accordance with the National Pension Law
amounting to \ 2,151 million (2010: \ 2,371 million).

Hynix Semiconductor Inc.Notes to Separate Financial StatementsDecember 31, 2011 and 2010, and January 1, 2010
54
The amounts recognized in the statements of comprehensive income for the years ended December
31, 2011 and 2010, are as follows:
(in millions of Korean won) 2011 2010
Current service cost 61,641 48,784
Interest expenses 24,117 20,797
Expected return on plan assets (166) (211)
85,592 69,370
The line items, in which severance benefits are included for the years ended December 31, 2011 and
2010, are as follows:(in millions of Korean won) 2011 2010
Cost of sales (manufacturing costs) 51,396 41,979
Selling, administrative and ordinary development expenses 34,196 27,39185,592 69,370
The actuarial losses recognized as other comprehensive income for the year ended December 31,
2011, amount to \ 58,160 million (2010: \ 54,971 million), and cumulative actuarial losses
recognized as other comprehensive income as of December 31, 2011, amount to \ 113,131 million.
As of December 31, 2011, the Company funded approximately 0.72% of the total retirement benefit
obligations through an insurance plan with Samsung Insurance Co., Ltd. and Korea Life Insurance
Co., Ltd.
Changes in the carrying amount of defined benefit obligations for the years ended December 31, 2011
and 2010, are as follows:
(in millions of Korean won) 2011 2010
At January 1 359,381 282,379
Current service cost 61,641 48,784
Interest expense 24,117 20,797
Benefits paid (49,370) (48,507)
Actuarial gain(loss) 58,096 55,928
At December 31 453,865 359,381
The movements in the fair value of plan assets for the years ended December 31, 2011 and 2010, are
as follows:
(in millions of Korean won) 2011 2010
At January 1 5,895 6,495
Expected return on plan assets 166 211
Benefits paid (562) (750)
Actuarial gains(losses) (64) (61)
At December 31 5,435 5,895
The actual return of plan assets for the year ended December 31, 2011, was \ 102 million (2010:
\ 150 million).
The principal actuarial assumptions used as of December 31, 2011 and 2010, and January 1, 2010,

Hynix Semiconductor Inc.Notes to Separate Financial StatementsDecember 31, 2011 and 2010, and January 1, 2010
55
were as follows:
December 31, 2011 December 31, 2010 January 1, 2010
Future salary increase 5.54% 5.66% 5.69%
Discount rate 5.89% 6.82% 7.50%
Expected rate of return1
4.77% 5.61% 5.61%
1Expected rate of return of plan assets is calculated by weighted average of actual rate of return.
Plan assets as of December 31, 2011 and 2010, and January 1, 2010, consist of the following:(in millions of Korean won) December 31, 2011 December 31, 2010 January 1, 2010
Deposits 3,284 3,524 3,819
Other 2,151 2,371 2,676
5,435 5,895 6,495
Adjustments for the differences between initial assumptions and actual figures as of December 31,
2011 and 2010, are as follows:
(in millions of Korean won) 2011 2010
Defined benefit liability adjustments 25,693 29,465
Defined benefit asset adjustments 64 61
24. Deferred Income Tax
The analysis of deferred tax assets and deferred tax liabilities as of December 31, 2011 and 2010, is
as follows:
(in millions of Korean won) 2011 2010
Deferred tax assetsDeferred tax asset to be recoveredafter more than 12 months
46,155 40,351
Deferred tax asset to be recovered within 12 months 355,780 464,379
401,935 504,730
Deferred tax liabilitiesDeferred tax liability to be recoveredafter more than 12 months
(101,821) (96,017)
Deferred tax liability to be recovered within 12 months (78,179) (79,979)
(180,000) (175,996)
Deferred tax assets(liabilities), net 221,935 328,734
The gross movement in the deferred income tax account as of December 31, 2011 and 2010, is as
follows:
(in millions of Korean won) 2011 2010
At January 1 328,734 412,875
Income statement charge (Note 34) (107,171) (85,438)
Tax charge/(credit) relating to components of othercomprehensive income (Note 34)
372 1,297
At December 31 221,935 328,734
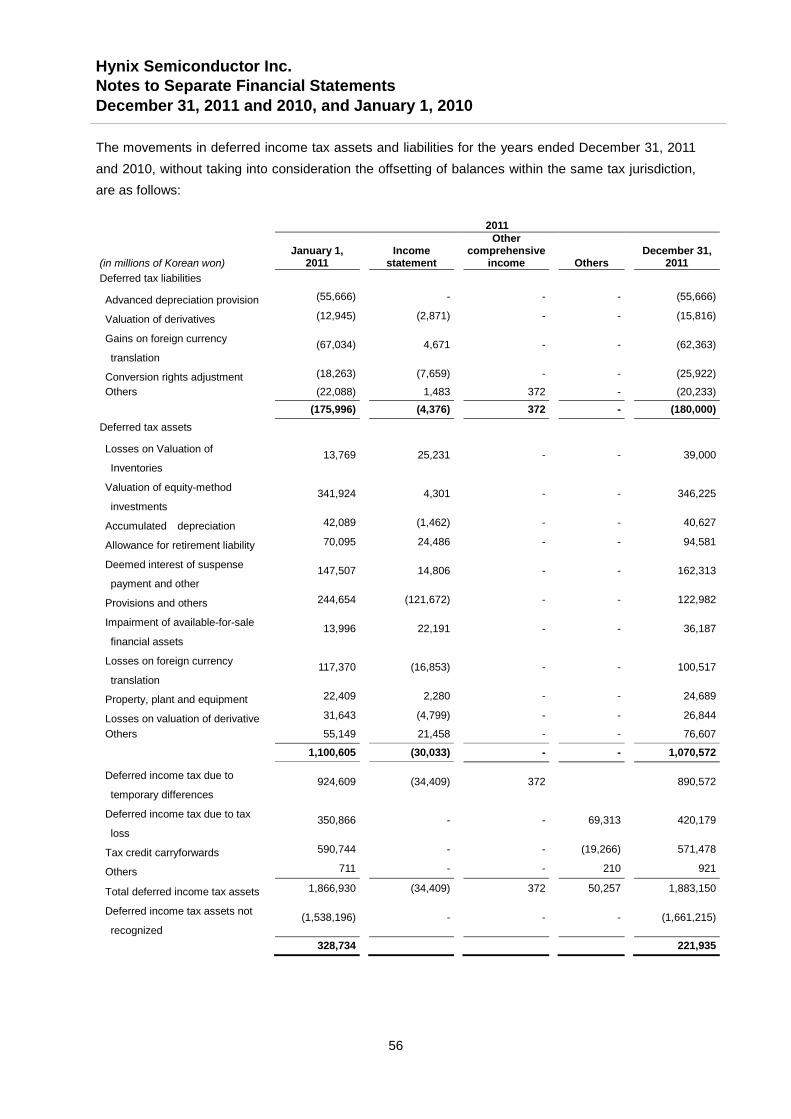
Hynix Semiconductor Inc.Notes to Separate Financial StatementsDecember 31, 2011 and 2010, and January 1, 2010
56
The movements in deferred income tax assets and liabilities for the years ended December 31, 2011
and 2010, without taking into consideration the offsetting of balances within the same tax jurisdiction,
are as follows:
2011
(in millions of Korean won)January 1,
2011Income
statement
Othercomprehensive
income OthersDecember 31,
2011
Deferred tax liabilities
Advanced depreciation provision (55,666) - - - (55,666)
Valuation of derivatives (12,945) (2,871) - - (15,816)
Gains on foreign currency
translation(67,034) 4,671 - - (62,363)
Conversion rights adjustment (18,263) (7,659) - - (25,922)
Others (22,088) 1,483 372 - (20,233)
(175,996) (4,376) 372 - (180,000)
Deferred tax assets
Losses on Valuation of
Inventories13,769 25,231 - - 39,000
Valuation of equity-method
investments341,924 4,301 - - 346,225
Accumulated depreciation 42,089 (1,462) - - 40,627
Allowance for retirement liability 70,095 24,486 - - 94,581
Deemed interest of suspense
payment and other147,507 14,806 - - 162,313
Provisions and others 244,654 (121,672) - - 122,982
Impairment of available-for-sale
financial assets13,996 22,191 - - 36,187
Losses on foreign currency
translation117,370 (16,853) - - 100,517
Property, plant and equipment 22,409 2,280 - - 24,689
Losses on valuation of derivative 31,643 (4,799) - - 26,844
Others 55,149 21,458 - - 76,607
1,100,605 (30,033) - - 1,070,572
Deferred income tax due to
temporary differences924,609 (34,409) 372 890,572
Deferred income tax due to tax
loss350,866 - - 69,313 420,179
Tax credit carryforwards 590,744 - - (19,266) 571,478
Others 711 - - 210 921
Total deferred income tax assets 1,866,930 (34,409) 372 50,257 1,883,150
Deferred income tax assets not
recognized(1,538,196) - - - (1,661,215)
328,734 221,935

Hynix Semiconductor Inc.Notes to Separate Financial StatementsDecember 31, 2011 and 2010, and January 1, 2010
57
2010
(in millions of Korean won)January 1,
2010Income
statement
Othercomprehensive
income OthersDecember 31,
2010
Deferred tax liabilities
Advanced depreciation provision (55,666) - - - (55,666)
valuation of derivative (3,311) (9,634) - - (12,945)
Gains on Foreign Currency
Translation(61,334) (5,700) - - (67,034)
Conversion Rights adjustment (34,696) 16,433 - - (18,263)
Others (12,704) (10,681) 1,297 - (22,088)
(167,711) (9,582) 1,297 - (175,996)
Deferred tax assets
Losses on valuation of
Inventories11,566 2,203 - - 13,769
Valuation of equity-method
investments389,175 (47,251) - - 341,924
Accumulated depreciation 70,828 (28,739) - - 42,089
Allowance for retirement liability 65,348 4,747 - - 70,095
Deemed interest of suspense
payment and other151,101 (3,594) - - 147,507
Provisions and others 207,768 36,886 - - 244,654
Impairment of available-for-sale
financial assets474 13,522 - - 13,996
Losses on foreign currency
translation129,728 (12,358) - - 117,370
Property, plant and equipment - 22,409 - - 22,409
Losses on valuation of derivative 24,419 7,224 - - 31,643
Others 61,051 (5,902) - - 55,149
1,111,458 (10,853) - - 1,100,605
Deferred income tax due to
temporary differences943,747 (20,435) 1,297 - 924,609
Deferred income tax due to tax
loss967,517 - - (616,651) 350,866
Tax credit carryforwards 718,303 - - (127,559) 590,744
Others 650 - - 61 711
Total deferred income tax assets 2,630,217 (20,435) 1,297 (744,149) 1,866,930
Deferred income tax assets not
recognized(2,217,342) - - - (1,538,196)
412,875 328,734
Deferred income tax assets are recognized for deductible temporary differences and tax loss
carryforwards to the extent that the realization of the related tax benefit through future taxable profits
is probable. The Company did not recognize deferred income tax assets of \ 142,578 million in
respect of losses amounting to \ 589,165 million that can be carried forward against future taxable
income. Also, the Company did not recognize deferred income tax assets of \ 947,159 million (2010:
\ 947,452 million) in respect of deductable temporary differences amounting to \ 3,913,880 million

Hynix Semiconductor Inc.Notes to Separate Financial StatementsDecember 31, 2011 and 2010, and January 1, 2010
58
(2010: \ 3,915,091 million) that can be carried forward against future taxable income. Deferred
income tax assets of \ 571,478 million (2010: \ 590,744 million) have not been recognized for
unused tax credit as of December 31, 2011.
Expiry periods of tax loss carryforwards and tax credit carryforwards are as follows:
(in millions of Korean won) Tax loss carryforwards Tax credit carryforwards
2012 - 195,055
2013 - 132,987
2014 - 56,565
2015 - 186,871
2019 1,353,596 -
Thereafter 382,680 -
1,736,276 571,478
Deferred income tax liabilities of \17,657 million (2010: \17,990 million) have not been recognized
for the withholding tax and other taxes that would be payable on the unremitted earnings of certain
subsidiaries. Such amounts are permanently reinvested. Unremitted earnings totaled \72,764 million
at December 31, 2011 (2010: \81,775 million).
25. Share Capital and Capital Surplus
Details of share capital and capital surplus as of December 31, 2011, are as follows:
(in thousands of shares, except for par value and paid-in capital)
Authorizedshares
Outstandingshares
Outstanding sharesafter the merger of shares
1Par valueper share Paid in capital
9,000,000 5,586,149 595,700 ₩ 5,000 ₩ 2,978,498 million
1As of December 31, 2011, the actual number of shares which the shareholders own is 592,172
thousand shares. The difference of 3,528 thousand shares is the result of stock retirement.
Changes in share capital and capital surplus during the years ended December 31, 2011 and 2010,
are as follows:
(in millions of Korean wonand in thousands of shares)
Paid inCapital Capital Surplus
Totalownedshares Share capital
Sharepremium
Conversionright
consideration Other Total
At January 1, 2010 589,639 2,965,833 633,027 76,985 509,730 4,185,575
Exercise of conversion rights 635 3,177 12,479 (1,164) - 14,492
Exercise of stock options 3 13 7 - - 20
At December 31, 2010 590,277 2,969,023 645,513 75,821 509,730 4,200,087
At January 1, 2011 590,277 2,969,023 645,513 75,821 509,730 4,200,087
Exercise of conversion rights 1,895 9,475 39,664 (3,471) - 45,668
At December 31, 2011 592,172 2,978,498 685,177 72,350 509,730 4,245,755

Hynix Semiconductor Inc.Notes to Separate Financial StatementsDecember 31, 2011 and 2010, and January 1, 2010
59
In accordance with the Articles of Incorporation, shares can be retired and be distributed as dividends
to the shareholders, and the total of number of shares retired as of December 31, 2011, is 3,528
thousand shares.
26. Retained Earnings
Retained earnings as of December 31, 2011 and 2010, and January 1, 2010, consist of:
(in millions of Korean won) December 31, 2011 December 31, 2010 January 1, 2010
Legal reserve1 8,854 - -
Discretionary reserve2 235,506 235,506 235,506
Unappropriated retainedearnings
3,696,809 3,723,222 992,248
3,941,169 3,958,728 1,227,754
1The Commercial Code of the Republic of Korea requires the Company to appropriate, as a legal
reserve, an amount equal to a minimum of 10% of cash dividends paid, until such reserve equals 50%
of its issued capital stock. The reserve is not available for the payment of cash dividends, but may be
transferred to capital stock, or used to reduce accumulated deficit, if any, with the ratification of the
Company’s majority shareholders.
2Discretionary reserve is a reserve for technology development.
The appropriation of retained earnings for the years ended December 31, 2011 and 2010 is as follows:
(in millions of Korean won) 2011 2010
At January 1Unappropriated retained earningscarried over from prior year
3,625,827 770,430
Effects of Korean-IFRS adoption - 221,818
Actuarial gains and losses (58,160) (54,971)
Net income 129,142 3,696,809 2,785,945 3,723,222
Appropriation of retained earnings - 97,395
Legal appropriation ofretained earnings
- 8,854
DividendsCash dividend (%):2011: nil (0%),2010:\ 150 (3%)
- 88,541
At December 31 3,696,809 3,625,827

Hynix Semiconductor Inc.Notes to Separate Financial StatementsDecember 31, 2011 and 2010, and January 1, 2010
60
27. Accumulated Other Comprehensive Income
Details of accumulated other comprehensive income as of December 31, 2011 and 2010, and
January 1, 2010, consists of the following:
(in millions of Korean won)December 31,
2011December 31,
2010January 1,
2010
Loss arising on revaluation (25,822) (31,158) (13,505)
of available-for-sale financial assets
Gain arising on revaluation 36,197 33,627 28,932
of available-for-sale financial assets
Total 10,375 2,469 15,427
Details of changes in accumulated other comprehensive income for the years ended December 31,
2011 and 2010, are as follows:
2011
(in millions of Korean won) BeginningIncrease
(Decrease)Reclassificationto profit or loss Ending
Gain(loss) arising on revaluation 2,469 (376) 8,282 10,375
of available-for-sale financial assets
2,469 (376) 8,282 10,375
2010
(in millions of Korean won) BeginningIncrease
(Decrease)Reclassificationto profit or loss Ending
Gain(loss) arising on revaluation 15,427 (12,958) - 2,469
of available-for-sale financial assets
15,427 (12,958) - 2,469
28. Dividends
Dividend paid to the Company’s shareholders amounted to \ 88,541 million for the year ended
December 31, 2010, as approved by the shareholders in April 2011.
29. Classification of Operating Income
Operating income (loss) is calculated as gross profit net of distribution costs, selling and
administrative expenses, other net income (loss), and other income and expenses (Note 32).
Under the former accounting standards, operating income (loss) was calculated as gross profit net of

Hynix Semiconductor Inc.Notes to Separate Financial StatementsDecember 31, 2011 and 2010, and January 1, 2010
61
selling, administration and ordinary development expenses. Under the Korean IFRS, operating
income (loss) was calculated as gross profit, net of distribution costs, selling and administrative
expenses, other net income (loss), and other income and expenses. Therefore, operating income
(loss) amount differs between the previous K-GAAP to Korean IFRS by the amount of other net
income (loss), and other income and expenses (Note 32).
30. Expenses by Nature
Expenses that are recorded as cost of sales, selling, administration and ordinary development
expenses and other operating expenses in the statements of comprehensive income for the years
ended December 30, 2011 and 2010, consist of:
(in millions of Korean won) 2011 2010
Changes in inventories 22,610 (98,593)
Raw materials and consumables used 4,108,252 3,741,612
Employee benefit expenses 1,117,612 1,217,497
Depreciation, amortization and impairment 2,092,599 1,823,629
Royalty expense 178,072 131,870
Commission expense 284,939 293,770
Utilities expense 319,354 277,753
Repair expense 607,503 510,134
Outsourcing expense 854,560 682,049
Other 442,578 380,145
10,028,079 8,959,866
Employee benefit expense for the years ended December 31, 2011 and 2010, consists of:
(in millions of Korean won) 2011 2010
Wages and salaries 938,101 1,072,632
Defined benefits 85,592 69,370
Termination benefits 754 1,756
Other long-term employee benefits 10,177 6,752
Social security costs and other 82,988 66,987
1,117,612 1,217,497

Hynix Semiconductor Inc.Notes to Separate Financial StatementsDecember 31, 2011 and 2010, and January 1, 2010
62
31. Selling, Administration and Ordinary Development Expenses
Selling, administration and ordinary development expenses for the years ended December 31, 2011
and 2010, are as follows:
(in millions of Korean won) 2011 2010
Salaries 125,966 144,314
Severance benefits 13,267 10,804
Employee benefits 35,706 21,627
Commission expense 133,769 154,521
Depreciation 50,945 50,895
Amortization 64,957 18,436
Research and development 857,849 804,511
Exporting expense 21,986 16,319
Legal cost 41,537 34,706
Rental expense 6,166 7,034
Taxes and dues 8,512 5,457
Training Expenses 9,254 9,541
Sales Promotional Expenses 2,083 2,199
Utility Expenses 6,903 6,068
Storage cost 1,132 520
Supplies Expenses 10,497 10,499
Repairs Expenses 7,610 6,613
Other 26,159 16,756
Total 1,424,298 1,320,820
32. Other Operating Income and Expense
Other operating income for the years ended December 31, 2011 and 2010, consist of:
(in millions of Korean won) 2011 2010
Rental income 29,551 28,907
Gain on disposal of assets held-for-sale 6,440 12,160
Gain on disposal of investment property 7,447 -
Gain on disposal of property, plant andequipment
1,329 26,711
Gain on disposal of intangible assets 9,352 -
Other 297,315 47,029
Total 351,434 114,807

Hynix Semiconductor Inc.Notes to Separate Financial StatementsDecember 31, 2011 and 2010, and January 1, 2010
63
Other operating expenses for the years ended December 31, 2011 and 2010, consist of:
(in millions of Korean won) 2011 2010
Loss on disposal of assets held-for-sale 6,884 34,260Loss on disposal of property, plant and
equipment3,392 5,289
Loss on disposal of intangible assets 4,984 3,406
Loss on disposal of investment property 2 -
Donation 1,287 1,456
Impairment of assets held-for-sale - 7,390
Impairment of property, plant and equipment 14,230 -
Impairment of intangible assets 728 350
Amortization of suspended assets 15,884 30,629
Other 63,445 68,880
Total 110,836 151,660
The other operating income and expenses, included in calculating the operating income during the
years ended December 31, 2011 and 2010, were not included in calculating the operating income
under the previous accounting standard (K-GAAP).
33. Financial Income and Expenses
Financial income and expenses for the years ended December 31, 2011 and 2010, are as follows:
(in millions of Korean won)
Finance income
2011 2010
Interest income 56,402 69,552
Dividend income 8,882 687
Gain on disposal of investmentsin subsidiaries, jointly controlledentities and associates
1,166 -
Foreign exchange differences 413,893 568,049
Gain from derivative instruments 40,852 80,690
Other - 441
Total Finance income 521,195 719,419
Finance expense
Interest expenses 271,753 299,813
Foreign exchange differences 459,466 490,002
Loss from derivative instruments 22,925 18,781
Loss on redemption of debentures - 27,266
Impairment of Available-for-sale financial assets 21,847 1,295
Impairment loss on equity investments in associates 10,637 -
Total Finance expense 786,628 837,157
Net finance income (expense) (265,433) (117,738)

Hynix Semiconductor Inc.Notes to Separate Financial StatementsDecember 31, 2011 and 2010, and January 1, 2010
64
34. Income Tax
Income tax expense for the years ended December 31, 2011 and 2010, consists of:
(in millions of Korean won) 2011 2010
Current tax:
Current tax on profits for the year - -
Adjustments in respect of prior years - (3,796)
Total current tax - (3,796)
Deferred tax (Note 225):
Origination and reversal of temporary differences 107,171 85,438
Total deferred tax 107,171 85,438
Income tax expense 107,171 81,642
The tax on the Company’s profit before tax differs from the theoretical amount that would arise using
the weighted average tax rate applicable to the profits of the Company as follows:
(in millions of Korean won) 2011 2010
Profit before tax 236,313 2,867,587
Tax calculated at domestic tax rates applicableto profits in the respective countries 57,161 693,980Tax effects of:
Income not subject to tax (1) -Expenses not deductible for tax purposes 1,490 38,850Changes in temporary differences not
recognized 123,018 (679,145)
Re-measurement of deferred tax - change inthe Korean tax rate (74,497) -
Other - 27,957Adjustment in respect of prior years 50,010 (612,338)
Tax charge 107,171 81,642
The income tax (charged)/credited directly to equity as of December 31, 2011 and 2010, and January
1, 2010, is as follows:
December 31, 2011 December 31, 2010 January 1, 2010
(in millions of Koreanwon)
Beforetax
Tax(charge)
creditAftertax
Beforetax
Tax(charge)
creditAftertax
Beforetax
Tax(charge)
creditAftertax
Fair value gains fromavailable-for-salefinancial assets
13,357 (2,982) 10,375 5,823 (3,353) 2,470 20,077 (4,650) 15,427
Actuarial loss onretirement benefitobligations
(113,130) - (113,130) (54,971) - (54,971) - - -
(99,773) (2,982) (102,755) (49,148) (3,353) (52,501) 20,077 (4,650) 15,427

Hynix Semiconductor Inc.Notes to Separate Financial StatementsDecember 31, 2011 and 2010, and January 1, 2010
65
During the year 2011, as a result of the change in the Korean corporation tax rate from 22% to 24.2%
that was substantively enacted on December 31, 2011, and that is effective from January 1, 2012, the
relevant deferred tax balances have been re-measured. Deferred tax expected to be realized in the
year 2012 and thereafter, has been measured using the effective rate of 24.2%.
35. Earnings per Share
Basic earnings per share is calculated by dividing the profit attributable to equity holders of the
Company by the weighted average number of ordinary shares in issue during the year excluding
ordinary shares purchased by the Company and held as treasury shares.
Basic earnings per ordinary share as of December 31, 2011 and 2010, is as follows:(in millions of Korean wonexcept for shares and per share amounts) 2011 2010
Profit attributable to ordinary shares 129,142 2,785,945Weighted average number of ordinary
shares outstanding 592,171,582 590,275,971
Basic earnings per share 218 4,720
Diluted earnings per share is computed by adjusting the weighted average number of ordinary shares
outstanding to assume conversion of all dilutive potential ordinary shares. The company has two
categories of dilutive potential ordinary shares: convertible bond and share options. The convertible
bond is assumed to have been converted into ordinary shares, and the net profit is adjusted to
eliminate the interest expense less the tax effect. For the share options, a calculation is done to
determine the number of shares that could have been acquired at fair value (determined as the
average annual market share price of the company’s shares) based on the monetary value of the
subscription rights attached to outstanding share options. The number of shares calculated as above
is compared with the number of shares that would have been issued assuming the exercise of the
share options.
(in millions of Korean wonexcept for shares and per share amounts) 2011 2010
Profit attributable to ordinary shares 129,142 2,785,945
Add : Convertible bond related costs (39)
Adjusted profit attributable to ordinary shares 129,142 2,785,906Adjusted weighted average number of ordinaryshares outstanding
1592,209,226 628,387,645
Basic earnings per share 218 4,433
1Adjusted weighted average number of ordinary shares outstanding is calculated as follows:
(in shares) 2011 2010Weighted average number of ordinary shares
outstanding592,171,582 590,275,971
Dilutive potential ordinary shares
Convertible bond - 38,093,742
Share options 37,644 17,932
Adjusted weighted average number of ordinaryshares outstanding
592,209,226 628,387,645

Hynix Semiconductor Inc.Notes to Separate Financial StatementsDecember 31, 2011 and 2010, and January 1, 2010
66
After the reporting date, the Share Management Council, the major shareholder of the Company sold
44.25 million shares to SK Telecom Co., Ltd. Also, the Company issued 101.85 million shares to SK
Telecom Co., Ltd. If this transaction event had occurred within the reporting date, the ordinary share
and dilutive potential outstanding would have been significantly influenced (Note 42).
36. Related Parties
Details of subsidiaries, jointly controlled entities and associates as of December 31, 2011, are as
follows:
Type Names of subsidiariesParent
CompanyRemark
SubsidiariesHynix Engineering Co., Ltd.(HEC) The Company Domestic subsidiary
Hystech Co., Ltd. The Company Domestic subsidiary
Hynix HRD Co., Ltd. The Company Domestic subsidiary
Hylogitech Co., Ltd. The Company Domestic subsidiary
Ami Power Co., Ltd. The Company Domestic subsidiary
QRT Semiconductor Co., Ltd. HEC Domestic subsidiary
Hynix Semiconductor America Inc.(HSA) The Company Overseas sales entity
Hynix Semiconductor ManufacturingAmerica Inc
(HSMA)HSA Discontinued entity
Hynix Semiconductor Deutschland
GmbH (HSD)The Company Overseas sales entity
Hynix Semiconductor Europe Holding Ltd (HSE) The Company Holding company
Hynix Semiconductor U.K. Ltd.(HSU) HSE Overseas sales entity
Hynix Semiconductor Asia Pte. Ltd.(HSS) The Company Overseas sales entity
Hynix Semiconductor Indian
Subcontinent Private Ltd (HSIS)HSS Overseas sales entity
Hynix Semiconductor Hong Kong Ltd (HSH) The Company Overseas sales entity
Hynix Semiconductor(Shanghai) Co., Ltd (HSCS) The Company Overseas sales entity
Hynix Semiconductor Japan Inc (HSJ) The Company Overseas sales entity
Hynix Semiconductor Taiwan Inc (HST) The Company Overseas sales entity
Hynix Semiconductor China Ltd (HSCL) The Company Manufacturing entity
Hynix Semiconductor (Wuxi) Ltd.(HSMC) The Company Manufacturing entity
Hynix (Wuxi) Semiconductor Sales Ltd.(HSCW) The Company Overseas sales entity
Associate SiliconFile Technologies Inc. - -
Jointly
controlled
entities
HITECH Semiconductor(Wuxi) Co., Ltd. - -

Hynix Semiconductor Inc.Notes to Separate Financial StatementsDecember 31, 2011 and 2010, and January 1, 2010
67
Significant transactions for the years ended December 31, 2011 and 2010, are as follows:
(in millions of Korean won)
2011 2010
Sales Purchases Sales Purchases
Sales entities 9,513,528 500,493 11,204,765 569,057
Manufacturing entities 17,750 2,226,415 27,605 2,083,822
Domestic subsidiaries 16,429 219,105 23,212 192,482
Associate 35,279 618 30,076 102
Jointly controlled entity 937 444,463 762 329,840
9,583,923 3,391,094 11,286,420 3,175,303
The balances of significant transactions as of December 31, 2011 and December 31, 2010, are as
follows:
(in millions of Korean won)
December 31, 2011 December 31, 2010
Receivables Payables Receivables Payables
Sales entities 1,328,544 148,956 1,360,814 168,801
Manufacturing entities 37,817 294,005 36,657 348,922
Domestic subsidiaries 55,874 20,619 61,787 77,458
Associate 6,573 - 5,425 -
Jointly controlled entity 5,924 295,693 4,052 328,691
1,434,732 759,273 1,468,735 923,872
Key management compensation
Key management includes the chief executive officer, seven directors, three internal auditors and 38
others. The compensation paid to key management for employee services as of December 31,
2011and 2010, is shown below:
(in millions of Korean won) Details 2011 2010
Short-term employee benefitsWages, salaries, bonusand other
15,056 10,117
Post-employment benefitsRetirement payment andother
2,225 1,526
Other long-term benefitsLong-term employmentallowance
1 8
17,282 11,651
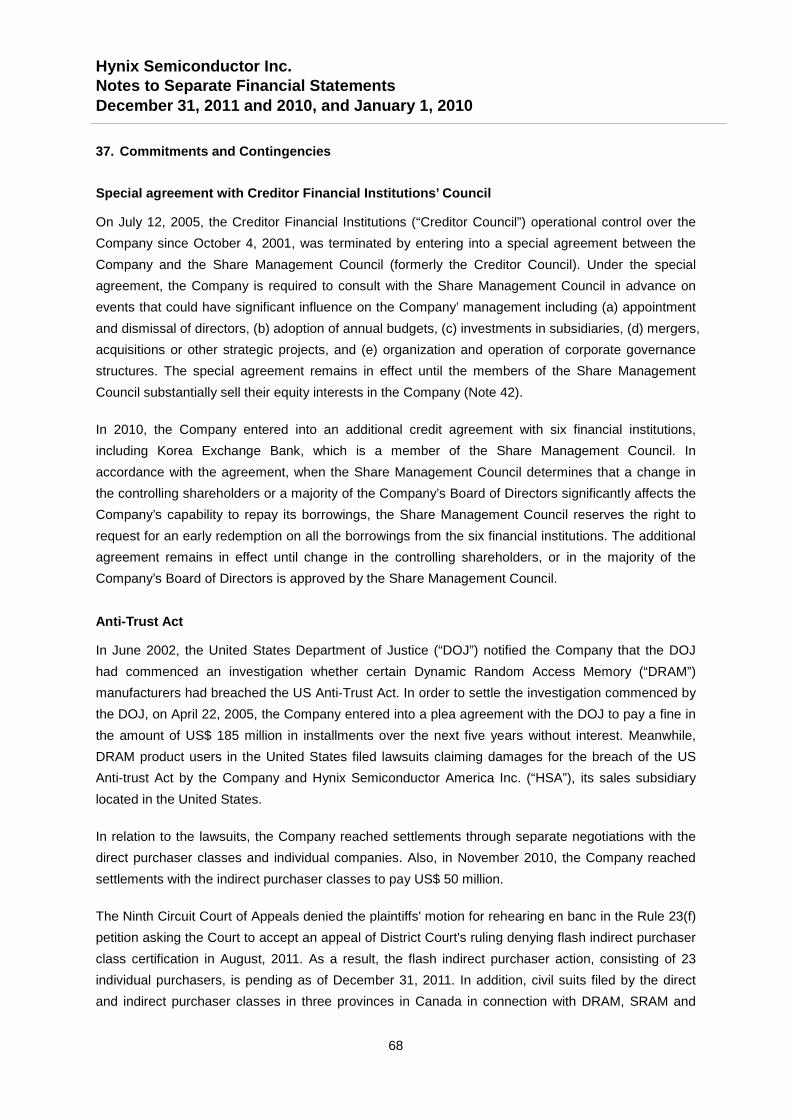
Hynix Semiconductor Inc.Notes to Separate Financial StatementsDecember 31, 2011 and 2010, and January 1, 2010
68
37. Commitments and Contingencies
Special agreement with Creditor Financial Institutions’ Council
On July 12, 2005, the Creditor Financial Institutions (“Creditor Council”) operational control over the
Company since October 4, 2001, was terminated by entering into a special agreement between the
Company and the Share Management Council (formerly the Creditor Council). Under the special
agreement, the Company is required to consult with the Share Management Council in advance on
events that could have significant influence on the Company’ management including (a) appointment
and dismissal of directors, (b) adoption of annual budgets, (c) investments in subsidiaries, (d) mergers,
acquisitions or other strategic projects, and (e) organization and operation of corporate governance
structures. The special agreement remains in effect until the members of the Share Management
Council substantially sell their equity interests in the Company (Note 42).
In 2010, the Company entered into an additional credit agreement with six financial institutions,
including Korea Exchange Bank, which is a member of the Share Management Council. In
accordance with the agreement, when the Share Management Council determines that a change in
the controlling shareholders or a majority of the Company’s Board of Directors significantly affects the
Company’s capability to repay its borrowings, the Share Management Council reserves the right to
request for an early redemption on all the borrowings from the six financial institutions. The additional
agreement remains in effect until change in the controlling shareholders, or in the majority of the
Company’s Board of Directors is approved by the Share Management Council.
Anti-Trust Act
In June 2002, the United States Department of Justice (“DOJ”) notified the Company that the DOJ
had commenced an investigation whether certain Dynamic Random Access Memory (“DRAM”)
manufacturers had breached the US Anti-Trust Act. In order to settle the investigation commenced by
the DOJ, on April 22, 2005, the Company entered into a plea agreement with the DOJ to pay a fine in
the amount of US$ 185 million in installments over the next five years without interest. Meanwhile,
DRAM product users in the United States filed lawsuits claiming damages for the breach of the US
Anti-trust Act by the Company and Hynix Semiconductor America Inc. (“HSA”), its sales subsidiary
located in the United States.
In relation to the lawsuits, the Company reached settlements through separate negotiations with the
direct purchaser classes and individual companies. Also, in November 2010, the Company reached
settlements with the indirect purchaser classes to pay US$ 50 million.
The Ninth Circuit Court of Appeals denied the plaintiffs' motion for rehearing en banc in the Rule 23(f)
petition asking the Court to accept an appeal of District Court's ruling denying flash indirect purchaser
class certification in August, 2011. As a result, the flash indirect purchaser action, consisting of 23
individual purchasers, is pending as of December 31, 2011. In addition, civil suits filed by the direct
and indirect purchaser classes in three provinces in Canada in connection with DRAM, SRAM and

Hynix Semiconductor Inc.Notes to Separate Financial StatementsDecember 31, 2011 and 2010, and January 1, 2010
69
Flash memory are also pending.
As of December 31, 2011, the ultimate outcome of the lawsuits described above cannot be
determined, but will not have a material effect on the Company’s separate financial statements. The
accompanying separate financial statements do not include any additional adjustments in excess of
managements’ current expectation in relation to such uncertainty.
Company’s pending litigations as of December 31, 2011
(a) Litigation filed by Rambus
The Company is a defendant in litigations brought by Rambus Inc. (“Rambus”), a developer of high-
bandwidth chip connection technologies, with respect to the alleged infringement of Rambus’ patents
by the Company’ manufacture, sales, offer for sales, use or otherwise disposal of Single Data Rate
(“SDR”) Synchronous Dynamic Random Access Memory (“SDRAM”) and Double Data Rate (“DDR”)
SDRAM products. The litigations have been brought in Germany, France, the United Kingdom and the
United States. In 2004, the European Patent Office revoked Rambus’ certain key patents subject to
such litigation against the Company in the European Union jurisdiction. Accordingly, in 2005, the
litigation in the United Kingdom was dismissed, the litigation in France ceased further proceedings,
and the litigation in Germany has been deferred without any progress.
Meanwhile, in connection with the litigation in the United States, on March 10, 2009, the United States
District Court for the Northern District of California issued the judgment that ordered the Company to
pay for damages for the infringement of Rambus’ patents and to pay royalties of 1% for SDR SDRAM
products and 4.25% for DDR SDRAM products manufactured or sold in the United States from
February 1, 2009 to April 17, 2010. The Company appealed the court’s final judgment to the United
States Court of Appeals for the Federal Circuit on April 6, 2009.
On May 13, 2011, the United States Court of Appeals for the Federal Circuit vacated the original
judgment issued by the United States District Court for the Northern District of California concluding
the court used the wrong legal standard and remanded the case for further proceedings to the court.
On January 11, 2012, in light of the fact that the court’s judgment has been vacated, the court ordered
that Hynix’s obligation to maintain the bond was released, while declining to lift Hynix’s obligation to
make continuing on-going royalties amounting to USD 59 million into the escrow account.
Separately, Rambus also brought another lawsuit against the Company and its US subsidiary by
alleging that the Company and its subsidiary’s DDR2 and Graphic DDR SDRAM products had
infringed on Rambus’ patents. In addition, Rambus filed a lawsuit in the San Francisco Superior Court
against the Company together with its US subsidiary, and other major memory chip manufacturers
alleging that the defendants conspired to prevent Rambus’ proprietary DRAM technology from
becoming the standard computer memory technology, However, on February 15, 2012, the court
issued the final judgment rejecting Rambus’ claims.

Hynix Semiconductor Inc.Notes to Separate Financial StatementsDecember 31, 2011 and 2010, and January 1, 2010
70
As of December 31, 2011, the ultimate outcome of the lawsuits described above cannot be
determined, but could have a material effect on the Companty’s separate financial statements. The
accompanying consolidated financial statements do not include any additional adjustments in excess
of managements’ current expectation in relation to such uncertainty.
(b) Lawsuit from Hyundai Heavy Industries Co., Ltd.(“HHI”)
On July 24, 1997, the Company sold 13 million shares of Hyundai Investment & Securities Co., Ltd.
(“HIS”) to Canadian Imperial Bank of Commerce (“CIBC”). In relation to this transaction, HHI entered
into a share option agreement with CIBC in which HHI was obligated to buy back the 13 million
shares of HIS if CIBC exercised its put option. In return, the Company and Hyundai Securities Co.,
Ltd. (“HSC”) provided HHI with a comfort letter stating that HHI would not suffer any burden as a
result of the transaction. The Company, in turn, received a similar letter from HSC in which HSC
acknowledged that all of the above transactions were initiated by HSC and that HSC guaranteed that
the Company would not suffer any legal or economic losses in connection with the above transaction.
Upon CIBC’s exercise of its put option, HHI repurchased the shares and requested approximately
US$ 220 million of compensation for damage which is equivalent to the repurchase price to the
Company and HSC.
However, the Company rejected the request by asserting that the Company was not a party
connected directly to the transaction between HHI and CIBC and the comfort letter was not a legal
guarantee. In response, on July 28, 2000, HHI sued the Company, HSC and the former CEO of HSC
at the Seoul Central District Court.
In January 2002, the court rendered a ruling that the Company, HSC and the former CEO of HSC
jointly and severally pay 70% of the claim amount (\ 171,822 million) and interest thereon to HHI. In
2004, the Company paid HHI \ 123,677 million, which represented the estimated portion of its share
of compensation pursuant to the ruling and interest thereon. However, the Company made an appeal
to the Seoul High Court on February 15, 2002, and on June 14, 2006, the court rendered a ruling that
the Company and HSC should pay approximately 80% of the claim amount (\ 192,942 million).
With respect to the revised ruling, the Company paid HHI an additional amount of \ 1,926 million for
the estimated portion of its share of compensation, including interest. The Company further contested
this case by making an appeal to the Supreme Court of Korea on June 30, 2006, and in a third ruling,
the Supreme Court upheld the second ruling in part for HSC and the former CEO of HSC. The
Supreme Court, however, reversed and remanded the second ruling for the Company on the grounds
that the Company has the expense reimbursement obligation to HHI. On August 21, 2009, the Seoul
High Court rendered a ruling that the Company should pay \ 167,219 million and related interest
after deducting payments previously made by HSC, recognizing the obligation based on the comfort
letter provided by the Company. Subsequently, the Company paid \ 86,226 million, in addition to the
payments the Company already made to HHI pursuant to the first and second rulings.
HHI, however, made another appeal to the Supreme Court of Korea on September 10, 2009. The

Hynix Semiconductor Inc.Notes to Separate Financial StatementsDecember 31, 2011 and 2010, and January 1, 2010
71
Supreme Court of Korea, on February 2, 2012, reversed and remanded the above Seoul High Court
ruling to the extent it excluded \ 4,284 million and related interest, on the grounds that Seoul High
Court erred in deducting the market value of the shares from the compensation.
The Company, in order to minimize the possible payment of interest, made a conditional/provisional
payment of \ 7,971 million in principal and interest as the litigation mentioned above is in progress in
Seoul High Court. As of December 31, 2011, the ultimate outcome of the lawsuits described cannot be
determined, but may have a material effect. The accompanying consolidated financial statements do
not include any additional adjustments in excess of managements’ current expectation in relation to
such uncertainty.
In addition, HHI initiated a separate lawsuit in December 2004 seeking the Company, HSC and the
former CEO of HSC to compensate for the taxes levied on HHI and any related losses incurred by
HHI amounting to \ 50,303 million in connection with HHI’s repurchase of shares. As a result of the
litigation described above, the Seoul Central District Court rendered its ruling on October 22, 2009,
that the Company, HSC and the former CEO of HSC jointly and severally shall pay the total amount of
compensation and related interest. Subsequently, the Company and HSC paid \ 73,692 million
pursuant to the first ruling.
However, the Company appealed to the Seoul High Court on November 11, 2009, and on November
10, 2011, the court rendered a ruling that the Company and HSC should only pay \ 48,770 million
and related interest. HSC and HHI appealed to the Supreme Court of Korea on November 25, 2011.
As of December 31, 2011 the ultimate outcome of the lawsuits described above cannot be determined,
but could have a material effect.
(c). Lawsuit against Hyundai Securities Co., Ltd. (“HSC”)
On August 27, 2009, Hyundai Securities Co., Ltd. (“HSC”) filed a lawsuit against the Company at the
Seoul Central District Court with respect to the lawsuit described above, seeking the Company to pay
\ 99,172 million and interest to HSC on the grounds that the Company has the ultimate expense
reimbursement obligation.
As a result of the lawsuit, on December 17, 2010, the Seoul Central District Court ruled that HSC’s
payment to HHI were on behalf of the Company as an agency and therefore, the Company had
responsibility to repay the amounts that HSC had paid to HHI. The Company made a provisional
payment amounting to \ 160,724 million to HSC and appealed to the Seoul High Court on January 7,
2011. On September 28, 2011, the Seoul High Court rejected the Company’s appeal by stating that
the Company was liable to HSC as ruled by the Seoul Central District Court. The Company filed an
appeal to the Supreme Court of Korea on October 19, 2011.
As of December 31, 2011, the ultimate outcome of the lawsuits described above cannot be
determined, but could have a material effect.
Separately, the Company filed a lawsuit against HSC on September 21, 2009 at Seoul Central District

Hynix Semiconductor Inc.Notes to Separate Financial StatementsDecember 31, 2011 and 2010, and January 1, 2010
72
Court in connection with the agreed payment claim of \ 211,829 million and interest on the grounds
that HSC provided the Company with a comfort letter similar to what HSC provided to HHI in which
HSC guaranteed that the Company would not suffer any legal or economic losses in connection with
the transactions described above, and the agreement for loss compensation. As a result of the lawsuit,
the Seoul Central District Court ruled against the Company on the grounds that the comfort letter is
restricted to a loss incurred by the sanctions from the government and therefore, the comfort letter
was not an agreement for compensation for all legal or economic losses. However, the Company
appealed to the Seoul High Court on January 7, 2011.
On September 22, 2011, the Seoul High Court rejected the Company’s appeal stating the same
reason as judged in the first ruling. After considering any benefit from an appeal to a higher court, the
Company decided not to appeal any more. Therefore, this lawsuit has been finalized.
Meanwhile, on February 25, 2011, HSC filed a lawsuit against the Company seeking the Company to
pay \ 27,917 million and delay interest on the grounds that the Company is finally liable to HSC’s
payment to HHI in relation to the taxes levied on HHI and any related losses incurred by HHI in
connection with HHI’s repurchase of shares of HIS. The Company brought a counteraction against
this claim at Seoul Central District Court and made a provisional payment amounting to \ 30,235
million to HSC to avoid any delay interest in case of unfavorable ruling against the Company.
As of December 31, 2011, the ultimate outcome of the lawsuits described above cannot be
determined, but could have a material effect.
(d) Other litigation and patent-related claims
Apart from the above litigation, the Company is in the midst of defending itself against other various
lawsuits and claims regarding patent infringements. As a result, as of December 31, 2011, the
Company recognized a liability for the expected future losses that are probable and can be reliably
estimated. However, the final outcome of these matters cannot be determined, but could have a
material effect on the Company’s separate financial statements. The accompanying separate financial
statements do not include any adjustments in relation to such uncertainty.
Technology and patent license agreements
The Company has entered into a number of patent license agreements with several companies. The
related royalties are paid in a lump sum or running basis in accordance with the respective
agreements. Lump-sum royalties are expensed over the contract period using the straight-line method.
Contract for supply of industrial water
In March 2001, the Company and Veolia Water Industrial Development Co., Ltd. (“VWID”, formerly
Vivendi Water Industrial Development Co., Ltd.) entered into a contract for the purpose of purchasing
industrial water from VWID for 12 years from March 2001 to March 2013. The contract was
subsequently extended to March 2018 in December 2006, and amended in March 2007 due to the

Hynix Semiconductor Inc.Notes to Separate Financial StatementsDecember 31, 2011 and 2010, and January 1, 2010
73
establishment of additional plants. According to the amended contract, the Company is obligated to
pay base service charges which are predetermined and additional service charges which are variable
according to the amount of water used.
Post- process service contract with HITECH
The Company entered into an agreement with HITECH to be provided with post-process service by
HITECH. In addition, HITECH entered into agreements to purchase machinery of US$ 177 million and
US$ 128 million, from the Company and the Company’s subsidiary (HSMC), respectively. According
to the contract, HITECH should use the machinery only for the purpose of providing the post-process
service to the Company exclusively for the five years from its establishment. In 2011, the Company
entered into an additional contract for the purpose of module service and HITECH purchased
machinery of US$ 9.5 million from the Company. In connection with agreement, the Company is liable
to guarantee a certain level of margin to HITECH.
Repurchase agreement of Sithe Ichon power plants
The Company has previously entered into a long-term service agreement for the purchase of steam
and electricity from Sithe Ichon Power Generating Corp. (“Sithe Ichon”). In March 2005, the Sithe
Ichon and Hynix Engineering Co., Ltd. (“Hynix Engineering”, formerly Astec Co., Ltd.), the Company’
subsidiary, entered into an agreement to purchase the power generating facility from Sithe Ichon for
\ 119,000 million. In connection with the agreement, in July 2005, the Company entered into an
agreement with Sithe Ichon and Hynix Engineering under which the Company provides Sithe Ichon a
guarantee for Hynix Engineering’s performance under the purchase contract, and also the Company
entered into an agreement with Hynix Engineering to pay \ 56,319 million, which consisted of
\ 39,106 million of compensation to Sithe Ichon for the early termination of the previously entered
service agreement between the Company and Sithe Ichon, and \ 17,213 million of indemnity for
expected losses from the planned disposal of a part of the facility. In 2005, the Company recognized
the related liabilities and charged the losses in the statement of operations. As of December 31, 2011,
the aforementioned agreement and all the related assets have been transferred to Ami Power Co., Ltd.
(“Ami Power”), a newly incorporated entity that was spun off from Hynix Engineering. In addition, the
Company, Hynix Engineering and Ami Power entered into agreements under which Ami Power
provides steam and electricity (“Energy”) to the Company. In November 2011, Ami Power received
notice of the cancellation of a contract related the purchase of Energy from the Company. Accordingly,
Ami Power is scheduled to dispose of the related facility and will be liquidated. In connection with the
onerous contract, the Company charged \30,530 million of indemnity for expected losses. The
compensation for losses on disposal of Ami Power’s assets above is to be settled based on actual
losses sustained from the disposal, and accordingly, and additional loss could be incurred, which
cannot be determined as of December 31, 2011. The accompanying separate financial statements do
not include any adjustments in relation to such uncertainty.
Assets provided as collaterals
Details of assets provided as collaterals as of December 31, 2011, are as follows:

Hynix Semiconductor Inc.Notes to Separate Financial StatementsDecember 31, 2011 and 2010, and January 1, 2010
74
(in millions of Korean won) Book value Pledged amount Remark
Land 405,098
2,585,964Borrowings
and others1
Buildings 808,703
Structures 72,075
Machinery 3,877,843
5,163,719 2,585,964
1The Company provides newly acquired assets as additional collaterals every six months for
revolving credit facility and syndicated loan which were obtained in July 2005 and May 2007,
respectively.
Bank overdraft agreement
As of December 31, 2011, the Company has bank overdraft agreement with a limit of \41,000 million
(2010: \41,000 million) with Korea Exchange Bank and other.
Details of credit lines with financial institutions as of December 31, 2011, are as follows:
(in millions of USD) Limit
Financial
InstitutionCommitment Currency Amount
Korea Exchange
Bank and other
Import finance like usance USD 832
Export finance like bills bought USD 525
Comprehensive limit
contract for Import & ExportUSD 535
Guarantees provided to others
Details of guarantees provided to others as of December 31, 2011, are as follows:
(in millions of Korean won) Amount Remark
Employees 35Guarantees for employees’ borrowings
relating to employee stock ownership
HSA 15,772Guarantees for financial institution’s borrowing
relating to mortgage loan of HSA
15,807
38. Derivative Financial Instruments
The Company has managed foreign exchange risk and cash-flow interest risk through interest and
principal swaps, forward exchange, interest swap and currency option, and other derivative
instruments. In addition, the Company bifurcated the call option and convertible option, and
separately accounted for these as derivative instruments which were embedded in the unsecured
public debenture and foreign convertible bond. The Company recognized those options at fair value
and resulting gain or loss is reflected in current operations.

Hynix Semiconductor Inc.Notes to Separate Financial StatementsDecember 31, 2011 and 2010, and January 1, 2010
75
Details of derivative financial assets and liabilities as of December 31, 2011 and 2010, and January 1,
2010, are as follows:
December 31, 2011 December 31, 2010 January 1, 2010,
(in millions of Korean won) Assets Liabilities Assets Liabilities Assets Liabilities
Current
Foreign currency forwardcontract
- - - 230 - -
Interest and principalswap
- 33,696 - - - -
Interest rates swap - 619 - - - -
Option contracts - - - 42,196 - 29,417
Embedded derivatives - - - - - 3,747
- 34,315 - 42,426 - 33,164
Non-current
Interest and principle swap - - - 25,861 - 31,596
Interest rates swap - 1,325 - 1,401 - -
Option contracts - - - - - 31,294
Embedded derivativeinstruments
3,114 6,471 7,695 27,299 4,390 -
3,114 7,796 7,695 54,561 4,390 62,890
3,114 42,111 7,695 96,987 4,390 96,054
Details of gains and losses from derivative instruments during the years ended December 31, 2011
and 2010, are as follows:
2011
(in millions of Korean won)Gain on
valuationLoss on
valuationGain on
transactionLoss on
transaction
Interest and principal swap - 7,834 6,295 -
Interest rates swap 781 1,325 - 1,241
Foreign currency forward contract - - 9,082 2,290
Foreign currency option contract - - 3,865 2,443
Option contracts - - - 3,211
Embedded derivative instruments 20,829 4,581 - -
21,610 13,740 19,242 9,185
2010
(in millions of Korean won)Gain on
valuationLoss on
valuationGain on
transactionLoss on
transaction
Interest and principal swap 5,735 - 6,091 -
Interest rates swap - 1,401 - 227
Foreign currency forward contract - 230 - 1,480
Option contracts - 10,903 - 4,539
Embedded derivative instruments 68,864 - - -
74,599 12,534 6,091 6,246

Hynix Semiconductor Inc.Notes to Separate Financial StatementsDecember 31, 2011 and 2010, and January 1, 2010
76
39. Cash Generated from Operations
Reconciliations between operating profit and net cash inflow from operating activities for the years
ended December 31, 2011 and 2010, are as follows:
(in millions of Korean won) 2011 2010
Profit for the period before income tax 236,313 2,867,587
Adjustments
Defined benefits 85,592 69,370
Depreciation 2,011,372 1,796,137
Depreciation of investment properties 1,313 1,316
Amortization 64,957 18,436
Loss on foreign currency translation 80,816 19,774
Loss on disposal of assets held-for-sale 6,884 34,260
Impairment loss on property, plant and equipment 14,230 -
Impairment loss on intangible assets 728 350
Impairment loss on assets held-for-sale - 7,390
Impairment loss on available-for-sale financial assets 21,847 1,295
Impairment loss on equity investment in associates 10,637 -
Loss on disposal of property, plant and equipment 3,392 5,289
Loss on disposal of intangible assets 4,984 3,406
Loss on redemption of debenture - 27,266
Interest expenses 271,753 299,813
Gain on foreign currency translation (25,563) (85,446)
Gain on disposal of assets held-for-sale (6,440) (12,160)
Gain on disposal of Investments in subsidiaries, jointlycontrolled entities and associates
(1,166) -
Gain on disposal of property, plant and equipment (1,329) (26,711)
Gain on disposal of investment property (7,447) -
Gain on disposal of intangible assets (9,352) -
Interest income (56,402) (69,552)
Dividends income (8,882) (687)
Gain (loss) on derivative instruments (17,927) (61,910)
Others 949 1,187
Changes in operating assets and liabilities
Decrease(Increase) in trade receivables 16,540 (409,258)
Decrease(Increase) in loans and other receivables 1,391 (20,042)
Increase in inventories (2,436) (142,715)
Decrease(Increase) in other assets (22,858) 31,343
Decrease in trade payables (29,127) (75,562)
Increase(Decrease) in other payables (271,085) 111,720
Increase(Decrease) in other non-trade payables (186,495) 375,511
Decrease in provision (169,205) (101,185)
Increase(Decrease) in other liabilities 3,534 (64,133)
Payment of defined benefit liability (48,808) (47,757)
Cash Generated from Operations 1,972,710 4,554,332

Hynix Semiconductor Inc.Notes to Separate Financial StatementsDecember 31, 2011 and 2010, and January 1, 2010
77
40. Share-based Payments
The Company grants share options to directors and selected employees with approval of the
shareholders and the Board of Directors. As of December 31, 2011, details of the share options are as
follows:
Type of shares issued for the exercise of share options: Registered ordinary shares
Grant method: Distribute newly issued common shares
Exercisable condition: Over two years of employment after the grant dates
Details of the stock options which have been granted as of December 31, 2011, are as follows:
Number of sharesto be issued
Grant dates (thousands)Exercise price
Per shareExercise period
October 24, 2005 334 \ 22,800 Oct. 25, 2007~Oct. 24, 2012
Changes in details of share-based payments during the years ended December 31, 2011 and 2010,
are as follows:
(in millions of Korean won) 2011 2010
At January 1 5,762 5,769
Exercised/ Expired - (7)
At December 31 5,762 5,762
Changes in details of options and weighted-average exercisable prices during the years ended
December 31, 2011 and 2010, are as follows:
2011 2010
(in thousands of shares,except for price)
Weighted averageexercise price
OptionsWeighted average
exercise priceOptions
At January 1 \ 22,800 324 \ 22,655 327
Granted - - - -
Exercised - - 5,000 (3)
Expired - - - -
At December 31 \ 22,800 324 \ 22,800 324
The weighted average fair value of options was determined using the Black-Scholes valuation model.
The significant inputs into the model were weighted average share price at the grant date, exercise
price, volatility of share price, dividend yield, an expected option life and an annual risk-free interest
rate. For the year ended December 31, 2011, there is no expense recognized in the statement of
comprehensive income for share options granted to directors and employees.

Hynix Semiconductor Inc.Notes to Separate Financial StatementsDecember 31, 2011 and 2010, and January 1, 2010
78
41. Transition to Korean-IFRS
41.1 First-time Adoption of Korean-IFRS
The Company's transition date to Korean-IFRS is January 1, 2010, and adoption date is January 1,
2011.
In preparing separate financial statements in accordance with Korean-IFRS 1101(First-time Adoption
of Korean International Financial Reporting Standards), the Company has applied the mandatory
exceptions and certain optional exemptions allowed by Korean-IFRS.
41.2 Exemption Options under Korean-IFRS 1101
The Company elected to apply the following optional exemptions from full retrospective application.
(1) Business combinations
The Company elected to apply the exemption for business combinations allowed under Korean-IFRS
1101 and has not retrospectively applied Korean-IFRS 1103 to past business combinations that
occurred before the transition date.
(2) Fair value as deemed cost
The Company elected to use the revaluations of certain property, plant and equipment prior to the
date of transition to Korean-IFRS as deemed cost at the transition date.
The Company elected to measure certain property, plant and equipment at fair value as of the
transition date to Korean-IFRS and use that fair value as its deemed cost at that date as follows:
(in millions of Korean won)
Reported amount under previousK-GAAP
Adjusted amountFair value as of the
transition date
259,399 181,633 441,032
(3) Subsidiaries, associates, and joint ventures
Investments in subsidiaries, joint ventures, and associates are recognised at cost under the direct
equity method. Management applied the carrying amounts under the previous K-GAAP at the time of
first adoption of the Korean IFRS as deemed cost of investments.
41.3 Mandatory Exceptions to Retroactive Application of Other Korean-IFRS
Exceptions to other Korean-IFRS applied by the Company are as follows:
(1) Derecognition of financial assets
The Company applied the derecognition requirements in Korean-IFRS 1039, Financial Instruments:
Recognition and Measurement, prospectively for transfers of financial assets occurring on or after the

Hynix Semiconductor Inc.Notes to Separate Financial StatementsDecember 31, 2011 and 2010, and January 1, 2010
79
transition date. Where the Company had derecognized financial assets before the transition date in
accordance with previous K-GAAP, the Company did not recognizes these assets even when the
transfers did not meet the derecognition criteria under Korean-IFRS.
(2) Exception for estimates
The Company’s Korean-IFRS estimates at the transition date are consistent with the estimates as at
the same date made in accordance with previous K-GAAP (after adjustments to reflect any difference
in accounting policies), unless there is objective evidence that those estimates were in error.
41.4 Reconciliations between Previous K-GAAP and Korean-IFRS
Effects of Korean-IFRS adoption on the Company’s total assets, liabilities and equity, as of January 1,
2010, the date of Korean-IFRS transition, are as follows:
(In millions of Korean won) Total assets Total liabilities Total equityReported amount underprevious K-GAAP
13,424,767 7,972,385 5,452,382
Adjustments for:
Transfer of receivables1 471,562 471,562 -
Investments in associates2 43 - 43
Land revaluation4 181,633 - 181,633
Fair value measurement
and other5
4,389 197,461 (193,072)
Other long-term employee
benefit obligations6
- (49,205) 49,205
Recognition of deferred tax
liabilities of advanced
depreciation provision relating
previous revaluation8
(55,666) - (55,666)
Total adjustments 601,961 619,818 (17,857)
Adjusted amount underKorean-IFRS
14,026,728 8,592,203 5,434,525
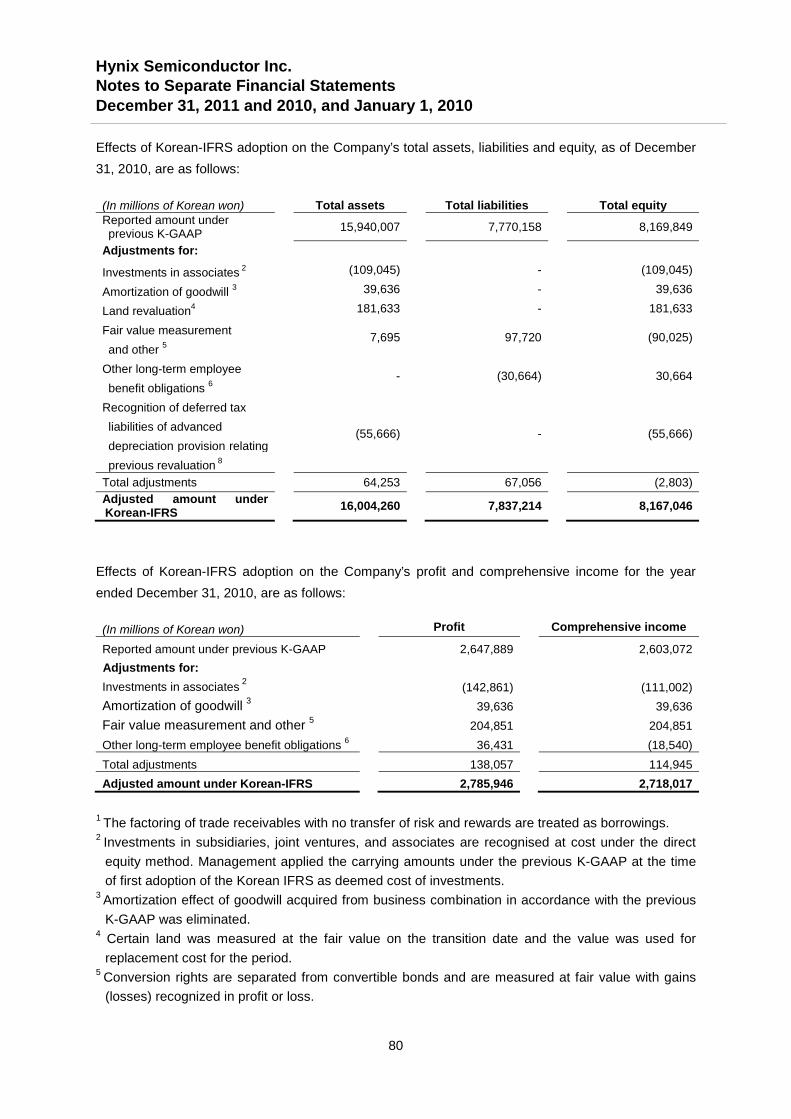
Hynix Semiconductor Inc.Notes to Separate Financial StatementsDecember 31, 2011 and 2010, and January 1, 2010
80
Effects of Korean-IFRS adoption on the Company’s total assets, liabilities and equity, as of December
31, 2010, are as follows:
(In millions of Korean won) Total assets Total liabilities Total equityReported amount underprevious K-GAAP
15,940,007 7,770,158 8,169,849
Adjustments for:
Investments in associates2 (109,045) - (109,045)
Amortization of goodwill3 39,636 - 39,636
Land revaluation4 181,633 - 181,633
Fair value measurement
and other5
7,695 97,720 (90,025)
Other long-term employee
benefit obligations6
- (30,664) 30,664
Recognition of deferred tax
liabilities of advanced
depreciation provision relating
previous revaluation8
(55,666) - (55,666)
Total adjustments 64,253 67,056 (2,803)
Adjusted amount underKorean-IFRS
16,004,260 7,837,214 8,167,046
Effects of Korean-IFRS adoption on the Company’s profit and comprehensive income for the year
ended December 31, 2010, are as follows:
(In millions of Korean won) Profit Comprehensive income
Reported amount under previous K-GAAP 2,647,889 2,603,072
Adjustments for:
Investments in associates2
(142,861) (111,002)
Amortization of goodwill3
39,636 39,636
Fair value measurement and other5
204,851 204,851
Other long-term employee benefit obligations6
36,431 (18,540)
Total adjustments 138,057 114,945
Adjusted amount under Korean-IFRS 2,785,946 2,718,017
1The factoring of trade receivables with no transfer of risk and rewards are treated as borrowings.
2Investments in subsidiaries, joint ventures, and associates are recognised at cost under the direct
equity method. Management applied the carrying amounts under the previous K-GAAP at the time
of first adoption of the Korean IFRS as deemed cost of investments.3Amortization effect of goodwill acquired from business combination in accordance with the previous
K-GAAP was eliminated.4
Certain land was measured at the fair value on the transition date and the value was used for
replacement cost for the period.5
Conversion rights are separated from convertible bonds and are measured at fair value with gains
(losses) recognized in profit or loss.

Hynix Semiconductor Inc.Notes to Separate Financial StatementsDecember 31, 2011 and 2010, and January 1, 2010
81
6Defined benefit liability is calculated by using an actuarial method and actuarial losses (gains) on
defined benefit liability is recognized in other comprehensive income (immediately recognized in
retained earnings). And other long-term employee benefit obligations are calculated by using an
actuarial method. Actuarial losses (gains) on other long-term employee benefit obligations are
recognized in profit or loss for the period.7Changes in total assets and liabilities due to changes in scope of consolidation
8Recognition of deferred tax liabilities of advanced depreciation provision relating previous revaluation
of lands unlikely to dispose of.
Effects on the cash flows
On adoption of Korean-IFRS, cash flows from interest received, interest paid, dividends received, and
income taxes paid, which had not been separated presented, are presented separately on the face of
the statement of cash flows. In order to accommodate the change, cash flows related to relevant
income/expenses, assets/liabilities have been adjusted.
Cash flows from operating and financing activities are adjusted due to certain transfers of trade
receivables that were derecognized under the previous K-GAAP but are treated as collateralized
borrowings under Korean-IFRS. Also, other Korean-IFRS transition effects are reflected on cash flows
where they have an effect on cash flows.
42. Event after the Reporting Period
On November 14, 2011, the Share Management Council and the Company entered into a share
purchase agreement with SK telecom Co., Ltd. In accordance with the terms of the agreement, SK
Telecom Co., Ltd., on February 14, 2012, purchased 44.25 million shares of the Company from the
Share Management Council and acquired newly issued 101.85 million shares of the Company
through an allotment to a third party. Consequently, SK Telecom Co., Ltd. acquired 146.1 million
shares of common stock of the Company, representing approximately 21.05% of the outstanding
common stock and became a largest shareholder of the Company. The special agreement with the
Share Management Council, explained in Note 37, is not valid anymore.

82
Report on Review of Internal Accounting Control System
To the President ofHynix Semiconductor Inc.
We have reviewed the accompanying management’s report on the operations of the Internal
Accounting Control System (“IACS”) of Hynix Semiconductor Inc. (the “Company”) as of December
31, 2011. The Company’s management is responsible for designing and operating IACS and for its
assessment of the effectiveness of IACS. Our responsibility is to review the management’s report on
the operations of the IACS and issue a report based on our review. The management’s report on the
operations of the IACS of the Company states that “based on its assessment of the operations of the
IACS as of December 31, 2011, the Company’s IACS has been designed and is operating effectively
as of December 31, 2011, in all material respects, in accordance with the IACS standards established
by the Internal Accounting Control System Operations Committee (IACSOC) of the Korea Listed
Companies Association.”
Our review was conducted in accordance with the IACS review standards established by the KoreanInstitute of Certified Public Accountants. Those standards require that we plan and perform, in allmaterial respects, the review of management’s report on the operations of the IACS to obtain a lowerlevel of assurance than an audit. A review is to obtain an understanding of a company’s IACS andconsists principally of inquiries of management and, when deemed necessary, a limited inspection ofunderlying documents, which is substantially less in scope than an audit.
A company’s IACS is a system to monitor and operate those policies and procedures designed toprovide reasonable assurance regarding the reliability of financial reporting and the preparation offinancial statements for external purposes in accordance with accounting principles generallyaccepted in the Republic of Korea. Because of its inherent limitations, IACS may not prevent or detecta material misstatement of the financial statements. Also, projections of any evaluation ofeffectiveness to future periods are subject to the risk that controls may become inadequate becauseof changes in conditions, or that the degree of compliance with the policies or procedures maydeteriorate.
Based on our review, nothing has come to our attention that causes us to believe that management’sreport on the operations of the IACS, referred to above, is not presented fairly, in all material respects,in accordance with the IACS standards established by IACSOC.
Our review is based on the Company’s IACS as of December 31, 2011, and we did not reviewmanagement’s assessment of its IACS subsequent to December 31, 2011. This report has beenprepared pursuant to the Acts on External Audit for Stock Companies in Korea and may not beappropriate for other purposes or for other users.
Samil PricewaterhouseCoopers
March 12, 2012

83
Report on the Operations of the Internal Accounting Control System
To the Board of Directors and Audit Committee of
Hynix Semiconductor Inc.
I, as the Internal Accounting Control Officer (“IACO”) of Hynix Semiconductor Inc. (“the Company”),
assessed the status of the design and operations of the Company’s internal accounting control
system (“IACS”) for the year ended December 31, 2011.
The Company’s management including IACO is responsible for designing and operating IACS. I, as
the IACO, assessed whether the IACS has been effectively designed and is operating to prevent and
detect any error or fraud which may cause any misstatement of the financial statements, for the
purpose of establishing the reliability of financial reporting and the preparation of financial statements
for external purposes. I, as the IACO, applied the IACS standard for the assessment of design and
operations of the IACS.
Based on the assessment on the operations of the IACS, the Company’s IACS has been effectively
designed and is operating as of December 31, 2011, in all material respects, in accordance with the
IACS standards.
January,19, 2012
Min Chul Kim, Internal Accounting Control Officer
Oh Chul Kwon, Chief Executive Officer or President


![OCT. 27. 2011 - · PDF fileOCT. 27. 2011 Sung-ki Park Hynix semiconductor Inc. •Prospects of Memory Market ... Challenges in DRAM Cell Transistor Cell Area [um2] Technology](https://img.dokumen.tips/doc/110x75/5a852bb57f8b9a14748bf0e4/oct-27-2011-27-2011-sung-ki-park-hynix-semiconductor-inc-prospects-of.jpg)